Active galactic nuclei ghosts: A systematic search for faded nuclei
Abstract
Physical processes such as re-ignition, enhancement, and fading of active galactic nuclei (AGN) are not entirely understood because the timeline of these events is expected to last many years. However, it is well known that the differences in the energy budget between AGN components, like the optical ionizing region and the mid-infrared (MIR) dust echoes, can be interpreted as a hint on AGN evolution. Here we present a catalog of 88 AGN candidates showing hints on the fading and rising of their activity in the nearby Universe. We use AGN scaling relations to select them from an initial sample of 877 candidates using publicly available optical, X-ray, and MIR luminosities. We then use the multi-wavelength information to discard sources contaminated with extranuclear emission and those with an X-ray luminosity not well corrected for absorption. We find that 96% of our candidates are fading sources. This result suggests a scenario where the Universe had its peak of AGN activity somewhere in the past and is dominated by a fading phase at the present time. Alternatively, the fading phase is longer than the rising phase, which is consistent with galaxy merger simulations. Around 50% of these fading candidates are associated with merging or interacting systems. Finally, we also find the existence of jets in 30% of these candidates and that the preferred AGN dust geometry is torus-like, instead of wind-like. Our results are compatible with the fading of nuclear activity, expected if they are in an inefficient state.
1 Introduction
Some of the most important questions in the active galactic nuclei (AGN) field are how and why AGN initiate or finish their activity. Understanding this behaviour plays a key role in the context of the supermassive black hole (SMBH) growth, which is linked to these active phases, and the evolution of the galaxies itself (see Hopkins & Quataert, 2010). Indeed, it is well known that the mass of the SMBH is linked to other properties of galaxies (e.g. Kormendy & Ho, 2013).
Despite its importance, little is known about it, with only a brief idea of the AGN ignition/fading process and/or the duration of the AGN phase. Marconi et al. (2004) suggested that this phase should last years spread in small duty cycles of years each (see also Novak et al., 2011; Schawinski et al., 2015; Shulevski et al., 2015). Under this context, the study of AGN duty cycle cannot be done without a proper classification of the stages of the AGN.
It has long been known that some AGN are accompanied by emission-line regions both narrow and broad (the so-called NLR and BLR). The NLR is a zone of ionized gas spanning galaxy scales or even larger. Such regions can trace the geometry of the ionizing radiation escaping from the AGN and the host galaxy, and at least implicitly can give hints to the AGN luminosity when this structure was created (Keel et al., 2017). Indeed, the difference in the energy budget between the accretion disk and the NLR can be interpreted as a hint on the AGN evolution. This is what is called the optical ionization echoes. In this way several fading AGN have been discovered by the Galaxy Zoo project (Lintott et al., 2008). A very well known example of a fading AGN discovered using this method is the Hanny’s Voorwerp near the spiral galaxy IC 2497 (Lintott et al., 2009; Keel et al., 2012). This object shows a NLR spanning a projected range from 15-35 kpc from the galaxy nucleus, that should have been produced by an AGN at least two orders of magnitude in bolometric luminosity higher than the nuclear luminosity. This indicates that the nucleus faded from a QSO-like luminosity to a modest Seyfert/LINER level within years. AGN showing this scenario have also been reported in the high redshift Universe by the discovery of 14 Lyman- blobs with weak AGN activity (e.g. Schirmer et al., 2016).
Extrapolating this line of thought, not only the NLR can trace these echoes of past activity but also other components could help to find changes on the AGN activity. Mid-infrared (MIR) wavelengths can be used to trace the MIR dust echoes because this emission is dominated by the obscuring dust located few parsecs away from the nucleus (Ramos Almeida & Ricci, 2017). Of course, the closer the structure to the accretion disk, the shorter is the timescale of the evolution. Thus, in a fading scenario, we would expect the bolometric luminosity required for the NLR to be higher than that required for the AGN dust, with the accretion disk current bolometric luminosity being the lowest among them. This idea has already been applied to the case of Arp 187 showing a clear decline of the nuclear activity (with over 103 times lower luminosity) in an estimated lapse of time of 104 years (Ichikawa et al., 2016; Ichikawa, 2018; Ichikawa et al., 2019). Ichikawa et al. (2019) claim that the nucleus of Arp 187 has already ceased its activity, with its NLR and jet being the evidence of the past activity. Despite its importance very few fading AGN have been reported so far. The largest compilation of them shows 20 AGN (see Table 2 presented by Ichikawa et al., 2019, and references therein). This technique could in principle not only detect fading AGN but also rising AGN, i.e., those AGN that show an increased accretion disk bolometric luminosity compared to the MIR dust echoes and the optical ionization echoes. Currently, the detection of rising-AGN candidates using only the NLR emissions is difficult because they may be indistinguishable from lack of gas for ionization echoes (Schawinski et al., 2015). In general terms, fading (rising) AGN show large-scale signatures of a prominent (weak) AGN process and small-scale signatures of a much weaker (stronger) AGN.
The purpose of this paper is to compile a sample of fading and rising AGN candidates using multi-wavelength information. The paper is organised as follows. In Section 2, we use individual scaling relations found in AGN to derive an initial sample of candidates using publicly available optical and MIR observations of AGN. This sample is further refined in Section 3 combining together accurate measurements of the disk, AGN dust, and NLR for the initial sample. In Section 4, we further explore the robustness of the selection of candidates using all available multi-wavelength information. We give a summary and discuss the main results in Section 5. Finally, main conclusions of the paper are presented in Section 6. Throughout this work we adopt H km s-1 Mpc-1 as cosmological parameter.
2 Scaling relations and initial sample
We look for rising/fading AGN using well known linear relations between signatures of several AGN components at different wavelengths. This assumes that a relation is found when the involved components are traced by the same bolometric luminosity. Objects showing values out of these relations imply different bolometric luminosities for each component, and therefore, being candidates to a long term evolution of the bolometric luminosity for the source.
2.1 The X-ray versus [OIII] 5007 luminosity relationship
We considered all sources classified as Seyferts reported by Berney et al. (2015) to explore the relationship between X-ray and [OIII] luminosities. This relation is of the form:
| (1) |
This relationship is well explored, showing a good behaviour from high- to low-luminous AGN (e.g. Ward et al., 1988; Panessa et al., 2006; González-Martín et al., 2009a). The X-ray luminosity traces the accretion disk associated with the current bolometric luminosity. The traces the NLR with a bolometric luminosity associated with this kpc-scale structure. Note also that the [OIII] emission parent ion recombines much more rapidly than almost any other (especially hydrogen recombination, whose timescale can be thousands of years in Extended Emission-Line Regions - EELR, Binette & Robinson, 1987). Meanwhile, the X-ray emission traces the nuclear source luminosity associated with pc scale structure or timescale of yr (Hawkins, 2007).
We used the optical and X-ray measurements reported by Berney et al. (2015). Their optical data are taken from the BAT AGN Spectroscopic Survey (BASS) Data Release 1 (Koss et al., 2017). The BASS catalog contains 67.6 of the total AGN detected in the Swift BAT 70-month catalog and has an average redshift of . The optical measurements were obtained using a combination of power law plus Gaussian components to fit the continuum and the emission lines, respectively. The flux uncertainty for the [O III] emission line is typically below 0.01 %. We use the intrinsic fluxes reported by them which were corrected for host galaxy extinction using the Balmer decrement (i.e. ). They corrected for extinction using the narrow Balmer line ratio assuming an intrinsic ratio of R = 3.1 (e.g. Ferland & Osterbrock, 1986) and the reddening curve provided by Cardelli et al. (1989). The 2-10 keV intrinsic fluxes are based on a homogeneous spectral fitting using the best available X-ray data with simultaneous fitting of the 0.2-10 keV band (from XMM-Newton, Chandra, or Swift/XRT) and the 14-195 keV band from Swift BAT (details in Ricci et al., 2017). Our sample contains 579 sources with [OIII] and X-ray measurements; one type BL LAC, 55 type-1, 107 type-1.2, 100 type-1.5, 96 type-1.9, and 220 type-2 AGN.
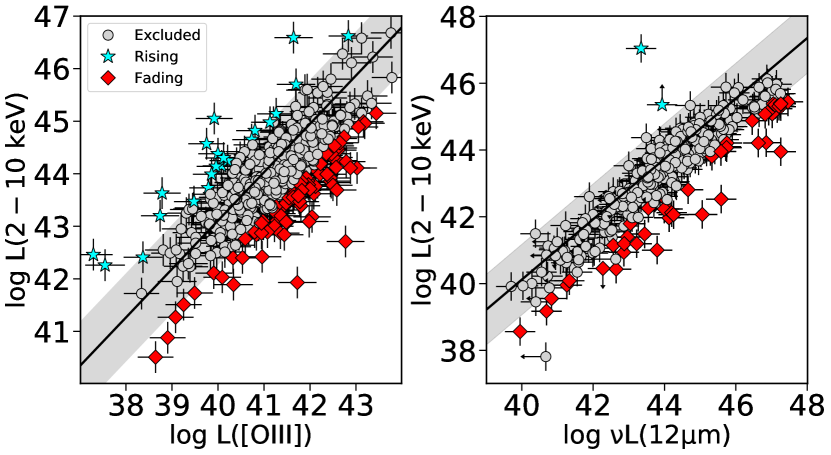
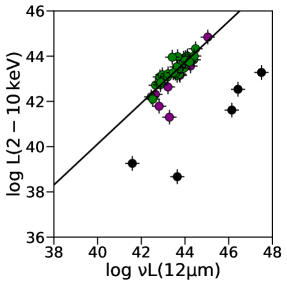
In order to minimize issues due to attenuation and/or obscuration of type-2 AGN, we define the slope and offset of this relationship (Eq. 1) using unobscured type-1 AGN only. The resulting relationship together with the data are shown in Fig. 1 (left panel). We obtained a slope of and an offset of , which are consistent with previous results. We selected rising/fading AGN as the sources that are located outside 2 from this relationship (shaded area in Fig 1). In total, we obtained 113 candidates using this criterion; 23 rising and 90 fading sources. Among them we found 69 type-1, 43 type-2, and one BL LAC111This source could have errors in the [OIII] line flux measurement. It will be discarded in the next section through other criteria..
2.2 MIR versus X-ray luminosity relationship
The X-ray versus MIR luminosity relationship is also a very well known scaling relation in AGN (Elvis et al., 1978; Glass et al., 1982; Krabbe et al., 2001; Lutz et al., 2004; Ramos Almeida et al., 2007) of the form:
| (2) |
It has been interpreted as a connection between the accretion disk and the dusty torus. Gandhi et al. (2009) reported and using a sample of 42 AGN, with a median and a range of MIR luminosities of . Posterior analysis have shown consistent values for these constants (e.g. Asmus et al., 2015). At the typical range scale of the dusty torus of pc, this structure traces the bolometric luminosity of the source roughly from 10 - 30 yr (Lyu et al., 2019). Thus, outliers in this relation might trace changes in shorter times scales than the X-ray versus [OIII] relation explained above.
We use all the sources reported in Asmus et al. (2015), which contains a catalog of 253 sources with ground-based MIR photometric data from several observatories (e.g. VIRIS/VLT, T-ReCS/Gemini, CanariCam/GTC, Michelle/Gemini). This sample contains AGN with MIR luminosities of and redshifts lower than . Asmus et al. (2014) mark sources as non-reliable for low count-rate observations, or AGN classified as Compton-thick obscured sources, for which X-ray observations with XMM-Newton, Suzaku, or NuSTAR were not available at the time of that publication. We do not exclude these sources to avoid losing potential candidates for fading/rising AGN activity. We further investigate the reliability of these candidates in Section 3.
We also added to the analysis the sources reported by Stern (2015), which includes several samples in order to compare with high-luminosity AGN (magnitude in the I band in the range ) and high redshift AGN (). Among these samples they include the mixed Fifth Data Release Sloan Digital Sky Survey/XMM-Newton Quasar Survey (SSDS DR5 Young et al., 2009), the Serendipitous Extragalactic X-ray Source Identification (SEXSI Harrison et al., 2003; Eckart et al., 2005, 2006, 2010) sample, the QSO sample from Just et al. (2007), and both Compton-thick and Compton-thin samples using NuSTAR data, with MIR luminosities from WISE, VLT/VISIR and Spitzer.
Note that the intrinsic (i.e. absorption corrected) 2-10 keV X-ray luminosities included in these samples are obtained from literature. We refer the reader to Asmus et al. (2015) and Stern (2015) for further details. We further explore in Section 4 if the line-of-sight absorption correction is robust, with particular attention to the Compton-thick nature of the sources to provide a more robust list of rising/fading AGN candidates.
Altogether, the sample we explore includes 419 AGN; 224 type-1 AGN, 123 type-2 AGN, 32 LINERS, 37 composite AGN, and three unclassified AGN. Among them, 253 sources come from the sample reported by Asmus et al. (2014) and 166 sources from the sample published by Stern (2015)). Fig. 1 (right panel) shows the MIR versus X-ray luminosities for the combined sample and the relation found by Gandhi et al. (2009). As in the previous section, we consider as rising/fading candidates AGN those sources outside of this relation at the 2- level. Note that, although two objects fall out of the relation, they have been excluded from the sample because the MIR luminosity is an upper-limit and therefore, they are consistent with being in the relation. In total, we obtained 49 sources: Two rising and 47 fading. Among them we found 17 type-1 and 18 type-2 AGN, 10 LINERs, and four composite AGN.
3 AGN fading/rising candidate sample
In summary, we select a total of 137 fading AGN and 25 rising AGN candidates using the two selection criteria explained in Section 2. Among them, one object was in common in both selection criteria. Therefore, our initial sample contains 161 candidates.
However, using only a single criterion is not enough to consider the candidate as secure. AGN are variable sources by definition. These variations are expected to occur throughout the entire electromagnetic spectrum. Inner components as the accretion disk are expected to vary in time scales of hours. Thus, random variations of the disk are expected to occur when compared to the torus or the NLR, without implying a consistent fading/rising scenario. These variations will reflect into the scaling relations above as scatter. Some of this scatter could be included in our sample of fading/rising candidate. Thus, the three AGN components should show consistent fading/rising behaviour of the bolometric luminosity for the AGN to be considered as a good candidate. For this reason we complete our compilation of X-ray, MIR, and [OIII] luminosities from literature. We only use corrected from reddening (mainly from SDSS) and the MIR luminosities are obtained from several catalogs at the 12, using as main search engine the Nasa Extragalactic Database (NED222http://ned.ipac.caltech.edu.) (e.g. Risaliti et al., 1999; Tran, 2003; Heckman et al., 2005; Goulding & Alexander, 2009; Lamastra et al., 2009; Noguchi et al., 2010; Jin et al., 2012; Berney et al., 2015). We complete the three luminosities for 110 objects. Among them, 58 are type-1 AGN and 52 are type-2 AGN.
Although we already had X-ray luminosities for all the candidates, we took particular care to look for X-ray luminosities fully corrected from obscuration along the line of sight. Indeed, uncorrected luminosities in moderate to highly obscured AGN (), could wrongly locate the object outside the scaling relations. This might overestimate the detection of fading AGN candidates. All the X-ray measurements used in previous section are intrinsic luminosities (i.e. corrected from obscuration). However, many of them rely on spectral analysis below 10 keV. This might wrongly estimate the intrinsic luminosity for Compton-thick AGN (with ). X-ray spectra with energies below 10 keV cannot be used to estimate the true value for the obscuration if that is above the Compton-thick limit (Comastri, 2004). In order to mitigate this effect, we look for obscuration measurements for all the objects, giving priority to the analysis where spectra above 10 keV is considered (e.g. NuSTAR or Suzaku). Most of them were obtained from Swift BAT 70-month catalog (Ricci et al., 2017). We also check for signatures of Compton-thickness reported in the literature and found the measurements for all but 35 objects. We also found archival NuSTAR data for 18 out of these 35 objects. The NuSTAR spectra were extracted using standard procedures and fitted to power-law model with partial covering to estimate the and X-ray intrinsic luminosity (see Appendix A for more details).
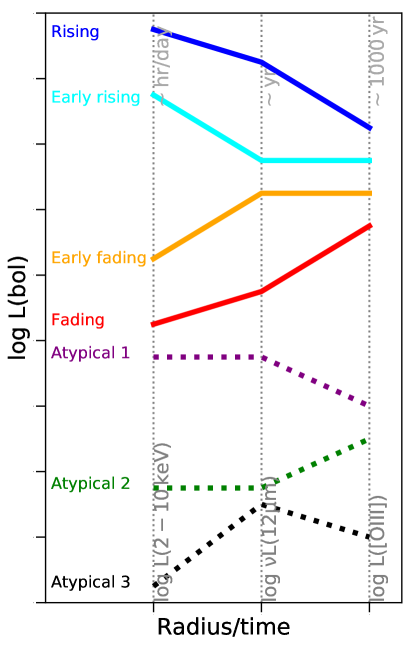
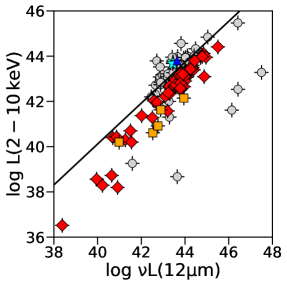
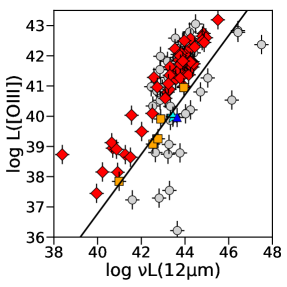
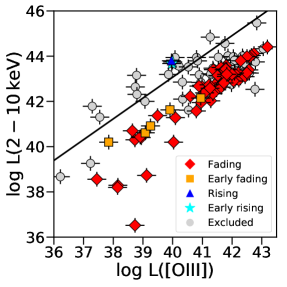
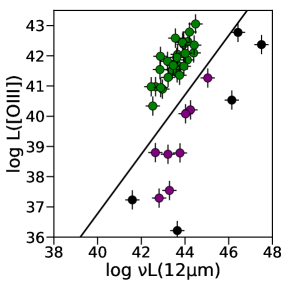
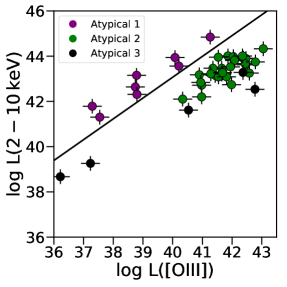
Fig. 2 shows the three scaling relations for our 110 fading/rising candidates: X-ray versus MIR luminosity (left), [OIII] versus MIR luminosity (center), and X-ray versus [OIII] luminosity (right). The scaling relations used in Section 2 are shown as a black continuous line in the left and right panels. Middle panel shows the expected relation combining the previous two relations. According to the position in this plot we classify most of the sources into four main categories (see top panels in Fig. 2):
-
•
Fading candidates (red diamonds): the three diagrams show an increase of the bolometric luminosity from the disk toward the torus and NLR (red line in Fig. 3 shows the estimated behavior of the bolometric luminosity for these sources). We found 53 objects belonging to this category.
-
•
Early fading candidates (orange squares): the object shows an increase of the bolometric luminosity from the disk toward the torus and from the disk toward the NLR. However, the bolometric luminosity obtained for the torus and NLR are consistent to each other (orange line in Fig. 3). Five objects belong to this category.
-
•
Rising candidates (blue triangle): the three diagrams show the object in a consistent decrease of bolometric luminosity from the disk toward the torus and the NLR (blue line in Fig. 3). Only one object belongs to this category.
-
•
Early rising candidates (cyan stars): the object shows a decrease of the bolometric luminosity from the disk toward the torus and from the disk toward the NLR. However, the bolometric luminosity obtained for the torus and the NLR are consistent to each other (cyan line in Fig. 3). Two objects belong to this category.
We keep early fading/rising candidates into the sample under the interpretation that these objects might be a premature fading/rising of the central source, still not clearly shown in the outskirts of the system. Note that the object is considered above/below the relation with , which is consistent with the systematic errors in these relations. Table 1 compiles the names and general information for these objects.
Among the 110 objects studied, 49 have been rejected on the basis of non expected behaviour on the set of X-ray, MIR, and [OIII] luminosities. Eight of these objects show a monotonic increase or decrease on the luminosities but this behaviour is inconclusive due to . Therefore, these eight sources are rejected. We classify the 41 remaining sources into three subcategories (see bottom panels in Fig. 2):
-
-
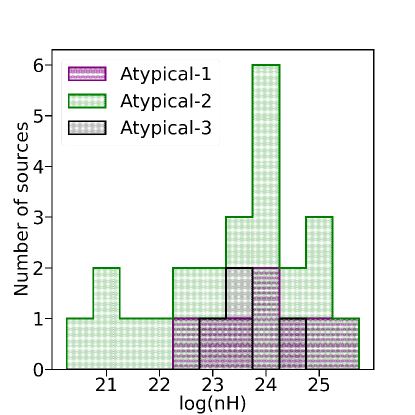
Atypical 1 (purple points): eight objects show a decrease on the bolometric luminosity between the disk and the torus and between the disk and the NLR. However, the torus shows similar bolometric luminosity compared to that of the disk, which might be inconsistent with the rising scenario (shown as dotted-purple line in Fig. 3).
-
-
Atypical 2 (green points): 28 objects show an increase of the bolometric luminosity associated with the NLR when compared to that of disk/torus that might indicate a fading of the source. However, there might not be a consistent fading scenario when it comes to the comparison between torus and disk bolometric luminosity (shown as dotted-green line in Fig. 3).
-
-
Atypical 3 (black points): five objects show an increase of the bolometric luminosity for the disk when compared to that of the torus and also for the disk compared to that of the NLR. However, there is a decrease on the bolometric luminosity of the NLR compared to that of the torus, which might be inconsistent with the fading scenario (shown as dotted-black line in Fig. 3).
These 41 candidates showing atypical behavior are included in Tab. 2.
4 Robustness of the fading/rising candidates
We further explore here fading, rising, and atypical candidates (102 objects) to investigate the robustness of the methodology using ancillary observations available for the sample.
4.1 AGN nature and [OIII] as tracer of the NLR
The absence of the accretion disk could be considered as an indication of the switch-off of the nucleus if the torus and/or NLR are still present. However, it could also indicate that the object does not harbor an AGN, which is a particularly relevant discussion for low-luminosity objects with . Indeed, 23 objects belong to this category among our candidates.
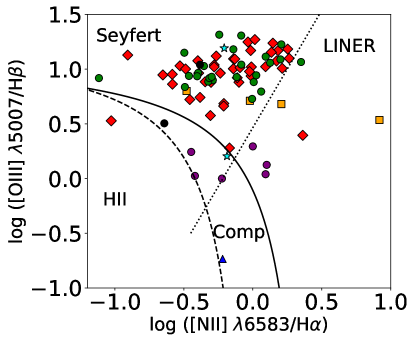
In order to study the AGN nature of these sources, Figure 4 shows the versus emission line ratios for 84 sources of our sample. This is a well known AGN diagnostic diagram firstly explored by Baldwin et al. (1981) (details on the construction of this diagram are included in Appendix B.1). We only found one object (Mrk 335, a fading candidate) not consistent with pure AGN according to the limit proposed by Kauffmann et al. (2003). However, this is a well-known and bright AGN from the X-ray point of view (e.g. Parker et al., 2019). Furthermore, other six objects are not consistent with pure AGN according to the demarcation proposed by Kewley et al. (2001). Among them ESO137G034 belongs to atypical 3, 2MASSX J024203810510061, Cen A, and NGC 3079 to atypical 1, 2MASSX J143911861415215 to early rising, and 2MASSX J085517462854218 to the rising class. This group is consistent with a composite behaviour of the source at optical wavelengths. Interestingly, two out of the three rising candidates are in this latter category. Note that the [OIII] line emission could be contaminated by star-forming processes for these seven objects. This would move the objects towards the left in Fig. 2 (right) and downwards in Fig. 2 (center). However, note that even if it were the case, both early rising and rising objects would still be classified as such, as they would still remain out of the expected correlations in Fig. 2. Some of the sources could be affected by lower metallicity than the “standard” ones used to set up the various versions of the BPT strong-line diagram, where AGN-ionized gas can masquerade as ionized by stars. Groves et al. (2006) show that the respective BPT models evaluations may return different metallicity values. If we consider models with 0.25 solar metallicty, all of our sources could be classified as AGN. However, in order to be conservative, we keep the AGN classification as that found when using solar metallicity which is the most restrictive classification.
Objects classified as atypical 1 (purple dots in Fig. 2) tend to locate at lower compared to other AGN in the sample. This is easily explained by large-scale extinction affecting the [OIII] line emission (see below and Fig. 5). Another reason for the contamination of the [OIII] emission might come from tidal tails seen after merging processes which in addition can cause scatter in the [OIII] scaling laws. However, we find that the vast majority of the sources () are located in the AGN area of the plot, supporting the AGN nature of them and the use of [OIII] as a tracer of the NLR.
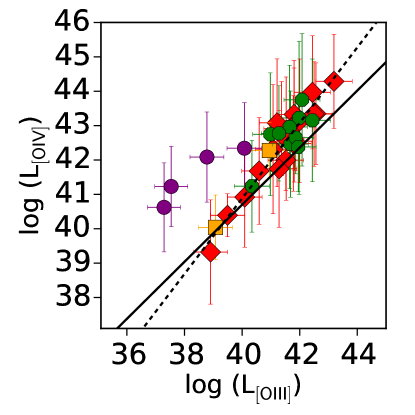
We can also compare the [OIII] with other tracers of the NLR to look for wrong estimates of the NLR bolometric luminosity. Fig. 5 shows the versus relation. Details on [OIV] flux measurements are given in Appendix B.2. We show the relation found for broad-line radio galaxies (BLRG) by Dicken et al. (2014) (black solid line). We also show the linear relation found using objects belonging to the fading category (black dashed line). Fading, early fading, and atypical 1 categories are consistent with the relation found for BLRG. Interestingly, the four atypical 1 objects (named NGC 612, NGC 3079, MCG +04-48-002, and Cen A) tend to show an excess of compared to the . This indicates that the [OIII] emission might be suffering from extinction ([OIV] emission is much less likely to suffer dust extinction than the optical forbidden lines). Indeed, all of them show column densities at X-rays with values and one of them is well within the Compton-thick regime. According to this, the might be a factor of 10 to 100 higher for the atypical 1 candidates (as Fig. 5 suggests). Therefore, they will move closer to the expected linear relations for AGN and we can safely remove atypical 1 from the raising/fading candidates.
4.2 X-ray luminosity as a proxy of the accretion disk bolometric luminosity
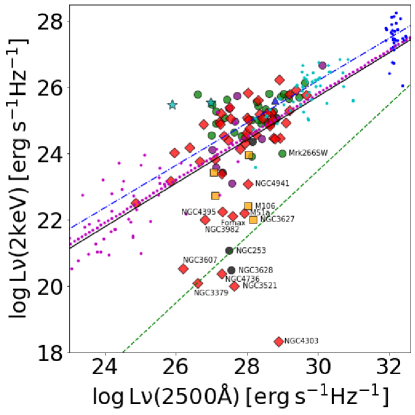
We explore here if the X-ray luminosity is a good tracer of the disk component by comparing it with optical/UV continuum emission where the peak of the disk luminosity occurs. For that purpose we compiled from NED the optical/UV continuum luminosity, Å), for the 102 candidates (see Col. 11 in Tabs. 1 and 2, respectively). Fig. 6 (left) shows Å) versus . Tananbaum et al. (1979) define a relationship between the rest-frame monochromatic luminosity of the form , which links the accretion disk emission to that of the hot corona emission. The upper allowed limit for this ratio is (green dashed line in Fig. 6, left) for high luminosity AGN (Martocchia et al., 2017). We also include, for comparison purposes, as blue, cyan, and magenta dots the data and their best-fit for high-luminosity (Just et al., 2007), intermediate-luminosity (Steffen et al., 2006), and low-luminosity AGN (Xu, 2011), respectively.
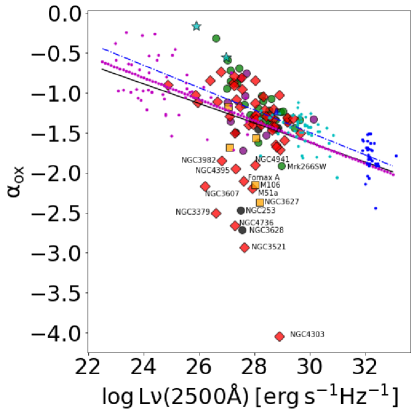
Fig. 6 (right) also shows the distribution of as a function of extinction-corrected 2500 Å monochromatic luminosity, Å). The black solid line is our best fit regression curve. In the left panel this linear relation is described by Å)+ , consistent with Eq. 4 from Xu (2011). Similarly to the left panel, we also include the linear regression found by Xu (2011), Just et al. (2007), and Steffen et al. (2006), respectively. Although a large number of objects are consistent with previously found relations, they show a wide range of in a narrow luminosity range.
We find an average . The range of Å) and , partially overlap with the sample presented by Xu (2011). Furthermore, the linear fit to our data (black solid line in Fig. 6, left) is = Å) + , which is quite similar to that found from Xu (2011) (see their Eq. 2). In our sample, 96% of the objects are consistent with the linear relation found. Interestingly, the two early rising candidates tend to locate above the linear relation (Fig. 6, left) and flat slopes (Fig. 6, right). These flat slopes might indicate a fundamental change of the accretion process, which might be associated with the rising scenario. However, it could also be interpreted as an over estimate of the accretion disk luminosity when using the X-ray emission. This would put back these two objects into the general correlations in Fig. 2. Under this interpretation, these two objects might not be good rising candidates after all. This X-ray emission sometimes has a non-negligible contribution from reprocessed material that should not be taken into account for the intrinsic disk luminosity. This could explain the slight excess of X-ray luminosity compared to the UV luminosity. Unfortunately, a detailed analysis of the intrinsic and reprocessed X-ray emission is not possible for these two sources due to the lack of high energy X-ray spectra. Only objects with high column densities, reaching the Compton-thick regime, are expected to have a large contribution of reflection component. This is indeed the case of NGC 1194, one of the two early rising candidates.
Four sources are significantly below the Å) versus relation, with values below (namely NGC 3521, NGC 4303, NGC 4736 and NGC 3628). González-Martín et al. (2009b) classified NGC 3628 as non-AGN at X-rays based on Chandra extended morphology, the lack of the iron emission line, and no radio jet found. Therefore, the extreme found for NGC 3628 could be due to the lack of AGN at the center. However, we analysed the NuSTAR spectrum of NGC 3628 (see Appendix A) finding a spectrum consistent with a mildly obscured AGN. Note, however, that this is a rather simplistic analysis and a reflection component has not been taken into account. The inclusion of such component might lead to different results. Indeed, Osorio-Clavijo et. al. (in prep.), analyse a sample of AGN with a complex model, accounting for a reflection component, finding for this particular source a significant reflection fraction (), without significant obscuration. González-Martín et al. (2009b) also classified NGC 4736 as AGN showing a compact X-ray, UV and optical morphology and a jet contributing to the radio emission. Indeed, we also found a jet-like structure in NGC 3521 while we classified the other three as diffuse emission (see discussion and Appendix C). BPT diagram in Fig. 4 confirms the AGN nature of NGC 3521, NGC 4303, and NGC 4736 (there are not available data for NGC 3628). An alternative explanation for the extreme discrepancy between Å) and in these four sources is that the X-ray luminosity is not well corrected from absorption along the line of sight. We compiled the column densities (and computed them in some particular cases, see Appendix A) preferring those where X-ray spectra include hard X-ray photons above 10 keV. The distribution of is reported in Fig. 7. The wrong estimate of the might explain the locus in Fig. 6 for NGC 3521, NGC 4303, and NGC 4736 because no spectra above is available for these three objects, and such energy range is necessary to discard that the sources are in the Compton-thick regime. Therefore, spectra in UV region and above either with Suzaku, NuSTAR, or future X-ray facilities are needed to confirm the fading nature of these three sources. It is certainly not the case for NGC 3628 where we correct the spectrum from its absorption thanks to NuSTAR (see Appendix A).
Although the other sources are within the standard range of , it is evident the scatter; it is large for Fornax A, M 51a, NGC 3379, NGC 3607, NGC 3627, Mrk 266SW, NGC 253, NGC 3982, M 106, NGC 4395, and NGC 4941 being well below the X-ray versus UV linear relation. The BPT diagram confirms the AGN nature of M 106, NGC 4395, NGC 4941, but there are not available data for the others. Among them, NGC 253, M 51a, MRK 266SW, and NGC 3982 are known AGN (see NED). Based on X-ray observations González-Martín et al. (2009b) classified NGC 3379, NGC 3607, and NGC 3627 as non-AGN. Interestingly, these three sources are right on the limit of (green dashed line in Fig. 6). Among these three objects, we find that NGC 3627 is consistent with a Compton-thick AGN using newly reported NuSTAR data, although the data are poor (see Table 3). No absorption measurements are reported for Fornax A or NGC 3379. Among the other eight sources, we found that four objects (M 51a, NGC 3982, M 106, and NGC 4941) show absorption above while three (NGC 253, MRK 266SW, and NGC 4395) do not seem to be obscured. No information is found for NGC 3607. Terashima et al. (2002) analysed the X-ray ASCA spectrum of NGC 3607 and did not find evidence that this sources could be classified as an AGN. In fact, Terlevich & Forbes (2002) suggested that X-ray emission of this source may be linked to stellar processes (see also Flohic et al., 2006). Therefore, we will discard this source. For the others, therefore, is not clear to us that obscuration might be responsible for a wrong estimation of the intrinsic luminosity of the disk. If that is ruled out, an intrinsic different accretion disk emission might be the reason of such low . Indeed, this has been argued for LLAGN for which has been proposed that the accretion disk might be intrinsically different. The most accepted model for these objects is a disk that heats and turns into an optically thin, geometrically thick inefficient accretion disk (i.e. an advection dominated accretion flow (ADAF), Narayan & Yi, 1995).

5 Summary and discussion
The aim of this paper is to provide a catalog of candidates for fading and rising AGN in the nearby Universe using multi-wavelength observations. For this purpose we started with the 579 and 419 AGN with [OIII] and MIR continuum fluxes from Berney et al. (2015) and Asmus et al. (2015); Stern (2015), respectively (121 objects in common). In both samples, we restricted to objects with . Altogether, the initial sample contains 877 nearby AGN, all of them with available X-ray luminosity.
The hypothesis behind this multi-wavelength comparison is that each luminosity is tracing a different component: the X-ray continuum is a tracer of the disk emission, MIR is a tracer of the AGN dusty torus, and [OIII] is a tracer of the NLR emission. Since each of them occupy a different spatial scale, they might trace recent (up to 3000 yr) changes on the bolometric luminosity of the system. This allowed us to select fading or rising candidates as those out of the known linear relations between X-ray versus [OIII] and X-ray versus MIR luminosities (see Section 2). Using this technique we selected 161 AGN fading/rising candidates.
We complemented [OIII], MIR, and X-ray luminosities (corrected from obscuration along the line-of sight) for 110 of these candidates to study the monotonic behaviour of the AGN activity. Among them, we discard eight sources because they were close to 2- from the linear relations in Fig. 1, remaining 102 candidates. We found that: 1) 53 objects are consistent with a fading scenario (called as fading); 2) five objects only show this fading scenario in the comparison between the X-ray and MIR luminosity but not when comparing MIR and [OIII] luminosities (called as early fading); 3) one object shows a monotonic increase of the bolometric luminosity between the three wavelengths (called rising); and 4) two objects show an increase of the bolometric luminosity between X-ray and MIR, but show consistent values with the linear relation between MIR and [OIII] luminosity (called early rising). We further explore more complex behaviours named atypical 1, atypical 2, and atypical 3, with eight, 28, and five objects belonging to these categories, respectively (see Section 3 and Fig. 3).
We also explored the robustness of the selection using available optical emission line diagnostics, MIR spectra, and UV continuum luminosity (see Section 4). Through these comparisons, we rule out six sources belonging to the category atypical 1 because the could be attenuated due to dust and a proper correction of the luminosity might discard them as fading candidates. Moreover, we also exclude from our statistics the other two objects belonging to the group atypical 1 because they do not show a consistent rising or fading scenario. We also discard NGC 3607, due to previous evidence that the nuclear emission could be associated with stellar processes. These seven sources are marked with dagger next to the name in all the tables. Although their nature might indicate abrupt changes on the disk luminosity, due to the complex behavior of the group atypical 3 (black dotted line in Fig. 3) we do not further discuss them here. However, the group called atypical 2 is kept within the fading candidates because they might be in a late stage of the fading phase (see below). Therefore, our bonafide sample includes 88 candidates (52 fading, 28 atypical-2, five early fading, one rising, and two early rising).
5.1 Comparison with reported candidates and caveats
Previously reported dying AGN are Arp 187 (Ichikawa, 2018) and NGC 7252 (Schweizer et al., 2013) while fading AGN are IC 2497 (Józsa et al., 2009), the Teacup Galaxy (also known as SDSS J143029.88+133912.0 Keel et al., 2012), Mkn 1498, NGC 5252, NGC 5972, SDSS J151004.01+074037.1, SDSS J220141.64+115124.3, UGC 7342, and UGC 11185 (Keel et al., 2017). We find that three (namely Mkn 1498, UGC 11185, and NGC 5252) out of these 11 sources were included initially among our samples in Section 2. However, none of the three are classified as fading AGN according to our criterion. They are selected by Keel et al. (2012) for having ionized cones of over 10 kpc; therefore, all of them show extended NLR. Thus, the first caveat in this methodology is that we might be missing fading type-2 AGN because the NLR emission is too extended to be included in the [OIII] fluxes presented in this work. However, note that 38 of the fading candidates are type-2 AGN (47% of the sample) while 42 are type-1 AGN (53%), as reported in the last column in Tables 4 and 5. Thus, we are not missing all type-2 AGN but probably only those with a very extended NLR.
Another caveat of this classification is that the accretion disk or the NLR signatures might be obscured (and not properly corrected) in our X-ray or [OIII] luminosity. However, we have used [OIV] emission line luminosity finding that, apart from the so-called atypical 1 class where the [OIII] might be attenuated, [OIII] and [OIV] emission lines seem to behave as expected in AGN (see Fig. 5).
Furthermore, we also explored X-ray versus UV continuum correlations to search for candidates highly obscured at X-rays. The obtained correlations of Å)) versus and Å)) are in agreement with previous work (Just et al., 2007; Xu, 2011). Thus, we rule out a wrong estimate of the intrinsic disk luminosity for the overall sample. However, the scatter of the sources is obvious and non negligible, with four extreme objects having -2.5 and 11 sources having . However, even for those sources, we did not find indications of a wrong estimate of the . Fig. 7 shows the distribution of when available for fading/rising AGN (left) and atypical AGN (right). Most of our sources are classified as obscured sources at X-rays (i.e. ). These measurements are taken from Swift/BAT or NuSTAR observations, ensuring that, even for Compton-thick AGN (i.e. with ), the X-ray luminosity is properly corrected from this attenuation.
We are capable of measuring recent (last 3000 yr for fading/rising and 30 yr for early fading/rising) luminosity changes. Another caveat to bare in mind is that large amplitude disk continuum variations might result in similar rise/fade of the nuclear signatures compared to the luminosity of the NLR or the dusty structure, as the ones presented here. However, in particular for the fading and rising candidates, this change must be sustained for a long period of time to produce a consistently decreasing/increasing behaviour on their luminosity. Indeed, in changing-look AGN with such long term disk-related changes has long been discussed (Matt et al., 2003). Despite systematic search for changing look QSOs candidates at distance beyond our parent samples (Graham et al., 2017; Rumbaugh et al., 2018; MacLeod et al., 2019), a few dozen Seyfert galaxies are known to have changed their optical spectral type. Here we present a compilation of objects belonging to this category: NGC 3516 (Collin-Souffrin et al., 1973), NGC 7603 (Tohline & Osterbrock, 1976; Kollatschny et al., 2000), NGC 4151 (Penston & Perez, 1984), Fairall 9 (Kollatschny & Fricke, 1985), NGC 2617 (Shappee et al., 2014), Mrk 590 (Denney et al., 2014), HE 1136-2304 (Parker et al., 2016), 1ES 1927+654 (Trakhtenbrot et al., 2019), IRAS 23226-3843 (Kollatschny et al., 2020), SDSSJ 095209.56+214313.3 (Komossa et al., 2008), Mrk 1018 (Noda & Done, 2018), and ESO 121-G006 (Annuar et al., 2020). Interestingly, only NGC 4151 is classified here as a fading candidate while seven (Fairall 9, NGC 3516, NGC 4151, NGC 7613, HE 1136-2304, Mrk 590, and Mrk 1018) out of these 11 were included within the 877 sources analysed in the initial sample of this paper. Based on dynamical, thermal, and viscous time-scales, Ichikawa et al. (2019) suggested that the luminosity changes in dying and changing-look AGN are likely based on the different physical mechanisms of the accretion disk. While changing-look AGN might be associated with thermal timescales corresponding to the disk cooling, dying AGN are more likely associated with the viscous timescale of the accretion process. To investigate if some of these candidates are indeed changing look AGN or persistent fading/rising of their AGN activity, follow-up observations are needed. This can allow us to study the long-term variations in order to try to characterize the plausible disappearance of broad lines within a few years through optical spectroscopy (as for instance Lawrence, 2018).
5.2 AGN components
Additional support of the fading stage of these sources comes from the analysis of the AGN components. Here we explore the AGN dust and jet. To study the AGN dust, we compiled Spitzer/IRS spectra available for 31 AGN discussed here333We compiled 38 Spitzer/IRS spectra, 31 among them are classified within the fading/rising and the atypical-2 classes. (see Tables 4 and 5). We decompose the spectra into AGN dust and circumnuclear contributors (i.e., stellar and interstellar medium). For the AGN dust we used a set of five available models in the literature (see Appendix B.2 for more details). Among the 22 objects where the AGN dust dominates (15 classified as fading, one as early fading, and six as atypical 2) the torus-like morphology is preferred against the disk-wind in our sample, with only between 3 objects preferring the latter (five if we add two that are equally fitted with either a torus-like geometry or the disk+wind model). This result is opposite to that found for nearby AGN by González-Martín et al. (2019), where the largest percentage of good fits is obtained for the clumpy disk+wind model by Hönig & Kishimoto (2017).
AGN radio lobes are also analysed to look for the AGN aging, through the study of the kinematic jet age of the radio lobes (e.g. Ichikawa et al., 2019). Although, we leave the kinematic jet age estimates for a subsequent analysis, we explore here if these jets, as long standing signatures of past activity, are present within our sample of candidates. We found that among all the sources with available radio images (a total of 61 available radio images and 55 within the secure sample of fading/rising of activity), the percentage of clear Linear sources is . We characterized the radio morphology of fading, rising and atypical objects (see Col. 9 in Tables 1 and 2) after looking for radio images in the literature (see Appendix C for more details). This percentage is very large considering that the percentage of local AGN showing powerful radio jet has been measured to be of the order of 0.1% (rising up to 10%, for high redshift quasars, Blandford et al., 2019). Moreover, considering that half of the Compact sources could show, after performing deeper and more sensitive radio observations, a Linear morphology (hence, showing the presence of a radio jet), this percentage of radio jets within our sample should be considered as a lower limit. This suggests that relativistic jets are produced in the centre of a large portion of these (mostly) AGN fading candidates.
Both the lack of outflows and the presence of radio jets are expected in the fading phase of nuclear activity, at least in the context of BH X-ray binaries. When they enter into a burst, they evolve into two distinct states along their duty cycle, known as hard and soft states. The hard state occurs at the beginning and at the end of the burst, while the soft state is associated with the most efficient accretion rate along the burst. In the soft state there is a weak or non-existent core jet and a strong accretion disk wind. On the other hand, the hard state is associated with a powerful, quasi-steady jet linked to the initial rise and fade of the transient event (Fender & Belloni, 2012; Fender & Muñoz-Darias, 2016, and references therein). Therefore, both in the rising or fading stages of the duty cycle, jets are expected and winds/outflows are lacking.
Further support of the lack of winds and the launch of jets within the low accretion AGN state comes from theory. During this stage, SMBHs may switch to a different accretion mode, characterized by a corona of low accretion rate and low-radiative efficiency (radiatively inefficient accretion flows models, RIAFs Narayan, 2005). Thus, the geometrically thin and optically thick disk might not be present along this AGN stage. The funnels in the geometrically thick toroidal-RIAFs are invoked as a plausible mechanism for collimating the jet (Nagar et al., 2002). Furthermore, under the wind model, a minimal accretion rate is required to produce a minimal column density to detect the outflows (Elitzur & Netzer, 2016). Therefore, the lack of dusty winds in our sample might be the manifestation of the lack of accretion power to sustain the wind/outflow activity. Note, however, that our sample covers a wide range in X-ray luminosity, indicating that this might not be as simple as a luminosity threshold. Indeed, theoretical studies show that the existence of these winds might rely on the particular configuration of the wind (Elitzur & Ho, 2009; Elitzur & Netzer, 2016). Our results are consistent with this framework.
5.3 Implications on the duty cycle of AGN
Altogether, we found 85 fading candidates (including fading, early fading, and atypical 2) and 3 rising candidates among the 877 nearby analyzed sources. Most of them are Seyfert nuclei with only 8 LINERs (see Tables 4 and 5). Thus, we find () of fading (rising) AGN in the local Universe. Statistically speaking, this might imply that one tenth of the AGN duty cycle of activity (10 Myr) is spent in this fading phase (Hopkins et al., 2005). This cycle can be explained as the activation of the nuclear accretion towards the SMBH due to a merger process or strong disk instabilities. Interestingly, roughly half of the sample (40 of these 88 sources) are associated with pairs, groups, or systems with multiple objects (e.g. galaxy clusters). Thus, we would expect to see a prevalence for elliptical galaxies. However, among these 41 sources, we do not see a preference for any morphological type (12 elliptical/S0/irregulars and 28 spiral galaxies).
Under the merger event, the gas supplied will be 100 times larger than that needed to efficiently feed the SMBH. Thus, the rising phase is expected to happen quickly. This might explain the very few objects found in the rising phase in this analysis. Then, the SMBH growth continues while gas suppliers start to skimp, until the gas is depleted and the duty cycle ends (Hopkins, 2012). Thus, the fading phase is expected to last longer than the rising phase, as statistically found in this paper.
Alternatively, the lack of rising AGN in our sample, might be a natural consequence of the switch off of the star-formation and AGN activity at the present time as a result of gas-rich mergers occurred in the past (Hopkins et al., 2008). The star-formation rate density peaked approximately 3.5 Gyr after the Big Bang, at z (known as cosmic noon), and declined exponentially at later times (see Madau & Dickinson, 2014, for a review). Studies at higher redshift might help to corroborate this hypothesis studying the fraction of rising and fading AGN at the peak of the star-forming activity.
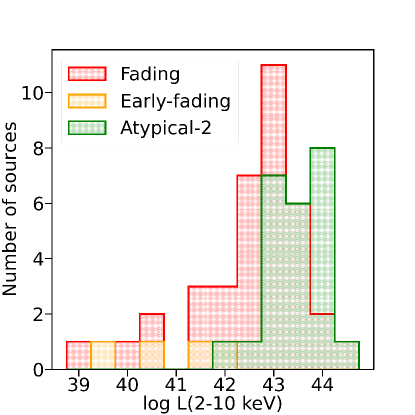
If the fading phase is long enough we might expect to see different stages along it. Interestingly, we could see at least three categories: early fading, fading, and atypical 2. Most of these sources are nicely classified as AGN in the BPT diagram (see Fig. 4), placed in the [OIV] versus [OIII] emission line luminosity relation (see Fig. 5), neglecting extinction to be affecting these three classes. The fading AGN category contains 52 AGN showing a monotonically increase of AGN bolometric luminosity, with a lower value for the disk and larger values for the torus and the NLR. Five objects belong to the early fading class, showing disk bolometric luminosity lower than that inferred from the torus/NLR but with the torus and the NLR with compatible bolometric luminosity. We think that in these five sources the fade of the nuclear activity is more recent than that of AGN fading candidates so the outer parts of the AGN have not adjusted yet to the current fading of the AGN accretion disk (named here early fading). Moreover, 28 objects belonging to the category atypical 2 are consistent with a late fading phase, where the disk and torus are consistent with the same bolometric luminosity but the NLR still reflects a larger bolometric luminosity.
Interestingly, these three classes of sources show slightly different average bolometric luminosity of the disk. To illustrate this, Fig. 8 shows the histogram of X-ray luminosity for these three categories. The early fading, fading, and atypical 2 (late fading) classes show different average disk luminosity, where atypical 2 show the lowest luminosity, fading candidates show intermediate luminosity, and early fading candidates show the highest. This is also consistent with the idea that these three classes are indeed stages of the same evolutionary track towards the AGN activity switch off.
6 Conclusions
We have found a bonafide sample of 88 candidates (out of 877 AGN) of rising or fading of the AGN activity in the nearby Universe using AGN scaling relations. In particular, we explored the MIR versus X-ray and the [OIII] versus X-ray relations. We selected fading/rising candidates as those out of these relations. We also used multi-wavelength information (mainly optical BPT, the UV luminosity, and the MIR spectrum) to explore sources contaminated by extra-nuclear emission, X-ray luminosity not well corrected from absorption in highly obscured AGN, and non AGN powered sources.
Around 10% of our initial sample presents a fading/rising scenario. Furthermore, the vast majority of these candidates () are fading sources. This may be explained if the Universe had its peak of activity back in the past, currently dominated by the AGN activity switch off. Alternatively, this might indicate that the fading phase is longer than the rising phase. The current sample of fading candidates might be missing type-2 AGN because the NLR emission is extended. The large amplitude disk continuum variations might also result in similar rise/fade of the nuclear signatures compared to the luminosity of the NLR or the dusty structure, perhaps including some changing look AGN. Follow-up observations are needed in order to confirm these candidates.
We found that these (mostly) fading candidates are placed within merging or interacting systems. We also found that among our sample, of our AGN had a clear evidence for the existence of a linear radio source (jet) which is higher than that estimated in the nearby Universe. Moreover, we also found a prevalence of AGN dust associated with torus-like geometries rather than outflows. The lack of outflows and the presence of radio-jets are expected in the fading phase of nuclear activity. In fact, King et al. (2011) suggests that large-scale outflows may persist for as long as 100 Myr after a powerful AGN episode fades (see also Zubovas & King, 2014).
Acknowledgments
We thank to the anonymous referee for his/her useful comments. This research has made use of the NASA/IPAC Extragalactic Database (NED) which is operated by the Jet Propulsion Laboratory, California Institute of Technology, under contract with the National Aeronautics and Space Administration. This work is based in part on observations made with the Spitzer Space Telescope, which is operated by the Jet Propulsion Laboratory, California Institute of Technology under a contract with NASA. This research is mainly funded by the UNAM PAPIIT project IA103118 (PI OG-M). DE-A, NO-C, CV-C, and UR-A acknowledge support from a CONACYT scholarship.
| Name | RA | Dec | z | candidate | radio | hubty | env | |||||
|---|---|---|---|---|---|---|---|---|---|---|---|---|
| class | morph. | 2500 Å | ||||||||||
| (1) | (2) | (3) | (4) | (5) | (6) | (7) | (8) | (9) | (10) | (11) | (12) | (13) |
| Mrk 335 | 00h06m19.52s | 20d12m10.5s | 0.0351 | 44.34 | 43.5 | 41.63 | Fading | Compact | 20.48 | 44.27 | E | – |
| J00430184+3017195 | 00h43m01.87s | 30d17m19.6s | 0.0441 | 44.08 | 43.07 | 41.77 | Fading | – | 22.30 | 41.86 | – | – |
| Mrk 359 | 01h27m32.55s | 19d10m43.8s | 0.0167 | 43.29 | 42.68 | 40.89 | Fading | Compact | 20.61 | 43.04 | S0 | group |
| NGC 1068 | 02h42m40.71s | -00d00m47.8s | 0.0032 | 43.79 | 42.82 | 41.72 | Fading | Linear4 | 24.95 | 43.07 | Sb | group |
| Fornax A | 03h22m41.72s | -37d12m29.6s | 0.0043 | 41.26 | 40.3 | 38.73 | Fading | Diffuse3 | – | 42.67 | S0 | pair |
| IRAS 04124-0803 | 04h14m52.67s | -07d55m39.9s | 0.0382 | 44.21 | 43.27 | 42.22 | Fading | – | – | 43.09 | – | – |
| Mrk 618 | 04h36m22.24s | -10d22m33.8s | 0.0356 | 44.39 | 43.4 | 41.73 | Fading | Compact | – | 43.76 | SBb | – |
| LEDA 097068 | 05h02m58.22s | 22d59m51.8s | 0.0577 | 44.79 | 43.98 | 42.50 | Fading | – | – | 44.27 | E | – |
| IRAS 05218-1212 | 05h24m06.50s | -12d09m59.6s | 0.049 | 44.26 | 43.39 | 42.56 | Fading | – | – | 43.44 | E | – |
| Mrk 6 | 06h52m12.25s | 74d25m37.5s | 0.0222 | 43.81 | 43.25 | 42.08 | Fading | Linear6 | 20.76 | 42.62 | S0-a | pair |
| Mrk 79 | 07h42m32.80s | 49d48m34.7s | 0.0316 | 44.25 | 43.43 | 41.79 | Fading | Linear6 | – | 43.75 | Sb | – |
| Mrk 10 | 07h47m29.13s | 60d56m00.6s | 0.0292 | 43.84 | 43.13 | 41.53 | Fading | Compact | 20.53 | 44.16 | SABb | – |
| Mrk 1210 | 08h04m05.86s | 05d06m49.8s | 0.0135 | 43.72 | 43.15 | 41.52 | Fading | Compact | 23.40 | 42.31 | S? | – |
| IRAS 09149-6206 | 09h16m09.39s | -62d19m29.9s | 0.0573 | 44.96 | 43.95 | 42.59 | Fading | – | * | 44.74 | – | – |
| Mrk 704 | 09h18m26.01s | 16d18m19.2s | 0.0292 | 44.25 | 43.4 | 41.83 | Fading | Compact | * | 43.63 | S0-a | group |
| M 81 | 09h55m33.17s | 69d03m55.1s | 0.0008 | 41.50 | 38.8 | 38.64 | Fading | Diffuse1 | * | 39.94 | Sab | triple |
| 3C 234.0 | 10h01m49.52s | 28d47m09.0s | 0.1849 | 45.50 | 44.41 | 43.19 | Fading | Linear7 | 23.51 | 43.98 | – | – |
| NGC 3227 | 10h23m30.58s | 19d51m54.2s | 0.0043 | 43.09 | 42.22 | 40.59 | Fading | Diffuse1 | 20.95 | 41.03 | SABa | pair |
| ESO 317-G038 | 10h29m45.61s | -38d20m54.8s | 0.0151 | 43.20 | 41.58 | 40.80 | Fading | – | 23.41 | 42.37 | SBa | – |
| NGC 3379 | 10h47m49.59s | 12d34m53.8s | 0.003 | 40.22 | 38.29 | 38.15 | Fading | Compact | – | 41.68 | E | triple |
| NGC 3521 | 11h05m48.58s | -00d02m09.1s | 0.0027 | 40.92 | 38.20 | 38.14 | Fading | Linear8 | – | 42.71 | SABb | - |
| ESO 438-G009 | 11h10m48.00s | -28d30m03.8s | 0.0219 | 43.95 | 42.65 | 40.99 | Fading | – | * | 43.83 | SBab | – |
| NGC 3607† | 11h16m54.64s | 18d03m06.3s | 0.0032 | 40.65 | 38.73 | 39.12 | Fading | Compact | – | 41.28 | E-S0 | pair |
| PG 1138+222 | 11h41m16.16s | 21d56m21.8s | 0.0632 | 44.44 | 43.80 | 42.29 | Fading | Compact | – | 43.40 | Sab | – |
| NGC 3982 | 11h56m28.13s | 55d07m30.9s | 0.0048 | 41.55 | 40.2 | 40.03 | Fading | Compact | * | 41.90 | SABb | group |
| UGC 07064 | 12h04m43.32s | 31d10m38.2s | 0.0247 | 43.78 | 42.59 | 41.26 | Fading | Diffuse2 | 22.59 | 42.54 | SBb | triple |
| NGC 4151 | 12h10m32.58s | 39d24m20.6s | 0.0023 | 42.58 | 42.03 | 41.28 | Fading | Linear4 | 22.71 | 42.18 | Sab | pair |
| Mrk 766 | 12h18m26.51s | 29d48m46.3s | 0.0129 | 43.57 | 42.73 | 41.23 | Fading | Compact | 20.32 | 42.43 | SBa | pair |
| NGC 4303 | 12h21m54.90s | 04d28m25.1s | 0.0052 | 38.38 | 36.52 | 38.73 | Fading | Diffuse1 | – | 43.96 | Sbc | pair |
| NGC 4395 | 12h25m48.86s | 33d32m48.9s | 0.0009 | 40.87 | 40.43 | 38.91 | Fading | Diffuse1 | 21.04 | 42.39 | Sm | multiple |
| J123212.3-421745 | 12h32m11.83s | -42d17m52.2s | 0.1009 | 44.85 | 44.12 | 42.74 | Fading | – | – | 44.46 | – | – |
| LEDA 170194 | 12h39m06.29s | -16d10m47.1s | 0.0360 | 43.54 | 42.95 | 42.23 | Fading | – | 22.76 | 43.14 | S0 | – |
| NGC 4736 | 12h50m53.06s | 41d07m13.6s | 0.0011 | 39.95 | 38.56 | 37.45 | Fading | Diffuse1 | – | 42.37 | SABa | group |
| NGC 4748 | 12h52m12.46s | -13d24m53.0s | 0.0142 | 43.30 | 42.34 | 41.36 | Fading | Compact | – | 42.87 | S? | – |
| NGC 4941 | 13h04m13.14s | -05d33m05.8s | 0.0040 | 42.50 | 41.28 | 40.09 | Fading | Linear6 | 23.72 | 43.11 | SABa | group |
| NGC 4939 | 13h04m14.39s | -10d20m22.6s | 0.0105 | 43.24 | 42.38 | 41.08 | Fading | Diffuse1 | 23.29 | 41.46 | Sbc | group |
| MCG-03-34-064 | 13h22m24.46s | -16d43m42.5s | 0.0199 | 44.34 | 43.59 | 41.80 | Fading | Linear6 | 23.80 | 42.59 | S0 | |
| M 51a | 13h29m52.71s | 47d11m42.6s | 0.0018 | 40.69 | 40.4 | 38.94 | Fading | Diffuse1 | * | 43.01 | SABb | pair |
| ESO 509-G038 | 13h31m13.90s | -25d24m10.0s | 0.0263 | 43.78 | 42.51 | 41.48 | Fading | – | * | 43.02 | S0-a | – |
| NGC 5283 | 13h41m05.76s | 67d40m20.3s | 0.0103 | 42.73 | 41.95 | 40.96 | Fading | Linear4 | 23.15 | 41.74 | S0 | – |
| NGC 5273 | 13h42m08.34s | 35d39m15.2s | 0.0038 | 42.02 | 41.37 | 39.49 | Fading | Compact | 20.59 | 40.93 | S0 | pair |
| Mrk 463 | 13h56m02.87s | 18d22m19.5s | 0.0503 | 44.88 | 43.10 | 42.44 | Fading | Linear9 | 23.57 | 43.74 | Sc | – |
| Mrk 477 | 14h40m38.10s | 53d30m15.9s | 0.0377 | 43.97 | 43.26 | 42.50 | Fading | Compact | 23.52 | 43.51 | S0 | pair |
| IC 4518A | 14h57m41.18s | -43d07m55.6s | 0.0163 | 43.57 | 42.66 | 41.22 | Fading | – | 23.36 | 44.00 | Sc | multiple |
| Mrk 1392 | 15h05m56.55s | 03d42m26.3s | 0.0356 | 43.98 | 43.10 | 41.81 | Fading | Compact | * | 43.70 | SBcd | group |
| J15462424+6929102 | 15h46m24.33s | 69d29m10.0s | 0.0376 | 43.72 | 43.08 | 41.86 | Fading | Linear2 | 23.49 | 42.33 | – | – |
| J16531506+2349431 | 16h53m15.05s | 23d49m43.0s | 0.1031 | 44.80 | 44.03 | 42.65 | Fading | Compact | 23.27 | 43.11 | E | – |
| Fairall 49 | 18h36m58.29s | -59d24m08.6s | 0.0201 | 44.17 | 43.40 | 41.37 | Fading | – | 22.03 | 42.34 | E-S0 | – |
| J19373299-0613046 | 19h37m33.01s | -06d13m04.8s | 0.0103 | 43.48 | 42.77 | 41.44 | Fading | – | 20.85 | 43.32 | E | – |
| MCG+02-57-002 | 22h23m45.02s | 11d50m09.0s | 0.0294 | 43.31 | 42.63 | 41.64 | Fading | Diffuse2 | – | 43.86 | Sb | – |
| Mrk 915 | 22h36m46.50s | -12d32m42.6s | 0.0239 | 43.77 | 43.20 | 42.00 | Fading | Compact | * | 43.79 | Scd | triple |
| MCG+01-57-016 | 22h40m17.05s | 08d03m14.1s | 0.0249 | 43.87 | 43.04 | 41.78 | Fading | Compact | – | 43.72 | SBa | – |
| NGC 7469 | 23h03m15.62s | 08d52m26.4s | 0.0139 | 43.90 | 43.2 | 41.82 | Fading | Diffuse4 | 20.53 | 43.13 | Sa | pair |
| NGC 3627 | 11h20m14.96s | 12d59m29.5s | 0.0024 | 40.98 | 39.5 | 37.84 | Early Fading | Diffuse1 | * | 43.25 | Sb | pair |
| NGC 4051 | 12h03m09.61s | 44d31m52.8s | 0.0031 | 42.89 | 41.63 | 39.91 | Early Fading | Diffuse1 | * | 42.14 | SABb | group |
| M 106 | 12h18m57.50s | 47d18m14.3s | 0.0016 | 42.53 | 40.61 | 39.08 | Early Fading | Diffuse5 | 23.00 | 43.10 | Sbc | pair |
| NGC 5033 | 13h13m27.47s | 36d35m38.2s | 0.0028 | 42.76 | 40.91 | 39.25 | Early Fading | Diffuse1 | – | 42.18 | Sc | group |
| NGC 7130 | 21h48m19.52s | -34d57m04.5s | 0.0161 | 43.95 | 42.15 | 40.95 | Early Fading | Compact | 24.00 | 43.12 | Sa | pair |
| NGC 1194 | 03h03m49.11s | -01d06m13.5s | 0.0131 | 43.44 | 43.67 | 39.97 | Early Rising | Linear6 | 24.33 | 40.98 | S0a | multiple |
| J14391186+1415215 | 14h39m11.87s | 14d15m22.0s | 0.0717 | 43.45 | 43.74 | 40.00 | Early Rising | – | 22.40 | 42.06 | E | – |
| J08551746-2854218 | 08h55m17.47s | -28d54m21.4s | 0.073 | 43.64 | 43.80 | 39.96 | Rising | – | 21.95 | 43.87 | – | – |
Note. — The sources removed in section 5 are marked with a dagger next to the name in Col.(1). Asterisks alongside the value represent those objects with a wrong column density estimate, for which a further analysis was carried on (see Appendix A1), Dashes refer to as those objects with no information. Col (11). Logarithmic of luminosity (erg/s) at 2500 Å. Data from the main search engine the Nasa Extragalactic Database (NED). References: 1-Condon (1987); 2-Smith et al. (2016); 3-Fomalont et al. (1989); 4-Kukula et al. (1995); 5-Hummel et al. (1985); 6-Schmitt et al. (2001);7-Hardcastle et al. (1997);8-Hummel et al. (1987);9-Ulvestad et al. (1981).
| Name | RA | Dec | z | candidate | radio | hubty | env | |||||
|---|---|---|---|---|---|---|---|---|---|---|---|---|
| class | morph. | 2500 Å | ||||||||||
| (1) | (2) | (3) | (4) | (5) | (6) | (7) | (8) | (9) | (10) | (11) | (12) | (13) |
| NGC 612† | 01h33m57.74s | -36d29m35.7s | 0.0301 | 44.02 | 43.94 | 40.08 | Atypical 1 | Linear 1 | 23.99 | 42.79 | S0-a | multiple |
| J02420381+0510061† | 02h42m03.80s | 05d10m06.1s | 0.0711 | 44.25 | 43.56 | 40.21 | Atypical 1 | – | 23.50 | 42.58 | – | – |
| J04440903+2813003† | 04h44m09.01s | 28d13m00.7s | 0.0107 | 43.22 | 42.64 | 38.74 | Atypical 1 | – | 22.65 | 43.50 | Sb | – |
| PKS 0558-504† | 05h59m47.38s | -50d26m52.4s | 0.1372 | 45.04 | 44.85 | 41.26 | Atypical 1 | – | * | 45.20 | – | – |
| NGC 3079† | 10h01m57.80s | 55d40m47.2s | 0.0036 | 43.29 | 41.30 | 37.54 | Atypical 1 | Diffuse2 | 25.10 | 42.66 | SBc | pair |
| Cen A† | 13h25m27.62s | -43d01m08.8s | 0.00086 | 42.82 | 41.79 | 37.29 | Atypical 1 | Linear3 | 23.02 | 42.20 | S0 | pair |
| ESO 097-G013† | 14h13m09.950s | -65d20m21.20s | 0.00094 | 42.64 | 42.31 | 38.80 | Atypical 1 | – | 24.40 | 42.10 | Sb | pair |
| MCG+04-48-002† | 20h28m35.06s | 25d44m00.0s | 0.0139 | 43.77 | 43.16 | 38.78 | Atypical 1 | – | 23.86 | 42.73 | Sd | pair |
| MCG-07-03-007 | 01h05m26.82s | -42d12m58.3s | 0.0302 | 43.75 | 43.47 | 41.36 | Atypical 2 | – | 24.18 | 42.21 | Sa | – |
| MCG+08-03-018 | 01h22m34.43s | 50d03m18.0s | 0.0202 | 43.66 | 43.98 | 42.04 | Atypical 2 | – | 24.24 | 41.68 | Sc | – |
| NGC 526A | 01h23m54.39s | -35d03m55.9s | 0.0188 | 43.46 | 43.27 | 41.68 | Atypical 2 | – | 22.01 | 42.45 | S0 | multiple |
| NGC 1229 | 03h08m10.79s | -22d57m38.9s | 0.0357 | 43.42 | 43.96 | 41.54 | Atypical 2 | – | 24.94 | 44.25 | SBbc | multiple |
| J03305218+0538253 | 03h30m52.18s | 05d38m25.6s | 0.046 | 43.94 | 43.62 | 42.46 | Atypical 2 | Compact | – | 43.38 | – | – |
| CGCG 420-015 | 04h53m25.75s | 04d03m41.7s | 0.0294 | 44.11 | 44.01 | 41.86 | Atypical 2 | Linear4 | 24.14 | 43.69 | E | – |
| Mrk 3 | 06h15m36.36s | 71d02m15.1s | 0.0132 | 43.89 | 43.67 | 42.44 | Atypical 2 | Linear5 | 24.07 | 42.10 | S0 | pair |
| Mrk 78 | 07h42m41.73s | 65d10m37.5s | 0.037 | 44.01 | 43.82 | 42.08 | Atypical 2 | Linear6 | 24.11 | 42.51 | – | – |
| J09172716-6456271 | 09h17m27.21s | -64d56m27.1s | 0.0859 | 43.94 | 43.91 | 42.38 | Atypical 2 | – | 21.41 | 44.02 | – | – |
| ESO 374-G044 | 10h13m19.91s | -35d58m57.7s | 0.0284 | 43.95 | 43.47 | 41.65 | Atypical 2 | – | 23.71 | 43.83 | Sab | – |
| NGC 3393 | 10h48m23.46s | -25d09m43.4s | 0.0138 | 42.87 | 42.74 | 41.98 | Atypical 2 | Linear4 | 24.50 | 42.08 | SBa | group |
| ESO 265-G023 | 11h20m48.01s | -43d15m50.4s | 0.0565 | 44.40 | 43.84 | 42.09 | Atypical 2 | – | – | 44.26 | E | pair |
| Mrk 1310 | 12h01m14.36s | -03d40m41.1s | 0.0191 | 42.65 | 42.72 | 40.98 | Atypical 2 | – | ¡ 20* | 42.91 | E | – |
| Mrk 205 | 12h21m44.22s | 75d18m38.8s | 0.0708 | 44.13 | 43.90 | 42.47 | Atypical 2 | Compact | * | 44.53 | – | – |
| J12313717-4758019 | 12h31m37.16s | -47d58m02.0s | 0.028 | 43.64 | 43.15 | 41.43 | Atypical 2 | – | 20.59 | 43.64 | SABb | – |
| NGC 4507 | 12h35m36.63s | -39d54m33.3s | 0.0117 | 43.62 | 43.53 | 41.95 | Atypical 2 | – | 23.95 | 43.59 | Sab | group |
| ESO 323-32 | 12h53m20.32s | -41d38m08.3s | 0.0160 | 42.96 | 43.18 | 40.90 | Atypical 2 | – | 24.79 | 43.86 | S0-a | group |
| Mrk 783 | 13h02m58.84s | 16d24m27.5s | 0.067 | 44.42 | 44.01 | 42.35 | Atypical 2 | Compact | 20.78 | 44.10 | E | – |
| NGC 5135 | 13h25m44.06s | -29d50m01.2s | 0.0148 | 43.22 | 43.22 | 41.28 | Atypical 2 | Ambig.∗∗ | * | 43.21 | Sab | pair |
| Mrk 266SW | 13h38m17.31s | 48d16m32.0s | 0.0287 | 42.45 | 42.2 | 40.98 | Atypical 2 | – | ¡ 20* | 44.06 | Sab | pair |
| TOLOLO 00113 | 13h54m15.41s | -37d46m33.2s | 0.0508 | 44.21 | 43.75 | 42.79 | Atypical 2 | – | 22.91 | 43.34 | – | – |
| NGC 5643 | 14h32m40.74s | -44d10m27.9s | 0.0026 | 42.52 | 42.10 | 40.34 | Atypical 2 | Linear7 | 25.40 | 43.20 | Sc | – |
| MCG-01-40-001 | 15h33m20.71s | -08d42m01.9s | 0.0227 | 43.56 | 43.25 | 42.58 | Atypical 2 | – | 22.73 | 43.50 | Sb | – |
| CGCG 367-009 | 16h19m19.26s | 81d02m47.6s | 0.0230 | 42.85 | 43.09 | 41.54 | Atypical 2 | – | 23.02 | 43.47 | – | – |
| NGC 6232 | 16h43m20.24s | 70d37m57.1s | 0.0148 | 42.89 | 42.84 | 40.95 | Atypical 2 | – | 24.94 | 42.72 | Sa | group |
| LEDA 214543 | 16h50m42.73s | 04d36m18.0s | 0.0322 | 43.20 | 43.09 | 41.82 | Atypical 2 | – | 22.58 | 42.21 | E | – |
| J21090996-0940147 | 21h09m09.97s | -09d40m14.7s | 0.0265 | 43.74 | 43.21 | 41.66 | Atypical 2 | – | 21.20 | 43.40 | S0 | – |
| J21140128+8204483 | 21h14m01.18s | 82d04m48.3s | 0.084 | 44.48 | 44.33 | 43.05 | Atypical 2 | Linear8 | * | 44.70 | – | – |
| NGC 253† | 00h47m33.12s | -25d17m17.6s | 0.0008 | 41.59 | 39.26 | 37.23 | Atypical 3 | Diffuse2 | ¡ 20* | 46.53 | SABc | group |
| NGC 3628† | 11h20m16.97s | 13d35m22.9s | 0.0028 | 43.65 | 38.67 | 36.22 | Atypical 3 | Diffuse2 | * | 42.63 | SBb | group |
| ESO 137-G034† | 16h35m14.11s | -58d04m48.1s | 0.0077 | 46.42 | 42.54 | 42.77 | Atypical 3 | – | 24.30 | 43.22 | SABa | group |
| ESO 234-G050† | 20h35m57.88s | -50d11m32.1s | 0.0087 | 46.14 | 41.62 | 40.53 | Atypical 3 | – | 23.08 | 42.39 | E | – |
| ESO 234-IG063† | 20h40m15.74s | -51d25m47.1s | 0.05395 | 47.50 | 43.28 | 42.37 | Atypical 3 | – | 23.41 | 43.91 | – | multiple |
Note. — Columns as in Table1. References: 1-Morganti et al. (1993); 2-Condon (1987);3-Burns et al. (1983);4-Schmitt et al. (2001);5-Ulvestad & Wilson (1984);6-Ulvestad et al. (1981);7-Morris et al. (1985);8-Lara et al. (2001). **the source NGC 5135 is classified as Ambiguous in Ulvestad & Wilson (1989); indeed, from the image we could not identify a clear sign of Linear or Diffuse feature.
Appendix A NuSTAR archival observations
We find in the sample, that 35 objects do not present a reliable obscuration measurement (those marked with an asterisk or hyphen in Col.10 in Tables 1 and 2). Out of the 35, we searched in the NuSTAR archive and found observations for 18 objects: PKS 0558-504, NGC 253, IRAS 09149-6206, Mrk 704, M 81, ESO 438-G009, Mrk 1392, Mrk 915, NGC 4051, NGC 3982, ESO 509-G038, J21140128+8204483, Mrk 1310, Mrk 205, Mrk 266SW, NGC 5135, NGC 3627, and NGC 3628. We extracted the spectra using standard procedures, by using the analysis software NuSTARDAS v.1.4.4, with a 60 arcsec extraction radius in all cases.
We fit the spectra with a single power-law with partial covering absorber, accounting for Galactic absorption as well. We find significant absorption in all but three sources (for which column (4) in Tab. 3 is marked with hyphen). In the case of NGC 252, Mrk 704, and NGC 5135, we also add the Fe K line at 6.4 keV. In table 3 we show the values found for , and intrinsic luminosity in the 3-10 keV band, in all cases.
| Name | ||||
|---|---|---|---|---|
| (1) | (2) | (3) | (4) | (5) |
| PKS0558-504* | ||||
| NGC253 | ||||
| IRAS09149-6206 | ||||
| Mrk704 | ||||
| M81 | ||||
| ESO438-G009 | ||||
| Mrk1392 | ||||
| Mrk915 | ||||
| NGC4051 | ||||
| NGC3982 | ||||
| ESO509-G038 | ||||
| J21140128+8204483 | ||||
| Mrk1310 | ||||
| Mrk205 | ||||
| Mrk266SW | ||||
| NGC5135 | ||||
| NGC3627 | ||||
| NGC3628 | ||||
| M51 |
Appendix B Multi-wavelength diagnostic
B.1 Optical diagnostic
To create the Baldwin, Phillips & Telervich (BPT) diagrams Baldwin et al. (1981), we compile the reddened corrected fluxes available measurements of the [O III] Å, [N II] Å, H and H emission lines presented in Swift BAT 70-month catalog (Koss et al., 2017). In Tables 4 and 5 we include these optical emission line fluxes for the accepted fading/rising and atypical candidates, respectively.
B.2 Infrared diagnostic
We convert IRS/Spitzer spectra into X-ray spectral fitting package XSPEC (Arnaud, 1996) format using flx2xsp task within HEASOFT444https://heasarc.gsfc.nasa.gov. Following the technique developed by González-Martín et al. (2009a), we fit each spectrum using four baseline models:
| (B1) | |||||
| (B2) | |||||
| (B3) | |||||
| (B4) |
where component is the foreground extinction by dust grains (Pei, 1992). The and components consider circumnuclear components such as the interstellar medium and stellar population of years and solar metallicity. These components were taken from Smith et al. (2007) and Bruzual & Charlot (2003), respectively. Finally, the corresponds to the smooth by Fritz et al. (2006) [F06], clumpy by Nenkova et al. (2008) [N08] and Hönig & Kishimoto (2010) [H10], the two phase (clumpy and smooth) by Stalevski et al. (2016) [S16] torus models, and the clumpy disk-wind model by Hönig & Kishimoto (2017) [H17] designed to describe the IR AGN emission. We compute the statistics throughout the analysis to find the absolute minimum for each parameter as the best fit. We then use f-statistics to test whether the inclusion of the stellar (eq. B2), ISM (eq. B3), and/or the stellar+ISM (eq. B4) components significantly improves the simpler model when f-test probability is below . If several models describe equally well the data (according to the statistics and using the Akaike criteria (see Eqs. 5-7 by Emmanoulopoulos et al., 2016)) we include both models as feasible representation of the data. We provide good spectral fitting ( for all but one object (Mrk 1210).
The range that covers the Spitzer spectra allows us to measure the [OIV] line. Therefore, we compiled the [OIV] fluxes at 25.9 for the 38 objects observed with Spitzer and available at the Combined Atlas of Sources with Spitzer IRS Spectra (CASSIS555https://cassis.sirtf.com). We compute the emission-line flux by fitting a Gaussian above the continuum. Tables 4 and 5 include the [OIV] luminosities when available for accepted and atypical candidates, respectively. Among them, two, 19, 10, one, and six are early fading, fading, atypical-2, atypical-3, and atypical-1, respectively.
Appendix C Radio morphology
We search the radio images available in the literature of the 102 sources considered in Section 3. Among the 61 bona fide candidates, we found radio images for 46 targets, while for the remaining 15, no radio images were available. Among the 41 atypical candidates, we found only 15 radio images. All the radio data we collected have been obtained using the Jansky Very Large Array (JVLA) at different frequencies from low-frequency L band (1.4 GHz) to high-frequency K band (22 GHz) and using different configurations of the interferometer array. Therefore, the angular resolution of the images ranges in a broad interval from tens to one arcseconds. We are aware that this huge range of available angular resolutions of the different observations could result in an uncertain morphological classification (e.g., extended emission that could be resolved out at higher angular resolution); new radio observations with equal observational set up for all the sources would be appropriate to eliminate this uncertainty. Therefore, we suggest taking this classification as a first hint. The classification we adopted is described as follows:
-
•
Compact source: a point-like object with unresolved radio emission;
-
•
Linear source: an object showing elongated, jet-like feature;
-
•
Diffuse source: an object showing extended, rounded emission feature.
The morphological classification together with the relative references for the Linear and Diffuse images are available in Col. 9 at Tables 1 and 2. The images found in the literature for the Linear and Diffuse sources are collected in Figs. 9 and 10.
| Optical | Mid-infrared | Classification | ||||||||
|---|---|---|---|---|---|---|---|---|---|---|
| Name | model | AGN/Stellar/ISM | ||||||||
| [ W m-2] | [] | [] | ||||||||
| (1) | (2) | (3) | (4) | (5) | (6) | (7) | (8) | (9) | (10) | (11) |
| Mrk 335 | S1.2 | |||||||||
| J00430184+3017195 | S2 | |||||||||
| Mrk 359 | S1.5 | |||||||||
| NGC 1068 | S2 | |||||||||
| Fornax A | L2 | |||||||||
| IRAS 04124-0803 | S1 | |||||||||
| Mrk 618 | S1 | |||||||||
| LEDA 097068 | S1 | |||||||||
| IRAS 05218-1212 | 43.4 1.5 | H17 | 85.8/ 0.0/ 14.2 | 0.36 | 0.5 | S1 | ||||
| Mrk 6 | S1.5 | |||||||||
| Mrk 79 | S1.2 | |||||||||
| Mrk 10 | 42.6 1.8 | N08 | 94.3/ 5.7/ 0.0 | 0.31 | 0.5 | S1.2 | ||||
| Mrk 1210 | 42.1 1.0 | H17 | 81.8/ 1.7/ 16.5 | 1.83 | 0.5 | S1 | ||||
| IRAS 09149-6206 | S1 | |||||||||
| Mrk 704 | S1.2 | |||||||||
| M 81 | L1.8 | |||||||||
| 3C 234.0 | 44.24 1.3 | F06 | 92.2/ 2.9/ 5.0 | 0.37 | 0.5 | S1 | ||||
| NGC 3227 | 41.7 1.6 | N08 | 51.0/3.3/45.7 | 1.29 | 0.5 | S1.5 | ||||
| ESO 317-G038 | S2 | |||||||||
| NGC 3379 | L2 | |||||||||
| NGC 3521 | L2 | |||||||||
| ESO 438-G009 | S1.5 | |||||||||
| NGC 3607† | L2 | |||||||||
| PG 1138+222 | S1 | |||||||||
| NGC 3982 | S2 | |||||||||
| UGC 07064 | S1.9 | |||||||||
| NGC 4151 | 41.7 1.8 | N08 | 95.9/ 4.1/ 0.0 | 0.98 | 0.5 | S1.5 | ||||
| Mrk 766 | S1.5 | |||||||||
| NGC 4303 | S2 | |||||||||
| NGC 4395 | 39.3 1.5 | N08 | 72.7/ 4.0/ 23.4 | 0.69 | 0.5 | S1.8 | ||||
| J123212.3-421745 | S1.5 | |||||||||
| LEDA 170194 | - | S2 | ||||||||
| NGC 4736 | S2 | |||||||||
| NGC 4748 | S1 | |||||||||
| NGC 4941 | 40.9 1.5 | N08 | 100.0/ 0.0/ 0.0 | 0.44 | 0.7 | S2 | ||||
| NGC 4939 | 42.3 1.8 | N08 | 90.7/ 3.3/ 6.0 | 0.85 | 0.5 | S2 | ||||
| MCG-03-34-064 | 43.3 1.6 | circumnuclear contribution | S1.8 | |||||||
| M 51a | S2 | |||||||||
| ESO 509-G038 | S1 | |||||||||
| NGC 5283 | S2 | |||||||||
| NGC 5273 | 40.2 0.5 | F06 | 100.0/0.0/0.0 | 0.23 | 0.5 | S1.9 | ||||
| Mrk 463 | 43.9 1.6 | S16 | 83.3/ 4.4/ 12.3 | 0.70 | 0.1 | S2 | ||||
| Mrk 477 | 43.3 1.5 | circumnuclear contribution | S1 | |||||||
| IC 4518A | 43.07 1.9 | circumnuclear contribution | S2 | |||||||
| Mrk 1392 | 43.0 1.73 | N08 | 91.7/ 2.4/ 5.9 | 0.68 | 0.5 | S1.8 | ||||
| H17 | 77.5/ 1.5/ 21.0 | 0.67 | 0.5 | |||||||
| J15462424+6929102 | S1.9 | |||||||||
| J16531506+2349431 | S2 | |||||||||
| Fairall 49 | 42.96 1.4 | N08 | 66.4/ 6.1/ 27.5 | 1.21 | 0.5 | S2 | ||||
| J19373299-0613046 | S1 | |||||||||
| MCG+02-57-002 | S1.5 | |||||||||
| Mrk 915 | 43.1 1.7 | N08 | 75.1/ 4.1/ 20.8 | 0.48 | 0.5 | S1 | ||||
| MCG+01-57-016 | 42.5 1.3 | N08 | 62.2/ 4.7/ 33.1 | 1.00 | 0.5 | S1.8 | ||||
| NGC 7469 | 42.5 0.84 | circumnuclear contribution | S1.2 | |||||||
| NGC 3627 | S2 | |||||||||
| NGC 4051 | S1.5 | |||||||||
| M 106 | 40.0 0.9 | N08 | 86.1/ 2.5/ 11.4 | 0.25 | 0.5 | L1.9 | ||||
| NGC 5033 | S1.9 | |||||||||
| NGC 7130 | 42.2 0.8 | circumnuclear contribution | L1.9 | |||||||
| NGC 1194 | S1.9 | |||||||||
| J14391186+1415215 | S1 | |||||||||
| J08551746-2854218 | S2 | |||||||||
Note. — Column (1): Source name; Columns (2 - 5): optical fluxes obtained from Swift BAT 70-month catalog (Ricci et al., 2017), which were used in the BPT diagram (Fig. 4). All the fluxes are in units of W m-2. Column (6): [OIV] luminosity; Columns (7-10) Best-fit results per object. Column (7) Models used to fit the data: F06: [Fritz06]; N08: [Nenkova08]; S16: [Stalev16]; and H17: [Hoenig17].Column (8) includes the percentage contribution to the waveband per component (A: AGN; S: stellar; and I: ISM); Column (9) the reduced (); Column (10) color excess for the foreground extinction E(B-V); Column (11) is the classification retrieved from Hyperleda, NED and in a few cases, from Ichikawa et al. (2017).
| Optical | Mid-infrared | Classification | ||||||||
|---|---|---|---|---|---|---|---|---|---|---|
| Name | model | AGN/Stellar/ISM | ||||||||
| [ W m-2] | [] | [] | ||||||||
| (1) | (2) | (3) | (4) | (5) | (6) | (7) | (8) | (9) | (10) | (11) |
| NGC 612† | 42.3 1.3 | circumnuclear contribution | S2 | |||||||
| J02420381+0510061† | - | - | - | - | - | S2 | ||||
| J04440903+2813003† | - | - | - | - | - | S2 | ||||
| PKS 0558-504† | S16 | 84.2/4.6/11.1 | 0.46 | 0.5 | S1 | |||||
| NGC 3079† | 41.2 1.2 | circumnuclear contribution | L2 | |||||||
| Cen A† | 40.6 1.3 | circumnuclear contribution | S2 | |||||||
| ESO 097-G013† | circumnuclear contribution | S2 | ||||||||
| MCG+04-48-002† | 42.0 1.2 | circumnuclear contribution | S2 | |||||||
| MCG-07-03-007 | - | - | - | - | - | S2 | ||||
| MCG+08-03-018 | - | - | - | - | - | S2 | ||||
| NGC 526A | 42.4 1.5 | H17 | 100.0/0.0/0.0 | 0.20 | 0.3 | S1.5 | ||||
| H10 | 94.8/ 5.2/ 0.0 | 0.29 | 0.3 | |||||||
| NGC 1229 | - | - | - | - | - | S2 | ||||
| J03305218+0538253 | - | - | - | - | - | S1 | ||||
| CGCG 420-015 | 42.7 1.1 | H17 | 84.5/0.0/15.5 | 0.38 | 0.0 | S2 | ||||
| Mrk 3 | 43.1 1.8 | circumnuclear contribution | S2 | |||||||
| Mrk 78 | 43.7 1.9 | N08 | 82.9/3.6/13.5 | 0.82 | 0.5 | S2 | ||||
| J09172716-6456271 | - | - | - | - | - | S2 | ||||
| ESO 374-G044 | 42.9 1.7 | H17 | 87.6/0.0/12.4 | 1.00 | 0.0 | S2 | ||||
| N08 | 97.2/ 2.8/ 0.0 | 1.14 | 0.5 | |||||||
| NGC 3393 | 43.2 2.2 | N08 | 82.3/2.0/15.8 | 0.99 | 0.5 | S2 | ||||
| ESO 265-G023 | - | - | - | - | - | S1 | ||||
| Mrk 1310 | - | - | - | - | - | S1 | ||||
| Mrk 205 | - | - | - | - | - | S1 | ||||
| J12313717-4758019 | - | - | - | - | - | S1 | ||||
| NGC 4507 | 42.4 1.3 | N08 | 83.2/4.7/12.1 | 0.99 | 0.5 | S2 | ||||
| ESO 323-32 | - | - | - | - | - | L2 | ||||
| Mrk 783 | - | - | - | - | - | S1.5 | ||||
| NGC 5135 | 42.8 1.4 | circumnuclear contribution | S2 | |||||||
| Mrk 266SW | 42.7 1.8 | circumnuclear contribution | L2 | |||||||
| TOLOLO 00113 | - | - | - | - | - | S1.9 | ||||
| NGC 5643 | 41.2 1.3 | circumnuclear contribution | S2 | |||||||
| MCG-01-40-001 | - | - | - | - | - | S2 | ||||
| CGCG 367-009 | - | - | - | - | - | S2 | ||||
| NGC 6232 | - | - | - | - | - | S2 | ||||
| LEDA 214543 | - | - | - | - | - | S2 | ||||
| J21090996-0940147 | - | - | - | - | - | S1.2 | ||||
| J21140128+8204483 | - | - | - | - | - | S1 | ||||
| NGC 253† | - | - | - | - | - | S2 | ||||
| NGC 3628† | circumnuclear contribution | L2 | ||||||||
| ESO 137-G034† | - | - | - | - | - | S2 | ||||
| ESO 234-G050† | - | - | - | - | - | S2 | ||||
| ESO 234-IG063† | - | - | - | - | - | S2 | ||||
Note. — Columns descriptions as in Table 4.
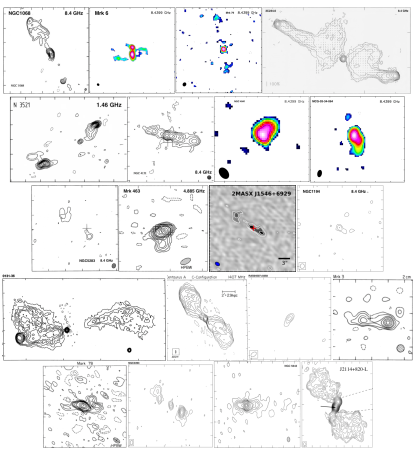
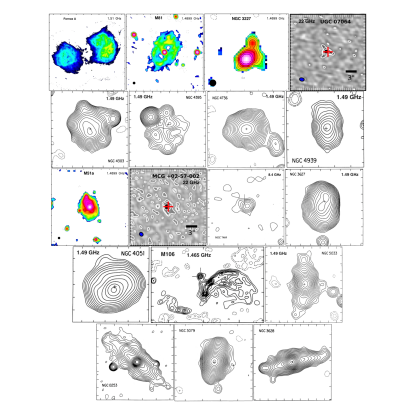
References
- Annuar et al. (2020) Annuar, A., Alexander, D. M., Gandhi, P., et al. 2020, arXiv e-prints, arXiv:2006.13583. https://arxiv.org/abs/2006.13583
- Arnaud (1996) Arnaud, K. A. 1996, in Astronomical Society of the Pacific Conference Series, Vol. 101, Astronomical Data Analysis Software and Systems V, ed. G. H. Jacoby & J. Barnes, 17
- Asmus et al. (2015) Asmus, D., Gandhi, P., Hönig, S. F., Smette, A., & Duschl, W. J. 2015, MNRAS, 454, 766, doi: 10.1093/mnras/stv1950
- Asmus et al. (2014) Asmus, D., Hönig, S. F., Gandhi, P., Smette, A., & Duschl, W. J. 2014, MNRAS, 439, 1648, doi: 10.1093/mnras/stu041
- Baldwin et al. (1981) Baldwin, J. A., Phillips, M. M., & Terlevich, R. 1981, PASP, 93, 5, doi: 10.1086/130766
- Berney et al. (2015) Berney, S., Koss, M., Trakhtenbrot, B., et al. 2015, MNRAS, 454, 3622, doi: 10.1093/mnras/stv2181
- Binette & Robinson (1987) Binette, L., & Robinson, A. 1987, A&A, 177, 11
- Blandford et al. (2019) Blandford, R., Meier, D., & Readhead, A. 2019, ARA&A, 57, 467, doi: 10.1146/annurev-astro-081817-051948
- Bruzual & Charlot (2003) Bruzual, G., & Charlot, S. 2003, MNRAS, 344, 1000, doi: 10.1046/j.1365-8711.2003.06897.x
- Burns et al. (1983) Burns, J. O., Feigelson, E. D., & Schreier, E. J. 1983, ApJ, 273, 128, doi: 10.1086/161353
- Cardelli et al. (1989) Cardelli, J. A., Clayton, G. C., & Mathis, J. S. 1989, ApJ, 345, 245, doi: 10.1086/167900
- Collin-Souffrin et al. (1973) Collin-Souffrin, S., Alloin, D., & Andrillat, Y. 1973, A&A, 22, 343
- Comastri (2004) Comastri, A. 2004, Astrophysics and Space Science Library, Vol. 308, Compton-Thick AGN: The Dark Side of the X-Ray Background (Barger, A. J.), 245, doi: 10.1007/978-1-4020-2471-9_8
- Condon (1987) Condon, J. J. 1987, ApJS, 65, 485, doi: 10.1086/191234
- Denney et al. (2014) Denney, K. D., De Rosa, G., Croxall, K., et al. 2014, ApJ, 796, 134, doi: 10.1088/0004-637X/796/2/134
- Dicken et al. (2014) Dicken, D., Tadhunter, C., Morganti, R., et al. 2014, ApJ, 788, 98, doi: 10.1088/0004-637X/788/2/98
- Eckart et al. (2005) Eckart, M. E., Laird, E. S., Stern, D., et al. 2005, ApJS, 156, 35, doi: 10.1086/425869
- Eckart et al. (2010) Eckart, M. E., McGreer, I. D., Stern, D., Harrison, F. A., & Helfand, D. J. 2010, ApJ, 708, 584, doi: 10.1088/0004-637X/708/1/584
- Eckart et al. (2006) Eckart, M. E., Stern, D., Helfand, D. J., et al. 2006, ApJS, 165, 19, doi: 10.1086/504524
- Elitzur & Ho (2009) Elitzur, M., & Ho, L. C. 2009, ApJ, 701, L91, doi: 10.1088/0004-637X/701/2/L91
- Elitzur & Netzer (2016) Elitzur, M., & Netzer, H. 2016, MNRAS, 459, 585, doi: 10.1093/mnras/stw657
- Elvis et al. (1978) Elvis, M., Maccacaro, T., Wilson, A. S., et al. 1978, MNRAS, 183, 129, doi: 10.1093/mnras/183.2.129
- Emmanoulopoulos et al. (2016) Emmanoulopoulos, D., Papadakis, I. E., Epitropakis, A., et al. 2016, MNRAS, 461, 1642, doi: 10.1093/mnras/stw1359
- Fender & Belloni (2012) Fender, R., & Belloni, T. 2012, Science, 337, 540, doi: 10.1126/science.1221790
- Fender & Muñoz-Darias (2016) Fender, R., & Muñoz-Darias, T. 2016, Lecture Notes in Physics, Berlin Springer Verlag, 905, 65, doi: 10.1007/978-3-319-19416-5_3
- Ferland & Osterbrock (1986) Ferland, G. J., & Osterbrock, D. E. 1986, ApJ, 300, 658, doi: 10.1086/163841
- Flohic et al. (2006) Flohic, H. M. L. G., Eracleous, M., Chartas, G., Shields, J. C., & Moran, E. C. 2006, ApJ, 647, 140, doi: 10.1086/505296
- Fomalont et al. (1989) Fomalont, E. B., Ebneter, K. A., van Breugel, W. J. M., & Ekers, R. D. 1989, ApJ, 346, L17, doi: 10.1086/185568
- Fritz et al. (2006) Fritz, J., Franceschini, A., & Hatziminaoglou, E. 2006, MNRAS, 366, 767, doi: 10.1111/j.1365-2966.2006.09866.x
- Gandhi et al. (2009) Gandhi, P., Horst, H., Smette, A., et al. 2009, A&A, 502, 457, doi: 10.1051/0004-6361/200811368
- Glass et al. (1982) Glass, I. S., Moorwood, A. F. M., & Eichendorf, W. 1982, A&A, 107, 276
- González-Martín et al. (2009a) González-Martín, O., Masegosa, J., Márquez, I., & Guainazzi, M. 2009a, ApJ, 704, 1570, doi: 10.1088/0004-637X/704/2/1570
- González-Martín et al. (2009b) González-Martín, O., Masegosa, J., Márquez, I., Guainazzi, M., & Jiménez-Bailón, E. 2009b, A&A, 506, 1107, doi: 10.1051/0004-6361/200912288
- González-Martín et al. (2019) González-Martín, O., Masegosa, J., García-Bernete, I., et al. 2019, ApJ, 884, 11, doi: 10.3847/1538-4357/ab3e4f
- Goulding & Alexander (2009) Goulding, A. D., & Alexander, D. M. 2009, MNRAS, 398, 1165, doi: 10.1111/j.1365-2966.2009.15194.x
- Graham et al. (2017) Graham, M. J., Djorgovski, S. G., Drake, A. J., et al. 2017, MNRAS, 470, 4112, doi: 10.1093/mnras/stx1456
- Groves et al. (2006) Groves, B. A., Heckman, T. M., & Kauffmann, G. 2006, MNRAS, 371, 1559, doi: 10.1111/j.1365-2966.2006.10812.x
- Hardcastle et al. (1997) Hardcastle, M. J., Alexander, P., Pooley, G. G., & Riley, J. M. 1997, MNRAS, 288, 859, doi: 10.1093/mnras/288.4.859
- Harrison et al. (2003) Harrison, F. A., Eckart, M. E., Mao, P. H., Helfand, D. J., & Stern, D. 2003, ApJ, 596, 944, doi: 10.1086/378087
- Hawkins (2007) Hawkins, M. R. S. 2007, A&A, 462, 581, doi: 10.1051/0004-6361:20066283
- Heckman et al. (2005) Heckman, T. M., Ptak, A., Hornschemeier, A., & Kauffmann, G. 2005, ApJ, 634, 161, doi: 10.1086/491665
- Hönig & Kishimoto (2010) Hönig, S. F., & Kishimoto, M. 2010, A&A, 523, A27, doi: 10.1051/0004-6361/200912676
- Hönig & Kishimoto (2017) —. 2017, ApJ, 838, L20, doi: 10.3847/2041-8213/aa6838
- Hopkins (2012) Hopkins, P. F. 2012, MNRAS, 420, L8, doi: 10.1111/j.1745-3933.2011.01179.x
- Hopkins et al. (2008) Hopkins, P. F., Hernquist, L., Cox, T. J., & Kereš, D. 2008, ApJS, 175, 356, doi: 10.1086/524362
- Hopkins et al. (2005) Hopkins, P. F., Hernquist, L., Martini, P., et al. 2005, ApJ, 625, L71, doi: 10.1086/431146
- Hopkins & Quataert (2010) Hopkins, P. F., & Quataert, E. 2010, MNRAS, 407, 1529, doi: 10.1111/j.1365-2966.2010.17064.x
- Hummel et al. (1985) Hummel, E., Pedlar, A., van der Hulst, J. M., & Davies, R. D. 1985, A&AS, 60, 293
- Hummel et al. (1987) Hummel, E., van der Hulst, J. M., Keel, W. C., & Kennicutt, R. C., J. 1987, A&AS, 70, 517
- Ichikawa (2018) Ichikawa, K. 2018, in 42nd COSPAR Scientific Assembly, Vol. 42, E1.12–11–18
- Ichikawa et al. (2017) Ichikawa, K., Ricci, C., Ueda, Y., et al. 2017, ApJ, 835, 74, doi: 10.3847/1538-4357/835/1/74
- Ichikawa et al. (2016) Ichikawa, K., Ueda, J., Shidatsu, M., Kawamuro, T., & Matsuoka, K. 2016, PASJ, 68, 9, doi: 10.1093/pasj/psv112
- Ichikawa et al. (2019) Ichikawa, K., Kawamuro, T., Shidatsu, M., et al. 2019, ApJ, 883, L13, doi: 10.3847/2041-8213/ab3ebf
- Jin et al. (2012) Jin, C., Ward, M., & Done, C. 2012, MNRAS, 422, 3268, doi: 10.1111/j.1365-2966.2012.20847.x
- Józsa et al. (2009) Józsa, G. I. G., Garrett, M. A., Oosterloo, T. A., et al. 2009, A&A, 500, L33, doi: 10.1051/0004-6361/200912402
- Just et al. (2007) Just, D. W., Brandt, W. N., Shemmer, O., et al. 2007, ApJ, 665, 1004, doi: 10.1086/519990
- Kauffmann et al. (2003) Kauffmann, G., Heckman, T. M., Tremonti, C., et al. 2003, MNRAS, 346, 1055
- Keel et al. (2012) Keel, W. C., Lintott, C. J., Schawinski, K., et al. 2012, AJ, 144, 66, doi: 10.1088/0004-6256/144/2/66
- Keel et al. (2017) Keel, W. C., Lintott, C. J., Maksym, W. P., et al. 2017, ApJ, 835, 256, doi: 10.3847/1538-4357/835/2/256
- Kewley et al. (2001) Kewley, L. J., Dopita, M. A., Sutherland, R. S., Heisler, C. A., & Trevena, J. 2001, Astrophys. J.,, 556, 121
- King et al. (2011) King, A. R., Zubovas, K., & Power, C. 2011, MNRAS, 415, L6, doi: 10.1111/j.1745-3933.2011.01067.x
- Kollatschny et al. (2000) Kollatschny, W., Bischoff, K., & Dietrich, M. 2000, A&A, 361, 901
- Kollatschny & Fricke (1985) Kollatschny, W., & Fricke, K. J. 1985, A&A, 146, L11
- Kollatschny et al. (2020) Kollatschny, W., Grupe, D., Parker, M. L., et al. 2020, A&A, 638, A91, doi: 10.1051/0004-6361/202037897
- Komossa et al. (2008) Komossa, S., Zhou, H., Wang, T., et al. 2008, ApJ, 678, L13, doi: 10.1086/588281
- Kormendy & Ho (2013) Kormendy, J., & Ho, L. C. 2013, ARA&A, 51, 511, doi: 10.1146/annurev-astro-082708-101811
- Koss et al. (2017) Koss, M., Trakhtenbrot, B., Ricci, C., et al. 2017, ApJ, 850, 74, doi: 10.3847/1538-4357/aa8ec9
- Krabbe et al. (2001) Krabbe, A., Böker, T., & Maiolino, R. 2001, ApJ, 557, 626, doi: 10.1086/321679
- Kukula et al. (1995) Kukula, M. J., Pedlar, A., Baum, S. A., & O’Dea, C. P. 1995, MNRAS, 276, 1262, doi: 10.1093/mnras/276.4.1262
- Lamastra et al. (2009) Lamastra, A., Bianchi, S., Matt, G., et al. 2009, A&A, 504, 73, doi: 10.1051/0004-6361/200912023
- Lara et al. (2001) Lara, L., Cotton, W. D., Feretti, L., et al. 2001, A&A, 370, 409, doi: 10.1051/0004-6361:20010254
- Lawrence (2018) Lawrence, A. 2018, Nature Astronomy, 2, 102, doi: 10.1038/s41550-017-0372-1
- Lintott et al. (2008) Lintott, C. J., Schawinski, K., Slosar, A., et al. 2008, MNRAS, 389, 1179, doi: 10.1111/j.1365-2966.2008.13689.x
- Lintott et al. (2009) Lintott, C. J., Schawinski, K., Keel, W., et al. 2009, MNRAS, 399, 129, doi: 10.1111/j.1365-2966.2009.15299.x
- Lutz et al. (2004) Lutz, D., Maiolino, R., Spoon, H. W. W., & Moorwood, A. F. M. 2004, A&A, 418, 465, doi: 10.1051/0004-6361:20035838
- Lyu et al. (2019) Lyu, J., Rieke, G. H., & Smith, P. S. 2019, ApJ, 886, 33, doi: 10.3847/1538-4357/ab481d
- MacLeod et al. (2019) MacLeod, C. L., Green, P. J., Anderson, S. F., et al. 2019, ApJ, 874, 8, doi: 10.3847/1538-4357/ab05e2
- Madau & Dickinson (2014) Madau, P., & Dickinson, M. 2014, ARA&A, 52, 415, doi: 10.1146/annurev-astro-081811-125615
- Marconi et al. (2004) Marconi, A., Risaliti, G., Gilli, R., et al. 2004, MNRAS, 351, 169, doi: 10.1111/j.1365-2966.2004.07765.x
- Martocchia et al. (2017) Martocchia, S., Piconcelli, E., Zappacosta, L., et al. 2017, aap, 608, A51, doi: 10.1051/0004-6361/201731314
- Matt et al. (2003) Matt, G., Guainazzi, M., & Maiolino, R. 2003, MNRAS, 342, 422, doi: 10.1046/j.1365-8711.2003.06539.x
- Morganti et al. (1993) Morganti, R., Killeen, N. E. B., & Tadhunter, C. N. 1993, MNRAS, 263, 1023, doi: 10.1093/mnras/263.4.1023
- Morris et al. (1985) Morris, S., Ward, M., Whittle, M., Wilson, A. S., & Taylor, K. 1985, MNRAS, 216, 193, doi: 10.1093/mnras/216.2.193
- Nagar et al. (2002) Nagar, N. M., Falcke, H., Wilson, A. S., & Ulvestad, J. S. 2002, A&A, 392, 53, doi: 10.1051/0004-6361:20020874
- Narayan (2005) Narayan, R. 2005, Ap&SS, 300, 177, doi: 10.1007/s10509-005-1178-7
- Narayan & Yi (1995) Narayan, R., & Yi, I. 1995, ApJ, 452, 710, doi: 10.1086/176343
- Nenkova et al. (2008) Nenkova, M., Sirocky, M. M., Nikutta, R., Ivezić, Ž., & Elitzur, M. 2008, ApJ, 685, 160, doi: 10.1086/590483
- Noda & Done (2018) Noda, H., & Done, C. 2018, MNRAS, 480, 3898, doi: 10.1093/mnras/sty2032
- Noguchi et al. (2010) Noguchi, K., Terashima, Y., Ishino, Y., et al. 2010, ApJ, 711, 144, doi: 10.1088/0004-637X/711/1/144
- Novak et al. (2011) Novak, G. S., Ostriker, J. P., & Ciotti, L. 2011, ApJ, 737, 26, doi: 10.1088/0004-637X/737/1/26
- Panessa et al. (2006) Panessa, F., Bassani, L., Cappi, M., et al. 2006, A&A, 455, 173, doi: 10.1051/0004-6361:20064894
- Parker et al. (2016) Parker, M. L., Komossa, S., Kollatschny, W., et al. 2016, MNRAS, 461, 1927, doi: 10.1093/mnras/stw1449
- Parker et al. (2019) Parker, M. L., Longinotti, A. L., Schartel, N., et al. 2019, MNRAS, 490, 683, doi: 10.1093/mnras/stz2566
- Pei (1992) Pei, Y. C. 1992, ApJ, 395, 130, doi: 10.1086/171637
- Penston & Perez (1984) Penston, M. V., & Perez, E. 1984, MNRAS, 211, 33P, doi: 10.1093/mnras/211.1.33P
- Ramos Almeida et al. (2007) Ramos Almeida, C., Pérez García, A. M., Acosta-Pulido, J. A., & Rodríguez Espinosa, J. M. 2007, AJ, 134, 2006, doi: 10.1086/522625
- Ramos Almeida & Ricci (2017) Ramos Almeida, C., & Ricci, C. 2017, Nature Astronomy, 1, 679, doi: 10.1038/s41550-017-0232-z
- Ricci et al. (2017) Ricci, C., Trakhtenbrot, B., Koss, M. J., et al. 2017, ApJS, 233, 17, doi: 10.3847/1538-4365/aa96ad
- Risaliti et al. (1999) Risaliti, G., Maiolino, R., & Salvati, M. 1999, ApJ, 522, 157, doi: 10.1086/307623
- Rumbaugh et al. (2018) Rumbaugh, N., Shen, Y., Morganson, E., et al. 2018, ApJ, 854, 160, doi: 10.3847/1538-4357/aaa9b6
- Schawinski et al. (2015) Schawinski, K., Koss, M., Berney, S., & Sartori, L. F. 2015, MNRAS, 451, 2517, doi: 10.1093/mnras/stv1136
- Schirmer et al. (2016) Schirmer, M., Malhotra, S., Levenson, N. A., et al. 2016, MNRAS, 463, 1554, doi: 10.1093/mnras/stw1819
- Schmitt et al. (2001) Schmitt, H. R., Ulvestad, J. S., Antonucci, R. R. J., & Kinney, A. L. 2001, ApJS, 132, 199, doi: 10.1086/318957
- Schweizer et al. (2013) Schweizer, F., Seitzer, P., Kelson, D. D., Villanueva, E. V., & Walth, G. L. 2013, ApJ, 773, 148, doi: 10.1088/0004-637X/773/2/148
- Shappee et al. (2014) Shappee, B. J., Prieto, J. L., Grupe, D., et al. 2014, ApJ, 788, 48, doi: 10.1088/0004-637X/788/1/48
- Shulevski et al. (2015) Shulevski, A., Morganti, R., Barthel, P. D., et al. 2015, A&A, 583, A89, doi: 10.1051/0004-6361/201525632
- Smith et al. (2007) Smith, J. D. T., Draine, B. T., Dale, D. A., et al. 2007, ApJ, 656, 770, doi: 10.1086/510549
- Smith et al. (2016) Smith, K. L., Mushotzky, R. F., Vogel, S., Shimizu, T. T., & Miller, N. 2016, ApJ, 832, 163, doi: 10.3847/0004-637X/832/2/163
- Stalevski et al. (2016) Stalevski, M., Ricci, C., Ueda, Y., et al. 2016, MNRAS, 458, 2288, doi: 10.1093/mnras/stw444
- Steffen et al. (2006) Steffen, A. T., Strateva, I., Brandt, W. N., et al. 2006, AJ, 131, 2826, doi: 10.1086/503627
- Stern (2015) Stern, D. 2015, ApJ, 807, 129, doi: 10.1088/0004-637X/807/2/129
- Tananbaum et al. (1979) Tananbaum, H., Avni, Y., Branduardi, G., et al. 1979, apjl, 234, L9, doi: 10.1086/183100
- Terashima et al. (2002) Terashima, Y., Iyomoto, N., Ho, L. C., & Ptak, A. F. 2002, ApJS, 139, 1, doi: 10.1086/324373
- Terlevich & Forbes (2002) Terlevich, A. I., & Forbes, D. A. 2002, MNRAS, 330, 547, doi: 10.1046/j.1365-8711.2002.05073.x
- Tohline & Osterbrock (1976) Tohline, J. E., & Osterbrock, D. E. 1976, ApJ, 210, L117, doi: 10.1086/182317
- Trakhtenbrot et al. (2019) Trakhtenbrot, B., Arcavi, I., MacLeod, C. L., et al. 2019, ApJ, 883, 94, doi: 10.3847/1538-4357/ab39e4
- Tran (2003) Tran, H. D. 2003, ApJ, 583, 632, doi: 10.1086/345473
- Ulvestad & Wilson (1984) Ulvestad, J. S., & Wilson, A. S. 1984, ApJ, 278, 544, doi: 10.1086/161821
- Ulvestad & Wilson (1989) —. 1989, ApJ, 343, 659, doi: 10.1086/167737
- Ulvestad et al. (1981) Ulvestad, J. S., Wilson, A. S., & Sramek, R. A. 1981, ApJ, 247, 419, doi: 10.1086/159051
- Ward et al. (1988) Ward, M. J., Done, C., Fabian, A. C., Tennant, A. F., & Shafer, R. A. 1988, ApJ, 324, 767, doi: 10.1086/165935
- Xu (2011) Xu, Y.-D. 2011, ApJ, 739, 64, doi: 10.1088/0004-637X/739/2/64
- Young et al. (2009) Young, M., Elvis, M., & Risaliti, G. 2009, ApJS, 183, 17, doi: 10.1088/0067-0049/183/1/17
- Zubovas & King (2014) Zubovas, K., & King, A. R. 2014, MNRAS, 439, 400, doi: 10.1093/mnras/stt2472