labelinglabel
A multi-decadal view of the heat and mass budget of a volcano in unrest: La Soufrière de Guadeloupe (French West Indies)
Abstract
Particularly in the presence of a hydrothermal system, many volcanoes output large quantities of heat through the transport of water from deep within the edifice to the surface. Thus, heat flux is a prime tool for evaluating volcanic activity and unrest. We review the volcanic unrest at La Soufrière de Guadeloupe (French West Indies) using an airborne thermal camera survey, and in-situ measurements of temperature and flow rate through temperature probes, Pitot-tube and MultiGAS measurements. We deduce mass and heat fluxes for the fumarolic, ground and thermal spring outputs and follow these over a period spanning 2000–2020. Our results are compared with published data and we performed a retrospective analysis of the temporal variations in heat flux over this period using the literature data.
We find that the heat emitted by the volcano is , of which the fumarolic heat flux is dominant at . Given a total heated area of , this equates to a heat flux density of , which is amongst the highest established for worldwide volcanoes with hydrothermal systems, particularly for dome volcanoes. A major change at La Soufrière de Guadeloupe, however, is the development of a widespread region of ground heating at the summit where heat output has increased from in 2010 to in 2020. This change is concurrent with accelerating unrest at the volcano, and the emergence of two new high-flux fumaroles in recent years. Our findings highlight the importance of continued and enhanced surveillance and research strategies at La Soufrière de Guadeloupe, the results of which can be used to better understand hydrothermal volcanism the world over.
Orcid IDs:
David E. Jessop: 0000-0003-2382-219X
Séverine Moune: 0000-0002-8485-0154
Roberto Moretti: 0000-0003-2031-5192
Jean-Christophe Komorowski: 0000-0002-6874-786X
Vincent Robert: 0000-0002-9016-7167
Michael J. Heap: 0000-0002-4748-735X
Magali Bonifacie:0000-0002-4797-043X
Marina Rosas-Carbajal: 0000-0002-5393-0389
Introduction
Hydrothermal systems in active island-arc andesitic volcanoes are produced by the interaction of hot magmatic fluids, essentially gaseous water, CO2, H2S and/or SO2 and HCl, produced by magma degassing at depth with marine or meteoric water at shallower depths and the host-rock (Sigurdsson et al., 2015; Hedenquist and Lowenstern, 1994). Cooling through interaction with water (dissolution and/or absorption into deep ground waters and mixing with meteoric and sea-water) and the host-rock causes chemical species to be reduced (Giggenbach, 1975; Moretti and Stefansson, 2020). Hence, the geochemical profile of fluids discharged at the surface of a hydrothermal system is typically different to that at depth. Hydrothermal systems can undergo sudden and catastrophic changes in behaviour. Two events in recent years, in particular, have highlighted the importance of understanding all aspects of hydrothermal volcanoes and their hazardous behaviour: the September 2014 Ontake (Japan) and December 2019 Whakaari (White Island, New Zealand) eruptions, both of which resulted in the tragic loss of human life.
The boiling of geothermal liquids liberates a fraction of the dissolved gases, which fractionate into the vapour phase that ascends to the surface through steam-dominated fumaroles. Partial condensation of these vapours into ground waters may generate steam-heated waters likely to disperse laterally where they can further mix with external waters and discharge as thermal springs (Hedenquist and Lowenstern, 1994; Sigurdsson et al., 2015). Therefore, significant amounts of heat are emitted as the super-heated steam, generated by these interactions, rises towards the surface through networks of cracks, fissures and more porous rock within the edifice. The super-heated steam either condenses near the surface or escapes to the atmosphere through fumaroles (Chiodini et al., 2001; Fischer and Chiodini, 2015; Stimac et al., 2015). Heat emission can occur in several forms. First, where resistance to flow is low (high permeability subsurface) the steam may reach the surface without condensing and, second, where resistance to flow is high (low permeability subsurface) the steam may condense near the surface. In the first scenario, the fumarolic output is high and significant amounts of heat and mass are transferred to the environment. In the second scenario, fumarolic output is correspondingly lower and heat is brought to the surface by forced convection and liberated to the environment by radiation and conduction (Harris, 2013; Gaudin et al., 2016). This leads to thermal anomalies (ground heating) and small, low-flux fumaroles typically distributed over quite large areas (cf. Aubert et al., 1984; Aubert, 1999; Harris and Stevenson, 1997; Harris and Maciejewski, 2000, for example). In many cases, ground heating far exceeds the fumarolic output in terms of energy transfer (Matsushima et al., 2003; Mannini et al., 2019). Due to the high heat capacity of water, direct fumarolic degassing and diffuse small fumarole/soil degassing are generally the two major components of heat loss at hydrothermal volcanic systems (Aubert, 1999; Chiodini et al., 2001). The final component of heat transfer in hydrothermal volcanic systems is through a network of thermal springs which typically appear along the flanks or base of the system, taking advantage of structural discontinuities. These springs discharge water, initially heated by volcanic gases, that has either condensed deep within the edifice or nearer the surface when it has come into contact with the water table (Fischer and Chiodini, 2015; Stimac et al., 2015).
Whilst the relative importance of the different heat loss mechanisms will vary from volcano to volcano and may vary in time at a given site, volcanic heat flow in general is indicative of (e.g. Hardee, 1982; Lardy and Tabbagh, 1999; Harris et al., 2009): 1. The state and position of the magma body; 2. The porosity/permeability of the edifice or dome; 3. The extent of infiltration of external water into the system. As such, spatio-temporal variations in heat flow are of particular importance for both monitoring and fundamental research and allow us to greatly constrain numerical models of the magmatic and plumbing systems (Di Renzo et al., 2016).
Hydrothermal systems play a fundamental role in providing and enhancing the physico-chemical conditions that promote rock alteration, as well as the pressurisation of hydrothermal fluids. These processes act as strong forcing and triggering agents on the dynamics of volcanic activity by mechanically weakening edifice-forming volcanic rock (Pola et al., 2012; Wyering et al., 2014; Heap et al., 2015; Mordensky et al., 2019) and, therefore, promoting recurrent partial flank collapses (López and Williams, 1993; de Vries et al., 2000; Reid et al., 2001; Reid, 2004; John et al., 2008), as observed at La Soufrière de Guadeloupe (Komorowski et al., 2005; Rosas-Carbajal et al., 2016). Escalating pressurisation of hydrothermal systems, as a result of permeability loss due to hydrothermal alteration, can also lead to explosive activity (Heap et al., 2019) that can reach paroxysmal levels with non-magmatic laterally-directed turbulent pyroclastic density currents or blasts (e.g. Bandaisan, Japan, in 1889). Hydrothermal alteration has also been observed to reduce the thermal conductivity and thermal diffusivity of andesite for a given porosity (Heap et al., 2020). Finally, the hydrothermal system is a strong modulator of geophysical and geochemical signals of magmatic unrest and can generate a plethora of non-magmatic unrest signals that render monitoring, as well as their interpretation and forecasting, very challenging (Pouget et al., 2015).
In this paper which spans the past 20 years with particular emphasis on the 2010–2020 period, we concentrate on the use of thermal measurements to infer the state of unrest of a major hydrothermal volcanic system, that of La Soufrière de Guadeloupe (Lesser Antilles). We present the first study for this volcano that fully integrates measurements of all the heat sources over such a long period of time. La Soufrière de Guadeloupe is a good target for such a study due to the wealth of geochemical, geological and geophysical data acquired on the volcano. As such, it is often considered a natural laboratory representative of andesitic hydrothermal systems.
Context
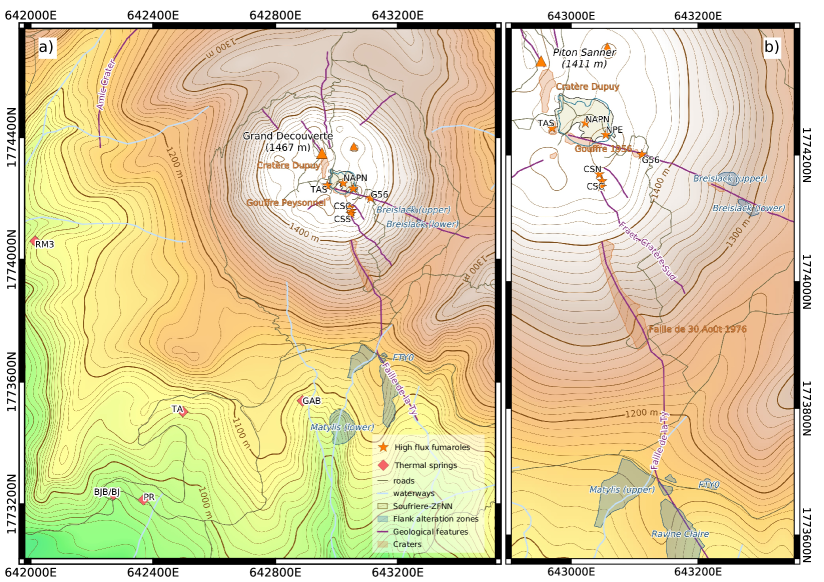
La Soufrière de Guadeloupe ( N, - E, alt. , hereby referred to as La Soufrière) is an andesitic dome volcano situated in the south of the Basse-Terre island of Guadeloupe (French West Indies), which is part of the Lesser Antilles volcanic arc and is the most recent edifice of the Grande Découverte complex (445 ka). La Soufrière is amongst the most active and potentially deadly of the volcanoes in the Lesser Antilles Arc (Komorowski et al., 2005). Hydrothermal activity is sustained by gas and heat transfer from a 6–7 km deep andesitic magma reservoir to shallower aquifers (Pichavant et al., 2018). Owing to an extensive hydrothermal system, La Soufrière has undergone a series of six phreatic and hydrothermal explosive eruptions since the last major magmatic eruption in 1530 C.E. (Komorowski et al., 2005). The most recent, and probably most famous, eruption was in 1976–77 (Feuillard et al., 1983; Hincks et al., 2014).
The present edifice dates back at least 9150 years (Komorowski et al., 2005; Legendre, 2012), during which time several major magmatic eruptions have occurred, the latter in around 1530 C.E., when the current dome was emplaced (Komorowski et al., 2005; Boudon et al., 2008). Since this last magmatic event, there have been a number of phreatic and/or hydrothermal explosive eruptions. The last eruption occurred in 1976–77, following which the volcano became essentially dormant until 1992 when seismic activity and steam emissions from summit fumaroles recommenced (OVSG-IPGP 1999-2001111http://www.ipgp.fr/fr/ovsg/bulletins-mensuels-de-lovsg; Zlotnicki et al., 1992; Komorowski et al., 2001, 2005). Summit degassing has gradually increased concomitantly with other observables (seismic, gas flux and concentration, ground and fumarole temperatures, deformation, emissions of chlorine-rich acid gases), over the past years. This has included the appearance of two new high-flux fumaroles (Napoléon Nord and Napoléon Est, labelled NAPN and NPE on Fig. 1; OVSG-IPGP 2014-2016; Komorowski et al., 2005; Villemant et al., 2014; Moretti et al., 2020a), extensive zones of substantial surface heating and scalding of vegetation. Several fumarolic sites on the flanks characterised by a low state of activity since 1976, gradually vanished. At the summit, Tarissan (TAS), Cratère Sud (CS), la Fente du Nord, Gouffre 56 (G56) and the Lacroix fumaroles had all become inactive by 1984 (Komorowski et al., 2005; Boichu et al., 2011; Feuillard, 2011; Ruzié et al., 2013).
An increase in activity in 2018 raised speculation that the volcano is in a state of growing unrest and is likely to undergo another eruptive episode in the near future (Moretti et al., 2020a). Until 2014, ground thermal anomalies and accompanying soil degassing had likely been limited to the areas directly surrounding the major fumaroles, as well as the Faille de la Ty/Ravine Claire/Matylis structure (Fig. 1; OVSG-IPGP 2014-2020; Komorowski et al., 2005; Lesparre et al., 2012; Brothelande et al., 2014). In recent years, however, a number of thermal anomalies and altered zones have been observed such as at the Zone Fumerolienne Napoléon Nord (ZFNN) at the summit, delimited by NAPN, Cratère Dupuy (DUP) and TAS, adjoining the Breislack fault (BLK) and in the upper Matylis ravine (Fig. 1, OVSG-IPGP 2014-2020 and this work). Increasing fluxes and acidification of the water and gas rising up within the volcano has led to significant alteration and weakening of the edifice, leaving it vulnerable to flank collapse during even moderate seismic activity or extreme rainfall (Komorowski et al., 2005; Rosas-Carbajal et al., 2016).
The summit vents are located near major fractures and fault zones, i.e. zones of high vertical permeability (see Fig. 1 and Zlotnicki et al., 1992; Komorowski et al., 2005). These are likely to have acted as a magma ascent route for the dome (Brombach et al., 2000). The deepest part of these fractures act as a zone of preferential input of magmatic gases into the hydrothermal aquifer, and its shallowest part behaves as a zone of preferential discharge for the hydrothermal aquifer (Brombach et al., 2000). The horse-shoe shaped scar of recurrent partial edifice collapses over at least the last 3000 years, including the major Amic Crater (1370 BCE) and the 1530 CE events, forms a listric clay-rich low-permeability south-sloping surface. This allows preferential outflow of heated ground waters through a number of thermal springs (Brombach et al., 2000; Villemant et al., 2005; Ruzié et al., 2013; Villemant et al., 2014). Here, fluids are heated within the hydrothermal system and then partially cooled by mixing with meteoric water before escaping to the environment.
Materials and methods
Aerial thermal surveys were carried out in 2010 and 2019, MultiGAS and Pitot-tube measurements have been carried out monthly since 2017 and the thermal springs have been sampled monthly since 2000. Our measurements are effectively contemporaneous even though sampling times differ between different methods and sites. We calculated errors on our estimations using standard error propagation formulae (Ku, 1966; Gibbings, 1986). Examples of how to apply these formulae and a table of relative standard errors for all the parameters used in this study can be found in the Supplementary Material.
Ground thermal anomaly flux
We used airborne thermal imagery to measure the extent and distribution of thermal anomalies over the entire volcano using an InfraTec VarioCam HD thermal camera (8–) with pixel resolution. A 15 mm focal length lens ( FOV), gave an instantaneous field of view (IFOV) of . The distinguishable temperature difference between neighbouring pixels, , was . We used an Isotech Calisto calibration oven with black-body source to calculate the drift of the camera’s temperature measurements and applied this to our thermal images.
The airborne thermal survey was conducted on 22 November 2019 with helicopter support provided by the local Civil Protection Service and in pre-dawn conditions (05:40–06:05 local time, sunrise was at 06:14 local time). Ground heating due to incoming solar radiation was hence minimised. GPS locations were recorded at using a Garmin 64st . Images were acquired through the open door of the helicopter from heights of about 50–300 m . The sky was cloudless with only a very light wind from the North (cf. the predominant trade winds, les Alizées, blow from the East). Little rain had fallen in the week prior to the survey, so the ground surface was dry.
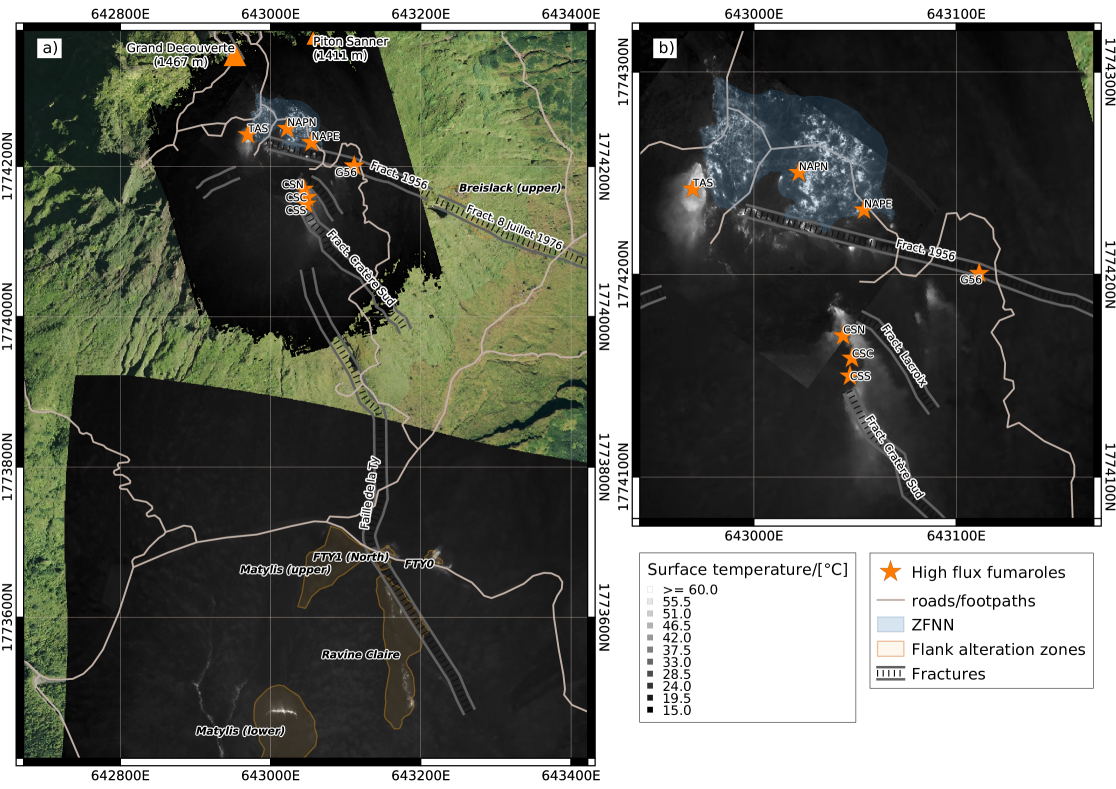
We georeferenced and orthorectified our thermal images using a DEM calculated from Institut Geographique National (IGN) aerial photography, processed using MicMac (Rupnik et al., 2017) and IGN orthophotos (Fig. 2). Georeferencing of the thermal images was performed in QGIS using a thin-plate spline transform when the images were taken obliquely, or a Helmert transform for vertically-oriented images. Pixel to physical distance conversions were computed as per Bombrun et al. (2018).
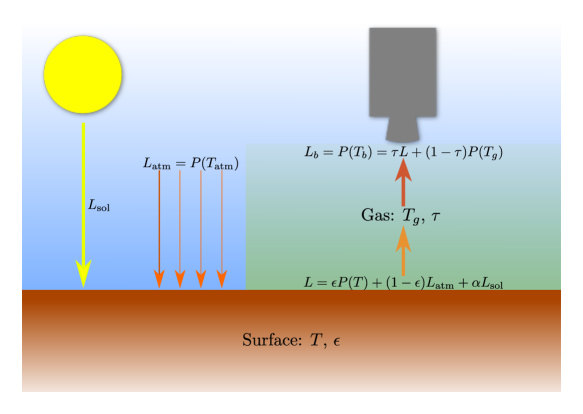
A schematic of the various fluxes seen by the camera is shown in Fig. 3. The effective brightness temperature is a function of the incoming fluxes which are functions of the temperature of the objects in the field of view through the Stefan-Boltzmann law . The brightness temperature is also affected by reflection of incoming radiation (e.g. and in Fig. 3). Thus the true temperature of the ground can be expressed as
| (1) |
where is the brightness temperature seen by the camera, is the brightness temperature of the upper atmosphere, is the temperature of gases between the object and camera, is the transmissivity of an atmospheric and volcanogenic gas mixture between camera and the ground and is the emissivity of the ground (Fig. 3).
We converted at-camera (brightness) temperature to absolute temperature by applying Eq. 1. Fumarole plumes and areas outside the region of interest were masked. We calculated using a radiative transfer model, with the surface-camera distance given by the georeferenced images and GPS location of the camera (Kochanov et al., 2016; Berk and Hawes, 2017). We took the surface emissivity to be constant for all the heated areas with in line with that found for other studies on andesitic systems (Sekioka and Yuhara, 1974; Gaudin et al., 2016).
We note that not all of the steam condenses before reaching the surface. Condensed liquids drain away to be discharged elsewhere in the system (i.e. through thermal springs, in which case the heat transported is accounted for in the thermal springs heat budget) and any residual heat transferred to the ground, where it is accounted for in the soil heat budget. Hence we do not consider heat transported by condensed water here (cf. Gaudin et al., 2015). Our heat balance is thus (Sekioka and Yuhara, 1974; Matsushima et al., 2003; Harris, 2013; Mannini et al., 2019)
| (2) | ||||
| (3) | ||||
| (4) |
where is the soil heat flux and subscripts and refer to radiative and conductive components of , respectively, is the ground temperature, is the ambient temperature and is the heated area, is the soil emissivity. The heat transfer coefficient, , depends on several factors, particularly the local wind speed, . We use the Schlichting-Neri model (Neri, 1998; Gaudin et al., 2013)
| (5) |
where is the height above the surface and is a measure of the surface roughness. Eq. 5 has been shown to produce results that are consistent with the surface heat balance at La Soufrière (Gaudin et al., 2013), such that the heat conducted to the surface equals . We note that the surfaces on the volcano where heat transfer occurs consist typically of centimetric blocks and thus we take as our roughness scale. We determined from measurements at the Sanner weather station (cf. Piton Sanner in Fig. 1) at the time of thermal image acquisition. The anemometer at Sanner is approximately above ground level, so we take in our calculations. For wind speeds between 5–, as seen on the 22 November, we find between 21.1 and . Considering error propagation, we estimate a relative standard error of about 10% on the radiative and convective flux measurements, and thus about 15% for the total flux.
Fumarole heat and mass fluxes
In-plume fumarole steam flux via MultiGAS traverses
The OVSG222Observatoire Volcanologique et Simologique de la Guadeloupe MultiGAS consists of an IR spectrometer for CO2 determination and electro-chemical sensors for SO2, H2S and H2. The atmospheric pressure is determined with the sensor installed on the CO2 spectrometer card. The MultiGAS also includes an externally-fitted relative humidity (RH) sensor (Galltec, range: 0–100% RH, accuracy: %) and temperature sensor (range: -30–70, resolution: ), to determine water vapour concentration (Moussallam et al., 2017). H2O determination with these external sensors reduced the risk of underestimating the measured water/gas ratios due to steam condensation in the inlet. An onboard GPS receiver tracked the location of the instrument at . Data were visualised on an external tablet in real time. More detailed information about the OVSG MultiGAS, its design and performance characteristics can be found in Tamburello et al. (2019) and Moretti et al. (2020a, b).
Fumarolic gas fluxes were determined for the three main vents that generate plumes (CS, TAS and G56, Figure 1) following Allard et al. (2014) and Tamburello et al. (2019). The horizontal and vertical distributions of gas species in the plume cross-sections were measured a few meters downwind from the vents during orthogonal traverses on foot. Gas concentrations were measured at two different heights (typically 0.9 and ) as the volcanic gas plumes are generally flattened to the ground by strong trade winds (2–) and have a maximum height of ca. 3– above the ground at each measuring site with a maximum gas density centred at between and above the ground (our visual observations; Gaudin et al., 2016; Tamburello et al., 2019). For each site, we interpolated the concentration measurements using a 2D spline function and then integrated over the plume cross section to obtain integrated concentration amounts (ICAs) using RatioCalc (Tamburello, 2015). The CO2 fluxes are derived by multiplying the CO2 concentration integrated over the plume cross section with the wind speed measured during the gas survey with a hand-held anemometer. We use CO2 as the volcanic marker as, due to its more conservative behaviour compared to H2S and due to the faster response of the IR CO2 sensor compared to the electro-chemical H2S sensor, this way the MultiGAS is able to detect rapid concentration changes during plume transects. This avoids flux underestimations and leads to more accurate gas flux measurements (Tamburello et al., 2019). Due to the high atmospheric background for H2O and CO2, our walking profiles start and end in pure atmospheric background in order to characterise and then subtract the ambient air composition from our recorded data. Steam fluxes, , are derived from the CO2 flux by multiplying it by the weight ratio of H2O/CO2. Steam flux estimates were possible only when water was successfully determined via the external RH sensor. It is important to note that some temporal variability of steam fluxes could be due to: i) different ambient humidity and weather condition at the summit between field measurements; ii) occasional partial steam condensation on the external sensors. Indeed, particularly for tropical volcanoes such as La Soufrière, water vapour in the plume rapidly condenses upon contact with the atmosphere. However, this condensed water is not taken into account by the MultiGAS measurements. It has been shown that, in such tropical conditions, properly accounting for the condensed water adds approximately 35% to the steam flux estimations (Gaudin et al., 2016), an increase which we consider in our analysis. Lastly, wind speed is the main source of error in quantifying volcanic gas fluxes, leading to typical standard errors on steam flux estimation of about 40%.
At-vent fumarole fluxes via Pitot-tube measurements
Measurements of the steam exit speed at the vent of several fumaroles were made using a Pitot-tube instrument based around Freescale MPX2200AP and MPX2010DP temperature compensated pressure sensors that measured the dynamic pressure in the moving stream and ambient (stagnation) pressure. Pressure readings were taken at and the median of 10 measurements was recorded by an Arduino Due. Uncertainty in the pressure readings was , meaning that the minimum detectable speed was about . From these values, the speed of a moving stream of gas, , of density was calculated as (Massey and Ward-Smith, 1998)
| (6) |
where is the dynamic pressure, is the stagnation pressure and is the free-stream pressure. Vent temperatures were simultaneously measured using a PT1000 resistance temperature sensor with an instrumental error of . These measurements, along with the pressure readings, were used to calculate the steam density, , using numerical codes based on IAPWS thermodynamic calculations (Wagner and Pruß, 1993, 2002). Measurements were taken repeatedly at different points across the vent in order to build up an idea of the velocity distribution. Typically 7 measurements were taken and the median velocity from these measurements was used in the calculations that follow.
From vent speed, we deduce the mass flux from the fumaroles which, as water vapour contributes up to 98% of the total mass (Allard et al., 2014; Tamburello et al., 2019; Moretti et al., 2020a, OVSG-IPGP bulletins 2017-2020;), is equivalent to the steam flux,
| (7) |
where is the mean vent speed (equivalent in this case to median vent speed), is the area of the vent. Whereas in Moretti et al. (2020a), vent area was estimated by eye by the Pitot-tube operator, here we calculate by analysing thermal images. We repeatedly took thermal images looking straight into the vents throughout the period when Pitot-tube measurements were made, from which we manually traced around the vent perimeter and, using the on-camera laser distance measurements, then converted to physical area (i.e. in ) via a pixel-to-physical length conversion as per Bombrun et al. (2018). We estimated the relative standard error on mass flux measurements to be 10%.
Heat flux estimations
The heat released through fumarolic activity is essentially due to cooling and condensation of the volcanic steam. Fumarole heat flux can generally be decomposed into two contributing factors: radiation by the heated vent surface, , and the specific and latent heat carried by the gas phase, , so that (Harris, 2013; Gaudin et al., 2016). Heat lost to the surroundings through the walls of the fumarole pipes is not considered as part of this heat budget, but are accounted for through the geothermal heating of the surrounding ground (Stevenson, 1993; Mannini et al., 2019), as shown in the previous section. Following Harris (2013); Allard et al. (2014); Gaudin et al. (2016) we write these as
| (8) | ||||
| (9) |
where is the ground emissivity, is the Stefan-Boltzmann constant, is the specific heat capacity , the latent heat of condensation, is the temperature of the steam, is the boiling temperature of water at the dome altitude and is the ambient temperature at the summit. The subscripts and refer to the vapour and liquid states of water, respectively, with and for summit temperatures and pressures. During the survey period, ranged from 96.9 and for CS and has been measured in the water lake at TAS to be approximately (OVSG-IPGP 2016-2020). Since the G56 vent is in a c. deep cavity within the volcano, requiring specialised equipment to access, it is impractical to measure it directly. Thus we estimate that the temperature at the G56 vent is at the boiling temperature of water. We note that and are functions of and and were solved for using similar numerical routines as for density. is a function of pressure only and is also deduced from the IAPWS formulations (Wagner and Pruß, 1993, 2002).
Given the instrumental and measurement errors summarised in the text above, and using error propagation techniques (see Gibbings, 1986, for example), we estimated the standard errors on the flux estimation using the Pitot-tube and MultiGAS instruments. In the case of the Pitot-tube instrument, the standard error in estimating is dominated by the mass flux and radiative flux terms and, overall, is around 10%. The standard error for our estimates based on MultiGAS measurements is dominated by the uncertainty in the mass flux measurements alone and so is about 40%.
Thermal Springs
The nine thermal springs situated around the base of the current dome have been monitored regularly by the OVSG since 1978 by manually measuring temperature and flow rate. The majority of sites have been visited on a 1–3 month basis to take manual temperature readings as well as physico-chemical parameters such as pH and conductivity, and to take samples for future chemical analysis (Villemant et al., 2005, 2014). During these outings, and when it was possible, volumetric flow rate, , was deduced from the time taken to fill a container of known volume. This process was repeated 6–10 times and we report here the mean value of these measurements. From this, we calculate the mass flow rate, , which then allows us to calculate the heat flux as the sum of specific, evaporative and radiative heats,
| (10) |
We drop evapotransport, , and radiative heat losses, , in Eq. (10) as these contribute negligibly to the heat budget. The relative standard error on these measurements is about 5%.
Results
Ground heat flux
We show our results from the analysis of the thermal images (Fig. 2) in Table 1. For each site with detected thermal activity (summit, lower Ravine Matylis, Ravine Claire and FTY), we have determined radiative and convective fluxes as well as the flux density, . As large fluxes can be observed by low intensity emissions over a large area, we also calculate the total heat flux density, , as a metric for comparing intensity between sites (Table 1) with a relative standard error of about 6%. At the summit we found the radiative flux to be and the convective flux to be , with (Eq. 5) and (areas were calculated by counting the number of heated pixels, e.g. Fig. 2). These values were by far the largest in magnitude of all the sites, and larger than the total heat fluxes for the other sites combined. This finding is supported by the heat flux density, which is considerably greater than any other site.
We calculated for wind speeds during acquisition of the images of the flank sites, which was used in the calculations for all sites. Owing to a relatively large emitting surface of , the heat flux at Ravine Claire (RC) is second to the summit with radiative and convective fluxes of and (Table 1), respectively. In the lower Matylis ravine, a strong thermal anomaly leads to high flux densities (42 and for radiation and convection, respectively), although a low heated area () keeps the overall fluxes low. We identified two sites along FTY (FTY0 and FTY1 in Figs. 1 and 2) which have similar results for flux density and had a total flux of and a mean flux density of . We note that all these sites (Matylis, RC, FTY) are linked to the Ty N-SE and Galion N-S faults that cut the dome (Komorowski et al., 2005; Rosas-Carbajal et al., 2016).
Fumarole heat and mass flux
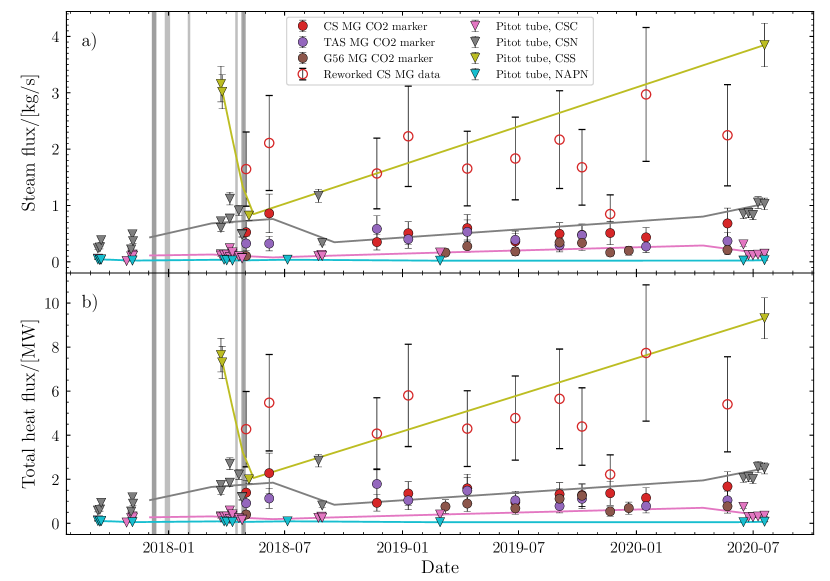
The mass and heat fluxes are shown in Fig. 4 a) and b), respectively. Steam fluxes estimated from MultiGAS traverses show that, using CO2 as a marker, the min/mean/max values are: 0.35/0.52/0.86, 0.15/0.30/0.47 and 0.29/0.44/ for CS, G56 and TAS, respectively. Heat flux estimates based on these data give 0.93/1.36/2.28, 0.40/0.79/1.25 and 0.78/1.12/ for CS, G56 and TAS, respectively. Considering the relative standard error of 40%, we find that the MultiGAS fluxes have remained stable since regular estimates began in mid 2018, subsequent to the M4.1 earthquake.
The temporal variations in fumarole steam flux calculated by the Pitot-tube for the three vents at CS are also shown in Fig. 4a. These data indicate that the fluxes can show a large degree of variation in short time periods which is especially true during periods of accelerated unrest such as from March–May 2018 (Moretti et al., 2020a). We find steam fluxes to have min/mean/max values of 0.01/0.12/ at CSC, 0.22/0.70/ at CSN and 0.82/2.71/ at CSS (Fig. 4a), which equate to heat fluxes of 0.03/0.29/ for CSC vent, 0.53/1.69/ for CSN vent, and 1.99/6.56/ for CSS vent (Fig. 4b). Fluxes were also measured at NAPN and we found mean mass and heat fluxes of and with very little variation over time, including during the 2018 unrest. The contribution of NAPN to the total heat and mass budget is thus negligible. We note that, due to an improved method for estimating vent area based on head-on thermal images compared to visual estimation during measurements (see Methods), the vent heat fluxes presented here are quantitatively lower than reported in Moretti et al. (2020a), although the qualitative temporal variation is the same. The Pitot-tube data show that vent fluxes at CS were strongly affected by and decreased during the 2018 unrest phase, but have since settled to around and for mass and heat flux, respectively. Fig. 4b) shows, although the coefficients for heat capacity and latent heat vary with temperature, the same trends as per Fig. 4a), indicating that the heat flux depended much more strongly on the variations in mass flux than temperature changes during this period.
At CS, we have overlap in the Pitot-tube and MultiGAS instrument data that allows us to compare the data collected by these instruments from closely spaced outings. For example, in terms of steam flux the Pitot-tube data from 15 June 2020 show that CSC+CSN+CSS emitted around . The flux estimated from MultiGAS measurements at CS on 22 May 2020 were . These MultiGAS estimates are almost an order of magnitude times lower than those from the Pitot-tube, and Fig. 4 indicates that this is systematically the case. Whilst we have attempted to correct for the quantity of condensed vapour that is undetectable by the MultiGAS, additional errors in this calculation are likely to be primarily responsible for the difference between these two values, although they agree to within an order of magnitude and appear to show qualitatively the same temporal variations.
Thermal springs heat and mass fluxes
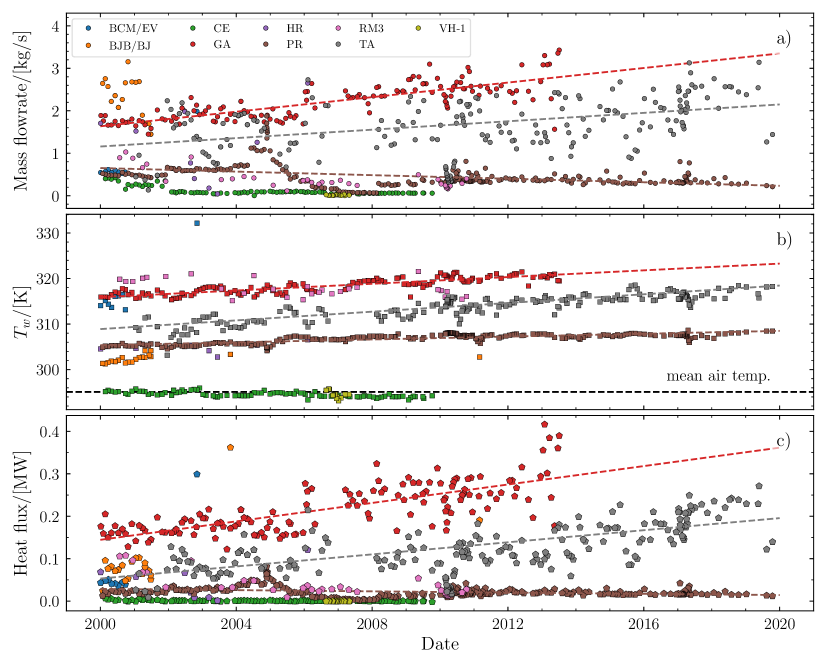
In Fig. 5, we present the mass flow rate and temperature measured over the period between 2000 and 2020 (a subset of the entire data set, see Villemant et al., 2005, Fig. 5a and b), as well as the heat flux calculated from this via Eq. (10) (Fig. 5c). Whilst the flow rate and temperature measurements have continued until the present day, there are gaps in the mass and heat flux data during 2014–2016 due to instrument failures. The GA, Tarade spring (TA), Bains Jaunes (BJ) and Pas du Roy (PR) springs are amongst the most accessible and this is reflected in both the abundance and persistence of the measurements in the OVSG database. They are also the most representative of acid-sulphate thermal springs linked to La Soufrière’s hydrothermal activity. This record does not reflect the absolute total mass/thermal output of the thermal springs as i) other sites are known but are far less accessible or impractical to measure and ii) some sites may not yet have been discovered. However, particularly as GA and TA have the largest known flow rates, it is likely that these calculations are nonetheless representative of the total budget for the thermal springs. We fitted linear trends to the data for TA, GA and PR, and extrapolated where necessary to project the values to the current date.
Overall, we see that both mass flow rate and water temperature have slowly and steadily increased over time in an approximately linear fashion. For example, the flow rate at TA increased from around in 2010 to at present whilst its temperature rose from 309 to . Only the TA and PR sites have data that cover the whole data range and manual measurements stopped at GA in 2014. Historically, GA dominates the heat budget for the thermal springs, and has almost double the output of TA. Summing over these three sites, we find that the total heat flux from the thermal springs is around (including the extrapolated trend for GA).
Discussion
Comparison of steam and heat flux estimation methods
Fumarole flux
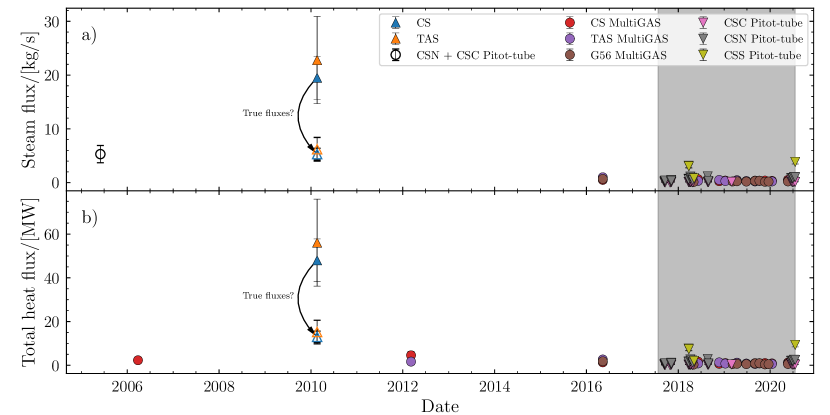
Our measurements (Fig. 6) show that the plume mass and heat fluxes have not undergone extensive evolution since August 2005. With this in mind, we must consider that the fumarole plume heat and mass flux estimates of Gaudin et al. (2016) to be excessively high. In their discussion, the order of magnitude discrepancy with the estimations from MultiGAS traverses (Allard et al., 2014) was mostly attributed to the MultiGAS studies not accounting for condensed water vapour. However, we note several key assumptions in Gaudin et al. (2016) that may have led to systematic errors in their estimations:
-
•
Plume thickness grows linearly with distance from the vent , , and not . This latter scaling is for the height of the plume axis from the ground (Slawson and Csanady, 1967), so that their mass flux integral overestimated the plume area.
-
•
The plume section was assumed to be axisymmetric though this is generally not true: wind-blown plumes from smoke stacks, cooling towers and in laboratory experiments have been shown to be more broad (horizontally) than thick (vertically, Contini and Robins, 2001). Thus, transmissivity calculated looking horizontally through a plume would have been lower than was actually the case, leading to an overestimation of plume temperature. Consequently the plume density and thus the mass flow rate should be lower than the given estimations.
-
•
The vapour carrying capacity of the plume was assumed to be equal to that of the atmosphere. However, as plume temperatures are higher than atmospheric and more water vapour can therefore be carried without condensing, this relationship does not hold.
Overall, this suggests that a more realistic plume flux for 2010 would be more in line with the MultiGAS (taking into account condensed vapour) and Pitot-tube measurements, that is a steam flux of for CS. Thus taking the Pitot-tube measurement at CS as the ground truth, we found a scaling factor for the MultiGAS measurements. Using this to scale the MultiGAS flux for TAS gives . Likewise, we find heat fluxes of for CS and for TAS (see Table 2) for the 2010 study.
Moreover, despite some assumptions, our results show that MultiGAS traverses and Pitot-tube measurements provide qualitatively coherent vent flux estimations yet quantifying the steam flux using MultiGAS is a challenge, particularly in a tropical atmosphere with 100% RH. To overcome this shortcoming, we take the H2O/CO2 ratio determined from Giggenbach bottle sampling (OVSG-IPGP 2017-2020; Moretti et al., 2020b) and multiply this by the CO2 flux estimated from the MultiGAS data. As this ratio is measured at the vent, it is not subject to a loss of matter due to condensation contrary to measurements within the plume. The resulting fluxes at CS resemble much more closely the Pitot-tube-derived fluxes (see “Reworked CS MG data” in Fig. 4). This correlation starkly indicates the difficulties in accounting for condensed volcanogenic vapour in the MultiGAS steam-flux estimations. Nevertheless, in a monitoring context, either or both methods could be applied in various volcanoes worldwide to estimate their mass and heat fluxes.
Ground flux
Although we have used the same model for as Gaudin et al. (2016), we obtain slightly different values simply due to differing weather conditions (compare and for the summit and flanks, respectively, with as derived from data in Table 2 of Gaudin et al., 2013). Thus, similarity between the results of our study and those of Gaudin et al. (2013) at the same site would be suggestive of a decrease in temperature at that site. A good comparison can be made at the FTY sites. We note in particular that the mean total heat flux density for FTY0 + FTY1 sites combined, , is in strong agreement with the heat flux density calculated from temperature gradient measurements of (Gaudin et al., 2013), which suggests that, on average, temperatures have not decreased (the ambient temperature during the 2010 survey and ours was approximately in both cases). It is somewhat unclear precisely where Gaudin et al. (2016) defined the boundary of FTY and, indeed, their Fig. 1 suggests that this might extend into what we define as Ravine Claire, so judging the evolution of the extent of this site is difficult. However, taking uncertainties into account, the present-day total flux for FTY0+FTY1+RC of is not too dissimilar to the reported in 2010.
Given the angular resolution of the thermal camera and camera-to-ground distances of 50–, this equates to a pixel length of between 0.08 and . As fumaroles are often of smaller dimension than the resolution length-scale, especially when recording from greater distances, their temperature is integrated over the pixel area along with the cooler surroundings and so pixels that cover thermally non-homogeneous ground will display temperatures lower than the true temperature of the hotter object. Harris et al. (2009) demonstrated that, at a distance of 100 m, the pixel-integrated temperature of a cm () fumarole in a pixel was lower than the actual temperature by . Taking this into account, we must consider that the fluxes that we calculate are minimum estimates, emphasising the importance of the ground heat flux for La Soufrière.
Total heat budget
As noted by Gaudin et al. (2016), some heat loss may be undetectable by the methods described in this work, due to either vegetation cover (e.g. on the flanks) or temperature changes that are below the instrument resolution (cf. summit in the region of CS). As per their work, we note that the “background” heat conducted through the system, as deduced from borehole measurements and extrapolated to the scale of the dome adds only an additional . Furthermore, we note that some heat will be transported by gases other than steam, notably CO2 in the plume and, in particular, CO2 soil degassing which is a widely-used proxy for heat flux (cf. Chiodini et al., 1998; Bloomberg et al., 2014; Harvey et al., 2015). A detailed study is beyond the scope of this present work but we may make progress under the following assumptions:
-
1.
Passive CO2 degassing occurs in the same areas and to the same extent as the ground thermal anomalies.
-
2.
The ground heat flux, , calculated above equals the underground convection of steam, .
-
3.
The CO2/H2O ratio in areas of soil degassing is the same as in the fumaroles (Chiodini et al., 2001).
Under assumption (2), based on a typical anomaly temperature of and ambient temperature of . Based on a H2O/CO2 ratio of 43.5 (OVSG-IPGP, 2020), this gives and thus .
Clearly, although comparable to the contributions of certain thermal springs, heat transport by CO2 does not add significantly to the total budget. Nevertheless, due to the accelerating spread of the altered zones and the fact that the area over which CO2 degassing occurs may be far greater than that involved in degassing of water vapour (cf. Chiodini et al., 2005), the OVSG has begun to carry out joint surveys of soil temperature profiling and CO2 flux (via the accumulation chamber technique, Chiodini et al., 1998) in order to further constrain ground heat losses and we will return to this issue in a forthcoming paper.
Summing the fumarole (, 77.5%), ground (, 20.8%) and the thermal springs fluxes ( 1.5%), we obtain a total heat output of (see Table 2).
Temporal evolution
La Soufrière has undergone a significant evolution of its activity during 2010–2020 as described and analysed in detail by Moretti et al. (2020a) and OVSG-IPGP (2014-2020). This can be summarised as follows:
-
1.
The appearance of new fumarolic vents and the reactivation of pre-existing fumaroles with local high-velocity degassing.
-
2.
Vegetation die-off near-to and far-from active vents (see Supplementary Material Fig. 1).
-
3.
The enlargement of a major extensive area of heated ground on the summit areas that progresses towards the North from the Fracture Napoléon (see below and Supplementary Material Fig. 2).
-
4.
More frequent and stronger seismic events including felt events (M4.1, April 2018).
-
5.
An acceleration in the opening rate of several summit fractures.
-
6.
The appearance of new mineralised water springs at the base of the volcano as a result of the rapid cooling of hydrothermal fluids.
Undoubtedly the greatest phenomenological change at the summit of La Soufrière is indeed the appearance and spread of the ground thermal anomaly in the ZFNN region. For example, the heated area at the summit has gone from an estimated in 2010 (Gaudin et al., 2016) to for the present study. Indeed, whereas Gaudin et al. (2016) identified thermal anomalies along the Napoléon fracture and in the craters containing the CS fumaroles, they calculated that the associated heat losses were by radiation and by forced convection. The present-day radiative and convective fluxes of and have increased by an order of magnitude between 2010 and 2020, which is in large part due to this increase in heated area and also, to a lesser degree, because of increased temperatures. The total heat flux density presently estimated at is greater than the 2010 estimate of , and thus suggests an increase in thermal intensity at the summit, though these values are within the bounds of measurement uncertainty.
Apart from the pulse of unrest around March–April 2018, the fumarolic fluxes have not changed considerably since early 2018 (Fig. 4), and the thermal spring fluxes have increased only slightly (Fig. 5) over the past 20 years. To gain a greater perspective of the overall temporal evolution of plume fluxes over a similar period, we plot in Fig. 6 our data along with the steam and heat fluxes taken from Allard et al. (2014), Gaudin et al. (2016) and Tamburello et al. (2019). This figure shows that our current data are, given the natural variability of these fluxes, consistent with the previous MultiGAS measurements of Allard et al. (2014) and Tamburello et al. (2019). They are far more consistent with the Pitot-tube measurement for the CSN + CSC vents cited in Gaudin et al. (2016) than the fluxes that they derived from analysis of thermal images (compare their value of to the contemporary sum for CSN + CSC of around , Fig. 4a).
Three major swarms of VT earthquakes occurred from 1 February to 28 April 2018, with the third swarm initiated by the off-volcanic axis M4.1 earthquake which struck at 00:32 UTC on 28 April and was widely felt throughout Guadeloupe. In particular, as reported in Moretti et al. (2020a), a short-lived increase in plume flux occurred concurrently with temperature increases before the earthquakes, but both observables had returned to background levels before the M4.1 event on 27 April 2018. Hence, our Pitot-tube flux results illustrate the importance of these flux estimations for close monitoring of volcanic activity.
Our results combined with published data indicate that plume flux has decreased overall since these records began. Thus, given a lack of increased VT seismicity or other signs of sudden evolution in 2010, and in the light of the errors discussed above, it seems that the values reported in Gaudin et al. (2016) are anomalous. In order to provide a better comparison with the present study, we attempt to re-estimate the 2010 plume fluxes given the available data from this period (Allard et al., 2014; Gaudin et al., 2016). We suppose that, despite possible overestimation, the ratio of CS/TAS fluxes was correctly established in 2010 and that the relative standard error will remain unchanged. Thus scaling with the 2005 Pitot-tube data, for 2010 we find steam fluxes of for CS and for TAS, and heat fluxes of for CS and for TAS (Table 2).
We recalculate the thermal spring fluxes for 2010 based on an interpolation of the thermal springs time series the date of the aerial survey (see Fig. 5). These new values for the thermal springs fluxes are, in general, not appreciably different to the present values, except for TA which we find to be about half the reported value for 2010. Additionally, this process does allow us to calculate fluxes for PR, absent in the 2010 survey. Consequently, we find that the total heat flux in 2010 was likely to have been around of which the fumarolic contribution was approximately , or 95% of this total (see Table 2). This compares to the estimate of 98% by Gaudin et al. (2016).
The starkest change in the past decade is an increase in ground heat flux by greater than an order of magnitude (see Table 2), reflecting the appearance of the strong and widespread thermal anomaly in the ZFNN area in particular. Indeed, the ground heat flux has increased from of a total budget of (4%) to of (21%). Nevertheless, in terms of heat flux density across the entire edifice, the present-day mean value of is slightly higher than the estimated in 2010. Using the reworked values from Gaudin et al. (2016), fumarole heat flux has decreased at CS and TAS, decreasing from a total of to (see Table 2 and Fig. 6). However, if we also include G56, our reanalysis shows that the overall change in output is insignificant and, along with the appearance of NAPN and NPE fumaroles (which contribute negligibly to the total budget), highlights a spreading of fumarole output over the dome. Heat transport at the thermal spring sites has increased from 0.4 to . Taken together, these findings are suggestive of the edifice becoming more fractured and porous over time, allowing some of the hydrothermal fluids to escape via different pathways. The increase in porosity and fracturing may be a result of rock dissolution and weakening (e.g. Pola et al., 2012; Wyering et al., 2014; Heap et al., 2015; Mordensky et al., 2019) as a result of hydrothermal alteration, mainly by acid-sulphate fluids (Salaün et al., 2011). An increase in porosity and fractures is coherent with the increased opening rate of fractures as well as the GNSS radial horizontal displacements of 3–10 mm/year (Moretti et al., 2020a) and is corroborated by the appearance of mineralised deposits at the base of the dome in the upper northern branch of the Matylis river and in the Breislack area (Fig. 1b).
Given recent unrest events, these results are coherent with recent petrological analysis of the volcano’s last major magmatic eruption which place a shallow magma reservoir at 5– depth (Pichavant et al., 2018). Furthermore, the interpretation of the geochemistry of emitted fluids (Villemant et al., 2014; Moretti et al., 2020a, b) infers a contribution of deep magmatic gases that trigger periodic transitory heating and pressurisation of the deep hydrothermal system near the critical point of water at 2– below the summit. Despite a lack of further evidence for the ascent of magma to very shallow depths, it is important to keep in mind from a hazard perspective, that larger, more frequent, or more intense transitory pulses of hot magmatic gases could exceed the buffering capacity of the hydrothermal system bringing the overall system to critical conditions compatible with phreatic/hydrothermal eruptive unrest. Consequently we must expect that the extent and magnitude of thermal anomalies and diffuse degassing on La Soufrière will continue to increase over time and, indeed, this is evident in aerial images (cf. Figs. A.1 and A.3, supplementary material).
Comparison with other hydrothermal systems
La Soufrière’s total heat budget is on par with other major hydrothermal system volcanoes. For example, the heat output at Vulcano (Italy) was estimated at 10– from combining ground based radiometer and ASTER measurements (Mannini et al., 2019). At Whakaari, heat output estimated using crater floor soil CO2 degassing as a proxy was found to be (Bloomberg et al., 2014). Our value is somewhat smaller than Nisyros (Greece), Ischia or Campi Flegrei (both Italy) which release in the range of 40– (Chiodini et al., 2005). However, as noted by Harvey et al. (2015), whilst total heat budget is helpful for following the temporal evolution of an individual volcano, a more useful metric for comparing between systems is the heat flux density as, in many of these cases, the major component of heat flux is through diffuse soil heating so larger systems naturally tend to emit more heat. The mean ground heat flux density (combining radiative and convective fluxes) for the entire La Soufrière complex is (Table 1) which, if we consider the total heat budget over the total heated area of , the mean flux density of the currently active part of the La Soufrière complex climbs to (Tables 1 and 2). Based on the data compiled in Harvey et al. (2015) from heat flux density calculated from CO2 flux, this ranks La Soufrière amongst the world’s most powerful heat producing volcanoes, well above Whakaari (205 W/m2), Vulcano (, Mannini et al., 2019), Campi Flegrei () and Nisyros (), and roughly on par with Ischia (). Similar to La Soufrière, Vulcano, Whakaari and Ischia are also dome volcanoes and the larger heat flux densities here may indicate optimal steam transport to the surface along high-permeable pathways associated with dome emplacement: Ischia, in particular, has a fumarolic H2O/CO2 ratio similar to that at la Soufrière, (H2O/CO2=147 in 2001, Chiodini et al., 2005). This, due to the very extensive hydrothermal system at La Soufrière, indicates the dominance of heat and mass transport by water vapour generated through the interaction of hot magmatic fluids and the water table. Taken together, especially with respect to the recent evolution at the summit, these findings indicate the importance of ground heating and thermal anomalies as a precursor for unrest of volcanic sites such as La Soufrière which may be far more relevant than at caldera-type sites (e.g. Campi Flegrei or Nisyros) where CO2 degassing is far more pervasive and heat loss through the ground is dominant.
Conclusions
La Soufrière is an andesitic stratovolcano in the lesser Antilles arc with an extensive hydrothermal system that has undergone six phreatic/hydrothermal eruptions since 1635 C.E. Here, we have concentrated on using thermal measurements to highlight the changes to the system over the past two decades which cover most of the current unrest since its onset in 1992. Direct measurements were made of the temperature and mass flux at the key fumarolic emission sites and at numerous thermal springs linked to the hydrothermal activity of La Soufrière. The ground temperature at sites showing extensive thermal anomalies was determined from airborne thermal imagery. From these and ancillary measurements for ambient conditions, we have deduced heat and mass fluxes as well as heat flux densities. We have compared and discussed our measurements in light of historic data available in the literature. Based on a reinterpretation of previously published data, we deduce that fumarolic output has proportionally decreased from 95% of the total heat budget in 2010 to 78% currently, whereas ground heating has increased from 4% in 2010 to 21% currently. The present-day convective and radiative heat fluxes in the summit area of 4.94 and , respectively, have increased by an order of magnitude in the past decade which is largely due to an increase in heated area and also, to a lesser degree, because of increased temperatures. The total heat flux density presently estimated at is greater than the 2010 estimate of , and thus suggests an increase in thermal intensity at the summit, though these values are within the bounds of measurement uncertainty. These changes are explained partly by a spreading in fumarolic sites over the dome during the past decade but also, and more importantly, that ground thermal anomalies on the summit have propagated significantly in recent years. Fractures on the dome along with steady horizontal radial displacements of 3–10 mm/year have been observed over the same period. The thermal spring activity has changed little in 20 years although several of the thermal springs closest to the dome (GA, TA, BJ, PR) have shown since 2000 a steady linear increase of their temperature and heat flux rate.
We find that, in terms of heat flux density (heat loss per unit area), La Soufrière is amongst the most intense emitters of heat for volcanoes worldwide, and that its ranking has dramatically increased in recent years. With recent unrest events in mind, plus petrological evidence and geochemical analysis of magmatic fluids, we must consider that conditions with the potential to lead to phreatic/hydrothermal events currently exist at La Soufrière. Hence, La Soufrière remains the subject of continued and enhanced surveillance and research strategies to better understand the origin of unrest and track its dynamic evolution.
Acknowledgements
The authors thank: the Assistant Editor, M. R. James and two anonymous authors for their constructive comments and suggestions; the OVSG-IPGP team for logistical support and help with data collection, Pierre Agrinier, and especially Gilbert Hammouya and Olivier Crispi for data collection before 2013; Pascal Allemand and IGN for DEMs and orthophotos; the Préfecture de Guadeloupe and the pilots of the Dragon 971 helicopter base in Guadeloupe (Sécurité Civile, Ministère de l’Intérieur) for providing helicopter support; the Parc National de Guadeloupe for assistance and authorisation of research and monitoring on La Soufrière; IPGP, INSU-CNRS through the Service National d’Observation en Volcanologie (SNOV), and the Ministère pour la Transition Écologique et Solidaire (MTES) for financial support. This work has been supported by the ANR DOMOSCAN, ANR DIAPHANE, the AO-IPGP 2018 project “Depth to surface propagation of fluid-related anomalies at La Soufrière de Guadeloupe volcano (FWI): timing and implications for volcanic unrest” (coord.: R. Moretti), and the European Union’s through EUROVOLC (project No 731070). This study contributes to the IdEx Université de Paris ANR-18-IDEX-0001, is IPGP contribution number 4164 and is LabEx ClerVolc contribution number 426. MJH acknowledges funding via the INSU-CNRS project “Assessing the role of hydrothermal alteration on volcanic hazards”.
Author Contributions
DEJ collected and analysed the field data, prepared the figures and wrote the manuscript. SM, RM, DG, JCK and VR also collected and analysed field data. All authors contributed in the writing and discussion of the manuscript, and consented to its submission.
References
- Allard et al. (2014) Allard, P., Aiuppa, A., Beauducel, F., Gaudin, D., di Napoli, R., Calabrese, S., Parello, F., Crispi, O., Hammouya, G., Tamburello, G., 2014. Steam and gas emission rate from la Soufrière volcano, guadeloupe (lesser antilles): implications for the magmatic supply during degassing unrest. Chem. Geol. 384, 76–93.
- Aubert (1999) Aubert, M., 10 1999. Practical evaluation of steady heat discharge from dormant active volcanoes: case study of Vulcarolo fissure (Mount Etna, Italy). J. Volcanol. Geoth. Res. 92 (3–4), 413–429.
- Aubert et al. (1984) Aubert, M., Auby, R., Bourlet, F., Bourlet, Y., 1984. Contribution à la surveillance de l’activité de l’Etna à partir de l’étude des zones fumerolliennes. Bull. Volcanol. 47 (4), 1039–1050.
- Berk and Hawes (2017) Berk, A., Hawes, F., 2017. Validation of MODTRAN®6 and its line-by-line algorithm. J. Quant. Spectrosc. & Radiat. Transfer 203, 542–556.
- Bloomberg et al. (2014) Bloomberg, S., Werner, C., Rissmann, C., Mazot, A., Horton, T., Gravley, D., Kennedy, B., Oze, C., 2014. Soil CO2 emissions as a proxy for heat and mass flow assessment, Taupō Volcanic Zone, New Zealand. Geochemistry, Geophysics, Geosystems 15 (12), 4885–4904.
- Boichu et al. (2011) Boichu, M., Villemant, B., Boudon, G., 2011. Degassing at La Soufrière de Guadeloupe volcano (Lesser Antilles) since the last eruptive crisis in 1975–77: result of a shallow magma intrusion? J. Volcanol. Geoth. Res. 203 (3), 102–112.
- Bombrun et al. (2018) Bombrun, M., Jessop, D. E., Harris, A. J. L., Barra, V., 2018. An algorithm for the detection and characterisation of volcanic plumes using thermal camera imagery. J. Volcanol. Geoth. Res. 352, 26–37.
- Boudon et al. (2008) Boudon, G., Komorowski, J.-C., Villemant, B., Semet, M. P., 2008. A new scenario for the last magmatic eruption of La Soufrière of Guadeloupe (Lesser Antilles) in 1530 AD: evidence from stratigraphy, radiocarbon dating and magmatic evolution of erupted products. J. Volcanol. Geoth. Res. 178 (3), 474–490.
- Brombach et al. (2000) Brombach, T., Marini, L., Hunziker, J., 2000. Geochemistry of the thermal springs and fumaroles of Basse-Terre Island, Guadeloupe, Lesser Antilles. Bull. Volcanol. 61 (7), 477–490.
- Brothelande et al. (2014) Brothelande, E., Finizola, A., Peltier, A., Delcher, E., Komorowski, J.-C., Di Gangi, F., Borgogno, G., Passarella, M., Trovato, C., Legendre, Y., 2014. Fluid circulation pattern inside La Soufrière volcano (Guadeloupe) inferred from combined electrical resistivity tomography, self-potential, soil temperature and diffuse degassing measurements. J. Volcanol. Geoth. Res. 288, 105–122.
- Chiodini et al. (1998) Chiodini, G., Cioni, R., Guidi, M., Raco, B., Marini, L., 1998. Soil CO2 flux measurements in volcanic and geothermal areas. Appl. Geochem. 13 (5), 543–552.
- Chiodini et al. (2001) Chiodini, G., Frondini, F., Cardellini, C., Granieri, D., Marini, L., Ventura, G., 2001. CO2 degassing and energy release at Solfatara volcano, Campi Flegrei, Italy. J. Geophys. Res.-Solid Earth 106 (B8), 16213–16221.
- Chiodini et al. (2005) Chiodini, G., Granieri, D., Avino, R., Caliro, S., Costa, A., Werner, C., 2005. Carbon dioxide diffuse degassing and estimation of heat release from volcanic and hydrothermal systems. J. Geophys. Res.-Solid Earth 110 (B8).
- Contini and Robins (2001) Contini, D., Robins, A., 2001. Water tank measurements of buoyant plume rise and structure in neutral crossflows. Atmos. Environ. 35 (35), 6105–6115.
- de Vries et al. (2000) de Vries, B. v. W., Kerle, N., Petley, D., 02 2000. Sector collapse forming at Casita volcano, Nicaragua. Geology 28 (2), 167–170.
- Di Renzo et al. (2016) Di Renzo, V., Wohletz, K., Civetta, L., Moretti, R., Orsi, G., Gasparini, P., 2016. The thermal regime of the Campi Flegrei magmatic system reconstructed through 3D numerical simulations. J. Volcanol. Geoth. Res. 328, 210–221.
- Feuillard (2011) Feuillard, M., 2011. La Soufrière de la Guadeloupe: un volcan et un peuple. Éd. Jasor.
- Feuillard et al. (1983) Feuillard, M., Allegre, C., Brandeis, G., Gaulon, R., Mouel, J. L., Mercier, J., Pozzi, J., Semet, M., 1983. The 1975–1977 crisis of la Soufrière de Guadeloupe (F.W.I): a still-born magmatic eruption. J. Volcanol. Geoth. Res. 16 (3), 317–334.
- Fischer and Chiodini (2015) Fischer, T. P., Chiodini, G., 2015. Volcanic, magmatic and hydrothermal gases. In: The encyclopedia of volcanoes. Elsevier, pp. 779–797.
- Gaudin et al. (2013) Gaudin, D., Beauducel, F., Allemand, P., Delacourt, C., Finizola, A., 2013. Heat flux measurement from thermal infrared imagery in low-flux fumarolic zones: example of the Ty fault (la Soufrière de Guadeloupe). J. Volcanol. Geoth. Res. 267 (0), 47–56.
- Gaudin et al. (2016) Gaudin, D., Beauducel, F., Coutant, O., Delacourt, C., Richon, P., de Chabalier, J.-B., Hammouya, G., 2016. Mass and heat flux balance of La Soufrière volcano (Guadeloupe) from aerial infrared thermal imaging. J. Volcanol. Geoth. Res. 320, 107–116.
- Gaudin et al. (2015) Gaudin, D., Finizola, A., Delcher, E., Beauducel, F., Allemand, P., Delacourt, C., Brothelande, E., Peltier, A., Di Gangi, F., 2015. Influence of rainfalls on heat and steam fluxes of fumarolic zones: six months records along the Ty Fault (Soufrière of Guadeloupe, Lesser Antilles). J. Volcanol. Geoth. Res. 302, 273–285.
- Gibbings (1986) Gibbings, J. C., 1986. The systematic experiment, first edition Edition. Cambridge University Press.
- Giggenbach (1975) Giggenbach, W. F., 03 1975. A simple method for the collection and analysis of volcanic gas samples. Bull. Volcanol. 39, 132–145.
- Hardee (1982) Hardee, H. C., 1982. Permeable convection above magma bodies. Tectonophysics 84 (2–4), 179–195.
- Harris (2013) Harris, A. J. L., 2013. Thermal remote sensing of active volcanoes: a user’s manual. Cambridge University Press.
- Harris et al. (2009) Harris, A. J. L., Lodato, L., Dehn, J., Spampinato, L., 2009. Thermal characterization of the Vulcano fumarole field. Bull. Volcanol. 71 (4), 441–458.
- Harris and Maciejewski (2000) Harris, A. J. L., Maciejewski, A. J. H., 2000. Thermal surveys of the vulcano fossa fumarole field 1994-1999: evidence for fumarole migration and sealing. J. Volcanol. Geoth. Res. 102 (1–2), 119–147.
- Harris and Stevenson (1997) Harris, A. J. L., Stevenson, D. S., 1997. Thermal observations of degassing open conduits and fumaroles at Stromboli and Vulcano using remotely sensed data. J. Volcanol. Geoth. Res. 76 (3–4), 175–198.
- Harvey et al. (2015) Harvey, M. C., Rowland, J. V., Chiodini, G., Rissmann, C. F., Bloomberg, S., Hernández, P. A., Mazot, A., Viveiros, F., Werner, C., 2015. Heat flux from magmatic hydrothermal systems related to availability of fluid recharge. J. Volcanol. Geoth. Res. 302, 225–236.
- Heap et al. (2015) Heap, M. J., Kennedy, B. M., Pernin, N., Jacquemard, L., Baud, P., Farquharson, J. I., Scheu, B., Lavallée, Y., Gilg, H. A., Letham-Brake, M., Mayer, K., Jolly, A. D., Reuschlé, T., Dingwell, D. B., 2015. Mechanical behaviour and failure modes in the Whakaari (White Island volcano) hydrothermal system, New Zealand. J. Volcanol. Geoth. Res. 295, 26–42.
- Heap et al. (2020) Heap, M. J., Kushnir, A. R., Vasseur, J., Wadsworth, F. B., Harlé, P., Baud, P., Kennedy, B. M., Troll, V. R., Deegan, F. M., 2020. The thermal properties of porous andesite. J. Volcanol. Geoth. Res. 398, 106901.
- Heap et al. (2019) Heap, M. J., Troll, V. R., Kushnir, A. R. L., Gilg, H. A., Collinson, A. S. D., Deegan, F. M., Darmawan, H., Seraphine, N., Neuberg, J., Walter, T. R., 2019. Hydrothermal alteration of andesitic lava domes can lead to explosive volcanic behaviour. Nat. Commun. 10 (1), 5063.
- Hedenquist and Lowenstern (1994) Hedenquist, J., Lowenstern, J., 1994. The role of magmas in the formation of hydrothermal ore-deposits. Nature 370 (6490), 519–527.
- Hincks et al. (2014) Hincks, T. K., Komorowski, J.-C., Sparks, S. R., Aspinall, W. P., 2014. Retrospective analysis of uncertain eruption precursors at la Soufrière volcano, Guadeloupe, 1975–77: volcanic hazard assessment using a Bayesian Belief Network approach. J. Appl. Volcanol. 3 (1), 1–26.
- John et al. (2008) John, D. A., Sisson, T. W., Breit, G. N., Rye, R. O., Vallance, J. W., 2008. Characteristics, extent and origin of hydrothermal alteration at Mount Rainier Volcano, Cascades Arc, USA: implications for debris-flow hazards and mineral deposits. J. Volcanol. Geoth. Res. 175 (3), 289–314.
- Kochanov et al. (2016) Kochanov, R., Gordon, I., Rothman, L., Wcisło, P., Hill, C., Wilzewski, J., 2016. HITRAN Application Programming Interface (HAPI): a comprehensive approach to working with spectroscopic data. J. Quant. Spectrosc. & Radiat. Transfer 177, 15–30, xVIIIth Symposium on High Resolution Molecular Spectroscopy (HighRus-2015), Tomsk, Russia.
- Komorowski et al. (2001) Komorowski, J., Boudon, G., Antenor-Habazac, C., Hammouya, G., Semet, M., David, J., Beauducel, F., Cheminée, J., Feuillard, M., 2001. L’activité éruptive et non-éruptive de la Soufrière de Guadeloupe: problèmes et implications de la phénoménologie et des signaux actuellement enregistrés (French). Eruptive and non-eruptive activity from La Soufrière of Guadeloupe: problems and implications posed by the current phenomenology and monitoring signals. Workshop on volcanic hazards - Lesser Antilles volcanoes: from processes to signals. In: INSU Lesser Antilles Volcanic Hazard Workshop, Paris. pp. 18–19.
- Komorowski et al. (2005) Komorowski, J.-C., Boudon, G., Semet, M., Beauducel, F., Anténor-Habazac, C., Bazin, S., Hammouya, G., 2005. Guadeloupe. In: Lindsay, J., Robertson, R., Shepherd, J., Ali, S. (Eds.), Volcanic hazard atlas of the Lesser Antilles. pp. 65–102.
- Ku (1966) Ku, H. H., 1966. Notes on the use of propagation of error formulas. J. Res. Nat. Bureau Stand. 70 (4), 263–273.
- Lardy and Tabbagh (1999) Lardy, M., Tabbagh, A., 1999. Measuring and interpreting heat fluxes from shallow volcanic bodies using vertical temperature profiles: a preliminary test. Bull. Volcanol. 60 (6), 441–447.
- Legendre (2012) Legendre, Y., 2012. Reconstruction fine de l’histoire éruptive et scenarii éruptifs à la soufrière de guadeloupe : vers un modèle intégré de fonctionnement du volcan. Ph.D. thesis, IPGP, 2012PA077065.
- Lesparre et al. (2012) Lesparre, N., Gibert, D., Marteau, J., Komorowski, J.-C., Nicollin, F., Coutant, O., 2012. Density muon radiography of La Soufrière of Guadeloupe volcano: comparison with geological, electrical resistivity and gravity data. Geophysical Journal International 190 (2), 1008–1019.
- López and Williams (1993) López, D. L., Williams, S. N., 1993. Catastrophic volcanic collapse: relation to hydrothermal processes. Science 260 (5115), 1794–1796.
- Mannini et al. (2019) Mannini, S., Harris, A. J. L., Jessop, D. E., Chevrel, M. O., Ramsey, M. S., 2019. Combining ground- and ASTER-based thermal measurements to constrain fumarole field heat budgets: the case of Vulcano Fossa 2000-2019. Geophys. Res. Lett.
- Massey and Ward-Smith (1998) Massey, B., Ward-Smith, J., 1998. Mechanics of fluids, seventh Edition. Stanley Thornes ltd., p. 383.
- Matsushima et al. (2003) Matsushima, N., Kazahaya, K., Saito, G., Shinohara, H., 2003. Mass and heat flux of volcanic gas discharging from the summit crater of Iwodake volcano, Satsuma-Iwojima, Japan, during 1996-1999. J. Volcanol. Geoth. Res. 126 (3–4), 285–301.
- Mordensky et al. (2019) Mordensky, S. P., Heap, M. J., Kennedy, B. M., Gilg, H. A., Villeneuve, M. C., Farquharson, J. I., Gravley, D. M., 2019. Influence of alteration on the mechanical behaviour and failure mode of andesite: implications for shallow seismicity and volcano monitoring. Bull. Volcanol. 81 (8), 44.
- Moretti et al. (2020a) Moretti, R., Komorowski, J.-C., Ucciani, G., Moune, S., Jessop, D., de Chabalier, J.-B., Beauducel, F., Bonifacie, M., Burtin, A., Vallée, M., Deroussi, S., Robert, V., Gibert, D., Didier, T., Kitou, T., Feuillet, N., Allard, P., Tamburello, G., Shreve, T., Saurel, J.-M., Lemarchand, A., Rosas-Carbajal, M., Agrinier, P., Friant, A. L., Chaussidon, M., 2020a. The 2018 unrest phase at La Soufrière of Guadeloupe (French West Indies) andesitic volcano: scrutiny of a failed but prodromal phreatic eruption. J. Volcanol. Geoth. Res., 106769.
- Moretti et al. (2020b) Moretti, R., Moune, S., Robert, V., Jessop, D. E., Didier, T., Bonifacie, M., Kitou, T., Komorowski, J.-C., 2020b. Intercomparison of geochemical techniques at La Soufrière de Guadeloupe (FWI) volcano: their advantages and their limits over a long-standing unrest. Ital. J. Geosci.
- Moretti and Stefansson (2020) Moretti, R., Stefansson, A., 2020. Volcanic and geothermal redox engines. Elements 16, 179–184.
- Moussallam et al. (2017) Moussallam, Y., Tamburello, G., Peters, N., Apaza, F., Schipper, C. I., Curtis, A., Aiuppa, A., Masias, P., Boichu, M., Bauduin, S., et al., 2017. Volcanic gas emissions and degassing dynamics at Ubinas and Sabancaya volcanoes; implications for the volatile budget of the central volcanic zone. J. Volcanol. Geoth. Res. 343, 181–191.
- Neri (1998) Neri, A., 1998. A local heat transfer analysis of lava cooling in the atmosphere: application to thermal diffusion-dominated lava flows. J. Volcanol. Geoth. Res. 81 (3), 215–243.
- Pichavant et al. (2018) Pichavant, M., Poussineau, S., Lesne, P., Solaro, C., Bourdier, J. L., 2018. Experimental parametrization of magma mixing: application to the AD 1530 eruption of La Soufrière, Guadeloupe (Lesser Antilles). J. Petrol. 59 (2), 257–282.
- Pola et al. (2012) Pola, A., Crosta, G., Fusi, N., Barberini, V., Norini, G., 2012. Influence of alteration on physical properties of volcanic rocks. Tectonophysics 566-567, 67–86.
- Pouget et al. (2015) Pouget, S., Bursik, M., Johnson, C. G., Hogg, A. J., Phillips, J. C., Sparks, R. S. J., 2015. Interpretation of umbrella cloud growth and morphology: implications for flow regimes of short-lived and long-lived eruptions. Bulletin of Volcanology 78 (1).
- Reid (2004) Reid, M. E., 05 2004. Massive collapse of volcano edifices triggered by hydrothermal pressurization. Geology 32 (5), 373–376.
- Reid et al. (2001) Reid, M. E., Sisson, T. W., Brien, D. L., 09 2001. Volcano collapse promoted by hydrothermal alteration and edifice shape, Mount Rainier, Washington. Geology 29 (9), 779–782.
- Rosas-Carbajal et al. (2016) Rosas-Carbajal, M., Komorowski, J.-C., Nicollin, F., Gibert, D., 2016. Volcano electrical tomography unveils edifice collapse hazard linked to hydrothermal system structure and dynamics. Sci. Rep. 6.
- Rupnik et al. (2017) Rupnik, E., Daakir, M., Pierrot Deseilligny, M., 2017. MicMac – a free, open-source solution for photogrammetry. Open Geospatial Data, Software and Standards 2 (1), 14.
- Ruzié et al. (2013) Ruzié, L., Aubaud, C., Moreira, M., Agrinier, P., Dessert, C., Gréau, C., Crispi, O., 2013. Carbon and helium isotopes in thermal springs of la Soufrière volcano (Guadeloupe, Lesser Antilles): implications for volcanological monitoring. Chemical Geology 359, 70–80.
- Salaün et al. (2011) Salaün, A., Villemant, B., Gérard, M., Komorowski, J.-C., Michel, A., 2011. Hydrothermal alteration in andesitic volcanoes: trace element redistribution in active and ancient hydrothermal systems of Guadeloupe (Lesser Antilles). J. Geochem. Explor. 111 (3), 59–83.
- Sekioka and Yuhara (1974) Sekioka, M., Yuhara, K., 1974. Heat flux estimation in geothermal areas based on the heat balance of the ground surface. J. Geophys. Res.-Solid Earth 79 (14), 2053–2058.
- Sigurdsson et al. (2015) Sigurdsson, H., Houghton, B., McNutt, S., Rymer, H., Stix, J. (Eds.), 2015. The Encyclopedia of Volcanoes. Elsevier Science.
- Slawson and Csanady (1967) Slawson, P. R., Csanady, G. T., 1967. On mean path buoyant bent-over chimney plumes. J. Fluid Mech. 28 (Part 2), 311–&.
- Stevenson (1993) Stevenson, D. S., 1993. Physical models of fumarolic flow. J. Volcanol. Geoth. Res. 57 (3–4), 139–156.
- Stimac et al. (2015) Stimac, J., Goff, F., Goff, C. J., 2015. Intrusion-related geothermal systems. In: Sigurdsson, H., Houghton, B., McNutt, S., Rymer, H., Stix, J. (Eds.), The Encyclopedia of Volcanoes, second edition Edition. Academic Press, Amsterdam, Ch. 46, pp. 799–822.
- Tamburello (2015) Tamburello, G., 2015. Ratiocalc: software for processing data from multicomponent volcanic gas analyzers. Comp. Geosci. 82, 63–67.
- Tamburello et al. (2019) Tamburello, G., Moune, S., Allard, P., Venugopal, S., Robert, V., Rosas-Carbajal, M., Deroussi, S., Kitou, G.-T., Didier, T., Komorowski, J.-C., Beauducel, F., De Chabalier, J.-B., Le Marchand, A., Le Friant, A., Bonifacie, M., Dessert, C., Moretti, R., 2019. Spatio-temporal relationships between fumarolic activity, hydrothermal fluid circulation and geophysical signals at an arc volcano in degassing unrest: la Soufrière of Guadeloupe (French West Indies). Geosci. 9 (11).
- Villemant et al. (2005) Villemant, B., Hammouya, G., Michel, A., Semet, M. P., Komorowski, J. C., Boudon, G., Cheminee, J. L., 2005. The memory of volcanic waters: shallow magma degassing revealed by halogen monitoring in thermal springs of La Soufriére volcano (Guadeloupe, Lesser Antilles). Earth Planet. Sci. Let. 237 (3–4), 710–728.
- Villemant et al. (2014) Villemant, B., Komorowski, J., Dessert, C., Michel, A., Crispi, O., Hammouya, G., Beauducel, F., Chabalier, J.-B. D., 2014. Evidence for a new shallow magma intrusion at La Soufrière of Guadeloupe (Lesser Antilles): insights from long-term geochemical monitoring of halogen-rich hydrothermal fluids. J. Volcanol. Geoth. Res. 285, 247–277.
- Wagner and Pruß (1993) Wagner, W., Pruß, A., 1993. International equations for the saturation properties of ordinary water substance. Revised according to the International Temperature Scale of 1990. Addendum to J. Phys. Chem. Ref. Data 16, 893 (1987). J. Phys. Chem. Ref. Data 22 (3), 783–787.
- Wagner and Pruß (2002) Wagner, W., Pruß, A., 2002. The IAPWS formulation 1995 for the thermodynamic properties of ordinary water substance for general and scientific use. J. Phys. Chem. Ref. Data 31 (2), 387–535.
- Wyering et al. (2014) Wyering, L., Villeneuve, M., Wallis, I., Siratovich, P., Kennedy, B., Gravley, D., Cant, J., 2014. Mechanical and physical properties of hydrothermally altered rocks, taupo volcanic zone, new zealand. J. Volcanol. Geoth. Res. 288, 76–93.
- Zlotnicki et al. (1992) Zlotnicki, J., Boudon, G., Mouël, J.-L. L., 1992. The volcanic activity of la Soufrière of Guadeloupe (Lesser Antilles): structural and tectonic implications. J. Volcanol. Geoth. Res. 49 (1), 91–104.
Summit Matylis (lower) Ravine Claire FTY0 FTY1 Total/Mean∗ Rad. flux density, /[W/m2] 52 76 50 71 62 54.59 Conv. flux density, /[W/m2] 350 455 310 432 383 351.16 Total heat flux density/[W/m2] 403 531 360 504 446 405.75 Radiative flux, /[MW] 0.74 0.12 0.40 0.10 0.07 1.43 Convective flux, /[MW] 4.94 0.74 2.49 0.63 0.42 9.23 Total ()/[MW] 5.67 0.87 2.89 0.74 0.49 10.66 Heated area/[m2] 14070 1630 8010 1460 1100 26270
Flux Year Fumaroles Ground thermal anomaly Hot springs Total CS G56 TAS Total Summit FTY Flanks∗ Total GA PR TA Total Mass [kg/s] 2010 - - - - - 2.5 - 1.5 4.5 () () () (2.51) (0.44) (1.61) (4.56) () 2020 () () () - - - - 3.35 0.44 1.61 5.40 () Heat [MW] 2010 - - 0.3 - 0.2 0.5 () () () (0.25) (0.02) (0.12) (0.39) () 2020 () () () 0.36 0.01 0.19 0.56 ()