Multi-view Graph Contrastive Representation Learning for Drug-Drug Interaction Prediction
Abstract.
Potential Drug-Drug Interactions (DDI) occur while treating complex or co-existing diseases with drug combinations, which may cause changes in drugs’ pharmacological activity. Therefore, DDI prediction has been an important task in the medical health machine learning community. Graph-based learning methods have recently aroused widespread interest and are proved to be a priority for this task. However, these methods are often limited to exploiting the inter-view drug molecular structure and ignoring the drug’s intra-view interaction relationship, vital to capturing the complex DDI patterns. This study presents a new method, multi-view graph contrastive representation learning for drug-drug interaction prediction, MIRACLE for brevity, to capture inter-view molecule structure and intra-view interactions between molecules simultaneously. MIRACLE treats a DDI network as a multi-view graph where each node in the interaction graph itself is a drug molecular graph instance. We use GCN to encode DDI relationships and a bond-aware attentive message propagating method to capture drug molecular structure information in the MIRACLE learning stage. Also, we propose a novel unsupervised contrastive learning component to balance and integrate the multi-view information. Comprehensive experiments on multiple real datasets show that MIRACLE outperforms the state-of-the-art DDI prediction models consistently.
1. Introduction
Drugs may interact with each other when drug combinations occur, which will alter their effects. Such situations can increase the risk of patients’ death or drug withdrawal, particularly in the elderly, with a prevalence of 20-40%(Palleria et al., 2013). Recent studies estimate that 6.7% of the US hospitalized patients have severe adverse drug reactions with a fatality rate of 0.32%(Lazarou et al., 1998). However, polypharmacy is inevitable because the concurrent use of multiple medications is necessary for treating diseases that are often caused by complex biological processes that resist the activity of any single drug. Hence, there is a practical necessity to identify the interaction of drugs.
Meanwhile, detection of DDI remains a challenging task: traditional wet chemical experiments are expensive and cumbersome, and too small in scale, limiting the efficiency of DDI detection. Besides, there are tedious and time-consuming clinical tests and patient follow-up afterward. These problems make it urgent to develop a new, computationally assisted DDI prediction method.
The machine learning methods facilitate the computer-assisted DDI prediction. Prior traditional machine learning approaches focus mainly on inputting various fingerprints or similarity-based features such as (Vilar et al., 2014). Among them, in the early years, research works like (Vilar et al., 2012) are designed simple, which only consider single fingerprint. After 2014, plenty of research works based on multi-source heterogeneous fingerprints flourish. Kastrin et al. (2018) establishes a logistic regression model with similarity-based features that are constructed on side effects and physiological effects as inputs. Using features including multi-dimensional molecular structures, individual drug side effects, and interaction profile fingerprints, Ryu et al. (2018) applies various deep learning-based methods to integrate different types of inputs and obtain drug latent representations to detect DDI.
In recent years, many graph representation learning-based methods have been applied to extract features from raw molecular graph data. Zitnik et al. (2018) constructs a heterogeneous network including drug and protein entities and uses graph convolutional networks (GCN)(Kipf and Welling, 2017) to learn their latent representations and predict possible adverse drug side effects occurring in drug combinations. Ma et al. (2018a) proposes a method integrating multi-view similarity-based features by attention mechanism, where a view refers to a similarity matrix constructed by a feature and learns drug representations with graph autoencoder (GAE)(Kipf and Welling, 2016). Deac et al. (2019) applies a co-attention mechanism to compute the attentional coefficients among all atoms in a pair of drugs to learn drug-drug information jointly. Chen et al. (2019) uses a siamese GCN to learn the pair-wise drug representations and make predictions with a similarity-based framework. More recently, Lin et al. (2020) merges several datasets into a vast knowledge graph with 1.2 billion triples. Through KGNN layers which embed 2-hop local structures of drugs, this model improves performance significantly. Bai et al. (2020) proposes a bi-level graph attention network to encode drugs and make DDI predictions, which is similar as our method. However, it ignores the balance of information from different levels.
Although methods mentioned above achieve satisfactory results and become the state-of-the-art, they still have some limitations. Firstly, previous models based on multiple similarity-based fingerprints require feature engineering or feature integration, which are time-consuming and challenging to collect(Chen et al., 2020). They mainly rely on the empirical assumption that chemically, biologically, or topologically similar drugs are more likely to interact with each other. However, plenty of interactive drug pairs may have relatively low pair-wise similarities, which can be misled by the model to wrong prediction results. Meanwhile, large-scale datasets may lack some features, which are crucial to DDI prediction but unavailable for most kinds of drugs. Therefore, these models have a deficiency in the scalability and robustness. Secondly, in practice, the inter-view information included in the drug molecular graph and the intra-view DDI relationships are both important for the DDI prediction task. The inter-view information contains multiple atom and bond’s features and structure information inside drug molecules. And the intra-view DDI relationships contain multiple hidden interaction patterns. However, previous graph-based works only concentrate on a single view of drugs(Chen et al., 2020). Thus, the combination of multi-view information inside the DDI network is often overlooked by these methods.
To overcome these limitations, we propose a novel method, Multi-vIew gRAph Contrastive representation LEarning for drug-drug interaction prediction, MIRACLE for brevity, to explore rich multi-view information among drugs and generate accurate latent vectors of drugs. In such a multi-view graph setting, we treat each drug instance as a molecular graph and DDI relationships as an interaction graph, namely the inter- and intra-view, respectively. In the inter-view, we first encode drug molecular graphs into drug embeddings by bond-aware message passing networks with attentive pooling to fuse information from atom and bond features and molecule structures. Then, we integrate them with the intra-view information, the external DDI relationships to update drug embeddings. Also, for the multi-view information integrated into drug embeddings, it is necessary to balance information from different views. Thus, we use a contrastive learning-based component to tackle this problem. Finally, we obtain interaction embeddings through the learned drug embeddings and make predictions. Figure 1 shows a multi-view graph in the context of a DDI network. Drug A, B, C, D denote four drugs in the DDI network. The solid and dashed lines indicate existing and possible interactions. The internal structure of each drug shows its molecular graph.
Figure 2 illustrates the framework of the proposed MIRACLE method. At first, all drug instances are modeled as molecular graphs, where each node represents an atom, and each edge is a bond. Then, each molecular graph is proceeded successively. The inter-view latent vectors for all drugs involved in the DDI network can be obtained through bond-aware message passing neural networks with attentive pooling. After that, we integrate the inter-view and intra-view information to update drug representations by a GCN encoder where we treat drug instances as nodes, the inter-view drug embeddings as node features, and the external DDI relationships as graph connectivity. For balancing information from different views better, we design a novel contrastive learning component to optimize the model by setting a mutual information maximization objective. Finally, we use a two-layer fully-connected neural network to make predictions with the interaction embeddings calculated from the obtained drug embeddings. To help MIRACLE learn the commonality between two views well, we also make predictions using the inter-view drug representations and define a disagreement loss to enforce prediction results in two views to a consistency. The main contributions of this work are summarized as follows:
-
•
We model the DDI data in a multi-view graph setting and use graph representation learning methods to capture complex interaction patterns, which is a novel perspective and has rarely been studied before.
-
•
To balance mult-view information in the drug representations, we do not rely on the supervised information only but design a novel contrastive learning component to update drug embeddings by a mutual information maximization objective.
-
•
Extensive experiments conducted on a variety of real-world datasets show that MIRACLE evidently outperforms the state-of-art methods, even with few labeled training instances.
2. Methodology
This section introduces the proposed DDI prediction approach, which is an end-to-end representation learning model consisting of three sequential and interdependent phases. At first, we define a bond-aware message passing network with attentive pooling, which encodes drug molecular graph data to corresponding low-dimensional embedding vectors. The second is an information integration module that uses a GCN encoder to integrate the inter-view drug embedding vectors with the external DDI relationships. The last is an interaction predictor, which is responsible for predicting missing interactions in a DDI Network.
The proposed model takes the SMILES representations of corresponding drug molecules and the DDI network connectivity matrix as inputs. The SMILES representations will be converted into molecular graphs via RDKit(Landrum, 2013). Meanwhile, we extract the atom list and multi-channel adjacency matrix from the molecular graphs, which will be fed into the following bond-aware message passing networks. In this section, we will depict the architecture, optimization objective, and training process.
2.1. Notations and Problem Formulation
Before presenting our proposed model, We summarize the important notations adopted in this paper. We use upper boldface letters for matrices (e.g. ), boldface letters for vectors (e.g. ), normal characters for scalars (e.g. for the dimension of molecule-level embedding, for the dimension of atom-level embedding), and calligraphic for sets (e.g. ).
Suppose that we have a graph which is presented by where is the set of vertices and is the set of edges. We denote the th atom as and the chemical bond connecting the th and th atoms as .
Problem statement. The DDI prediction task can be defined as a link prediction problem on graph. Given drug molecular graphs and DDI network where denotes the interaction links, the task link prediction can be defined as, for the network , predicting the existence of missing links.
2.2. Bond-aware Message Passing Networks with Attentive Pooling
Since the molecular graphs are complex irregular-structured data to handle, in this subsection, we use a bond-aware message passing network(BAMPN)(Gilmer et al., 2017a) to map nodes to real-value embedding vectors in the low-dimensional space. We equipped our model with propagation-based message passing layers according to simple chemistry knowledge and a graph readout layer with attentive pooling(Vaswani et al., 2017) to generate a graph-level representation.
A molecule can be served as a graph where each atom is represented as a node and each bond as an edge. We construct the node information matrix by stacking randomly initialized embedding vectors for each atom considering its nuclear charge number and a multi-channel adjacency matrix whose channel dimension indicates different chemical bond types, including single, double, triple and aromatic bond.
Given the node information matrix and multi-channel adjacency matrix as inputs, we encode them by two successive processes of message passing. The first phase can be described using the following message function:
| (1) |
where is a matrix of trainable parameters shared by the same type of chemical bond at the th layer, represents the candidate hidden state at the th layer for node , represents the hidden state at the th layer for the neighboring node , and denotes the neighboring nodes of the center node .
The equation (1) shows that the node information corresponding to the same type of chemical bond share parameters during the affine transformation. The chemical interpretability for this massage function is straightforward: neighboring nodes connected by the same type of chemical bond have similar effects, and vice versa.
Given where denotes the concatenation operation, for the second phase, inspired by (Srivastava et al., 2015), we additionally define three non-linear transforms , , and . Thus, this process can be described as the following update function:
| (2) |
where represents the hidden state at the th layer for node , and denotes the element-wise product. We refer to as the fuse gate, as the transform gate, and as the carry gate, since they express how much of the hidden state is produced by transforming the fusion of the candidate and previous hidden state and carrying it, respectively. We can take both the influence on the concentrated center node exerted by neighboring ones and itself at the previous layer into consideration through this update process.
We stack several message passing layers ( in total) to learn the hidden representation for every node/atom in a molecular graph and obtain the final hidden states for each atom at the last message passing layer. To make predictions with drug representations, we need to generate an embedding vector for each molecular graph. Therefore, we apply a simple but efficient attentive readout layer inspired by Li et al. (2016) as follows:
| (3) |
| (4) |
where denotes the concatenation operation, denotes the tanh activation function, attention score denotes the importance score of the atom , denotes the element-wise product, and is the obtained embedding vector for the molecular graph. Stacking the embedding vectors of drugs over given dataset, we get the inter-view embedding matrix . It should be noted that all of the parameters are shared across all the atoms.
2.3. GCN for Integrating Multi-view Network Information
For drug molecular graphs, after the non-linear mapping introduced above, we get low-dimensional representations of them. In order to encode the intra-view interaction information into the obtained inter-view drug embeddings, we establish a graph-based encoder to integrate the multi-view network information. Recently many graph representation learning-based methods such as Kipf and Welling (2017) have demonstrated their superiority to traditional graph-based methods such as various dimensionality reduction algorithms(Yan et al., 2006). Therefore, in this paper, we make use of GCN in terms of efficiency and effectiveness. In the following, we utilized a multi-layer GCN( in total) encoder to smooth each node’s features over the graph’s topology. In this context, we refer to the node’s features as low-dimensional representations of drugs obtained from the previous bond-aware message passing networks and the graph’s topology as the interaction relationship inside the DDI network.
Assumed the number of drugs in the DDI network is denoted by , formally, we are given the adjacency matrix of DDI network and the attribute matrix of the DDI network as inputs. Before the graph convolution operation, we normalized the adjacency matrix :
| (5) |
where represents the identity matrix and . Then we apply the GCN encoder framework as follows:
| (6) |
where and are two learnable weight parameters at the and layer of the GCN encoder, respectively. The second dimension of the learnable weight parameter at the last layer of the GCN encoder is set to . Through the GCN encoder, then we get the intra-view embedding matrix for drugs in the DDI network .
2.4. Contrastive Learning of Drug Representation
As stated in Li et al. (2018), the graph convolution operation can be considered Laplacian smoothing for nodes’ features over graph topology. The Laplacian smoothing computes the new node features as the weighted average of itself and its neighboring nodes. On the one hand, although it helps make nodes in the same cluster tend to have similar representations, it may cause the over-smoothing problem and make nodes indistinguishable. On the other hand, it will concentrates so much on node features information that makes the obtained embeddings lack structural information.
Furthermore, the inter-view drug embeddings are learned directly from molecular graphs, including raw attributes and structural information. Specifically, the representations may contain multiple functional groups’ information inside a molecule, different local connectivity constructed by various combinations of the same atoms and bonds, etc. Such information has a significant influence on interaction predictions. However, after graph convolutions, the inter-view features are smoothed over the whole DDI network topology and become blurred. Therefore, it is necessary to balance multi-view information in the drug embeddings. In this subsection, we propose a novel graph contrastive learning framework to handle these issues.
Figure 3 illustrates the proposed graph contrastive learning component. In MIRACLE, we naturally have two different graph views in the multi-view graph setting to learn drug representations by maximizing the agreement between inter-view and intra-view embeddings. We define our mutual information(MI) estimator on inter- and intra-view pairs, maximizing the estimated MI over the given dataset . To be specific, for each drug , fixing itself as an anchor , we get a set of positive samples which is made up of itself and its -order neighboring nodes, and a set of negative samples from nodes not in its -hop neighbors. Considering the assumption that representations of drugs that interact with the same drug may contain similar information, we usually set . Then, we generate each positive pair where and negative pair where . After iterations, we can obtain all possible positive pairs and negative pairs. Afterward, we employ a contrastive objective that enforces the intra-view representation of the anchor agree with the inter-view representations of the positive samples and can be distinguished from the inter-view representations of the negative samples. The contrastive objective is formulated as follows:
| (7) |
where , and denote the set of parameters of the BAMPN and GCN encoder, respectively, is the mutual information estimator modeled by discriminator and parameterized by a neural network with parameters . As stated in Hjelm et al. (2019), contrastive learning-based methods concentrate primarily on the maximization of mutual information(MI) instead of its precise value. Therefore, following Nowozin et al. (2016), we use a lower-bound to the MI on the Jensen-Shannon-based representation of the KL-divergence for better performance in practice, which can be formulated as:
| (8) | ||||
where is an input sample, is an input sample from , denotes an empirical probability distribution, and is the softplus function. It should be noted that we generate negative samples using all possible combinations of inter/intra-view embeddings across all drugs in a batch, which means that negative pairs are sampled across all drugs. Since is encouraged to have high MI with samples containing information at both views, this favors encoding aspects of the data shared across different samples and views.
2.5. Drug-drug Interaction Prediction
2.5.1. Interaction predictor
For each interaction link , We first compress two drug embedding vectors into an interaction link embedding vector:
| (9) |
where denotes the element-wise product, is the interaction link embedding vector. Then, we apply a two-layer fully-connected neural network to make the final prediction:
| (10) |
where and denotes the concatenation operation. If the aim is to predict the occurrence of DDI, is 2.
Besides, we design another auxiliary interaction predictor using the inter-view drug embeddings. We cascade the last layer of the MPN with a fully connected layer and a sigmoid transformation function to construct this classifier. The prediction of the inter-view interaction predictor is denoted as . Optimizing the inter-view interaction prediction results can help the supervised information directly flow into previous network layers. The model learns the commonality between different views through a disagreement loss, which will be discussed below. So, finally, we get two prediction results corresponding to two different predictors. It should be noted that we only use for the final DDI prediction.
2.5.2. Training
Both predictors’ primary goal is to minimize the supervised loss, which measures the distance between the predictions and the true labels. Another goal is to minimize a disagreement loss, which measures the distance between two predictors’ predictions. The purpose of minimizing this disagreement loss is to enforce the model to pay more attention to the commonality between two different views and consistency between two predictors.
Formally, we formulate the supervised loss for the labeled interaction links and the disagreement loss for the unlabeled interaction links:
| (11) |
| (12) |
where is the true label of , and denote the labeled and unlabeled links in respectively, is the cross-entropy loss function and is the Kullback-Leibler divergence.
With contrastive loss , supervised loss and disagreement loss , the objective function of our model is,
| (13) |
where and are hyper-parameters for the trade-off for different loss components. With the objective function, we use the back-propagation algorithm to find the best solution for the trainable parameters .
2.5.3. Computation
The key parts of our model include the GNNs-based pipeline and the contrastive learning component. Regarding GNNs, the cores are to compute the inter-view molecular graph embeddings matrix after equation (4) and the drug embeddings matrix in equation (6). The computations require where denotes the number of drug instances, denotes the number of chemical bonds in the drug instance, is the number of DDI, indicates the input feature dimension, and is the feature dimension of the drug embeddings. Next, the computation by the contrastive learning component in equation (7) requires flops in total, where denotes a fixed number of positive samples. Overall, the complexity of our method is , which scales linearly in terms of the number of drug instances(i.e., ), the number of DDI(i.e., ), and the number of chemical bond in each drug instance(i.e., ).
In molecular graphs, the number of chemical bonds is usually under 30. Thus, the complexity mostly depends on and when extending this method to handle DDI networks with millions of drugs. We apply full-batch gradient descent in this study because known DDI are limited, which means the sizes of DDI datasets are far under thousands of drugs and millions of interactions. So scalability is not an essential issue in our task. If our method is extended to other tasks, as seen, our model is computationally comparable to the GCN-based baselines(Wu et al., 2020).
3. Experiments
In this section, we first describe the datasets, compared methods, and evaluation metrics used in the experiments. Then, we compare the proposed MIRACLE with other comparative methods. Finally, we make detailed analysis of MIRACLE under different experimental settings.
3.1. Datasets
We evaluate the proposed method on three benchmark datasets, i.e., ZhangDDI111https://github.com/zw9977129/drug-drug-interaction/tree/master/dataset, ChCh-Miner222http://snap.stanford.edu/biodata/datasets/10001/10001-ChCh-Miner.html and DeepDDI333https://zenodo.org/record/1205795 with different scales for verifying the scalability and robustness of our model. These three datasets are small-scale, medium-scale, and large-scale, respectively. The ZhangDDI dataset contains a relatively small number of drugs where all the fingerprints are available for all drugs. However, for DeepDDI, the large-scale one, many fingerprints are missing in most drugs. For the ChCh-Miner dataset, although it has almost three times the number of drugs in the ZhangDDI dataset, it only has the same number of labeled DDI links. In our preprocessing, we remove the data items that cannot be converted into graphs from SMILES strings. The statistics of datasets are summarized as follows:
-
•
ZhangDDI(Zhang et al., 2017): This dataset contains 548 drugs and 48,548 pairwise DDI and multiple types of similarity information about these drug pairs.
-
•
ChCh-Miner(Zitnik et al., [n. d.]): This dataset contains 1,514 drugs and 48,514 DDI links without similarity-based fingerprints and polypharmacy side-effect information of each drug pair.
- •
It should be noted that we conduct data removal because of some improper drug SMILES strings in Drugbank, which can not be converted into molecular graphs. The errors include so-old storage format of SMILES strings, wrong characters, etc.
3.2. Comparing Methods
To demonstrate the superiority of our proposed model, we implement many baseline approaches to compare their performance. The compared baselines cover similarity-based methods and graph-based methods. For the latter, to compare methods using different views of information reasonably, we define them under the same architecture as MIRACLE, which is summarized in Table 1 and detailed as follows:
-
•
Nearest Neighbor(Vilar et al., 2012): Vilar and his team used known interactions between drugs and similarity derived from substructure to conduct DDI prediction. We refer to the model as NN for simplicity.
-
•
Label Propagation: Zhang et al. (2015) utilized the label propagation(LP) algorithm to build three similarity-based predictive models. The similarity is calculated based on the substructure, side effect, and off-label side effect, respectively. We refer to the three models as LP-Sub, LP-SE and LP-OSE, respectively.
-
•
Multi-Feature Ensemble: Zhang et al. (2017) employed neighbor recommendation(NR) algorithm, label propagation(LP) algorithm, and matrix disturbs (MD) algorithm to build a hybrid ensemble model. The ensemble model exploited different aspects of drugs. We name the model as Ens.
-
•
SSP-MLP: Ryu et al. (2018) applied the combination of precomputed low dimensional Structural Similarity Profile(SSP) and Multi-layer Perceptron to conduct the classification. We refer to the model as SSP-MLP.
-
•
GCN: Kipf and Welling (2017) used a graph convolutional network(GCN) for semi-supervised node classification tasks. We apply GCN to encode drug molecular graphs and use their representations to make predictions as a baseline.
-
•
GIN: Xu et al. (2019) proposed a graph isomorphism network (GIN) to learn molecules’ representations in various single-body property prediction tasks. We use GIN to encode drug molecular graphs and use their representations to make predictions as a baseline.
-
•
Attentive Graph Autoencoder: Ma et al. (2018a) designed an attentive mechanism to integrate multiple drug similarity views, which will be fed into a graph autoencoder to learn the embedding vector for each drug. We refer to the model as AttGA and make predictions based on the learned drug representations pairwise as a baseline.
-
•
GAT: Velickovic et al. (2018) utilized a graph attention network(GAT) to learn node embeddings by a well-designed attention mechanism on the graph. We use GAT to obtain drug embeddings based on the DDI network for predictions.
-
•
SEAL-CI: Li et al. (2019) firstly applied a hierarchical graph representation learning framework in semi-supervised graph classification tasks. We name this model as SEAL-CI and use the model to learn drug representations for DDI predictions as a baseline.
-
•
NFP-GCN: Duvenaud et al. (2015) is the first graph convolution operator, which is specific to molecules. We named the model as NFP-GCN. We change our bond-aware message passing networks into NFP to be a baseline.
| Algorithm | Model Type | The Inter-view Model | The Intra-view Model | Feature Type |
|---|---|---|---|---|
| NN | similarity-based | N/A | N/A | similarity-based fingerprint |
| LP | similarity-based | N/A | N/A | similarity-based fingerprint |
| Ens | similarity-based | N/A | N/A | similarity-based fingerprint |
| SSP-MLP | similarity-based | N/A | N/A | similarity-based fingerprint |
| GCN | inter-view | GCN | N/A | Molecular Graph |
| GIN | inter-view | GIN | N/A | Molecular Graph |
| AttGA | intra-view | N/A | AttGA | Interaction Relationship |
| GAT | intra-view | N/A | GAT | Interaction Relationship |
| SEAL-CI | multi-view | GCN | GCN | Molecular Graph & Interaction Relationship |
| NFP-GCN | multi-view | NFP | GCN | Molecular Graph & Interaction Relationship |
| MIRACLE | multi-view | BAMPN | GCN | Molecular Graph & Interaction Relationship |
3.3. Evaluation Metrics and Experimental Settings
We divide the entire interaction samples into a train set and a test set with a ratio about , and randomly select of the training dataset as a validation dataset. Note that we have only reliable positive drug pairs in the dataset, which means that only DDI certainly occur are recorded. We regard the same number of sampled negative drug pairs as the negative training samples for simplicity(Chen et al., 2019).
We set each parameter group’s learning rate using an exponentially decaying schedule with the initial learning rate and multiplicative factor . For the proposed model’s hyper-parameters, we set the dimension of the hidden state of atoms and drugs as 256. The total number of the bond-aware message passing neural networks and the GCN encoder is 3. The coefficients and in objective functions are set to 100 and 0.8, respectively, making the model achieve the best performance. To further regularise the model, dropout(Srivastava et al., 2014) with is applied to every intermediate layer’s output.
We implement our proposed model with Pytorch 1.4.0(Paszke et al., 2019) and Pytorch-geometric 1.4.2(Fey and Lenssen, 2019). Models are trained using Adam(Kingma and Ba, 2015) optimizer. The model is initialized using Xavier(Glorot and Bengio, 2010) initialization. We choose three metrics to evaluate our proposed model’s effectiveness: area under the ROC curve(AUROC), area under the PRC curve(AUPRC), and F1. We report the mean and standard deviation of these metrics over ten repetitions.
3.4. Experimental Results
We conduct experiments on three datasets with different characteristics to verify our proposed method’s effectiveness in different scenarios. The three parts of the experiments validate the superiority of our MIRACLE method compared to baselines on the small scale dataset with all types of drug features and the medium scale dataset with few labeled DDI links, and the large scale dataset with missing drug features, respectively.
3.4.1. Comparison on the ZhangDDI dataset
Table 2 compares our MIRACLE model’s performance against baseline approaches on the ZhangDDI dataset, where almost all types of drug features can be used for the DDI prediction task. The best results are highlighted in boldface. MIRACLE integrates multi-view information into drug representations. In this model, we jointly consider the inter-view drug molecular graphs and the intra-view DDI relationships. According to the experiments, the proposed model achieves more excellent performance compared to these baseline approaches.
The performance of algorithms utilizing similarity-based fingerprints like NN, LP, and SSP-MLP is relatively poor, which only incorporate one kind of very important features. However, contrary to them, Ens obtains better results because of the combination of three distinct models utilizing eight types of drug feature similarities coupling with another six types of topological ones, demonstrating the importance of integrating information from multiple sources like similarity-based fingerprints and topological features.
Some graph-based methods perform worse than the models mentioned above because they only rely on the single view graph information. GCN and GIN encode drug molecular graphs by two different graph neural network frameworks. They make DDI predictions pairwise based on the obtained drug molecule representations. AttGA and GAT directly learn drug representations from DDI interaction relationships and make predictions using the inner product results of target drug pairs’ embeddings. The former acquires multiple connectivities of the DDI network according to different similarity matrices and applies a GCN encoder to obtain drug representations with varying relationships of interaction. This method fuses these drug representations to make final predictions that distinctly can achieve better performance than GAT, who only considers the DDI network’s link existence.
The compared baselines in the multi-view graph settings like SEAL-CI and NFP-GCN outperform other baselines, demonstrating the integration of multi-view graph can improve the performance of models significantly. However, their performance is still inferior to that of the proposed method. Compared with the state-of-art method, MIRACLE further considers the importance of the message passing mechanism in terms of chemical bonds inside drug molecular graphs and the balance between multi-view graph information, which can learn more comprehensive drug representations. Whereas in SEAL-CI and NFP-GCN, they explicitly model the multi-view graphs and obtain the drug representations through a continuous graph neural network pipeline, with information equilibrium between different views ignored. Besides, MIRACLE adopts the self-attentive mechanism to generate an inter-view drug representation that automatically selects the most significant atoms that form meaningful functional groups in DDI reactions and neglect noisy, meaningless substructures.
| Algorithm | Performance | ||
|---|---|---|---|
| AUROC | AUPRC | F1 | |
| NN | |||
| LP-Sub | |||
| LP-SE | |||
| LP-OSE | |||
| Ens | |||
| SSP-MLP | |||
| GCN | |||
| GIN | |||
| AttGA | |||
| GAT | |||
| SEAL-CI | |||
| NFP-GCN | |||
| MIRACLE | |||
3.4.2. Comparison on the ChCh-Miner dataset
In this part of the experiment, we aim to evaluate our proposed MIRACLE method on datasets with few labeled DDI links. We only compare MIRACLE with graph-based baselines because this dataset lacks similarity-based fingerprints for drug pairs. For the same reason, AttGA does not apply to this dataset. Table 3 shows the results.
Obviously, methods taking multi-view information into consideration like SEAL-CI and NFP-GCN outperform baselines who only use single-view information. However, MIRACLE achieves the best performance and substantially exceeds baselines, demonstrating the superiority of our proposed method on datasets with few labeled data.
The graph contrastive learning component integrates and balances information from different views, MIRACLE learns drug representations better with less labeled DDI links. The proposed method also considers the DDI network’s structural information when making the final predicting decisions, which helps the model extracts the most useful information from all dimensional features for DDI prediction. We further verify our points by a small ablation study in which we adjust the training ratio of the dataset in subsection 3.5.
| Algorithm | Performance | ||
|---|---|---|---|
| AUROC | AUPRC | F1 | |
| GCN | |||
| GIN | |||
| GAT | |||
| SEAL-CI | |||
| NFP-GCN | |||
| MIRACLE | |||
3.4.3. Comparison on the DeepDDI dataset
To verify our proposed method’s scalability, we also conduct experiments on a large-scale dataset, DeepDDI, which has plenty of labeled data and DDI information. Table 4 compares our proposed approach’s performance to the baseline methods. Many baseline approaches utilizing similarity-based fingerprints need plenty of non-structural similarity features, which may be absent in this large scale dataset. Therefore, we only select models who are applicative in this dataset, including NN and SSP-MLP. For the graph-based methods, we neglect AttGA for the lack of many needed drug features. We also ignore experimental results obtained by GIN and NFP-GCN because of the worse performance and the space limitation.
MLP-SSP substantially outperforms NN for the former framework is based on deep neural networks. GCN achieves better performance than GAT, which further demonstrates the inter-view information plays a vital role in DDI predictions. SEAL-CI is second to the proposed method among the baselines proving the superiority of the multi-view graph framework. MIRACLE significantly outperformed other baseline methods in terms of all the three metrics.
| Algorithm | Performance | ||
|---|---|---|---|
| AUROC | AUPRC | F1 | |
| NN | |||
| SSP-MLP | |||
| GCN | |||
| GAT | |||
| SEAL-CI | |||
| MIRACLE | |||
3.5. Ablation Study
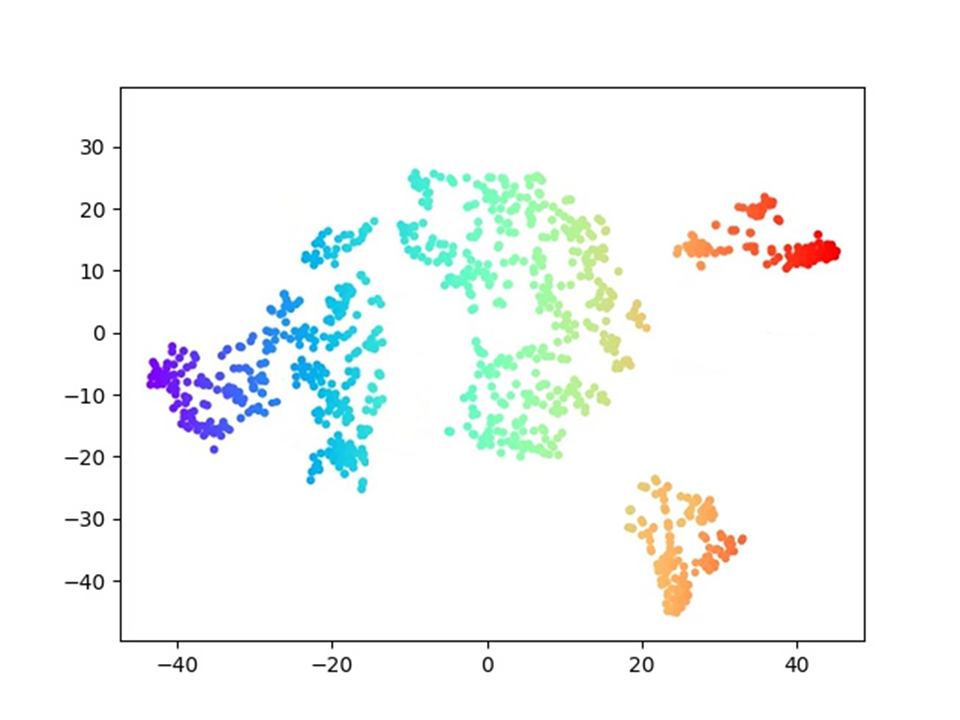
We conduct ablation experiments on the ZhangDDI and the ChCh-Miner dataset to validate the contrastive learning component’s effectiveness in our model. The experimental results are reported in Table 5. To better understand the differences between MIRACLE with and without the contrastive learning component, we visualize their drug embeddings using the visualization tool t-SNE(Maaten and Hinton, 2008), which projects each method’s learned embeddings in a 2D space. Figure 6 shows the results on the ChCh-Miner dataset. From the figure, we can observe that MIRACLE effectively learns drug embeddings with the contrastive learning component. We also analyze our proposed method’s robustness with a different number of labeled training data by adjusting the training set ratio on the ZhangDDI dataset. As seen in Figure 4, MIRACLE with the contrastive learning component can also achieve high performance, validating its superiority in the scenario with few labeled data.
| Dataset | Algorithm | Performance | ||
|---|---|---|---|---|
| AUROC | AUPRC | F1 | ||
| ZhangDDI | -C | |||
| MIRACLE | ||||
| ChCh-Miner | -C | |||
| MIRACLE | ||||
3.6. Parameter Sensitivity
In our model in equation 13, there are two major parameters and . In this subsection, we evaluate the impacts of them, together with the dimensionality of drug embeddings on the ZhangDDI dataset. Figure 5(a) and 5(b) show the results by changing one parameter while fixing another one.
First, we vary by {0.01, 0.1, 1, 10, 100, 1000}, and fix , . Here, for parameter study purpose, is set to its optimal value on this dataset instead of the default value 1. From the figure, our method is quite stable in a wide range of and achieves the best performance when in terms of AUROC. Next, we vary by {0.2, 0.4, 0.6, 0.8, 1, 1.2, 1.4} with and . As can be seen, the near optimal performance at justifies our parameter setting. Overall, and are stable w.r.t these parameters. Moreover, the non-zero choices of and demonstrate the importance of the loss terms in our model.
To evaluate , we vary it from 2 to 512, and fix and . The results are shown in Figure 5(c). From the figure, MIRACLE is robust to . Specifically, when is small, the AUROC increases because higher dimensionality can encode more useful information. When reaches its optimal value, the accuracy begins to drop slightly because a too high dimensionality may introduce redundant and noisy information that can harm the classification performance.
3.7. Convergence Evaluation
In this subsection, we study the proposed MIRACLE algorithm’s performance in terms of the number of iterations before converging to a local optimum. Figure 7 shows the value of the objective function in equation (13) with respect to the number of iterations on different datasets. From the figure, we observe the objective function value decreases steadily after many iterations.
4. Related work
DDI prediction. There is little doubt that the most accurate way for predicting DDIs is in vivo or in vitro trials. But such bioassay is practicable only on a small set of drugs and limited by the experimental environment(Duke et al., 2012). With the accumulation of biomedical data, many machine learning methods are proposed for DDI prediction. To the best of our knowledge, most existing DDI prediction methods could be divided into similarity-based and graph-based.
The similarity-based methods adopt the assumption: drugs sharing similar chemical structures are prone to share similar DDI. Vilar et al. (2012, 2014) generate DDI candidates by comparing the Tanimoto coefficient between human-curated fingerprint vectors of drugs. Celebi et al. (2015) employs a rooted page rank algorithm that integrates therapeutic, genomic, phenotypic, and chemical similarity to discover novel DDIs. Zhang et al. (2015) proposes a label propagation framework considering immediate structure similarity from PubChem and high-order similarity from divergent clinical databases. Huang et al. (2013); Luo et al. (2014) measure the connections between drugs and targets to predict pharmacodynamic DDIs, which could be regarded as another aspect of drug similarity. Ryu et al. (2018) proposes DeepDDI, which applies a feed-forward neural network to encode structural similarity profile (SSP) of drugs to predict DDI. Although similarity-based methods yield robust results on DDI prediction tasks, these methods may have limitations on digging novel DDIs, i.e., not scalable. Starting with known drug interactions, it is far from sufficient to use similarity criteria to model complex DDIs, let alone the number of DDIs identified is still sparse. For high-hanging fruits, more prior knowledge and higher-level representations are required for novel DDI detection.
Recently, graph-based methods like neural fingerprint(Duvenaud et al., 2015), message passing neural networks(Gilmer et al., 2017b) and graph representation learning-based framework(Hamilton et al., 2017) have proved to be successful on molecular tasks, several graph neural networks (GNNs) are proved to have a good DDI prediction power. Zhang et al. (2015, 2017) make DDI predictions based on nearest neighbors, though these works learn representations from multiple prior information, but failed to take relations of DDIs into account, such as transitivity of similarities. Ma et al. (2018b) uses attentive graph auto-encoders(Kipf and Welling, 2016) to integrates heterogeneous information from divergent drug-related data sources. Decagon(Zitnik et al., 2018) introduces another graph auto-encoder, making an end-to-end generation of link prediction predictions in the drug-protein network. This work shows that deep GNNs outperform traditional shallow architectures significantly, such as static fingerprints(Duvenaud et al., 2015), DeepDDI(Ryu et al., 2018), and traditional graph embedding methods(Perozzi et al., 2014; Zong et al., 2017). More recently, Lin et al. (2020) merges several datasets into a vast knowledge graph(KG) with 1.2 billion triples. Through KGNN layers which embed 2-hop local structures of drugs, this model outperforms a previous KG-based method KG-ddi(Karim et al., 2019) significantly. With the help of such graph-based models, higher-level representations are learned from a variety of graph-structured data and improve the performance on the DDI prediction task.
Neural network for graphs. Graph neural networks extend the convolutional neural networks to non-Euclidean spaces, providing a more natural and effective way for modeling graph-structured data(Gilmer et al., 2017b). In recent years, numerous powerful GNN architectures are flourished(Scarselli et al., 2008; Li et al., 2016; Duvenaud et al., 2015; Kearnes et al., 2016; Kipf and Welling, 2017; Battaglia et al., 2016; Hamilton et al., 2017; Velickovic et al., 2018; Xu et al., 2018; Zhang et al., 2018; Xu et al., 2019). With the development of various GNNs and their variants, modern graph representation learning-based methods have achieved state-of-the-art performances on link prediction, node classification, graph classification. Generally, a typical GNN follows a three-step message passing scheme to generate node or graph level representation. 1) Aggregate step: integrating information from neighboring nodes which serve as messages; 2) Combine step: updating the representation of nodes based on collected messages in 1); 3) Readout step: applying a permutation invariant function that produces graph-level representation from node-level representations. In each layer of GNN, node features are usually updated by its immediate neighbors. Thus, after iterations (layers), a node’s embedding vector encodes the -hop subgraph’s topological information. Finally, a graph-level embedding reflecting overall structure could be computed by readout function if needed.
Recently, contrastive learning revitalizes in many fields, and graph representation learning is no exception. Inspired by previous success in visual representation learning, Velickovic et al. (2019) proposes a MI maximization objective to maximize the MI between node embeddings and the graph embedding by discriminating nodes in the original graph from nodes in a corrupted graph. Sun et al. (2020) extends the MI maximization objective to better learn the graph-level representation by maximizing the MI between the graph-level representation and the representations of substructures of different scales. Zhu et al. (2020) proposes a new method to generate different graph views by removing edges and masking features and maximizing the agreement of node embeddings between two graph views. Inspired by the information maximization principle, we apply the MI maximization objective in balancing information from different views in drug embeddings.
5. conclusion
To better integrate the rich multi-view graph information in the DDI network, we propose MIRACLE for the DDI prediction task in this paper. MIRACLE learns drug embeddings from a multi-view graph perspective by designing an end-to-end framework that consists of a bond-aware message passing network and a GCN encoder. Then, a novel contrastive learning-based strategy has been proposed to balance information from different views. Also, we design two predictors from both views to fully exploit the available information. Through extensive experiments on various real-life datasets, we have demonstrated that the proposed MIRACLE is both effective and efficient.
Acknowledgements.
This work is jointly supported by National Key Research and Development Program of China (No.2018YFC0116800) and Beijing Municipal Natural Science Foundation (No.L192026).References
- (1)
- Bai et al. (2020) Yunsheng Bai, Ken Gu, Yizhou Sun, and Wei Wang. 2020. Bi-Level Graph Neural Networks for Drug-Drug Interaction Prediction. (2020). https://arxiv.org/abs/2006.14002
- Battaglia et al. (2016) Peter Battaglia, Razvan Pascanu, Matthew Lai, Danilo Jimenez Rezende, et al. 2016. Interaction networks for learning about objects, relations and physics. In Advances in neural information processing systems. 4502–4510.
- Celebi et al. (2015) Remzi Celebi, Vahab Mostafapour, Erkan Yasar, Özgür Gümüs, and Oguz Dikenelli. 2015. Prediction of Drug-Drug interactions using pharmacological similarities of drugs. In 2015 26th International Workshop on Database and Expert Systems Applications (DEXA). IEEE, 14–17.
- Chen et al. (2019) Xin Chen, Xien Liu, and Ji Wu. 2019. Drug-drug Interaction Prediction with Graph Representation Learning. In 2019 IEEE International Conference on Bioinformatics and Biomedicine (BIBM). IEEE, 354–361.
- Chen et al. (2020) Xin Chen, Xien Liu, and Ji Wu. 2020. Research progress on drug representation learning. Journal of Tsinghua University (Science and Technology) 60, 2 (2020), 171–180.
- Deac et al. (2019) Andreea Deac, Yu-Hsiang Huang, Petar Veličković, Pietro Liò, and Jian Tang. 2019. Drug-drug adverse effect prediction with graph co-attention. (2019). https://arxiv.org/abs/1905.00534
- Duke et al. (2012) Jon D Duke, Xu Han, Zhiping Wang, Abhinita Subhadarshini, Shreyas D Karnik, Xiaochun Li, Stephen D Hall, Yan Jin, J Thomas Callaghan, Marcus J Overhage, et al. 2012. Literature based drug interaction prediction with clinical assessment using electronic medical records: novel myopathy associated drug interactions. PLoS Comput Biol 8, 8 (2012), e1002614.
- Duvenaud et al. (2015) David K Duvenaud, Dougal Maclaurin, Jorge Iparraguirre, Rafael Bombarell, Timothy Hirzel, Alán Aspuru-Guzik, and Ryan P Adams. 2015. Convolutional networks on graphs for learning molecular fingerprints. In Advances in neural information processing systems. 2224–2232.
- Fey and Lenssen (2019) Matthias Fey and Jan E. Lenssen. 2019. Fast Graph Representation Learning with PyTorch Geometric. In ICLR Workshop on Representation Learning on Graphs and Manifolds.
- Gilmer et al. (2017a) Justin Gilmer, Samuel S. Schoenholz, Patrick F. Riley, Oriol Vinyals, and George E. Dahl. 2017a. Neural Message Passing for Quantum Chemistry. In Proceedings of the 34th International Conference on Machine Learning, ICML 2017, Sydney, NSW, Australia, 6-11 August 2017 (Proceedings of Machine Learning Research), Doina Precup and Yee Whye Teh (Eds.), Vol. 70. PMLR, 1263–1272. http://proceedings.mlr.press/v70/gilmer17a.html
- Gilmer et al. (2017b) Justin Gilmer, Samuel S. Schoenholz, Patrick F. Riley, Oriol Vinyals, and George E. Dahl. 2017b. Neural Message Passing for Quantum Chemistry. In Proceedings of the 34th International Conference on Machine Learning, ICML 2017, Sydney, NSW, Australia, 6-11 August 2017 (Proceedings of Machine Learning Research), Doina Precup and Yee Whye Teh (Eds.), Vol. 70. PMLR, 1263–1272. http://proceedings.mlr.press/v70/gilmer17a.html
- Glorot and Bengio (2010) Xavier Glorot and Yoshua Bengio. 2010. Understanding the difficulty of training deep feedforward neural networks. In Proceedings of the thirteenth international conference on artificial intelligence and statistics. 249–256.
- Hamilton et al. (2017) Will Hamilton, Zhitao Ying, and Jure Leskovec. 2017. Inductive representation learning on large graphs. In Advances in neural information processing systems. 1024–1034.
- Hjelm et al. (2019) R. Devon Hjelm, Alex Fedorov, Samuel Lavoie-Marchildon, Karan Grewal, Philip Bachman, Adam Trischler, and Yoshua Bengio. 2019. Learning deep representations by mutual information estimation and maximization. In 7th International Conference on Learning Representations, ICLR 2019, New Orleans, LA, USA, May 6-9, 2019. OpenReview.net. https://openreview.net/forum?id=Bklr3j0cKX
- Huang et al. (2013) Jialiang Huang, Chaoqun Niu, Christopher D Green, Lun Yang, Hongkang Mei, and Jing-Dong J Han. 2013. Systematic prediction of pharmacodynamic drug-drug interactions through protein-protein-interaction network. PLoS Comput Biol 9, 3 (2013), e1002998.
- Karim et al. (2019) Md Rezaul Karim, Michael Cochez, Joao Bosco Jares, Mamtaz Uddin, Oya Beyan, and Stefan Decker. 2019. Drug-drug interaction prediction based on knowledge graph embeddings and convolutional-LSTM network. In Proceedings of the 10th ACM International Conference on Bioinformatics, Computational Biology and Health Informatics. 113–123.
- Kastrin et al. (2018) Andrej Kastrin, Polonca Ferk, and Brane Leskošek. 2018. Predicting potential drug-drug interactions on topological and semantic similarity features using statistical learning. PLOS ONE 13, 5 (05 2018), 1–23. https://doi.org/10.1371/journal.pone.0196865
- Kearnes et al. (2016) Steven Kearnes, Kevin McCloskey, Marc Berndl, Vijay Pande, and Patrick Riley. 2016. Molecular graph convolutions: moving beyond fingerprints. Journal of computer-aided molecular design 30, 8 (2016), 595–608.
- Kingma and Ba (2015) Diederik P. Kingma and Jimmy Ba. 2015. Adam: A Method for Stochastic Optimization. In 3rd International Conference on Learning Representations, ICLR 2015, San Diego, CA, USA, May 7-9, 2015, Conference Track Proceedings, Yoshua Bengio and Yann LeCun (Eds.). http://arxiv.org/abs/1412.6980
- Kipf and Welling (2016) Thomas N Kipf and Max Welling. 2016. Variational graph auto-encoders. arXiv preprint arXiv:1611.07308 (2016).
- Kipf and Welling (2017) Thomas N. Kipf and Max Welling. 2017. Semi-Supervised Classification with Graph Convolutional Networks. In 5th International Conference on Learning Representations, ICLR 2017, Toulon, France, April 24-26, 2017, Conference Track Proceedings. OpenReview.net. https://openreview.net/forum?id=SJU4ayYgl
- Landrum (2013) Greg Landrum. 2013. RDKit: A software suite for cheminformatics, computational chemistry, and predictive modeling.
- Lazarou et al. (1998) Jason Lazarou, Bruce H Pomeranz, and Paul N Corey. 1998. Incidence of adverse drug reactions in hospitalized patients: a meta-analysis of prospective studies. Jama 279, 15 (1998), 1200–1205.
- Li et al. (2019) Jia Li, Yu Rong, Hong Cheng, Helen Meng, Wenbing Huang, and Junzhou Huang. 2019. Semi-supervised graph classification: A hierarchical graph perspective. In The World Wide Web Conference. 972–982.
- Li et al. (2018) Qimai Li, Zhichao Han, and Xiao-Ming Wu. 2018. Deeper Insights Into Graph Convolutional Networks for Semi-Supervised Learning. In Proceedings of the Thirty-Second AAAI Conference on Artificial Intelligence, (AAAI-18), the 30th innovative Applications of Artificial Intelligence (IAAI-18), and the 8th AAAI Symposium on Educational Advances in Artificial Intelligence (EAAI-18), New Orleans, Louisiana, USA, February 2-7, 2018, Sheila A. McIlraith and Kilian Q. Weinberger (Eds.). AAAI Press, 3538–3545. https://www.aaai.org/ocs/index.php/AAAI/AAAI18/paper/view/16098
- Li et al. (2016) Yujia Li, Daniel Tarlow, Marc Brockschmidt, and Richard S. Zemel. 2016. Gated Graph Sequence Neural Networks. In 4th International Conference on Learning Representations, ICLR 2016, San Juan, Puerto Rico, May 2-4, 2016, Conference Track Proceedings, Yoshua Bengio and Yann LeCun (Eds.). http://arxiv.org/abs/1511.05493
- Lin et al. (2020) Xuan Lin, Zhe Quan, Zhi-Jie Wang, Tengfei Ma, and Xiangxiang Zeng. 2020. Kgnn: Knowledge graph neural network for drug-drug interaction prediction. IJCAI.
- Luo et al. (2014) Heng Luo, Ping Zhang, Hui Huang, Jialiang Huang, Emily Kao, Leming Shi, Lin He, and Lun Yang. 2014. DDI-CPI, a server that predicts drug–drug interactions through implementing the chemical–protein interactome. Nucleic acids research 42, W1 (2014), W46–W52.
- Ma et al. (2018a) Tengfei Ma, Cao Xiao, Jiayu Zhou, and Fei Wang. 2018a. Drug Similarity Integration Through Attentive Multi-view Graph Auto-Encoders. In Proceedings of the Twenty-Seventh International Joint Conference on Artificial Intelligence, IJCAI 2018, July 13-19, 2018, Stockholm, Sweden, Jérôme Lang (Ed.). ijcai.org, 3477–3483. https://doi.org/10.24963/ijcai.2018/483
- Ma et al. (2018b) Tengfei Ma, Cao Xiao, Jiayu Zhou, and Fei Wang. 2018b. Drug Similarity Integration through Attentive Multi-View Graph Auto-Encoders. In Proceedings of the 27th International Joint Conference on Artificial Intelligence (IJCAI’18). AAAI Press, 3477–3483.
- Maaten and Hinton (2008) Laurens van der Maaten and Geoffrey Hinton. 2008. Visualizing data using t-SNE. Journal of machine learning research 9, Nov (2008), 2579–2605.
- Nowozin et al. (2016) Sebastian Nowozin, Botond Cseke, and Ryota Tomioka. 2016. f-gan: Training generative neural samplers using variational divergence minimization. In Advances in neural information processing systems. 271–279.
- Palleria et al. (2013) Caterina Palleria, Antonello Di Paolo, Chiara Giofrè, Chiara Caglioti, Giacomo Leuzzi, Antonio Siniscalchi, Giovambattista De Sarro, and Luca Gallelli. 2013. Pharmacokinetic drug-drug interaction and their implication in clinical management. Journal of research in medical sciences: the official journal of Isfahan University of Medical Sciences 18, 7 (2013), 601.
- Paszke et al. (2019) Adam Paszke, Sam Gross, Francisco Massa, Adam Lerer, James Bradbury, Gregory Chanan, Trevor Killeen, Zeming Lin, Natalia Gimelshein, Luca Antiga, et al. 2019. Pytorch: An imperative style, high-performance deep learning library. In Advances in neural information processing systems. 8026–8037.
- Perozzi et al. (2014) Bryan Perozzi, Rami Al-Rfou, and Steven Skiena. 2014. Deepwalk: Online learning of social representations. In Proceedings of the 20th ACM SIGKDD international conference on Knowledge discovery and data mining. 701–710.
- Ryu et al. (2018) Jae Yong Ryu, Hyun Uk Kim, and Sang Yup Lee. 2018. Deep learning improves prediction of drug–drug and drug–food interactions. Proceedings of the National Academy of Sciences 115, 18 (2018), E4304–E4311.
- Scarselli et al. (2008) Franco Scarselli, Marco Gori, Ah Chung Tsoi, Markus Hagenbuchner, and Gabriele Monfardini. 2008. The graph neural network model. IEEE Transactions on Neural Networks 20, 1 (2008), 61–80.
- Srivastava et al. (2014) Nitish Srivastava, Geoffrey Hinton, Alex Krizhevsky, Ilya Sutskever, and Ruslan Salakhutdinov. 2014. Dropout: a simple way to prevent neural networks from overfitting. The journal of machine learning research 15, 1 (2014), 1929–1958.
- Srivastava et al. (2015) Rupesh Kumar Srivastava, Klaus Greff, and Jürgen Schmidhuber. 2015. Highway networks. (2015). https://arxiv.org/abs/1505.00387
- Sun et al. (2020) Fan-Yun Sun, Jordan Hoffmann, Vikas Verma, and Jian Tang. 2020. InfoGraph: Unsupervised and Semi-supervised Graph-Level Representation Learning via Mutual Information Maximization. In 8th International Conference on Learning Representations, ICLR 2020, Addis Ababa, Ethiopia, April 26-30, 2020. OpenReview.net. https://openreview.net/forum?id=r1lfF2NYvH
- Vaswani et al. (2017) Ashish Vaswani, Noam Shazeer, Niki Parmar, Jakob Uszkoreit, Llion Jones, Aidan N Gomez, Łukasz Kaiser, and Illia Polosukhin. 2017. Attention is all you need. In Advances in neural information processing systems. 5998–6008.
- Velickovic et al. (2018) Petar Velickovic, Guillem Cucurull, Arantxa Casanova, Adriana Romero, Pietro Liò, and Yoshua Bengio. 2018. Graph Attention Networks. In 6th International Conference on Learning Representations, ICLR 2018, Vancouver, BC, Canada, April 30 - May 3, 2018, Conference Track Proceedings. OpenReview.net. https://openreview.net/forum?id=rJXMpikCZ
- Velickovic et al. (2019) Petar Velickovic, William Fedus, William L. Hamilton, Pietro Liò, Yoshua Bengio, and R. Devon Hjelm. 2019. Deep Graph Infomax. In 7th International Conference on Learning Representations, ICLR 2019, New Orleans, LA, USA, May 6-9, 2019. OpenReview.net. https://openreview.net/forum?id=rklz9iAcKQ
- Vilar et al. (2012) Santiago Vilar, Rave Harpaz, Eugenio Uriarte, Lourdes Santana, Raul Rabadan, and Carol Friedman. 2012. Drug—drug interaction through molecular structure similarity analysis. Journal of the American Medical Informatics Association 19, 6 (2012), 1066–1074.
- Vilar et al. (2014) Santiago Vilar, Eugenio Uriarte, Lourdes Santana, Tal Lorberbaum, George Hripcsak, Carol Friedman, and Nicholas P Tatonetti. 2014. Similarity-based modeling in large-scale prediction of drug-drug interactions. Nature protocols 9, 9 (2014), 2147.
- Wishart et al. (2018) David S Wishart, Yannick D Feunang, An C Guo, Elvis J Lo, Ana Marcu, Jason R Grant, Tanvir Sajed, Daniel Johnson, Carin Li, Zinat Sayeeda, et al. 2018. DrugBank 5.0: a major update to the DrugBank database for 2018. Nucleic acids research 46, D1 (2018), D1074–D1082.
- Wu et al. (2020) Zonghan Wu, Shirui Pan, Fengwen Chen, Guodong Long, Chengqi Zhang, and S Yu Philip. 2020. A comprehensive survey on graph neural networks. IEEE transactions on neural networks and learning systems (2020).
- Xu et al. (2019) Keyulu Xu, Weihua Hu, Jure Leskovec, and Stefanie Jegelka. 2019. How Powerful are Graph Neural Networks?. In 7th International Conference on Learning Representations, ICLR 2019, New Orleans, LA, USA, May 6-9, 2019. OpenReview.net. https://openreview.net/forum?id=ryGs6iA5Km
- Xu et al. (2018) Keyulu Xu, Chengtao Li, Yonglong Tian, Tomohiro Sonobe, Ken-ichi Kawarabayashi, and Stefanie Jegelka. 2018. Representation Learning on Graphs with Jumping Knowledge Networks. In Proceedings of the 35th International Conference on Machine Learning, ICML 2018, Stockholmsmässan, Stockholm, Sweden, July 10-15, 2018 (Proceedings of Machine Learning Research), Jennifer G. Dy and Andreas Krause (Eds.), Vol. 80. PMLR, 5449–5458. http://proceedings.mlr.press/v80/xu18c.html
- Yan et al. (2006) Shuicheng Yan, Dong Xu, Benyu Zhang, Hong-Jiang Zhang, Qiang Yang, and Stephen Lin. 2006. Graph embedding and extensions: A general framework for dimensionality reduction. IEEE transactions on pattern analysis and machine intelligence 29, 1 (2006), 40–51.
- Zhang et al. (2018) Muhan Zhang, Zhicheng Cui, Marion Neumann, and Yixin Chen. 2018. An end-to-end deep learning architecture for graph classification. In Thirty-Second AAAI Conference on Artificial Intelligence.
- Zhang et al. (2015) Ping Zhang, Fei Wang, Jianying Hu, and Robert Sorrentino. 2015. Label propagation prediction of drug-drug interactions based on clinical side effects. Scientific reports 5, 1 (2015), 1–10.
- Zhang et al. (2017) Wen Zhang, Yanlin Chen, Feng Liu, Fei Luo, Gang Tian, and Xiaohong Li. 2017. Predicting potential drug-drug interactions by integrating chemical, biological, phenotypic and network data. BMC bioinformatics 18, 1 (2017), 18.
- Zhu et al. (2020) Yanqiao Zhu, Yichen Xu, Feng Yu, Qiang Liu, Shu Wu, and Liang Wang. 2020. Deep Graph Contrastive Representation Learning. In ICML Workshop on Graph Representation Learning and Beyond. http://arxiv.org/abs/2006.04131
- Zitnik et al. (2018) Marinka Zitnik, Monica Agrawal, and Jure Leskovec. 2018. Modeling polypharmacy side effects with graph convolutional networks. Bioinformatics 34, 13 (2018), i457–i466.
- Zitnik et al. ([n. d.]) Marinka Zitnik, Rok Sosič, Sagar Maheshwari, and Jure Leskovec. [n. d.]. BioSNAP Datasets: Stanford Biomedical Network Dataset Collection. http://snap.stanford.edu/biodata.
- Zong et al. (2017) Nansu Zong, Hyeoneui Kim, Victoria Ngo, and Olivier Harismendy. 2017. Deep mining heterogeneous networks of biomedical linked data to predict novel drug–target associations. Bioinformatics 33, 15 (2017), 2337–2344.