∎
22email: anze.bozic@ijs.si 33institutetext: M. Kanduč (corr. author)44institutetext: Dept. of Theoretical Physics, Jožef Stefan Institute, Ljubljana, Slovenia
44email: matej.kanduc@ijs.si
Relative humidity in droplet and airborne transmission of disease
Abstract
A large number of infectious diseases is transmitted by respiratory droplets. How long these droplets persist in the air, how far they can travel, and how long the pathogens they might carry survive are all decisive factors for the spread of droplet-borne diseases. The subject is extremely multifaceted and its aspects range across different disciplines, yet most of them have only seldom been considered in the physics community. In this review, we discuss the physical principles that govern the fate of respiratory droplets and any viruses trapped inside them, with a focus on the role of relative humidity. Importantly, low relative humidity—as encountered, for instance, indoors during winter and inside aircraft—facilitates evaporation and keeps even initially large droplets suspended in air as aerosol for extended periods of time. What is more, relative humidity affects the stability of viruses in aerosol through several physical mechanisms such as efflorescence and inactivation at the air-water interface, whose role in virus inactivation nonetheless remains poorly understood. Elucidating the role of relative humidity in the droplet spread of disease would permit us to design preventive measures that could aid in reducing the chance of transmission, particularly in indoor environment.
Keywords:
droplets aerosol airborne transmission relative humidity efflorescence viruses1 Introduction
One of the prevalent ways in which numerous viruses, bacteria, and fungi spread among plants, animals, and humans is by droplets of various sizes Fernstrom2013 ; laRosa2013 ; Verreault2008 . Humans produce respiratory droplets during talking, coughing, sneezing, and other similar activities Belser2010 ; Gralton2011 ; Nazaroff2016 ; Tellier2009 ; Thomas2013 . These droplets, which can potentially contain pathogens, then spread outside the human body in different ways, enabling the pathogens to find a new host Fernstrom2013 ; Kutter2018 ; laRosa2013 ; Verreault2008 ; Huang2020covid . Most of the droplets deposit on various objects (e.g., buttons, door knobs, tabletops, and touchscreens), turning them into infectious “fomites”. The droplets can also be inhaled by another person in close proximity ( to m), which provides a direct path for infection. And not least, some (particularly small) droplets can remain airborne for longer periods of time and travel considerable distances, providing yet another important path for disease transmission.
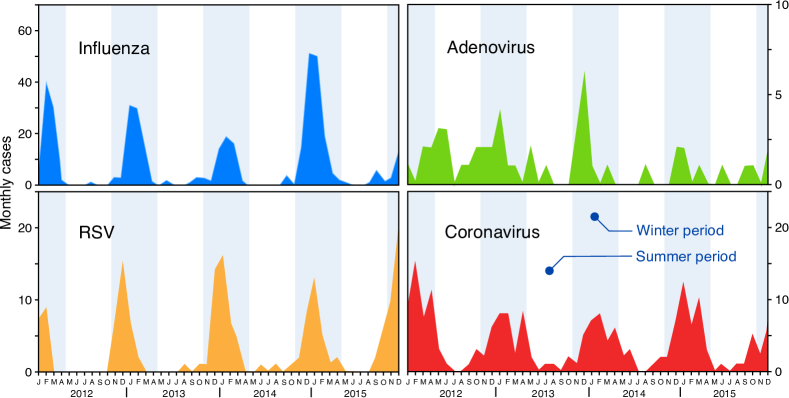
Droplet spread is the main mode of transmission for respiratory viruses such as influenza, common-cold viruses, and some SARS-associated coronaviruses, including SARS-CoV-2 Booth2005 ; Chan2011 ; Dancer2020 ; Verreault2008 ; Sooryanarain2015 ; Morawska2020 . A typical and very common feature of respiratory infections is seasonality, a periodic upsurge in infection incidence corresponding to seasons or other calendar periods. In fact, in temperate regions, most—but not all—human respiratory pathogens exhibit an annual increase in incidence each winter, with variations in the timing of onset and magnitude of the increase Dowell2004 ; Galanti2019 ; Moriyama2020 ; Visseaux2017 , as shown in Fig. 1 for several respiratory viruses. For instance, “flu season” in cold winter months is such a widespread and familiar phenomenon that we typically do not wonder why influenza viruses appear to have a greater reproduction rate when it is cold outside, even though they circulate year-round Fisman2012seasonality . On the other hand, tropical countries have much weaker annual climate cycles, and outbreaks show less seasonality and are more difficult to be explained by environmental correlations Viboud2006 ; Deyle2016 ; Pica2012 ; Sooryanarain2015 ; Tamerius2011 ; Tang2014 . Yet even though the recognition of seasonal patterns in infectious diseases dates back to the era of Hippocrates, the underlying mechanisms are still not well understood Fisman2012seasonality ; Yang2011 .
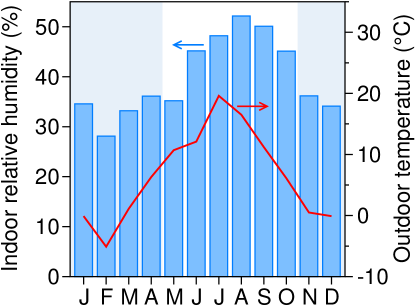
Numerous factors have been suggested to drive the distinct seasonality of various pathogens: Human behavior (staying indoors more in colder months, less frequent ventilation, school schedules) Tamerius2011 ; Earn2012effects , human immune function (diminished daylight and its impact on vitamin D metabolism Dowell2001seasonal ), ultraviolet radiation Harper1961 , and indoor relative humidity (RH)—the ratio of the partial pressure of water vapor to the equilibrium vapor pressure of water at a given temperature. The role of RH will be discussed in detail in this review. One may of course wonder what the role of temperature is, as this is an environmental parameter that clearly correlates with seasons in temperate regions. However, there is little scientific evidence to suggest that lower winter temperatures are important direct drivers of wintertime seasonality of respiratory infections Fisman2012seasonality . In particular, in indoor environments, where people spend of their time and where most infections occur Moriyama2020 ; Nazaroff2016 , temperature does not vary much since buildings are heated as it gets cooler outdoors Yang2011 . Nevertheless, what the outdoor temperature does indirectly influence is the RH inside buildings. Heating the buildings in winter dries the cold air coming in from the outside, causing RH to drop dramatically. As a result, indoor RH in temperate regions typically varies between and in the winter months, which is significantly lower compared with its range of to in the summer months Engvall2005 ; Hodgson2004 ; Nguyen2014 ; Zhang2010 . By way of example, Fig. 2 shows the mean RH variation (blue bars) over the period of one year in a Swedish residential building: As winter turns to summer, mean indoor RH increases from to , and clearly correlates with outdoor temperature (red line). In tropical regions, on the other hand, indoor RH is significantly higher throughout the year Moriyama2020 ; Tariku2015 ; Zhang2010 .
Research shows that RH plays a paramount role in the spread of infections through a number of different mechanisms. First, RH directly impacts how and to what extent the exhaled human droplets can spread through the air. Second, the stability of winter viruses trapped in those droplets shows a striking correlation with low RH ( to %), while the stability of summer or year-round viruses is enhanced at higher RH (%) Moriyama2020 . And finally, dry air dries out the mucous membrane in the nose, which eases the invasion of infectious viruses into the respiratory tract Sunwoo2006physiological ; Hildenbrand2011rhinitis ; Makinen2009 . A better understanding of the role of RH for virus viability in droplets thus not only helps us understand the droplet spread of infections and seasonality of some viruses, but can also guide our understanding of using humidity as a non-pharmaceutical intervention Reiman2018 ; Hobday2013 .
This review aims to summarize those physical mechanisms of droplet and airborne transmission of disease in which RH plays a role. In particular, we address the question of why and how the difference in RH between and (Fig. 2) influences the spread of respiratory disease. By first estimating the droplet size and composition (Sec. 2), we use simple approximations to determine the general physics of a falling droplet (Sec. 3) and look at how it is influenced by RH and by both the presence of solutes as well as efflorescence effects. We then separately discuss how RH impacts the sedimentation of larger droplets (Sec. 4) and the deposition of aerosol (Sec. 5). Finally, we look into virus-laden droplets (Sec. 6) and the various factors that influence the survival of viruses in these droplets with respect to changes in RH.
2 Respiratory droplet size and composition
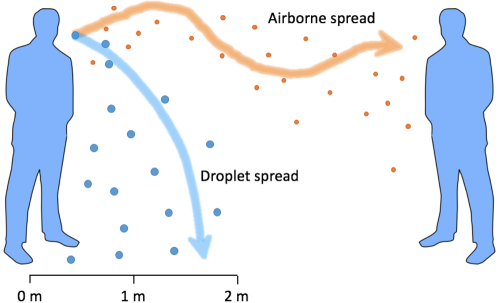
The size of droplets expelled during various human activities such as breathing, talking, singing, coughing, and sneezing is an important factor in determining their fate—whether they evaporate, sediment, or persist in the air Belser2010 ; Gralton2011 ; Nazaroff2016 ; Tellier2009 ; Thomas2013 . Often, a distinction is made between larger respiratory droplets, which do not spread far from their origin and quickly sediment onto neighboring surfaces, potentially contaminating them and thus facilitating transmission of droplet-borne disease, and smaller aerosol particles, which are small enough to persist in the air, are influenced by various kinds of airflow, and can potentially transmit disease over larger distances (Fig. 3). While most definitions of droplets and aerosol distinguish them by a certain size cutoff—current WHO guidelines put this at m world2007infection —these have varied over time, reflecting the fact that the transition between droplet and aerosol behavior is continuous rather than sharp Gralton2011 . Most often, the term droplet transmission is defined as the transmission of disease by respiratory droplets that tend to settle quickly to the ground (typically within to m from the site of generation). Conversely, airborne transmission is defined as disease transmission by particles that are much smaller in size and can remain suspended in air for prolonged periods of time (i.e., aerosol) and consequently travel much greater distances Gralton2011 ; morawska2005droplet ; xie2007far . Furthermore, the size of respiratory droplets also influences where in the respiratory tract they can deposit Tellier2009 ; Thomas2013 , and by that the severity and spread of a disease. For the purposes of this review, we will refer to all particles produced by respiratory activity as droplets, regardless of their size. We will examine both the regime when they are large enough to quickly sediment as well as the regime when they are small and are transmitted as aerosol particles.
Different human respiratory activities in general produce different amounts of droplets of varying sizes Asadi2019 ; Morawska2009 ; Thomas2013 . Figure 4 shows an example of a size distribution of deposited droplets produced by talking, obtained in experiments of Xie et al. xie2009exhaled . The distribution can be fitted well by a Gaussian curve in the lin-log scale:
| (1) |
The radii of the vast majority of droplets in Fig. 4 are in the range of to m, and only a minority of them have size below m. Nonetheless, the latter importantly contribute to the airborne route of transmission, as we shall see in later sections. Size distribution of droplets does not depend greatly on the activity that produces them Chao2009 ; Morawska2009 ; xie2009exhaled , although droplet particles originating in the lower respiratory tract in general tend to be smaller than the particles produced in the upper respiratory tract Johnson2011 . Some studies have also reported multimodal size distributions, which has been explained in terms of different physiological production mechanisms Johnson2011 ; somsen2020small .
While the size distributions of exhaled droplets produced by various activities are mostly similar, the activities differ greatly in the number of droplet particles produced, spanning several orders of magnitude Fernstrom2013 ; Fiegel2006 . In general, more sensitive methods developed recently show that all human respiratory activities produce more droplets than previously thought Anfinrud2020 ; Stadnytskyi2020 . Talking, for instance, produces over particles per second Anfinrud2020 ; Asadi2019 ; xie2009exhaled , while a single sneeze can produce upwards of particles Fernstrom2013 . Thus, several minutes of talking can still produce as many droplets as a single cough or a sneeze Asadi2019 ; Fernstrom2013 . The number of exhaled droplets also varies between individuals, with some emitting an order of magnitude more than the others—so-called superspreaders Asadi2019 ; Lloyd2005 ; Shen2004 . Different activities also influence the composition of the exhaled droplets (based on the location of secretion), which further varies both among as well as within individuals and is also influenced by their health, resulting in a wide range of measured concentrations of proteins, salt ions, and lipids in respiratory droplets (Table 1).
| component | concentration range | references |
|---|---|---|
| proteins | to mg/ml | Effros2002 ; Scheideler1993 ; Spicer1984 ; Gould2001 ; Ruocco1998 ; reynolds1984respiratory ; Sanchez2011 ; Vejerano2018 ; Marr2019 |
| salt ions | to mM | Effros2002 ; Vejerano2018 ; Marr2019 |
| lipids | to mg/ml | Spicer1984 ; Larson1980 ; Vejerano2018 ; Marr2019 |
3 Physics of a falling droplet
After droplets are expelled from the mouth or nose into the air, they undergo various physical and chemical processes—evaporation being the most notable among them—that change their structural properties in an important way. In the air, these droplets (or droplet particles) are subject to gravity, Brownian motion, electrical forces, thermal gradients, electromagnetic radiation, turbulent diffusion, and so on morawska2005droplet . This enormous repertoire of phenomena that accompany droplets in the air leads to a variety of possible outcomes, and our ambition is not to summarize them all in a single article. In this section, we will focus instead on the essential physics that is necessary to explain the basics of a falling droplet, its sedimentation, and airborne spread, as well as the ways in which RH impacts this behavior.
3.1 Evaporation of a falling water droplet
We first consider a pure water droplet of radius in air (Fig. 5A). Because of the gravitational force acting on the droplet (where is the water density and the gravitational acceleration), it starts to accelerate downwards. This motion is opposed by air drag, given by the Stokes law (applicable in the regime of low Reynolds numbers), where is the droplet velocity and the air viscosity. Soon, the drag balances out the gravity () and the droplet reaches sedimentation (terminal) velocity of
| (2) |
where . Sedimentation velocities for different droplet sizes are given in Table LABEL:tab:1, where we can see that they span six orders of magnitude as droplet size decreases from to m. Acceleration time needed for a droplet to reach terminal velocity is , which amounts to s for a -m-large droplet with m/s. Since respiratory droplets are mostly smaller than m, this means that they quickly reach their terminal velocities and we can thus neglect any acceleration effects.
| (no evaporation) | () | ||
|---|---|---|---|
| m | m/s | s | s |
| m | cm/s | min | s |
| m | mm/s | h | ms |
| m | m/s | days | s |
If a droplet is released from height , the time it takes for it to reach the ground (sedimentation time) in an undisturbed atmosphere and without evaporation (i.e., it falls as a rigid body) is simply . Using Eq. (2), this reads
| (3) |
The sedimentation time is inversely proportional to the square of the droplet size and again spans orders of magnitude for the most typical respiratory droplet sizes (Table LABEL:tab:1). Note that for droplets smaller than a few microns, airflow considerably disturbs the actual deposition to the ground, as we will discuss in Sec. 5.
As soon as the droplet enters unsaturated air, it starts to evaporate and its radius shrinks with time. We will demonstrate by a simple calculation that evaporation plays an essential role in falling droplets. To that end, we assume a motionless droplet with respect to the surrounding air, which defines the stagnant-flow approximation netz2020droplets . Water molecules that evaporate from the surface of the droplet undergo diffusion in the surrounding air. Thus, the vapor number density around the droplet can be described by the diffusion equation . The steady-state solution () in spherical geometry yields
| (4) |
which fulfils two relevant boundary conditions: The concentration approaches the ambient vapor concentration far away from the droplet on the one hand and the saturation value at the droplet surface on the other. The latter condition is valid in the so-called diffusion-limited regime in which evaporation is limited by the speed at which water molecules diffuse away from the droplet, creating “free space” for new water molecules to evaporate. Only for droplet radii below nm does the evaporation process cross over into the reaction-limited regime in which the limiting factor is the rate at which water evaporates from the droplet surface netz2020droplets . Typical respiratory droplets thus fall well into the diffusion-limited regime, described by Eq. (4).
Evaporation flux density can be obtained from Fick’s first law of diffusion as . The total flux is then , where we have used the definition of relative humidity . This now allows us to use the relation to connect the droplet volume with evaporation time, where nm-3 is the number density of liquid water. From here, we can derive the time-dependent radius of an evaporating droplet
| (5) |
where is the initial radius. The droplet vanishes completely at the evaporation time
| (6) |
where . The estimates for the evaporation times of droplets with different initial sizes are given in Table LABEL:tab:1: As we can see, a -m-large droplet takes several seconds to evaporate, whereas a -m-large droplet evaporates in just a fraction of a second.
Equation (6) is, of course, only an approximation. Evaporation is a process accompanied and influenced by various phenomena barrett1988growth ; beard1971wind ; davis1982transport ; frossling1938uber ; kinzer1951evaporation , and detailed overview of those can be, for instance, found in work by Xie et al. xie2007far and Netz netz2020droplets ; NetzEaton2020 . Some of the most notable effects are (i) evaporation cooling, where owing to the large evaporation enthalpy of water, droplet surface cools down by K at netz2020droplets , which in turn decreases the evaporation rate and the diffusion coefficient xie2007far ; (ii) Stefan flow, an induced flow of air away from the droplet caused by the evaporated vapor, which increases the evaporation rate kukkonen1989interdependence ; (iii) ventilation effects, where the airflow around the falling droplet speeds up evaporation, relevant for droplets larger than a few tens of microns kukkonen1989interdependence ; netz2020droplets ; and (iv) presence of solutes, which lowers the chemical potential of water and the rate of evaporation netz2020droplets ; NetzEaton2020 . Also, once the droplet radius is smaller than nm, evaporation switches over to the reaction-limited regime and the radius decreases linearly with time netz2020droplets ; NetzEaton2020 . Any lipids present in the droplets Spicer1984 ; Vejerano2018 ; Larsson1996 complicate things further, since a lipid layer can be formed on its surface, significantly slowing down the evaporation frenkiel1965evaporation ; redrow2011modeling . Nevertheless, for our purposes, Eq. (6) is sufficient to estimate the droplet evaporation time and demonstrate the effect of RH.
We thus arrive at the question of what happens with a falling water droplet—does it fall to the ground or does it evaporate before reaching it? The answer to this question was first provided by William F. Wells in his seminal work in 1934 wells1934air , where he established what we call today Wells evaporation-falling curves, shown in Fig. 5C. These curves are diagrams of time (traditionally in the reverse sense) versus the initial droplet size. Orange line in Fig. 5C shows the time needed for a droplet to reach the ground (i.e., the sedimentation time of Eq. (3) in absence of evaporation), and blue lines show the evaporation times at different RH [Eq. (6)]. The diagram demonstrates a clear dichotomy of two distinct fates that depend on the initial size of the droplet: Small droplets will evaporate before reaching the ground, whereas larger ones will reach the ground before they disappear. With this diagram, Wells suggested that large respiratory droplets ( m) settle on the ground quickly whereas smaller ones ( m) dry out and any nonvolatile materials (including bacteria and viruses) stay suspended in the air for significant periods of time.
This notion provided the first clue about the difference between the transmission of infections by deposition of large droplets and by airborne routes. Wells evaporation-falling curves depend on ambient RH and suggest that higher RH slows down evaporation and increases the amount of droplets that deposit on the ground. But while Wells curves are historically important, they oversimplify the actual fate of respiratory droplets. One of the main reasons is that respiratory droplets never evaporate entirely but instead only to around half their initial size, as we will see next.
3.2 Droplets containing solutes
Human respiratory droplets are composed mainly of water ( to ), with the remainder being mostly inorganic ions, sugars, proteins, lipids, DNA, and, potentially, pathogens. While the exact droplet composition depends strongly on many factors, the typical mass or volume proportion of non-water content in a droplet is around to Chartier2009 ; Effros2002 ; Johnson2011 ; Raphael1989 ; Spicer1984 . A hypothetically completely dried-out droplet devoid of water would thus have a radius of
| (7) |
between and of the initial droplet radius. However, a droplet never dries out completely as some water remains sorbed inside, its amount governed by RH nicas2005toward . Currently, it is unclear how droplet composition influences the final droplet size and the response to RH liu2017evaporation . Clearly, respiratory droplets contain very complex organic macromolecular structures, made out of mostly hydrophilic molecules with considerable hydration effects, which are consequently strongly hygroscopic liu2017evaporation . We will examine two extreme cases of the response of droplet size to RH (Fig. 6). In the first case, we will assume ideal mixing of solutes with water, which allows for a simple mathematical derivation. The second case involves crystallization of salt in the droplet, triggering an abrupt change in the droplet size.
3.2.1 Droplet size: Ideal mixing
From a thermodynamic perspective, evaporation occurs because the liquid water in the droplet has a higher chemical potential than the unsaturated vapor phase surrounding the droplet. The chemical potential of the vapor phase at a given relative to bulk water (or saturated vapor at ) is , where is the Boltzmann constant and the temperature. When a nonvolatile solute is introduced into the droplet, the water chemical potential subsides. In the approximation of ideal mixing, the chemical potential of water with solute is smaller than the one of pure water by , with the mole fraction of water. If the initial amount of solute in the droplet is small () and the surrounding relative humidity is 100%, water starts to evaporate from the droplet. With that, decreases over time, and so does the chemical potential. Evaporation continues until the chemical potential of water in the droplet reaches the one of vapor, . From here, we obtain an estimate that the evaporation stops once the water fraction in the droplet reaches and, likewise, when the solid content is . Note that the contribution of the Laplace pressure to the chemical potential is negligibly small and becomes relevant only for nanometer-sized droplets.
The final, equilibrium volume of the dried out droplet, termed the droplet residue or droplet nucleus, is the sum of the water and solute content. For simplicity, we assume that solute molecules are of similar size as the water molecules, which makes the total volume of the droplet residue larger than the volume of a completely dried out droplet [Eq. (7)] by a factor of , namely netz2020droplets
| (8) |
If we again assume the solute content of respiratory droplets to be between and , the dried-out droplet shrinks down to to of the initial radius at . In other words, a droplet residue is between and of the initial size of an exhaled respiratory droplet, as has already been suggested by numerous studies nicas2005toward ; Yang2011 ; liu2017evaporation . RH thus controls not only the evaporation rate [Eq. (6)] but, as implied by Eq. (8), also the final size of the residue (as noted by, e.g., Effros et al. Effros2002 and Nicas et al. nicas2005toward ). An important consequence is that at higher RH, droplet residues are larger, which in turn makes them sediment to the ground faster. According to Eq. (8), increasing RH from to increases the residue size by . This result is, of course, very approximate and merely provides qualitative insights. More complex mathematical models take into account the non-ideality of mixing and even distinguish between aqueous salt phase and the insoluble solid material (e.g., mucous organics and potential pathogens) liu2017evaporation . The qualitative conclusions are, however, always the same: Droplet nuclei maintain a larger size in humid air than in dry air. Nonetheless, the precise relationship between the size of a respiratory droplet residue and RH is still largely unknown, and research on how RH influences the final size of droplet residues is surprisingly very limited liu2017evaporation .
3.2.2 Droplet size: Non-ideal mixing and efflorescence
Non-ideal mixing of solutes with water can lead to dramatic, non-continuous processes in a shrinking droplet during evaporation. For instance, during evaporation of water containing inorganic salts such as NaCl, salt concentration increases, and in the bulk phase, salt crystallization typically occurs upon reaching saturation. However, in small droplets, salt concentration can overcome the solubility limit and can push the system deep into a supersaturated, metastable state Gregson2018 . If evaporation continues (e.g., if RH is low enough) and salt concentration increases further, salt eventually crystallizes, and all the water evaporates in an efflorescence transition—solidification of supersaturated solution—as shown in Fig. 7A. The inverse process, termed deliquescence (liquefaction of a solid particle), occurs at significantly higher RH.
The metastability can typically be explained by classical nucleation theory as an interplay between the interfacial free energy of the crystal-water phase boundary and the chemical potential difference between the water and crystalline phases. The interfacial free energy acts as a barrier to the formation of a crystal nucleus, which enables droplets to reach very high levels of supersaturation before efflorescence occurs. Efflorescence in small droplets can proceed via different pathways, ranging from homogeneous nucleation, internally mixed nucleation (relevant for droplets with multiple components that can act as nucleating agents), and contact-induced nucleation (due to collisions between droplets) pohlker2014efflorescence ; davis2017crystal . Exact details are, however, not entirely understood davis2017crystal . Whether or not efflorescence transition occurs depends both on the type of salt Martin2000 ; Mikhailov2004 as well as on the size and composition of the droplet Biskos2006 ; Cheng2015 ; Martin2000 . For instance, NaCl has an efflorescence RH of choudhury2013pattern ; Cohen1987 ; Gregson2018 ; Mikhailov2004 , while no transitions are observed for ammonium nitrate Mikhailov2004 .
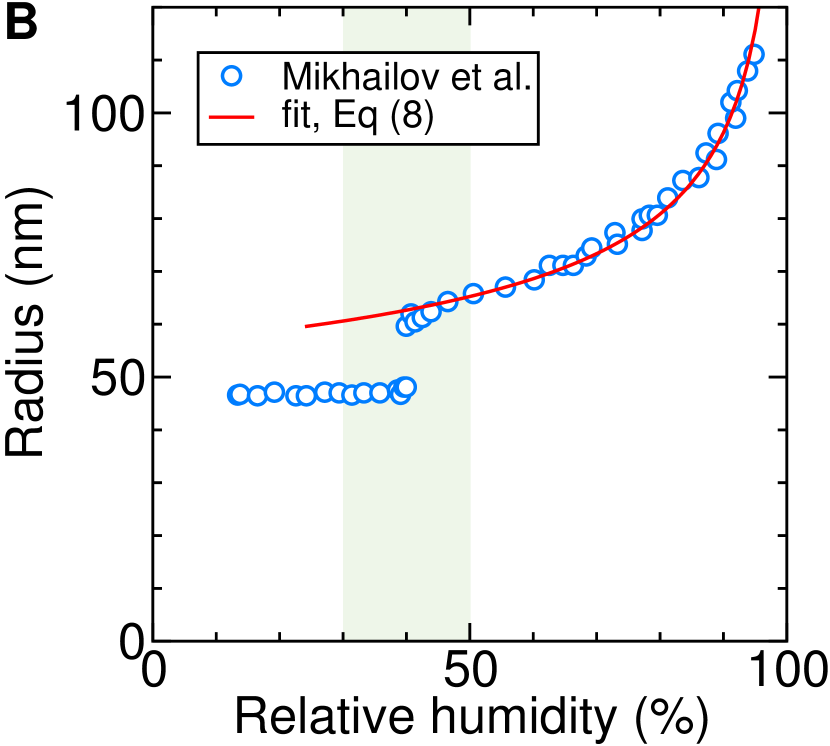
Are these crystallization phenomena also important for respiratory droplets? The majority of our knowledge on hygroscopic properties of small particles comes from atmospheric sciences martin2008phase ; o2015liquid ; posfai1998wet ; you2012images ; marcolli2006phase , which is unfortunately difficult to generalize to respiratory droplets, as the latter contain a different and typically much more complex organization of organic compounds such as proteins and lipids kumar2003organic ; Mikhailov2004 ; mokbel1997study . Furthermore, droplet composition varies widely between individuals and within individuals over time Effros2002 , especially in the case of disease pacht1991deficiency ; Sanchez2011 ; Spicer1984 , and so does the response of the droplets to RH. A good starting point for understanding the hydration nature of respiratory droplets are thus simple salt-water droplets containing proteins. As an example, Fig. 7B shows how a droplet containing NaCl and of bovine serum albumin protein—a popular model for proteins and macromolecular compounds—shrinks upon dehydration when lowering the ambient RH, obtained from experiments by Mikhailov et al. Mikhailov2004 . At high RH, droplet size follows very well the approximate expression given by Eq. (8). At around , however, the radius suddenly drops, indicating an efflorescence transition. Consequently, the difference in the sizes of droplet residues at and RH is almost —much larger than predicted by the ideal-mixing model [without an efflorescence transition, Eq. (8)]. Interestingly, efflorescence of aqueous particles, whether with NaCl and/or protein content, occurs at RH of —right in the middle of the typical range of ambient RH of to ! Notably, this shows that efflorescence transition can be an essential player at typical indoor conditions that govern the dynamics of respiratory droplets. Mikhailov et al. Mikhailov2004 further observed that upon dehydration, proteins seemingly limit the nucleation of salt crystals, leading to higher stability of supersaturated salt solution and inhibition of NaCl efflorescence.
Synthetic droplets with a respiratory-fluid-like composition were also shown to undergo a phase separation upon dehydration where mucin proteins separate and localize at the droplet surface, forming an envelope Vejerano2018 . This can inhibit access of water vapor to the particle core and lead to kinetic limitations of water exchange, phase transitions, and microstructural rearrangement processes posfai1998wet ; Mikhailov2004 . Besides surface and kinetic effects, proteins and comparable organic macromolecules can also influence the thermodynamic properties of the aqueous bulk solution, and there is even indirect evidence for changes in pH and gelation processes Vejerano2018 . It is also important to stress that phase transitions of sub-micron particles can behave very differently than predictions made using phase diagrams of bulk materials mifflin2009morphology .
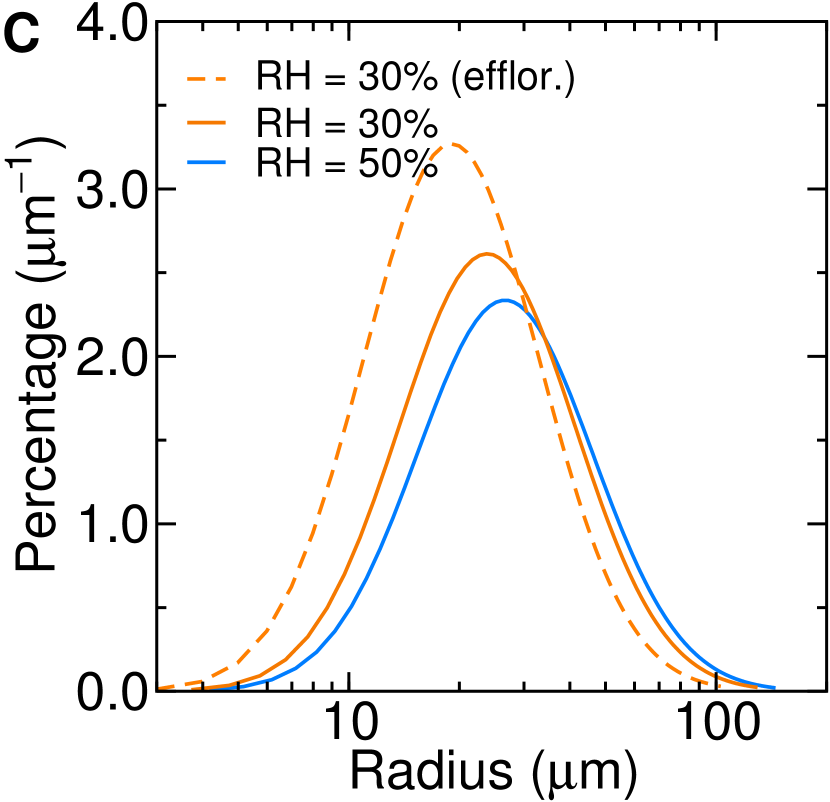
From this discussion, we can conclude that when RH is lowered from to , a respiratory droplet residue can shrink in diameter anywhere from (in the case of ideal mixing) to (when efflorescence occurs) of its initial size. RH and efflorescence transition thus have important implications for the general distribution of respiratory droplet sizes: Using the droplet residue size distribution of Xie et al. xie2009exhaled at (Fig. 4), we can recalculate the size distributions at and using Eq. (8), yielding the solid curves in Fig. 7C, while the dashed line shows the case of efflorescence at (assuming a shrinking compared to the sizes at ). Despite these effects, the possibility that (at least some) droplets can effloresce has typically been neglected in most—but not all—theoretical models xie2007far ; liu2017short ; wang2020transport ; dbouk2020coughing ; Pendar2020numerical ; busco2020sneezing . In the next two sections, we will discus the implications of the droplet shrinking range (in the presence and absence of efflorescence) on the sedimentation dynamics and aerosol deposition of respiratory droplets.
4 Droplet sedimentation
When assessing the risk of droplet and airborne transmission of disease, a crucial parameter is the time that respiratory droplets spend in the air before they deposit to the ground or other surfaces. We have seen in Sec. 3 that the evaporation of a typical respiratory droplet stops once it shrinks down to around half of its initial size. We can now estimate the sedimentation time of such a droplet, anticipating that RH will have a significant effect—unlike in our estimate for the sedimentation time of a droplet in the absence of evaporation [Eq. (3)]. We will follow the approximation recently proposed by Netz netz2020droplets , in which droplet radius shrinks from the initial value of down to the equilibrium value , where is a shrinking factor, given by Eq. (8) for the case of ideal mixing. The shrinking occurs in time , where is the evaporation time of a pure water droplet [Eq. (6)]. After , droplet radius remains constant at . With this assumption in mind and using Eqs. (2) and (5), we can write the expression for time-dependent sedimentation velocity as
| (9) |
Since we can neglect acceleration effects (Sec. 3), we integrate the velocity in Eq. (9) up to the time when the droplet touches the ground. This gives us the height from which the droplet was released,
| (10) |
Equation (10) provides the relationship between the initial droplet radius and its sedimentation time, and allows us to make a simple estimate of how quickly respiratory droplets settle to the ground at various RH. If we know the total number of pathogen particles contained within the droplets in the air—referred to as the pathogen load—we can estimate the concentration of the pathogen remaining in the air at a given time (e.g., after a single exhalation event, such as a cough or a sneeze). Assuming further that pathogen concentration is the same in all exhaled droplets, the initial pathogen load (i.e., the total number of pathogen particles) is simply proportional to the total initial volume of the droplets exhaled into the air. Evaporation alone does not change the number of pathogens in the droplets, and we can thus evaluate the relative pathogen load (the load at a given time relative to the initial load) as the cumulative volume of the (dried-out) droplet residues that have not yet sedimented to the ground divided by the volume of all initially exhaled droplet residues. To do this, we integrate the (dried-out) droplet volume weighted by a suitable size distribution from up to a cutoff radius , the upper radius of those droplets that have not yet sedimented during time . Thus, is obtained as from Eq. 10. The relative load is then
| (11) |
The coefficient ensures the normalization to the initial condition , i.e., that at all the exhaled droplets are in the air.
As an example, we calculate the relative pathogen load dynamics for the three droplet size distributions shown in Fig. 7C. We use Eq. (8) to calculate the initial distribution of droplet radii and assume that the initial volume fraction of dry material is . The resulting relative loads as a function of time [Eq. (11)] are shown in Fig. 8A. We can see that the vast majority (around ) of the initial load released in the exhaled droplets from the height of m settles to the ground within to s, independently of RH. During this initial period, only the largest droplets, which did not significantly evaporate during the descent, have sedimented—they fall almost as rigid bodies busco2020sneezing . Afterwards, the effects of evaporation and RH become noticeable. At (blue curve), droplets settle more rapidly than at (orange-shaded band), owing to the fact that (i) evaporation is slower and (ii) the final droplet residues are larger at higher RH. At and in the absence of efflorescence (where the droplet residues are smaller than at ; shown by solid orange line), sedimentation is only marginally slower. However, sedimentation slows down significantly when efflorescence occurs (and the droplet residues are smaller than at ; indicated by the dashed orange line).
To express the result in another way, we can also calculate the ratio between the relative pathogen loads at and , as shown in Fig. 8B. The difference gradually increases over time: After s, the relative pathogen load at RH is between to of that at RH. After one minute, this difference already amounts to - to -fold. This simple calculation demonstrates that despite quite small differences in the residue sizes in the RH range of to , changes in RH and the presence or absence of efflorescence still have a significant impact on the settling of droplets from the air.
The calculation presented in this section demonstrates in a simple way how a decrease in RH from to affects the deposition of respiratory droplets. More complex models take many other hydrodynamic factors into account, such as the buoyancy effect and the speed of the exhaled air jet, ventilation, and breathing mode xie2007far ; liu2017short ; wang2020transport ; dbouk2020coughing ; Pendar2020numerical ; busco2020sneezing . The conclusions are always qualitatively consistent with the prediction of Wells wells1934air that droplets settle more slowly at low RH. The studies, however, usually do not quantify the differences between and RH, relevant for ambient conditions. Moreover, most of them, as already noted, unfortunately do not take into account the possibility of salt efflorescence.
5 Deposition of aerosol
Our estimate of droplet sedimentation, presented in Fig. 8, implies that at around of the initially exhaled droplet volume from a typical cough settles within s. The remaining droplet residues that are still in air at that point are smaller than m in radius [see Eq. (3)]. Even though these small particles present less than of the initially exhaled pathogen load, they can travel substantially longer distances and are also more likely to be captured in the respiratory tract mccluskey1996detection . Moreover, infectious droplets smaller than m can penetrate deeper into the respiratory tract (i.e., pulmonary region, which is the most sensitive part of the lungs) and have more serious health implications Gralton2011 ; nicas2005toward . Unlike larger droplet residues, settling of these small residues is not governed by gravitational sedimentation alone but is influenced also by other environmental factors laRosa2013 ; morawska2005droplet ; Nazaroff2016 ; Vuorinen2020 . Namely, the air in a typical indoor setting is never undisturbed but is overwhelmed with air currents and flows, which impact the sedimentation of the small droplets.
Typical airflow speeds inside buildings are around ms (convection currents, breathing, human thermal plume), but certain human activities (walking, opening and closing doors) produce short-lived flows of around ms (Fig. 9A) wei2016airborne . These currents perturb the sedimentation of those droplets whose sedimentation velocity is comparable to or smaller than the airflow speed, which is relevant for particles smaller than m (see Table LABEL:tab:1). The smaller the particle, the more it is influenced by the airflow rather than the gravity and the longer it remains in the air morawska2005droplet . These small respiratory droplet residues form a suspension in air and are therefore often referred to as aerosol or even bioaerosol morawska2005droplet ; Nazaroff2016 . As described in Sec. 2, the exact boundary for what should be considered aerosol is challenging to define, and the transition between the two regimes is not at all sharp, but continuous instead Gralton2011 .
Small aerosol particles eventually collide and stick to the ground as a result of impact, which happens when the air stream changes its direction and the particle comes in contact with a surface (interception) or when the particle does not follow the changing air stream because of inertia (inertial impaction; relevant for larger particles). For sub-micron particles, Brownian diffusion is an important transport mechanism, enabling them to deviate from air streams, thus increasing their probability of deposition (Fig. 9B) jonsson2014bioaerosol . The crossover between interception, impaction, and diffusion deposition mechanisms lies in the range of to m, where the contribution of the three mechanisms is the smallest, and aerosol particles in this size range therfore stay in the air the longest hussein2009deposition ; Nazaroff2016 .
Deposition mechanisms of aerosol are, contrary to the sedimentation of large droplets, not a deterministic but a stochastic process. In a closed indoor environment, without active filtering and in a well-mixed condition, the concentration of particles of radius decays exponentially with time thatcher2002effects :
| (12) |
Here, is the air-exchange rate in the room (corresponding to ventilation) and is the first-order deposition loss rate coefficient. Air-exchange rate vanishes in a perfectly sealed room, but typically varies between h-1 in residential buildings and h-1 in public spaces toolbox and does not depend on aerosol type. On the other hand, the deposition rate varies widely across different conditions thatcher2002effects : It depends both on the aerosol properties (e.g., size and shape) as well as on the environmental parameters such as surface area, surface roughness, setup (e.g., furnishing), airflow conditions, electrical charge, and temperature gradients byrne1995stable ; long2001using ; thatcher2002effects ; vette2001characterization ; xu1994deposition ; hussein2009deposition ; wang2020assessment .
Figure 10A shows the loss rate coefficients for small particles with radii from to m in a furnished room with several ventilation intensities (no fan, mild fan, and strong fan). We can see that the deposition rate scales roughly linearly with the particle size, (in this regime, interception and inertial impaction dominate over the diffusion deposition). Enhanced air movement increases the rate of particle deposition because it delivers particles more rapidly to the surfaces where they deposit Nazaroff2016 . The mean lifetime of aerosol in the air scales as according to Eq. (12). For an aerosol residue with m at (with h-1 and h-1), this makes the mean lifetime approximately min. When RH is lowered to , this particular residue shrinks down to to m, depending on whether efflorescence transition occurs or not (Fig. 7C). Consequently, the deposition rate is reduced ( to h-1), and the mean lifetime extends to to min. Even though this might not seem much, the difference builds up with time owing to the exponential nature of deposition, as shown in Fig. 10B. The difference is negligible in the first minutes, but after an hour, the ratio between concentrations at 50% and 30% RH ranges from to (the span again reflecting the presence and absence of efflorescence).
Clearly, the effect of RH on deposition of small aerosol particles is much weaker than its effect on the sedimentation of larger droplets (Sec. 4). Even though it is not entirely clear how RH influences the size of droplet residues, the physics of deposition in the two regimes is completely different. Sedimentation time of larger droplets (m) scales inversely with the square of their size, [Eq. (3)], while the lifetime of smaller aerosol particles ( to m) in the air scales roughly as [Eq. (12)]. The size dependence of the lifetime of smaller aerosol particles is thus much weaker than for larger droplets. Finally, for aerosol sizes in the range of to m, the deposition mechanisms are very weak and measurements consequently exhibit substantial variability. Therefore, it is much more difficult to predict the fate of sub-micron aerosol particles Nazaroff2016 ; thatcher2002effects .
6 Viruses in respiratory droplets
One of the important reasons to try to understand the behavior of respiratory droplets, their aerosolization, and sedimentation is that they often carry viruses and other pathogens and are thus an important source of disease transmission Fernstrom2013 ; Kutter2018 ; laRosa2013 ; Verreault2008 . The amount of viable, infectious virus particles in an individual droplet is characterized by viral load—the amount of virus in a given volume of the droplet medium (e.g., sputum or saliva) Gralton2011 . Recent review by Poon et al. Poon2020 points out that even at high viral loads of to copies/ml (characteristic of, e.g., SARS-CoV-2 Bar2020 ; Pan2020 ; To2020 ; To2020b ; Wolfel2020 and some other respiratory viruses Wang2004 ; Yezli2011 ), this results in approximately only of small, -m-large droplets carrying one or more virus particles. This is in accord with recent studies of respiratory viruses, which have shown that even large loads of viral RNA translate into only a small count of viruses in droplet and aerosol particles Leung2020 ; Stadnytskyi2020 (note also that viral load given by RNA count can overestimate the number of infectious viral particles Bar2020 ). However, the sheer amount of droplets produced during various activities such as speaking or coughing (Sec. 2) can carry a significant number of viruses even when a single droplet contains at most few copies Xu2020 . Estimates for instance show that minute of loud speaking can generate more than virus-containing droplets that can remain airborne for more than minutes Stadnytskyi2020 .
As droplets are exhaled, viruses start a voyage that is all but “hospitable”—dehydrated droplet particles can be in fact a very hostile environment. Viruses are now directly exposed to various harmful factors such as temperature Sattar1987 ; Sooryanarain2015 ; Tang2009 ; Verreault2008 , UV radiation First2007 ; Tseng2005 ; Walker2007 , atmospheric gasses Mik1977 ; Tseng2006 , different types of surfaces on which droplets deposit Chan2011 ; vanDoremalen2020 ; Kim2012 ; Mahl1975 ; Thomas2008 , and other factors Benbough1971b ; Bovallius1987 ; Haddrell2017 ; Happ1966 . It is thus not surprising that in general viruses cannot survive in these conditions indefinitely. Nonetheless, many viruses can remain infectious for long periods in both airborne and deposited droplet particles Benbough1971b ; Verreault2008 . The most significant factors influencing their survival appear to be temperature, humidity, and the nature and composition of the droplets themselves Moriyama2020 ; Sattar1987 ; Sooryanarain2015 ; Tang2009 ; Verreault2008 . Of these, increase in environmental temperature (e.g., from to ∘C) quite universally speeds up the decay of viruses in droplets Elazhary1979a ; Harper1961 ; Hermann2007 ; Ijaz1987a ; Schoenbaum1990 . Note again, however, that despite this fact, low winter temperature is not considered as a direct driver of the seasonality of respiratory infections Fisman2012seasonality , mostly because the temperature is regulated in indoor spaces, where most infections occur Moriyama2020 ; Nazaroff2016 .
RH, on the other hand, is more directly related to seasonal changes because of indoor heating (Fig. 2), but its impact on viruses is not universal. In particular, virus viability decreases as RH falls below , since the droplet gets more and more dehydrated and the environment progressively deviates from physiological conditions. Surprisingly, virus viability very often recovers as RH is decreased below , giving rise to a quite common U-shaped viability curve in response to RH, as seen in Fig. 11. In the relevant range of ambient conditions, to , decreasing the air humidity can thus increase the amount of viruses that survive in the droplets. Importantly, from the infection point of view, this effect acts together with the effect of weaker droplet deposition at low RH in making drier air more effective for the spread of infections. As we will see in the following, the response of virus viability to changes in RH is affected in different ways and degrees by virus structure, the presence, composition, and concentration of solutes, pH gradients, and the available air-water interface, making it difficult to draw general conclusions Tang2009 ; Verreault2008 ; Yang2012 .
6.1 RH and virus structure
Response of virus survival to changes in RH has often been linked to the presence or absence of a lipid envelope Tang2009 ; Verreault2008 ; Yang2012 . Broadly speaking, enveloped viruses (such as influenza viruses, coronaviruses, and RSV) tend to survive longer at low RH (), while non-enveloped viruses (such as adenoviruses, rhinoviruses, and polioviruses) tend to survive longer at high RHs ( to ), with being in general favorable for virus survival regardless of the lipid envelope. Enveloped viruses furthermore often show the distinct, U-shaped non-monotonic pattern in the response of their survival to changes in RH (Fig. 11), with a significant decrease in survival at intermediate RH Tang2009 ; Verreault2008 ; Yang2012 . These general observations are, however, not always consistent, and exceptions abound among both enveloped and non-enveloped viruses Donaldson1976 ; Ijaz1987a ; Ijaz1985b ; Rabey1969 ; Schoenbaum1990 ; Songer1967 . The effects of RH on survival differ from virus to virus Lowen2007 ; Prussin2018 ; Verreault2008 or even between different strains of the same virus Donaldson1972 ; Sooryanarain2015 , making it difficult to draw any conclusions based on the structure of the virus alone. For instance, Lin and Marr Lin2019 recently studied inactivation kinetics of two bacteriophages, the enveloped and the non-enveloped MS2. They observed that the magnitude of decay was similar between the two, and both viruses showed a non-monotonic pattern in viability with respect to changes in RH, suggesting a common inactivation mechanism.
6.2 RH and droplet composition
Evaporation of water from the droplet induces various physico-chemical transformations in the droplet such as changes in the concentration of solutes (e.g., ions and proteins) as well as changes in the pH Lin2019 ; Marr2019 ; Vejerano2018 ; Yang2012b . Not only does droplet composition thus influence the sedimentation behavior of respiratory droplets (as we exhaustively discussed in Sec. 3), but it also crucially affects the way an aerosolized virus survives or is inactivated Benbough1971a ; Vejerano2018 ; Zuo2014 ; Yang2012b . While the micro-environment in the droplet is close to physiological conditions at very high RH () and becomes dry when RH is low (; Fig. 6), it is likely that virus viability at intermediate RH is governed mostly by the droplet composition, giving rise to the non-monotonic U-shaped pattern of the virus survival response to RH (Fig. 11B). To understand the role that droplet composition plays in the response of virus viability in droplets at different RH, we must see how the main components of respiratory droplets—salt, lipids, and proteins—react to RH, and how this affects virus viability.
Salt ions are a ubiquitous component in physiological fluids, and when their concentration changes, the viability of enveloped and non-enveloped viruses exhibits different responses. Adding salt to a droplet medium has been shown to improve rather than reduce the viability of some non-enveloped viruses Benbough1971a ; Harper1963 , which is potentially related to the observations that screening of electrosatic interactions due to salt ions is in general beneficial to the stability of (often highly charged Bozic2012 ; Siber2012 ) non-enveloped viruses Buzon2020 ; Comas2019 ; Garmann2014 ; Hagan2020 ; Lavelle2009 ; Perlmutter2014 ; Chen2018 . On the other hand, salt ions usually have a toxic effect on enveloped viruses, but the precise mechanisms remain unclear Yang2012 . The way enveloped viruses acquire their lipid membrane varies from virus to virus Garoff1998 ; Perlmutter2015 ; Welsch2007 , and in some cases the complexation of capsid protein and lipid membrane is driven by electrostatic interactions Furukawa2020 ; Perlmutter2015 , which are influenced by changes in salt concentration. Salt ions also interact with lipid membranes and can cause structural and mechanical changes Lee2008 ; Pabst2007 ; Vacha2009 ; Valley2011 ; Petrache2006 , potentially leading to inactivation of enveloped viruses Benbough1969 ; Choi2015 ; Sooryanarain2015 ; Yang2012 ; Yang2012b . The major role of ionic concentration for the assembly and stability of enveloped viruses thus seems related predominantly to the stability of lipid membranes and the interactions of various capsid proteins with the membranes.
It is also important to clarify the link between salt concentration, RH, and virus viability. As water evaporates from a respiratory droplet, salt ions become more concentrated, yet their concentration does not correlate with RH in a linear manner Cohen1987 ; Lin2019 ; Yang2012 . Concentration of salt in the droplet residue depends on both droplet composition and RH: An initial concentration of mM NaCl can thus increase all the way up to M during evaporation Lin2019 . Even higher concentrations can lead to an efflorescence transition, where salt crystallizes (at least partially) out of the aqueous part of the droplet (Sec. 3.2.2). Yang et al. Yang2012b ; Yang2012 identified three regimes of RH for the viability of influenza A virus, closely related to the U-shaped viability curves (Fig. 11): (i) Close to , salt concentration in the droplet stays at levels close to physiological conditions, and virus viability is thus well-preserved. (ii) Intermediate values of RH ( to ) involve concentrated and even supersaturated salt conditions that can be toxic to the virus, and viability consequently decreases with decreasing RH. (iii) In a very dry environment (), salts can undergo efflorescence and crystallize out of the solution. The concentration of the remaining dissolved ions in the droplet residue is low, and consequently virus viability improves. If that is the case, the phenomenon of efflorescence turns out once again to be one of the culprits for the higher likelihood of droplet transmission at low RH, as it both reduces the size and sedimentation of droplets (Sec. 3.2.2) and at the same time improves the viability of aerosolized viruses.
Respiratory droplets can differ to great extent in the amount of various proteins, biopolymers, and lipids they contain (Table 1), which is important as studies have observed different responses of virus viability to changes in RH based on the origin and composition of droplets. Saliva has, for instance, been indicated to provide an important initial barrier to influenza A infection White2009 , and both cell culture medium and artificial saliva have been shown to be more protective still Zuo2014 . On the other hand, influenza virus has been observed to survive much longer on banknotes when in the presence of respiratory mucus Thomas2008 , and extracellular material containing mucins has been shown to provide a (concentration-dependent) protective effect against RH-dependent decay of both influenza A and bacteriophage 6 Kormuth2018 . At low RH, mucin has also been shown to protect viruses from damage by dehydration Vejerano2018 . Peptones, lipids, and apolar amino acids also reduce virus losses, probably by protecting them against surface inactivation Donaldson1976 ; Ehrlich1964 ; Hemmes1960 ; Trouwborst1972b ; Trouwborst1974 ; Vejerano2018 , and protective effects have also been reported for polyhdroxy compounds Benbough1971a ; Schaffer1976 . Importantly, the protecting concentrations of these components can be related to the salt concentration in the droplet medium Benbough1971a ; Trouwborst1972b ; Yang2012b . The total composition of the droplet is the one determining how the droplet shrinks with time and whether or not it undergoes an efflorescence transition.
6.3 Droplet pH
Droplets can also vary in their pH Effros2002 ; Freedman2018 ; Hunt2000 ; Wei2018 , which can change with RH and with that affect the viability of aerosolized viruses by changing the electrostatic properties or conformation of viral proteins Bozic2018 ; Roshal2019 ; Taylor2002 ; Yang2012 ; Asor2020 ; Chevreuil2018 ; Cuellar2010 . The response of enveloped viruses to changes in RH further depends on whether the process of fusion requires low pH or not Yang2012 . Viruses that require acidification before fusion (such as influenza virus and SARS-associated coronavirus) were found to be less stable at intermediate RH ( to ) compared to higher and lower RH. Viruses that fuse at neutral pH (such as RSV) were found to be more stable at intermediate RH, and viruses that can fuse at both low and neutral pH (for example vaccinia virus and pigeon pox virus) were found to be insensitive to RH. pH also interacts with other variables: Stallknecht et al. Stallknecht1990 observed a strong interactive effect between pH and salinity on the viability of influenza virus. The viability was highest at zero salt and high pH, high at high salt and low pH, but lowest at both high salt and high pH as well as low salt and low pH.
6.4 Inactivation at the air-water interface
The fate of aerosolized viruses depends not only on the physico-chemical environment in the droplet but also on the precise location of the virus inside it, as droplets themselves can be internally heterogeneous Vejerano2018 and viruses that adsorb at their air-water interface (AWI) can be inactivated to a great extent. The reasons are dehydration and unfavourable interactions with the AWI, including surface tension, shear stress, denaturation of proteins in contact with air, and conformational rearrangements driven by hydrophobicity Casanova2010 ; Thompson1998 ; Thompson1999 ; Trouwborst1973 ; Zeng2017 ; Zuo2014 . The contribution of different mechanisms depends on RH, as droplet evaporation changes the AWI available for virus accumulation Yang2012 . The extent to which a virus is attracted to the AWI is influenced both by the ionic strength and pH of the suspending medium as well as by the relative hydrophobicity, surface charge, and shape of the virus Armanious2016 ; Okubo1995 ; Villa2020 ; Wan2002 . Both high ionic strength and large surface hydrophobicity (which differs from virus to virus Heldt2017 ; Johnson2017 ) create a high affinity for virus adsorption to the AWI Thompson1999 ; Zuo2014 . Adsorption to the AWI is also influenced by changes in pH Torres2016 (and therefore the net surface charge of the virus Bozic2017 ; Bozic2018b ). Furthermore, enveloped viruses are more affected by surface inactivation at the AWI than non-enveloped ones Donaldson1976 , either because of differences in their affinity for the adsorption to the AWI or because they are not affected by interfacial forces in the same manner as non-enveloped viruses Mitev2002 ; Thompson1999 . Surface-active compounds in the droplet, such as various proteins, amino acids, and surfactants, can accumulate at the AWI Bzdek2017 and in doing so prevent the aerosolized viruses from reaching the AWI and being inactivated Thompson1999 , showing once more the importance of droplet composition for the survivability of enclosed viruses.
6.5 Experimental factors
The observations relating virus viability to changes in RH are further complicated by the interplay between temperature and humidity Hermann2007 ; Moe1983 ; Tang2009 ; Zhao2012 and the varying conditions under which the experiments are performed (e.g., droplet composition and aerosol ageing; Fig. 11) Pica2012 ; Sattar1987 ; Tang2009 ; Yang2012 ; Yang2012b . Often, droplet composition is simplified in both experimental and theoretical models and comprises salt ions, proteins, and surfactants to different extents Pica2012 ; Sattar1987 ; Tang2009 . For instance, salt ions are not always included in model respiratory droplets, and when they are, their concentrations range anywhere from to mM Marr2019 ; Vejerano2018 ; Yang2012b . The exact nature and concentration of salt ions or proteins in model respiratory droplets could thus prove critical in determining the RH-dependent response of virus viability upon aerosolization. Different artificial means of producing virus aerosols may also not be comparable to the natural release of viruses in saliva or respiratory mucus Vejerano2018 ; Zuo2014 , which can act as an organic barrier against environmental extremes Tang2009 . The composition of both saliva and respiratory mucus is a complex mixture containing different electrolytes, proteins, and surfactants, with each of the components exceeding the mass of the virus by several orders of magnitude Lin2019 ; Vejerano2018 ; Zuo2014 and potentially influencing virus survival Humphrey2001 ; Malamud2011 ; Zanin2016 .
7 Conclusions
Seasonal periodicity of respiratory infections in humans is driven by complex mechanisms, ranging from environmental to social. Mounting evidence suggests that a critical player in the observed seasonality is the RH of air inside buildings. Low indoor RH, as experienced during winter months or inside airplanes, directly or indirectly influences several mechanisms that increase the transmission of respiratory diseases. In this review, we attempted to summarize and elucidate those known physical mechanisms of droplet and airborne transmission that are influenced by RH.
RH starts to play a role the moment respiratory droplets are exhaled into the air. Dry air accelerates droplet evaporation while at the same time dehydrates them more, so that the size of droplet residues after evaporation has stopped is smaller than in more humid air. Both effects cause the droplets to settle to the ground more slowly and remain in the air longer at low RH, thereby leaving more potential pathogens suspended in the air. RH furthermore governs the extent to which viruses carried by the droplets survive. This relationship is complex and depends both on the droplet composition as well as on the structure of the virus, where enveloped viruses tend in general to be more vulnerable to environmental changes. Quite remarkably, the viability of several viruses improves when RH is lowered below , which is also one of the explanations for the strong seasonality of the influenza virus. An important yet less noticed phenomenon that accompanies evaporation of respiratory droplets is efflorescence, which, as evidence suggests, occurs at least to some extent in respiratory droplets. It accentuates the effects of RH by rapidly changing droplet size, consequently affecting the detailed nature of droplet composition.
Indoor RH during winter in temperate climates is typically around to lower than during summer, and an important reason for this are heating and poor ventilation of indoor spaces Sundell2011 ; Hobday2013 ; Bentayeb2015 . This review shows that maintaining indoor RH at is not only the most comfortable level for humans but perhaps also a good target value to aid in preventing the spread of infectious diseases. A better understanding of where and how it affects the behavior of droplets and any pathogens contained in them would allow us to exploit this knowledge to control indoor RH in such a way as to minimize the spread of droplet- and aerosol-borne disease.
Acknowledgements.
We thank Roland R. Netz, Rudolf Podgornik, and Luca Tubiana for fruitful discussions and comments. We acknowledge funding from the Slovenian Research Agency ARRS (Research Core Funding No. P1-0055 and Research Grant No. J1-1701).References
- (1) A. Fernstrom, M. Goldblatt, Aerobiology and its role in the transmission of infectious diseases. J. Pathog. 2013 (2013)
- (2) G. La Rosa, M. Fratini, S.D. Libera, M. Iaconelli, M. Muscillo, Viral infections acquired indoors through airborne, droplet or contact transmission. Ann. Ist. Super. Sanita 49, 124 (2013)
- (3) D. Verreault, S. Moineau, C. Duchaine, Methods for sampling of airborne viruses. Microbiol. Mol. Biol. Rev. 72, 413 (2008)
- (4) J.A. Belser, T.R. Maines, T.M. Tumpey, J.M. Katz, Influenza a virus transmission: contributing factors and clinical implications. Expert Rev. Mol. Med. 12 (2010)
- (5) J. Gralton, E. Tovey, M.L. McLaws, W.D. Rawlinson, The role of particle size in aerosolised pathogen transmission: a review. J. Infection 62, 1 (2011)
- (6) W.W. Nazaroff, Indoor bioaerosol dynamics. Indoor Air 26, 61 (2016)
- (7) R. Tellier, Aerosol transmission of influenza A virus: a review of new studies. J. R. Soc. Interface 6, S783 (2009)
- (8) R.J. Thomas, Particle size and pathogenicity in the respiratory tract. Virulence 4, 847 (2013)
- (9) J.S. Kutter, M.I. Spronken, P.L. Fraaij, R.A. Fouchier, S. Herfst, Transmission routes of respiratory viruses among humans. Curr. Op. Virol. 28, 142 (2018)
- (10) H. Huang, C. Fan, M. Li, H.L. Nie, F.B. Wang, H. Wang, R. Wang, J. Xia, X. Zheng, X. Zuo, et al., COVID-19: A call for physical scientists and engineers. ACS Nano 14, 3747 (2020)
- (11) T.F. Booth, B. Kournikakis, N. Bastien, J. Ho, D. Kobasa, L. Stadnyk, Y. Li, M. Spence, S. Paton, B. Henry, et al., Detection of airborne severe acute respiratory syndrome (SARS) coronavirus and environmental contamination in SARS outbreak units. J. Infect. Dis. 191, 1472 (2005)
- (12) K. Chan, J. Peiris, S. Lam, L. Poon, K. Yuen, W. Seto, The effects of temperature and relative humidity on the viability of the SARS coronavirus. Adv. Virol. 2011 (2011)
- (13) S.J. Dancer, J.W. Tang, L.C. Marr, S. Miller, L. Morawska, J.L. Jimenez, Putting a balance on the aerosolization debate around SARS-CoV-2. J. Hosp. Infect. 105, 569 (2020)
- (14) H. Sooryanarain, S. Elankumaran, Environmental role in influenza virus outbreaks. Annu. Rev. Anim. Biosci. 3, 347 (2015)
- (15) L. Morawska, J.W. Tang, W. Bahnfleth, P.M. Bluyssen, A. Boerstra, G. Buonanno, J. Cao, S. Dancer, A. Floto, F. Franchimon, et al., How can airborne transmission of COVID-19 indoors be minimised? Environ. Int. 142, 105832 (2020)
- (16) S.F. Dowell, M.S. Ho, Seasonality of infectious diseases and severe acute respiratory syndrome–what we don’t know can hurt us. Lancet Infect. Dis. 4, 704 (2004)
- (17) M. Galanti, R. Birger, M. Ud-Dean, I. Filip, H. Morita, D. Comito, S. Anthony, G.A. Freyer, S. Ibrahim, B. Lane, et al., Longitudinal active sampling for respiratory viral infections across age groups. Influenza Other Respir. Viruses 13, 226 (2019)
- (18) M. Moriyama, W.J. Hugentobler, A. Iwasaki, Seasonality of respiratory viral infections. Annu. Rev. Virol. 7, 83 (2020)
- (19) B. Visseaux, C. Burdet, G. Voiriot, F.X. Lescure, T. Chougar, O. Brugière, B. Crestani, E. Casalino, C. Charpentier, D. Descamps, et al., Prevalence of respiratory viruses among adults, by season, age, respiratory tract region and type of medical unit in Paris, France, from 2011 to 2016. PLOS ONE 12, e0180888 (2017)
- (20) D. Fisman, Seasonality of viral infections: mechanisms and unknowns. Clin. Microbiol. Infect. 18, 946 (2012)
- (21) C. Viboud, W.J. Alonso, L. Simonsen, Influenza in tropical regions. PLOS Med. 3 (2006)
- (22) E.R. Deyle, M.C. Maher, R.D. Hernandez, S. Basu, G. Sugihara, Global environmental drivers of influenza. Proc. Natl. Acad. Sci. USA 113, 13081 (2016)
- (23) N. Pica, N.M. Bouvier, Environmental factors affecting the transmission of respiratory viruses. Curr. Op. Virol. 2, 90 (2012)
- (24) J. Tamerius, M.I. Nelson, S.Z. Zhou, C. Viboud, M.A. Miller, W.J. Alonso, Global influenza seasonality: reconciling patterns across temperate and tropical regions. Environ. Health Persp. 119, 439 (2011)
- (25) J.W. Tang, T.P. Loh, Correlations between climate factors and incidence—a contributor to RSV seasonality. Rev. Med. Virol. 24, 15 (2014)
- (26) W. Yang, L.C. Marr, Dynamics of airborne influenza A viruses indoors and dependence on humidity. PLOS ONE 6, e21481 (2011)
- (27) D.J. Earn, D. He, M.B. Loeb, K. Fonseca, B.E. Lee, J. Dushoff, Effects of school closure on incidence of pandemic influenza in alberta, canada. Ann. Intern. Med. 156, 173 (2012)
- (28) S.F. Dowell, Seasonal variation in host susceptibility and cycles of certain infectious diseases. Emerg. Infect. Dis. 7, 369 (2001)
- (29) G. Harper, Airborne micro-organisms: survival tests with four viruses. J. Hyg., Camb. 59, 479 (1961)
- (30) K. Engvall, P. Wickman, D. Norbäck, Sick building syndrome and perceived indoor environment in relation to energy saving by reduced ventilation flow during heating season: a 1 year intervention study in dwellings. Indoor Air 15, 120 (2005)
- (31) A.T. Hodgson, S.J. Nabinger, A.K. Persily, Volatile organic compound concentrations and emission rates measured over one year in a new manufactured house. Tech. rep., Lawrence Berkeley National Lab.(LBNL), Berkeley, CA (United States) (2004)
- (32) J.L. Nguyen, J. Schwartz, D.W. Dockery, The relationship between indoor and outdoor temperature, apparent temperature, relative humidity, and absolute humidity. Indoor Air 24, 103 (2014)
- (33) H. Zhang, H. Yoshino, Analysis of indoor humidity environment in Chinese residential buildings. Build. Environ. 45, 2132 (2010)
- (34) F. Tariku, Y. Simpson, Seasonal indoor humidity levels of apartment suites in a mild coastal climate. J. Archit. Eng. 21, B4015001 (2015)
- (35) Tutiempo Network, S.L. World weather. https://en.tutiempo.net/climate/1994/ws-25260.html (2020). Accessed 14. 10. 2020
- (36) Y. Sunwoo, C. Chou, J. Takeshita, M. Murakami, Y. Tochihara, Physiological and subjective responses to low relative humidity in young and elderly men. J. Physiol. Anthropol. 25, 229 (2006)
- (37) T. Hildenbrand, R.K. Weber, D. Brehmer, Rhinitis sicca, dry nose and atrophic rhinitis: a review of the literature. Eur. Arch. Otorhinolaryngol. 268, 17 (2011)
- (38) T.M. Mäkinen, R. Juvonen, J. Jokelainen, T.H. Harju, A. Peitso, A. Bloigu, S. Silvennoinen-Kassinen, M. Leinonen, J. Hassi, Cold temperature and low humidity are associated with increased occurrence of respiratory tract infections. Respir. Med. 103, 456 (2009)
- (39) J.M. Reiman, B. Das, G.M. Sindberg, M.D. Urban, M.E. Hammerlund, H.B. Lee, K.M. Spring, J. Lyman-Gingerich, A.R. Generous, T.H. Koep, et al., Humidity as a non-pharmaceutical intervention for influenza A. PLOS ONE 13 (2018)
- (40) R. Hobday, S. Dancer, Roles of sunlight and natural ventilation for controlling infection: historical and current perspectives. J. Hosp. Infect. 84, 271 (2013)
- (41) World Health Organization and others, Infection prevention and control of epidemic-and pandemic-prone acute respiratory diseases in health care: WHO interim guidelines. Tech. rep., Geneva: World Health Organization (2007)
- (42) L. Morawska, in Proceedings of Indoor Air 2005: the 10th International Conference on Indoor Air Quality and Climate (Springer, 2005), pp. 9–23
- (43) X. Xie, Y. Li, A. Chwang, P. Ho, W. Seto, How far droplets can move in indoor environments – revisiting the Wells evaporation-falling curve. Indoor Air 17, 211 (2007)
- (44) S. Asadi, A.S. Wexler, C.D. Cappa, S. Barreda, N.M. Bouvier, W.D. Ristenpart, Aerosol emission and superemission during human speech increase with voice loudness. Sci. Rep. 9, 1 (2019)
- (45) L. Morawska, G. Johnson, Z. Ristovski, M. Hargreaves, K. Mengersen, S. Corbett, C.Y.H. Chao, Y. Li, D. Katoshevski, Size distribution and sites of origin of droplets expelled from the human respiratory tract during expiratory activities. J. Aerosol Sci. 40, 256 (2009)
- (46) X. Xie, Y. Li, H. Sun, L. Liu, Exhaled droplets due to talking and coughing. J. Roy. Soc. Interface 6, S703 (2009)
- (47) C.Y.H. Chao, M.P. Wan, L. Morawska, G.R. Johnson, Z. Ristovski, M. Hargreaves, K. Mengersen, S. Corbett, Y. Li, X. Xie, et al., Characterization of expiration air jets and droplet size distributions immediately at the mouth opening. J. Aerosol Sci. 40, 122 (2009)
- (48) G. Johnson, L. Morawska, Z. Ristovski, M. Hargreaves, K. Mengersen, C.Y.H. Chao, M. Wan, Y. Li, X. Xie, D. Katoshevski, et al., Modality of human expired aerosol size distributions. J. Aerosol Sci. 42, 839 (2011)
- (49) G.A. Somsen, C. van Rijn, S. Kooij, R.A. Bem, D. Bonn, Small droplet aerosols in poorly ventilated spaces and SARS-CoV-2 transmission. Lancet Respir. Med. 8, 658 (2020)
- (50) J. Fiegel, R. Clarke, D.A. Edwards, Airborne infectious disease and the suppression of pulmonary bioaerosols. Drug Discov. Today 11, 51 (2006)
- (51) P. Anfinrud, V. Stadnytskyi, C.E. Bax, A. Bax, Visualizing speech-generated oral fluid droplets with laser light scattering. N. Engl. J. Med. 382, 2061 (2020)
- (52) V. Stadnytskyi, C.E. Bax, A. Bax, P. Anfinrud, The airborne lifetime of small speech droplets and their potential importance in SARS-CoV-2 transmission. Proc. Natl. Acad. Sci. USA 117, 11875 (2020)
- (53) J.O. Lloyd-Smith, S.J. Schreiber, P.E. Kopp, W.M. Getz, Superspreading and the effect of individual variation on disease emergence. Nature 438, 355 (2005)
- (54) Z. Shen, F. Ning, W. Zhou, X. He, C. Lin, D.P. Chin, Z. Zhu, A. Schuchat, Superspreading SARS events, Beijing, 2003. Emerging Infect. Dis. 10, 256 (2004)
- (55) R.M. Effros, K.W. Hoagland, M. Bosbous, D. Castillo, B. Foss, M. Dunning, M. Gare, W. Lin, F. Sun, Dilution of respiratory solutes in exhaled condensates. Am. J. Respir. Crit. Care Med. 165, 663 (2002)
- (56) L. Scheideler, H.G. Manke, U. Schwulera, O. Inacker, H. Hämmerle, Detection of nonvolatile macromolecules in breath: a possible diagnostic tool? Am. Rev. Respir. Dis. 148, 778 (1993)
- (57) S. Spicer, J. Martinez, Mucin biosynthesis and secretion in the respiratory tract. Environ. Health Perspect. 55, 193 (1984)
- (58) J.M. Gould, J.N. Weiser, Expression of C-reactive protein in the human respiratory tract. Infect. Immun. 69, 1747 (2001)
- (59) L. Ruocco, B. Fattori, A. Romanelli, M. Martelloni, A. Casani, M. Samolewska, R. Rezzonico, A new collection method for the evaluation of nasal mucus proteins. Clin. Exp. Allergy 28, 881 (1998)
- (60) H.Y. Reynolds, J. Chrétien, Respiratory tract fluids: analysis of content and contemporary use in understanding lung diseases. Disease-a-month 30, 1 (1984)
- (61) G. Sánchez, V. Miozza, A. Delgado, L. Busch, Determination of salivary levels of mucin and amylase in chronic periodontitis patients. J. Periodontal Res. 46, 221 (2011)
- (62) E.P. Vejerano, L.C. Marr, Physico-chemical characteristics of evaporating respiratory fluid droplets. J. R. Soc. Interface 15, 20170939 (2018)
- (63) L.C. Marr, J.W. Tang, J. Van Mullekom, S.S. Lakdawala, Mechanistic insights into the effect of humidity on airborne influenza virus survival, transmission and incidence. J. R. Soc. Interface 16, 20180298 (2019)
- (64) E.W. Larson, J.W. Dominik, T. Slone, Aerosol stability and respiratory infectivity of Japanese B encephalitis virus. Infect. and Immun. 30, 397 (1980)
- (65) R.R. Netz, Mechanisms of airborne infection via evaporating and sedimenting droplets produced by speaking. J. Phys. Chem. B 124, 7093 (2020)
- (66) J. Barrett, C. Clement, Growth rates for liquid drops. J. Aerosol Sci. 19, 223 (1988)
- (67) K. Beard, H.R. Pruppacher, A wind tunnel investigation of the rate of evaporation of small water drops falling at terminal velocity in air. J. Atmos. Sci. 28, 1455 (1971)
- (68) E.J. Davis, Transport phenomena with single aerosol particles. Aerosol Sci. Tech. 2, 121 (1982)
- (69) N. Frossling, Über die verdunstung fallernder tropfen. Gerlands Beitr. Geophys. 52, 170 (1938)
- (70) G.D. Kinzer, R. Gunn, The evaporation, temperature and thermal relaxation-time of freely falling waterdrops. J. Meteorol. 8(2), 71 (1951)
- (71) R.R. Netz, W.A. Eaton, Physics of virus transmission by speaking droplets. Proc. Natl. Acad. Sci. USA 117, 25209 (2020)
- (72) J. Kukkonen, T. Vesala, M. Kulmala, The interdependence of evaporation and settling for airborne freely falling droplets. J. Aerosol Sci. 20, 749 (1989)
- (73) B. Larsson, G. Olivecrona, T. Ericson, Lipids in human saliva. Archs. Oral Biol. 41, 105 (1996)
- (74) J. Frenkiel, Evaporation reduction: physical and chemical principles and review of experiments. Tech. rep., Unesco (1965)
- (75) J. Redrow, S. Mao, I. Celik, J.A. Posada, Z.g. Feng, Modeling the evaporation and dispersion of airborne sputum droplets expelled from a human cough. Build. Environ. 46, 2042 (2011)
- (76) W. Wells, On air-borne infection: Study ii. Droplets and droplet nuclei. Am. J. Epidemiol. 20, 611 (1934)
- (77) Y. Chartier, C. Pessoa-Silva, Natural ventilation for infection control in health-care settings (World Health Organization, 2009)
- (78) G.D. Raphael, E.V. Jeney, J.N. Baraniuk, I. Kim, S.D. Meredith, M.A. Kaliner, et al., Pathophysiology of rhinitis. lactoferrin and lysozyme in nasal secretions. J. Clin. Investig. 84, 1528 (1989)
- (79) M. Nicas, W.W. Nazaroff, A. Hubbard, Toward understanding the risk of secondary airborne infection: emission of respirable pathogens. J. Occup. Environ. Hyg. 2, 143 (2005)
- (80) L. Liu, J. Wei, Y. Li, A. Ooi, Evaporation and dispersion of respiratory droplets from coughing. Indoor Air 27, 179 (2017)
- (81) F. Gregson, J. Robinson, R. Miles, C. Royall, J. Reid, Drying kinetics of salt solution droplets: Water evaporation rates and crystallization. J. Phys. Chem. B 123, 266 (2018)
- (82) C. Pöhlker, J. Saturno, M.L. Krüger, J.D. Förster, M. Weigand, K.T. Wiedemann, M. Bechtel, P. Artaxo, M.O. Andreae, Efflorescence upon humidification? X-ray microspectroscopic in situ observation of changes in aerosol microstructure and phase state upon hydration. Geophys. Res. Lett. 41, 3681 (2014)
- (83) R.D. Davis, M.A. Tolbert, Crystal nucleation initiated by transient ion-surface interactions at aerosol interfaces. Sci. Adv. 3, e1700425 (2017)
- (84) S.T. Martin, Phase transitions of aqueous atmospheric particles. Chem. Rev. 100, 3403 (2000)
- (85) E. Mikhailov, S. Vlasenko, R. Niessner, U. Pöschl, Interaction of aerosol particles composed of protein and salts with water vapor: hygroscopic growth and microstructural rearrangement. Atmos. Chem. Phys 4, 323 (2004)
- (86) G. Biskos, A. Malinowski, L. Russell, P. Buseck, S. Martin, Nanosize effect on the deliquescence and the efflorescence of sodium chloride particles. Aerosol Sci. Tech. 40, 97 (2006)
- (87) Y. Cheng, H. Su, T. Koop, E. Mikhailov, U. Pöschl, Size dependence of phase transitions in aerosol nanoparticles. Nature Comm. 6, 1 (2015)
- (88) M.D. Choudhury, T. Dutta, S. Tarafdar, Pattern formation in droplets of starch gels containing NaCl dried on different surfaces. Colloids Surf. A 432, 110 (2013)
- (89) M.D. Cohen, R.C. Flagan, J.H. Seinfeld, Studies of concentrated electrolyte solutions using the electrodynamic balance. 1. Water activities for single-electrolyte solutions. J. Phys. Chem. 91, 4563 (1987)
- (90) S.T. Martin, T. Rosenoern, Q. Chen, D.R. Collins, Phase changes of ambient particles in the Southern Great Plains of Oklahoma. Geophys. Res. Lett. 35 (2008)
- (91) R.E. O’Brien, B. Wang, S.T. Kelly, N. Lundt, Y. You, A.K. Bertram, S.R. Leone, A. Laskin, M.K. Gilles, Liquid-liquid phase separation in aerosol particles: Imaging at the nanometer scale. Environ. Sci. Technol. 49(8), 4995 (2015)
- (92) M. Pósfai, H. Xu, J.R. Anderson, P.R. Buseck, Wet and dry sizes of atmospheric aerosol particles: An AFM-TEM study. Geophys. Res. Lett. 25, 1907 (1998)
- (93) Y. You, L. Renbaum-Wolff, M. Carreras-Sospedra, S.J. Hanna, N. Hiranuma, S. Kamal, M.L. Smith, X. Zhang, R.J. Weber, J.E. Shilling, et al., Images reveal that atmospheric particles can undergo liquid–liquid phase separations. Proc. Natl. Acad. Sci. USA 109, 13188 (2012)
- (94) C. Marcolli, U.K. Krieger, Phase changes during hygroscopic cycles of mixed organic/inorganic model systems of tropospheric aerosols. J. Phys. Chem. A 110, 1881 (2006)
- (95) P.P. Kumar, K. Broekhuizen, J. Abbatt, Organic acids as cloud condensation nuclei: Laboratory studies of highly soluble and insoluble species. Atmos. Chem. Phys 3, 509 (2003)
- (96) I. Mokbel, S. Ye, J. Jose, P. Xans, Study of non ideality of various aqueous sodium chloride solutions by vapor pressures measurements and correlation of experimental results by pitzer’s method. J. Chim. Phys. 94, 122 (1997)
- (97) E.R. Pacht, A.P. Timerman, M.G. Lykens, J. Merola, Deficiency of alveolar fluid glutathione in patients with sepsis and the adult respiratory distress syndrome. Chest 100, 1397 (1991)
- (98) A. Mifflin, M. Smith, S. Martin, Morphology hypothesized to influence aerosol particle deliquescence. Phys. Chem. Chem. Phys. 11, 10095 (2009)
- (99) L. Liu, Y. Li, P.V. Nielsen, J. Wei, R.L. Jensen, Short-range airborne transmission of expiratory droplets between two people. Indoor Air 27, 452 (2017)
- (100) B. Wang, H. Wu, X.F. Wan, Transport and fate of human expiratory droplets—a modeling approach. Phys. Fluids 32, 083307 (2020)
- (101) T. Dbouk, D. Drikakis, On coughing and airborne droplet transmission to humans. Phys. Fluids 32, 053310 (2020)
- (102) M.R. Pendar, J.C. Páscoa, Numerical modeling of the distribution of virus carrying saliva droplets during sneeze and cough. Phys. Fluids 32, 083305 (2020)
- (103) G. Busco, S.R. Yang, J. Seo, Y.A. Hassan, Sneezing and asymptomatic virus transmission. Phys. Fluids 32, 073309 (2020)
- (104) R. McCluskey, R. Sandin, J. Greene, Detection of airborne cytomegalovirus in hospital rooms of immuncompromised patients. J. Virol. Methods 56, 115 (1996)
- (105) V. Vuorinen, M. Aarnio, M. Alava, V. Alopaeus, N. Atanasova, M. Auvinen, N. Balasubramanian, H. Bordbar, P. Erästö, R. Grande, et al., Modelling aerosol transport and virus exposure with numerical simulations in relation to SARS-CoV-2 transmission by inhalation indoors. Saf. Sci. 130, 104866 (2020)
- (106) J. Wei, Y. Li, Airborne spread of infectious agents in the indoor environment. Am. J. Infect. Control 44, S102 (2016)
- (107) P. Jonsson, G. Olofsson, T. Tjärnhage, Bioaerosol detection technologies (Springer, 2014)
- (108) T. Hussein, A. Hruška, P. Dohányosová, L. Džumbová, J. Hemerka, M. Kulmala, J. Smolík, Deposition rates on smooth surfaces and coagulation of aerosol particles inside a test chamber. Atmos. Environ 43, 905 (2009)
- (109) T.L. Thatcher, A.C. Lai, R. Moreno-Jackson, R.G. Sextro, W.W. Nazaroff, Effects of room furnishings and air speed on particle deposition rates indoors. Atmos. Environ. 36, 1811 (2002)
- (110) Engineering toolbox. https://www.engineeringtoolbox.com (2001)
- (111) M. Byrne, A. Goddard, C. Lange, J. Roed, Stable tracer aerosol deposition measurements in a test chamber. J. Aerosol Sci. 26, 645 (1995)
- (112) C.M. Long, H.H. Suh, P.J. Catalano, P. Koutrakis, Using time-and size-resolved particulate data to quantify indoor penetration and deposition behavior. Environ. Sci. Technol. 35, 2089 (2001)
- (113) A.F. Vette, A.W. Rea, P.A. Lawless, C.E. Rodes, G. Evans, V.R. Highsmith, L. Sheldon, Characterization of indoor-outdoor aerosol concentration relationships during the Fresno PM exposure studies. Aerosol Sci. Tech. 34, 118 (2001)
- (114) M. Xu, M. Nematollahi, R.G. Sextro, A.J. Gadgil, W.W. Nazaroff, Deposition of tobacco smoke particles in a low ventilation room. Aerosol Sci. Tech. 20, 194 (1994)
- (115) W. Wang, S. Kimoto, N. Kato, N.T. Thuong, Y. Matsui, M. Yoneda, Assessment of air purification effect in sheltering houses equipped with ventilation systems after air pollution incidents. Build. Environ. 172, 106701 (2020)
- (116) W.C. Poon, A.T. Brown, S.O. Direito, D.J. Hodgson, L.L. Nagard, A. Lips, C.E. MacPhee, D. Marenduzzo, J.R. Royer, A.F. Silva, et al., Soft matter science and the COVID-19 pandemic. Soft Matter 16, 8310 (2020)
- (117) Y.M. Bar-On, A. Flamholz, R. Phillips, R. Milo, Science forum: SARS-CoV-2 (COVID-19) by the numbers. eLife 9, e57309 (2020)
- (118) Y. Pan, D. Zhang, P. Yang, L.L. Poon, Q. Wang, Viral load of SARS-CoV-2 in clinical samples. Lancet Infect. Dis. 20, 411 (2020)
- (119) K.K.W. To, O.T.Y. Tsang, W.S. Leung, A.R. Tam, T.C. Wu, D.C. Lung, C.C.Y. Yip, J.P. Cai, J.M.C. Chan, T.S.H. Chik, et al., Temporal profiles of viral load in posterior oropharyngeal saliva samples and serum antibody responses during infection by SARS-CoV-2: an observational cohort study. Lancet Infect. Dis. 20, 565 (2020)
- (120) K.K.W. To, O.T.Y. Tsang, C.C.Y. Yip, K.H. Chan, T.C. Wu, J.M.C. Chan, W.S. Leung, T.S.H. Chik, C.Y.C. Choi, D.H. Kandamby, et al., Consistent detection of 2019 novel coronavirus in saliva. Clin. Infect. Dis. 71, 841 (2020)
- (121) R. Wölfel, V.M. Corman, W. Guggemos, M. Seilmaier, S. Zange, M.A. Müller, D. Niemeyer, T.C. Jones, P. Vollmar, C. Rothe, et al., Virological assessment of hospitalized patients with COVID-2019. Nature 581, 465 (2020)
- (122) W.K. Wang, S.Y. Chen, I.J. Liu, Y.C. Chen, H.L. Chen, C.F. Yang, P.J. Chen, S.H. Yeh, C.L. Kao, L.M. Huang, et al., Detection of SARS-associated coronavirus in throat wash and saliva in early diagnosis. Emerg. Infect. Dis. 10, 1213 (2004)
- (123) S. Yezli, J.A. Otter, Minimum infective dose of the major human respiratory and enteric viruses transmitted through food and the environment. Food Environ. Virol. 3, 1 (2011)
- (124) N.H. Leung, D.K. Chu, E.Y. Shiu, K.H. Chan, J.J. McDevitt, B.J. Hau, H.L. Yen, Y. Li, D.K. Ip, J.M. Peiris, et al., Respiratory virus shedding in exhaled breath and efficacy of face masks. Nature Med. 26, 676 (2020)
- (125) R. Xu, B. Cui, X. Duan, P. Zhang, X. Zhou, Q. Yuan, Saliva: potential diagnostic value and transmission of 2019-nCoV. Int. J. Oral Sci. 12, 1 (2020)
- (126) S.A. Sattar, M.K. Ijaz, C.P. Gerba, Spread of viral infections by aerosols. Crit. Rev. Environ. Sci. Technol. 17, 89 (1987)
- (127) J.W. Tang, The effect of environmental parameters on the survival of airborne infectious agents. J. R. Soc. Interface 6, S737 (2009)
- (128) M. First, S.N. Rudnick, K.F. Banahan, R.L. Vincent, P.W. Brickner, Fundamental factors affecting upper-room ultraviolet germicidal irradiation—part i. Experimental. J. Occup. Environ. Hyg. 4, 321 (2007)
- (129) C.C. Tseng, C.S. Li, Inactivation of virus-containing aerosols by ultraviolet germicidal irradiation. Aerosol Sci. Technol. 39, 1136 (2005)
- (130) C.M. Walker, G. Ko, Effect of ultraviolet germicidal irradiation on viral aerosols. Environ. Sci. Technol. 41, 5460 (2007)
- (131) G. de Mik, I. de Groot, J. Gerbrandy, Survival of aerosolized bacteriophage X174 in air containing ozone-olefin mixtures. J. Hyg., Camb. 78, 189 (1977)
- (132) C.C. Tseng, C.S. Li, Ozone for inactivation of aerosolized bacteriophages. Aerosol Sci. Technol. 40, 683 (2006)
- (133) N. van Doremalen, T. Bushmaker, D.H. Morris, M.G. Holbrook, A. Gamble, B.N. Williamson, A. Tamin, J.L. Harcourt, N.J. Thornburg, S.I. Gerber, J.O. Lloyd-Smith, E. de Wit, V.J. Munster, Aerosol and surface stability of SARS-CoV-2 as compared with SARS-CoV-1. N. Engl. J. Med. 382, 1564 (2020)
- (134) S.J. Kim, J. Si, J.E. Lee, G. Ko, Temperature and humidity influences on inactivation kinetics of enteric viruses on surfaces. Environ. Sci. Technol. 46, 13303 (2012)
- (135) M. Mahl, C. Sadler, Virus survival on inanimate surfaces. Can. J. Microbiol. 21, 819 (1975)
- (136) Y. Thomas, G. Vogel, W. Wunderli, P. Suter, M. Witschi, D. Koch, C. Tapparel, L. Kaiser, Survival of influenza virus on banknotes. Appl. Environ. Microbiol. 74, 3002 (2008)
- (137) J. Benbough, A. Hood, Viricidal activity of open air. J. Hyg., Camb. 69, 619 (1971)
- (138) A. Bovallius, R. Roffey, Aerobiology and spread of microbial diseases. Def. Sci. J. 37, 185 (1987)
- (139) A.E. Haddrell, R.J. Thomas, Aerobiology: experimental considerations, observations, and future tools. Appl. Environ. Microbiol. 83 (2017)
- (140) J.W. Happ, J.B. Harstad, L.M. Buchanan, Effect of air ions on submicron T1 bacteriophage aerosols. Appl. Environ. Microbiol. 14, 888 (1966)
- (141) M. Elazhary, J. Derbyshire, Aerosol stability of bovine parainfluenza type 3 virus. Can. J. Comp. Med. 43, 295 (1979)
- (142) J. Hermann, S. Hoff, C. Muñoz-Zanzi, K.J. Yoon, M. Roof, A. Burkhardt, J. Zimmerman, Effect of temperature and relative humidity on the stability of infectious porcine reproductive and respiratory syndrome virus in aerosols. Vet. Res. 38, 81 (2007)
- (143) M. Ijaz, Y. Karim, S. Sattar, C. Johnson-Lussenburg, Development of methods to study the survival of airborne viruses. J. Virol. Methods 18, 87 (1987)
- (144) M. Schoenbaum, J. Zimmerman, G. Beran, D. Murphy, Survival of pseudorabies virus in aerosol. Am. J. Vet. Res. 51, 331 (1990)
- (145) W. Yang, S. Elankumaran, L.C. Marr, Relationship between humidity and influenza A viability in droplets and implications for influenza’s seasonality. PLOS ONE 7, e46789 (2012)
- (146) W. Yang, L.C. Marr, Mechanisms by which ambient humidity may affect viruses in aerosols. Appl. Environ. Microbiol. 78, 6781 (2012)
- (147) A. Donaldson, N. Ferris, The survival of some air-borne animal viruses in relation to relative humidity. Vet. Microbiol. 1, 413 (1976)
- (148) M.K. Ijaz, S.A. Sattar, C.M. Johnson-Lussenburg, V. Springthorpe, Comparison of the airborne survival of calf rotavirus and poliovirus type 1 (Sabin) aerosolized as a mixture. Appl. Environ. Microbiol. 49, 289 (1985)
- (149) F. Rabey, R.J. Janssen, L.M. Kelley, Stability of St. Louis encephalitis virus in the airborne state. Appl. Environ. Microbiol. 18, 880 (1969)
- (150) J.R. Songer, Influence of relative humidity on the survival of some airborne viruses. Appl. Environ. Microbiol. 15, 35 (1967)
- (151) A.C. Lowen, S. Mubareka, J. Steel, P. Palese, Influenza virus transmission is dependent on relative humidity and temperature. PLoS Pathog. 3, e151 (2007)
- (152) A.J. Prussin, D.O. Schwake, K. Lin, D.L. Gallagher, L. Buttling, L.C. Marr, Survival of the enveloped virus Phi6 in droplets as a function of relative humidity, absolute humidity, and temperature. Appl. Environ. Microbiol. 84, e00551 (2018)
- (153) A. Donaldson, The influence of relative humidity on the aerosol stability of different strains of foot-and-mouth disease virus suspended in saliva. J. Gen. Virol. 15, 25 (1972)
- (154) K. Lin, L.C. Marr, Humidity-dependent decay of viruses, but not bacteria, in aerosols and droplets follows disinfection kinetics. Environ. Sci. Technol. 54, 1024 (2019)
- (155) J. Benbough, Some factors affecting the survival of airborne viruses. J. Gen. Virol. 10, 209 (1971)
- (156) Z. Zuo, T.H. Kuehn, A.Z. Bekele, S.K. Mor, H. Verma, S.M. Goyal, P.C. Raynor, D.Y. Pui, Survival of airborne MS2 bacteriophage generated from human saliva, artificial saliva, and cell culture medium. Appl. Environ. Microbiol. 80, 2796 (2014)
- (157) G. Harper, The influence of environment on the survival of airborne virus particles in the laboratory. Arch. Gesamte Virusforsch. 13, 64 (1963)
- (158) A. Božič, A. Šiber, R. Podgornik, How simple can a model of an empty viral capsid be? Charge distributions in viral capsids. J. Biol. Phys. 38, 657 (2012)
- (159) A. Šiber, A. Božič, R. Podgornik, Energies and pressures in viruses: contribution of nonspecific electrostatic interactions. Phys. Chem. Chem. Phys. 14, 3746 (2012)
- (160) P. Buzón, S. Maity, W.H. Roos, Physical virology: From virus self-assembly to particle mechanics. Wiley Interdiscip. Rev. Nanomed. Nanobiotechnol. 12, e1613 (2020)
- (161) M. Comas-Garcia, Packaging of genomic RNA in positive-sense single-stranded RNA viruses: A complex story. Viruses 11, 253 (2019)
- (162) R.F. Garmann, M. Comas-Garcia, A. Gopal, C.M. Knobler, W.M. Gelbart, The assembly pathway of an icosahedral single-stranded RNA virus depends on the strength of inter-subunit attractions. J. Mol. Biol. 426, 1050 (2014)
- (163) M.F. Hagan, G.M. Grason, Equilibrium mechanisms of self-limiting assembly. arXiv preprint arXiv:2007.01927 (2020)
- (164) L. Lavelle, M. Gingery, M. Phillips, W. Gelbart, C. Knobler, R. Cadena-Nava, J. Vega-Acosta, L. Pinedo-Torres, J. Ruiz-Garcia, Phase diagram of self-assembled viral capsid protein polymorphs. J. Phys. Chem. B 113, 3813 (2009)
- (165) J.D. Perlmutter, M.R. Perkett, M.F. Hagan, Pathways for virus assembly around nucleic acids. J. Mol. Biol. 426, 3148 (2014)
- (166) J. Chen, Y. Lansac, G. Tresset, Interactions between the molecular components of the cowpea chlorotic mottle virus investigated by molecular dynamics simulations. J. Phys. Chem. B 122, 9490 (2018)
- (167) H. Garoff, R. Hewson, D.J.E. Opstelten, Virus maturation by budding. Microbiol. Mol. Biol. Rev. 62, 1171 (1998)
- (168) J.D. Perlmutter, M.F. Hagan, Mechanisms of virus assembly. Annu. Rev. Phys. Chem. 66 (2015)
- (169) S. Welsch, B. Müller, H.G. Kräusslich, More than one door—budding of enveloped viruses through cellular membranes. FEBS Lett. 581, 2089 (2007)
- (170) H. Furukawa, H. Inaba, F. Inoue, Y. Sasaki, K. Akiyoshi, K. Matsuura, Enveloped artificial viral capsids self-assembled from anionic -annulus peptide and cationic lipid bilayer. Chem. Comm. 56, 7092 (2020)
- (171) S.J. Lee, Y. Song, N.A. Baker, Molecular dynamics simulations of asymmetric NaCl and KCl solutions separated by phosphatidylcholine bilayers: potential drops and structural changes induced by strong Na+-lipid interactions and finite size effects. Biophys. J. 94, 3565 (2008)
- (172) G. Pabst, A. Hodzic, J. Štrancar, S. Danner, M. Rappolt, P. Laggner, Rigidification of neutral lipid bilayers in the presence of salts. Biophys. J. 93, 2688 (2007)
- (173) R. Vácha, S.W. Siu, M. Petrov, J. Böckmann, Rainer A and Barucha-Kraszewska, P. Jurkiewicz, M. Hof, M.L. Berkowitz, P. Jungwirth, Effects of alkali cations and halide anions on the DOPC lipid membrane. J. Phys. Chem. A 113, 7235 (2009)
- (174) C.C. Valley, J.D. Perlmutter, A.R. Braun, J.N. Sachs, NaCl interactions with phosphatidylcholine bilayers do not alter membrane structure but induce long-range ordering of ions and water. J. Membr. Biol. 244, 35 (2011)
- (175) H.I. Petrache, T. Zemb, L. Belloni, V.A. Parsegian, Salt screening and specific ion adsorption determine neutral-lipid membrane interactions. Proc. Natl. Acad. Sci. USA 103, 7982 (2006)
- (176) J. Benbough, The effect of relative humidity on the survival of airborne Semliki Forest virus. J. Gen. Virol. 4, 473 (1969)
- (177) H.J. Choi, J.M. Song, B.J. Bondy, R.W. Compans, S.M. Kang, M.R. Prausnitz, Effect of osmotic pressure on the stability of whole inactivated influenza vaccine for coating on microneedles. PLOS ONE 10, e0134431 (2015)
- (178) M. White, E. Helmerhorst, A. Ligtenberg, M. Karpel, T. Tecle, W. Siqueira, F. Oppenheim, K. Hartshorn, Multiple components contribute to ability of saliva to inhibit influenza viruses. Oral Microbiol. Immunol. 24, 18 (2009)
- (179) K.A. Kormuth, K. Lin, A.J. Prussin, E.P. Vejerano, A.J. Tiwari, S.S. Cox, M.M. Myerburg, S.S. Lakdawala, L.C. Marr, Influenza virus infectivity is retained in aerosols and droplets independent of relative humidity. J. Infect. Dis. 218, 739 (2018)
- (180) R. Ehrlich, S. Miller, L. Idoine, Effects of environmental factors on the survival of airborne T-3 coliphage. Appl. Environ. Microbiol. 12, 479 (1964)
- (181) J. Hemmes, K. Winkler, S. Kool, Virus survival as a seasonal factor in influenza and poliomyelitis. Nature 188, 430 (1960)
- (182) T. Trouwborst, K. Winkler, Protection against aerosol-inactivation of bacteriophage T1 by peptides and amino acids. J. Gen. Virol. 17, 1 (1972)
- (183) T. Trouwborst, S. Kuyper, Inactivation of baceriophage T3 in aerosols: Effect of prehumidification on survival after spraying from solutions of salt, peptone, and saliva. Appl. Environ. Microbiol. 27, 834 (1974)
- (184) F. Schaffer, M. Soergel, D. Straube, Survival of airborne influenza virus: effects of propagating host, relative humidity, and composition of spray fluids. Arch. Virol. 51, 263 (1976)
- (185) M.A. Freedman, E.J.E. Ott, K.E. Marak, Role of pH in aerosol processes and measurement challenges. J. Phys. Chem. A 123, 1275 (2018)
- (186) J.F. Hunt, K. Fang, R. Malik, A. Snyder, N. Malhotra, T.A. Platts-Mills, B. Gaston, Endogenous airway acidification: implications for asthma pathophysiology. Am. J. Respir. Crit. Care Med. 161, 694 (2000)
- (187) H. Wei, E.P. Vejerano, W. Leng, Q. Huang, M.R. Willner, L.C. Marr, P.J. Vikesland, Aerosol microdroplets exhibit a stable pH gradient. Proc. Natl. Acad. Sci. USA 115, 7272 (2018)
- (188) A. Božič, A. Šiber, Electrostatics-driven inflation of elastic icosahedral shells as a model for swelling of viruses. Biophys. J. 115, 822 (2018)
- (189) D. Roshal, O. Konevtsova, A. Božič, R. Podgornik, S. Rochal, pH-induced morphological changes of proteinaceous viral shells. Sci. Rep. 9, 5341 (2019)
- (190) D.J. Taylor, N.K. Krishna, M.A. Canady, A. Schneemann, J.E. Johnson, Large-scale, pH-dependent, quaternary structure changes in an RNA virus capsid are reversible in the absence of subunit autoproteolysis. J. Virol. 76, 9972 (2002)
- (191) R. Asor, D. Khaykelson, O. Ben-nun Shaul, Y. Levi-Kalisman, A. Oppenheim, U. Raviv, pH stability and disassembly mechanism of wild-type simian virus 40. Soft Matter 16, 2803 (2020)
- (192) M. Chevreuil, D. Law-Hine, J. Chen, S. Bressanelli, S. Combet, D. Constantin, J. Degrouard, J. Möller, M. Zeghal, G. Tresset, Nonequilibrium self-assembly dynamics of icosahedral viral capsids packaging genome or polyelectrolyte. Nature Comm. 9, 1 (2018)
- (193) J. Cuellar, F. Meinhoevel, M. Hoehne, E. Donath, Size and mechanical stability of norovirus capsids depend on pH: a nanoindentation study. J. Gen. Virol. 91, 2449 (2010)
- (194) D. Stallknecht, M. Kearney, S. Shane, P. Zwank, Effects of pH, temperature, and salinity on persistence of avian influenza viruses in water. Avian Dis. pp. 412–418 (1990)
- (195) L.M. Casanova, S. Jeon, W.A. Rutala, D.J. Weber, M.D. Sobsey, Effects of air temperature and relative humidity on coronavirus survival on surfaces. Appl. Environ. Microbiol. 76, 2712 (2010)
- (196) S.S. Thompson, M. Flury, M.V. Yates, W.A. Jury, Role of the air-water-solid interface in bacteriophage sorption experiments. Appl. Environ. Microbiol. 64, 304 (1998)
- (197) S.S. Thompson, M.V. Yates, Bacteriophage inactivation at the air-water-solid interface in dynamic batch systems. Appl. Environ. Microbiol. 65, 1186 (1999)
- (198) T. Trouwborst, J. De Jong, Interaction of some factors in the mechanism of inactivation of bacteriophage MS2 in aerosols. Appl. Environ. Microbiol. 26, 252 (1973)
- (199) C. Zeng, M. Hernando-Pérez, B. Dragnea, X. Ma, P. Van Der Schoot, R. Zandi, Contact mechanics of a small icosahedral virus. Phys. Rev. Lett. 119, 038102 (2017)
- (200) A. Armanious, M. Aeppli, R. Jacak, D. Refardt, T. Sigstam, T. Kohn, M. Sander, Viruses at solid–water interfaces: a systematic assessment of interactions driving adsorption. Environ. Sci. Technol. 50, 732 (2016)
- (201) T. Okubo, Surface tension of structured colloidal suspensions of polystyrene and silica spheres at the air-water interface. J. Colloid Interf. Sci. 171, 55 (1995)
- (202) S. Villa, A. Stocco, C. Blanc, M. Nobili, Multistable interaction between a spherical brownian particle and an air–water interface. Soft Matter 16, 960 (2020)
- (203) J. Wan, T.K. Tokunaga, Partitioning of clay colloids at air-water interfaces. J. Colloid Interf. Sci. 247, 54 (2002)
- (204) C.L. Heldt, A. Zahid, K.S. Vijayaragavan, X. Mi, Experimental and computational surface hydrophobicity analysis of a non-enveloped virus and proteins. Colloids Surf. B 153, 77 (2017)
- (205) S.A. Johnson, A. Walsh, M.R. Brown, S.C. Lute, D.J. Roush, M.S. Burnham, K.A. Brorson, The step-wise framework to design a chromatography-based hydrophobicity assay for viral particles. J. Chromatogr. B 1061, 430 (2017)
- (206) J.F. Torres-Salgado, M. Comas-Garcia, M.V. Villagrana-Escareño, A.L. Durán-Meza, J. Ruiz-García, R.D. Cadena-Nava, Physicochemical study of viral nanoparticles at the air/water interface. J. Phys. Chem. B 120, 5864 (2016)
- (207) A. Božič, R. Podgornik, Varieties of charge distributions in coat proteins of ssRNA+ viruses. J. Phys. Condens. Matter 30, 024001 (2017)
- (208) A. Božič, R. Podgornik, Anomalous multipole expansion: Charge regulation of patchy, inhomogeneously charged particles. J. Chem. Phys. 149, 163307 (2018)
- (209) D. Mitev, T. Ivanova, C. Vassilieff, Kinetics of lipid layer formation at interfaces. Colloids Surf. B 24, 185 (2002)
- (210) B.R. Bzdek, J.P. Reid, Perspective: Aerosol microphysics: From molecules to the chemical physics of aerosols. J. Chem. Phys. 147, 220901 (2017)
- (211) K. Moe, G. Harper, The effect of relative humidity and temperature on the survival of bovine rotavirus in aerosol. Arch. Virol. 76, 211 (1983)
- (212) Y. Zhao, A.J. Aarnink, R. Dijkman, T. Fabri, M.C. de Jong, P.W.G. Koerkamp, Effects of temperature, relative humidity, absolute humidity, and evaporation potential on survival of airborne Gumboro vaccine virus. Appl. Environ. Microbiol. 78, 1048 (2012)
- (213) S.P. Humphrey, R.T. Williamson, A review of saliva: normal composition, flow, and function. J Prosthet. Dent. 85, 162 (2001)
- (214) D. Malamud, W. Abrams, C. Barber, D. Weissman, M. Rehtanz, E. Golub, Antiviral activities in human saliva. Adv. Dent. Res. 23, 34 (2011)
- (215) M. Zanin, P. Baviskar, R. Webster, R. Webby, The interaction between respiratory pathogens and mucus. Cell Host Microbe 19, 159 (2016)
- (216) J. Sundell, H. Levin, W.W. Nazaroff, W.S. Cain, W.J. Fisk, D.T. Grimsrud, F. Gyntelberg, Y. Li, A. Persily, A. Pickering, et al., Ventilation rates and health: multidisciplinary review of the scientific literature. Indoor air 21, 191 (2011)
- (217) M. Bentayeb, D. Norback, M. Bednarek, A. Bernard, G. Cai, S. Cerrai, K.K. Eleftheriou, C. Gratziou, G.J. Holst, F. Lavaud, et al., Indoor air quality, ventilation and respiratory health in elderly residents living in nursing homes in Europe. Eur. Respir. J. 45, 1228 (2015)