Trimeron-phonon coupling in magnetite
Abstract
Using density functional theory, we study the lattice dynamical properties of magnetite (Fe3O4) in the high-temperature cubic and low-temperature monoclinic phases. The calculated phonon dispersion curves and phonon density of states are compared with the available experimental data obtained by inelastic neutron, inelastic x-ray, and nuclear inelastic scattering. We find a very good agreement between the theoretical and experimental results for the monoclinic structure revealing the strong coupling between charge-orbital (trimeron) order and specific phonon modes. For the cubic phase, clear discrepancies arise which, remarkably, can be understood assuming that the strong trimeron-phonon coupling can be extended above the Verwey transition, with lattice dynamics influenced by the short-range trimeron order instead of the average cubic structure. Our results establish the validity of trimerons (and trimeron-phonon coupling) in explaining the physics of magnetite much beyond their original formulation.
I Introduction
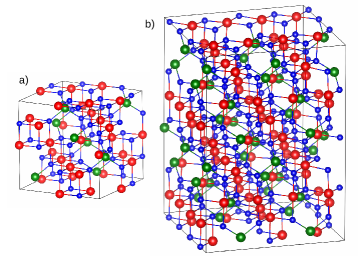
The Verwey transition in magnetite—in which the electrical conductivity changes discontinuously by two orders of magnitude Verwey (1939); Verwey and Haayman (1941)—is one of the most intriguing and extensively studied phenomena in condensed matter physics. The exceptional character of the phase transition stems from a cooperative mechanism involving charge, orbital, spin, and lattice degrees of freedom. Above the transition at K, magnetite crystallizes in the cubic structure Bragg (1915) with the tetrahedrally coordinated -sites occupied by Fe3+ ions and octahedrally coordinated -sites with the mixed valency Fe2.5+. At , magnetite exhibits a structural phase transition Samuelsen et al. (1968); Yamada et al. (1968); Yoshida and Iida (1977); Iizumi et al. (1982); Wright et al. (2001, 2002) from the cubic to the monoclinic symmetry (see Fig. 1) Senn et al. (2012a).
To explain this transition, Verwey postulated a purely electronic mechanism of charge ordering, where the (001) planes are alternatively occupied by Fe and Fe ions below . Subsequently, this simple model was questioned on the basis of diffraction studies Samuelsen et al. (1968); Yamada et al. (1968); Yoshida and Iida (1977); Iizumi et al. (1982) and a more complex charge-orbital (CO) order with 16 nonequivalent sites was identified below Wright et al. (2001, 2002); Senn et al. (2012a); Huang et al. (2006); Nazarenko et al. (2006); Schlappa et al. (2008); Joly et al. (2008); Lorenzo et al. (2008); Blasco et al. (2011); Tanaka et al. (2012); Řezníček et al. (2015, 2017). As demonstrated by density functional theory (DFT) studies, the CO order is a consequence of strong local electron interactions within the states and the coupling of electrons to lattice distortions Leonov et al. (2004); Jeng et al. (2004, 2006); Piekarz et al. (2006, 2007); Pinto and Elliott (2006); Yamauchi et al. (2009). This electron-lattice cooperative behavior results in a complicated pattern composed of three-site polarons, called trimerons Senn et al. (2012a, b). In each trimeron two end Fe3+ cations are shifted towards a central Fe2+ cation 111The Fe2+ denotes Fe ions with slightly smaller valency and larger occupancy of the minority-spin orbitals as compared with a Fe3+ ion. Recently, the soft electronic fluctuations of the trimeron order showing critical behavior close to the Verwey transition have been discovered Baldini et al. (2020). These fluctuations were described through a polaron tunneling model Walz (2002), which involves the coupling between the trimeron structure and phonons.
The interaction between electronic and lattice degrees of freedom is reflected in the precursor effects observed above . The critical behavior of the elastic constant , which softens from room temperature to Moran and Lüthi (1969); Schwenk et al. (2000), was explained in terms of bilinear coupling of the elastic strain to a fluctuation mode of the charge ordering field of symmetry Schwenk et al. (2000). Critical fluctuations above were investigated by diffuse scattering of electrons Chiba et al. (1975), neutrons Fujii et al. (1975); Shapiro et al. (1976); Yamada et al. (1980); Siratori et al. (1998), and x-rays Bosak et al. (2014). Neutron measurements revealed the diffuse scattering at commensurate points in reciprocal space, i.e., at the same wave vectors as the superlattice reflections of the monoclinic phase, only a few kelvins above Fujii et al. (1975).
However, even more intense maxima and in a much broader range of temperatures (even at room temperature) were found at incommensurate vectors close to the and points of the Brillouin zone Shapiro et al. (1976); Yamada et al. (1980); Siratori et al. (1998). Shapiro et al. Shapiro et al. (1976) showed that neutron diffuse scattering centered at zero energy is coupled with transverse acoustic (TA) phonons. This electron-phonon coupling induces anomalous anharmonic behavior of the TA modes, with the largest phonon broadening found at incommensurate points Hoesch et al. (2013).
It is remarkable that an extended x-ray absorption fine structure (EXAFS) study Subías et al. (2005) provided direct evidence that local distortions related to atomic displacements of the monoclinic phase are robust and remain unaltered during the transition. Recently, an x-ray pair distribution function analysis has revealed that local structural fluctuations persist up to the Curie transition at K Perversi et al. (2019). This short-range order (SRO), first postulated by Anderson Anderson (1956), was also identified via several probes: electric conductivity Ihle and Lorenz (1986), muon-spin-relaxation Boekema et al. (1986), optical conductivity Park et al. (1998), photoemission Schrupp et al. (2005), magneto-optical Caicedo et al. (2014), and resonant inelastic x-ray scattering (RIXS) studies Huang et al. (2017).
All the results mentioned above indicate the important role of the electron-phonon coupling which modifies the transport properties of magnetite, and may initiate the structural transition from the cubic to the monoclinic phase. In the theory this coupling was introduced by Yamada who proposed that the mechanism behind the Verwey transition involves the condensation of charge order fluctuations coupled to a TA phonon mode with symmetry Yamada (1975). Indeed, studies based on DFT calculations demonstrated that phonons with , , and symmetries strongly couple to the electronic states and may induce the monoclinic deformation Piekarz et al. (2006, 2007); Hoesch et al. (2013). According to a detailed refinement, the low-temperature structure of magnetite can be described by a subset of phonon modes at the , , , and points of the Brillouin zone Blasco et al. (2011); Senn et al. (2013, 2015).
Experimentally, the phonon dispersion curves in magnetite were studied by inelastic neutron scattering (INS) Watanabe and Brockhouse (1962); Samuelsen and Steinsvoll (1974); Borroni et al. (2017a) and by inelastic x-ray scattering (IXS) Hoesch et al. (2013). The Fe-projected phonon density of states (DOS) was measured using nuclear inelastic scattering (NIS) Seto et al. (2003); Handke et al. (2005); Kołodziej et al. (2012) and detailed studies of the optical modes at the Brillouin zone center were performed by spontaneous Raman scattering and infrared reflectivity measurements Grimes (1972); Verble (1974); Degiorgi et al. (1987); Graves et al. (1988); Gasparov et al. (2000); Gupta et al. (2002); Yazdi et al. (2013); Kumar et al. (2014); Borroni et al. (2018, 2017b). The presence of phonon anharmonicity and strong electron-phonon coupling was also demonstrated by means of Raman measurements Kumar et al. (2014). Anomalies of the lattice vibrations that originate from strong coupling to electronic excitations and the spectroscopic signatures of diffusive modes in the electronic contribution to the Raman response function were observed Borroni et al. (2018). Ultrafast broadband optical spectroscopy revealed that impulsive photoexcitation of particle-hole pairs couples to the fluctuations of the ordering field and coherently generates phonon modes of the ordered phase above Borroni et al. (2017b). The existence of long-lived precursor fluctuations was further evidenced by recent INS studies Borroni et al. (2020).
Since the lattice dynamics is strongly coupled to the electronic system and the SRO in the high-temperature phase of magnetite, it is important to explore how the phonon spectrum changes at the stuctural phase transition and how well these changes can be described within the DFT framework. To this end, in this paper, we analyze the phonon spectra calculated for the cubic and the monoclinic structures. The results obtained for the monoclinic phase are in excellent agreement with the experimental data. In the cubic phase, the theoretical spectrum deviates substantially from the experimental one, which remains quite similar to the one in the broken symmetry phase, indicating significant influence of the SRO on the lattice dynamics.
The paper is organized as follows. In Sec. II, the details of the calculation method are presented. The computed phonon dispersions and phonon density of states are analyzed and compared with the experimental data in Secs. III and IV, respectively. In Sec. V, the influence of the CO order on the phonon modes and the mean square displacements in the monoclinic phase is studied. The discussion and summary of the results are included in Sec. VI.
II Calculation method
The electronic and crystal structures of magnetite were optimized within the DFT framework implemented in the vasp program Kresse and Furthmüller (1996, 1996). The calculations were performed using the projector augmented-wave method Blöchl (1994) and the generalized gradient approximation (GGA) Perdew et al. (2008). We ensured an experimentally observed ferrimagnetic order with the opposite orientation of magnetic moments within the FeA and FeB sublattices. Strong electronic interactions in the Fe() states were taken into account using the GGA+ method Liechtenstein et al. (1995) with the local Coulomb interaction parameter eV and Hund’s exchange eV.
The cubic structure was studied in the unit cell presented in Fig. 1(a) containing 56 atoms (4 primitive cells): 8 FeA, 16 FeB, and 32 O atoms. The optimized lattice parameter Å is slightly overestimated compared to the experimental value (8.39 Å). The crystal structure of the monoclinic phase was optimized within the unit cell containing 224 atoms [see Fig. 1(b)]. The calculated lattice parameters Å, Å, Å, and the monoclinic angle ° are in good agreement with the experimental data, and the obtained CO (trimeron) order agrees with the results presented in Refs. Senn et al. (2012a, b). Recently, we have used the same relaxed structure in the analysis of the soft charge (polaron) fluctuations of the trimeron order Baldini et al. (2020).
The phonon dispersion curves and phonon DOS were calculated by the direct method Parlinski et al. (1997) using the Phonon software Parlinski (2015). The Hellmann-Feynman forces were computed through the displacement of all nonequivalent atoms from their equilibrium positions and the force-constant matrix elements were determined. By diagonalizing the dynamical matrix, the phonon dispersions along the high-symmetry directions in the first Brillouin zone were obtained. In order to evaluate properly the longitudinal optical-transverse optical (LO-TO) splitting in the monoclinic (insulating) phase, the static dielectric tensor and Born effective charges were determined using density functional perturbation theory Gajdoš et al. (2006).
III Phonon spectra
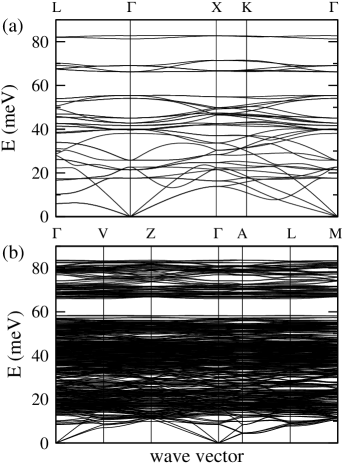
The phonon dispersion curves and phonon DOS obtained for the cubic and monoclinic phases are presented in Figs. 2 and 3. In the cubic structure, there are 42 phonon modes. All phonon energies are real (i.e., both phases are stable), although some modes show anomalous softening close to the point, along the -, and the - directions. These anomalous dispersions induce enhanced DOS and non-Debye behavior at the lowest energies (see Fig. 3(a)). As we discuss later, this effect is related to the instability of the cubic symmetry connected with short-range distortions observed by diffuse scattering at temperatures above .
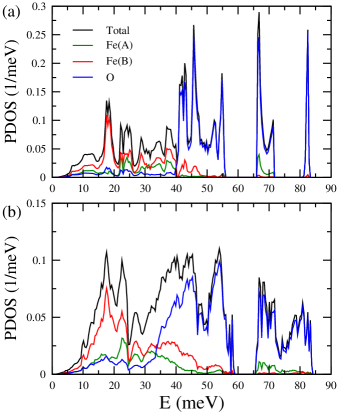
The low-energy range of the spectrum is dominated by vibrations of Fe atoms, with larger contribution of Fe atoms at the octahedral positions. The maximum of Fe DOS is found around 18 meV. The vibrations of FeA atoms dominate at higher energies for meV. Above 40 meV, mainly O atoms contribute to the phonon DOS, showing an energy cut-off at 84 meV. Two energy gaps exist between 55-66 meV and 72-81 meV, in the cubic phase. In the band located above 65 meV, there is a visible contribution from FeA atoms and a negligible contribution from FeB ones.
The primitive cell of the structure contains 112 atoms. Therefore, the number of phonon modes increases to 336. The partial DOS of Fe atoms is increased above 50 meV compared to the cubic phase and they contribute to the highest modes up to 80 meV. The lower gap is reduced to about 7 meV and the higher one is completely closed.
IV Comparison with experimental data
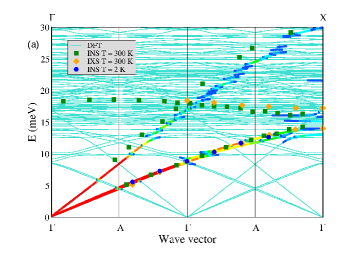
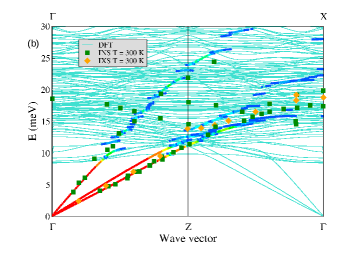
In Fig. 4, the phonon dispersions obtained for the structure are compared with the available experimental data. The dispersions measured above by INS Samuelsen and Steinsvoll (1974) and IXS Hoesch et al. (2013) are presented in the extended Brillouin zone of the monoclinic structure. The INS measurements at K, well below the Verwey transition, were performed along the - direction of the monoclinic Brillouin zone Borroni et al. (2017b). The dispersions are presented for the - [Fig. 4(a)] and - [Fig. 4(b)] directions, which correspond to the - [0,0,1] and -- [1,1,0] directions in the cubic symmetry, respectively. The lowest optical modes at the point around 8 meV result from the splitting and folding of the TA branch with symmetry in the cubic structure.
Additionally, in Fig. 4, we plot the formfactor, which describes the intensity (strength) of phonon modes
| (1) |
where is the polarization vector, is the phonon wave vector, denotes the phonon branch, and is the mass of atom . It can be observed that the phonon modes with the strongest intensity in the monoclinic structure correspond to the acoustic branches of the cubic structure.
A good agreement between the phonon energies measured below and above with the theoretical dispersions calculated for the low-temperature structure demonstrates that phonon energies in magnetite depend weakly on temperature. It also demonstrates that the SRO existing above preserves the local geometry of the structure. The lowest TA dispersion measured below shows slightly higher values than the corresponding branch in the cubic phase Borroni et al. (2017b). We remark that the phonon dispersions calculated for the cubic phase were compared with the experimental points measured above in the previous studies Piekarz et al. (2006, 2007); Hoesch et al. (2013).
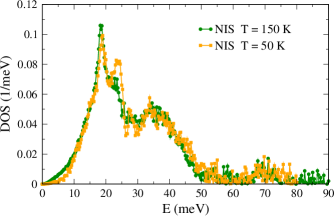
The influence of the phase transition on the partial Fe phonon DOS was studied by NIS measurements Handke et al. (2005); Kołodziej et al. (2012). The NIS spectra obtained at temperatures K and 150 K Kołodziej et al. (2012) are compared in Fig. 5. The main differences are observed at the lowest energies below 10 meV and around two peaks at 24 meV and 27 meV. The main peak at 18 meV is weakly affected by the transition and is only slightly shifted to higher energies below the Verwey transition. The increase of phonon DOS in the cubic phase below 10 meV is related to the quasielastic (diffuse) scattering observed at low energies above the Verwey transition. The stiffening of the monoclinic lattice is evidenced by the increase of the Lamb-Mössbauer factor below Handke et al. (2005) and is consistent with the INS measurements Borroni et al. (2017b). We calculated the first moment of the phonon DOS, which gives the average value of the phonon energy. We found that its value increases, when going from the cubic (42.09 meV) to the monoclinic (42.22 meV) phase. If we take only the contribution from the FeB atoms, this change is more pronounced (from 26.74 meV to 27.32 meV). As we discuss later, the peak at 24 meV is strongly influenced by the CO order in the structure and this effect may explain its modification by the Verwey transition.
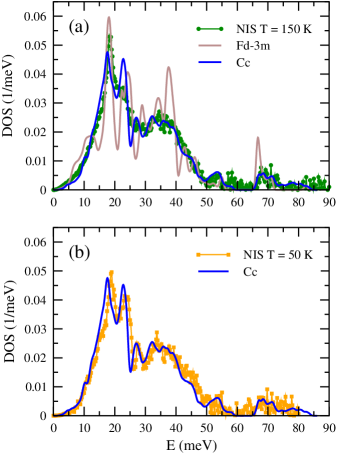
The Fe-projected phonon DOS calculated for the cubic and monoclinic symmetries is compared with the experimental data obtained above and below in Fig. 6. All theoretical spectra were broadened by a Gaussian with a width of 1 meV, which is a typical experimental resolution. In the phonon DOS calculated for the cubic structure, the main peaks coincide with the high intensity DOS measured by NIS. However, apart from the highest peak at 18 meV, all other spectral features are much broader than the theoretical peaks. In addition, one finds a broad peak centered at 12 meV not observed in the experimental spectrum. This additional enhancement of phonon DOS results from the anomalous dispersions found in the cubic phase (see Fig. 2).
The phonon DOS calculated for the monoclinic structure shows much better agreement with the experimental data, even for the spectrum obtained above . Apart from a small shift of the theoretical energies to lower energies, the positions and widths of all peaks are very well reproduced. The intensity of the lowest peak around 18 meV is slightly underestimated, while the higher peak around 24 meV is overestimated when compared to the experimental DOS. The position and intensity of the peak around 27 meV agree very well with the experiment.
We emphasize that the theory captures the essential features of the phonon DOS at higher energies which exhibits most of the features obtained by the NIS measurements. Such good agreement demonstrates that the electronic ground state and interatomic forces are very well described by the DFT calculations. It also shows that all atomic positions and their valence states are well defined in the low-temperature monoclinic phase unlike in the high-temperature phase, where the SRO, present in reality, is not modeled by theoretical calculations. We note that the phonon DOS calculated in the structure agrees much better with the high-temperature data than the computation in the cubic structure [see Fig. 6(a)]. This difference between the low-temperature and high-temperature structures highlights again the importance of short range correlations above .
V The impact of trimeron order on phonons
In the structure, there are 16 nonequivalent positions. Half of the FeB ions have a nominal valence state and half of them are . The CO ordering for each FeB-O plane (defined here by the fractional coordinate ) of the primitive cell is presented in Fig. 7. The main crystallographic directions and of the unit cell (see Fig. 1) are rotated by 45° with respect to the and axes defined by the main directions of the cubic phase (both presented at the bottom of the figure). In each plane, the FeB atoms form one-dimensional chains with the smallest nearest neighbor distances along the or direction. In the and planes, there are only Fe2+ ions with occupied and orbitals, alternating along the direction (, , , and sites). The or planes contain each two Fe2+ ions with () and or orbitals (), while only one Fe2+ ion with the orbital is located in the () and () planes.
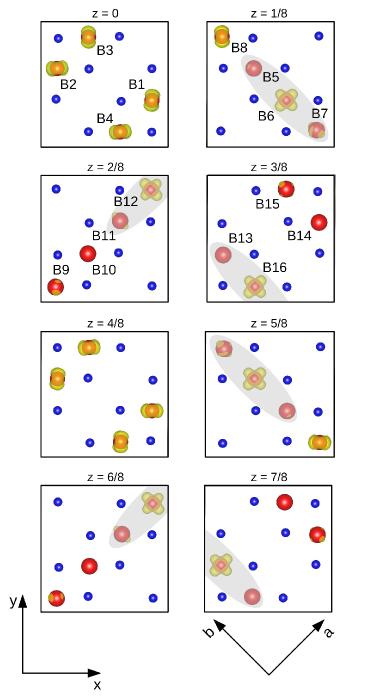
The Fe ions are the centers of trimerons, which are oriented according to the symmetries of the occupied orbitals. In Fig. 7, the trimerons with occupied orbitals and oriented along the or directions are depicted by the gray ovals. The other trimerons centered at the sites located in the planes with , , , and are aligned along the diagonal or direction (not shown in Fig. 7). The trimerons are not isolated objects; most of them are connected and have common Fe ions at their ends. In two cases, the end of one trimeron coincides with the center of the other one located in the or plane. A detailed analysis of the trimeron order is presented in Refs. Senn et al. (2012a, b).
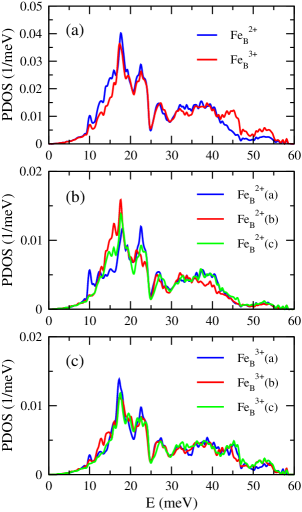
The CO distribution in the structure affects the interatomic forces and therefore also influences the phonon energies. This effect can be clearly observed in Fig. 8(a), where the phonon DOS is plotted for the Fe and Fe cations separately. The partial DOS of Fe ions show higher values at lower energies and the main peaks below 24 meV are larger than for the Fe ions. In contrast, at higher energies (above 40 meV), the phonon DOS is dominated by the Fe vibrations. It can be related to an enhanced Coulomb interaction between the Fe cations with the larger valence state and the oxygen anions.
The charge distribution in the orbitals of Fe ions at the sites is also highly anisotropic. If we consider two crystallographic directions and in the monoclinic structure, the differences result from the distribution of charges in the and planes, in which the chains of Fe ions are oriented along the direction, and the and planes containing two Fe2+ ions in the chains oriented along the direction. This anisotropy in charge ordering is related to slightly different values of the lattice parameters along the and directions. Therefore, we should also see a variation in the phonon spectra corresponding to these two perpendicular directions.
This expectation is confirmed by the data displayed in Fig. 8(b) and Fig. 8(c), where we present the phonon DOS of Fe and Fe vibrations, respectively, along three nonequivalent crystallographic directions of the unit cell. Indeed, for these three directions, the phonon DOS exhibits differences which are more significant for the Fe ions. It shows that the phonon anisotropy results mainly from the orbital ordering of the spin-down states at the Fe sites. The peak observed at 10 meV is mainly related to the vibrations along the axis. The phonon DOS above 10 meV and the highest peak around 18 meV show a the anisotropy with the largest contribution from the component. The peak around 24 meV exhibits even larger anisotropy and is dominated by the vibrations along the axis.
The influence of the CO anisotropy observed here may explain the significant differences between the NIS spectra measured in the cubic and monoclinic phases around 24 meV. One finds that this peak is strongly suppressed in the cubic structure, which can be related to the “melting” of the trimeron order. We expect that the average of the two directions ( and ) provides a good model of the dynamical structure factor in the cubic phase. However, this produces too much weight in the 24 meV peak. As less stable trimeron configurations are populated thermally, we expect some phonons to soften. This behavior may explain the transfer of spectral weight from the 24 meV peak to the 18 meV peak. Irrespective of this feature, we propose that the relative weight of these peaks can be used to measure the degree of SRO.
| site | Valence | |||
|---|---|---|---|---|
| 2+ | 0.002307 | 0.002595 | 0.002550 | |
| 2+ | 0.002323 | 0.002589 | 0.002677 | |
| 2+ | 0.002301 | 0.002674 | 0.002593 | |
| 2+ | 0.002266 | 0.002638 | 0.002607 | |
| 3+ | 0.002271 | 0.002588 | 0.002232 | |
| 2+ | 0.002257 | 0.002485 | 0.002308 | |
| 3+ | 0.002229 | 0.002710 | 0.002246 | |
| 2+ | 0.002272 | 0.002633 | 0.002289 | |
| 3+ | 0.002305 | 0.002309 | 0.002171 | |
| 3+ | 0.002231 | 0.002335 | 0.002216 | |
| 3+ | 0.002343 | 0.002284 | 0.002191 | |
| 2+ | 0.004078 | 0.002326 | 0.002340 | |
| 3+ | 0.002340 | 0.002256 | 0.002207 | |
| 3+ | 0.002298 | 0.002098 | 0.002149 | |
| 3+ | 0.002299 | 0.002333 | 0.002192 | |
| 2+ | 0.002293 | 0.002945 | 0.002227 |
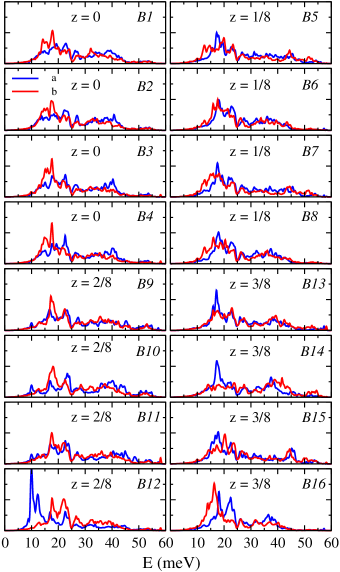
To better understand the origin of phonon anisotropy between the and directions, we analyze the phonon DOS along these two directions for each nonequivalent FeB ion. We choose 16 sites belonging to the four lowest planes with , 1/8, 2/8, and 3/8 (see Fig. 7) and present the corresponding phonon DOSs in Fig. 9. In the plane, there are four Fe ions showing similar DOS. There is a visible anisotropy with the larger contribution of vibrations along the direction at lower energies. This is caused by the larger Fe-Fe distances and smaller interatomic forces along the direction perpendicular to the -chains. In the plane, there is some difference between the ions with different valence, with slightly higher anisotropy found for the Fe3+ ions ( and ).
The largest differences are found in the two other planes, each containing only one Fe ion with an occupied orbital ( and ). The DOS at the site along the direction is strongly shifted to lower energies and exhibits a large peak at 10 meV. It shows the greatest shift to lower energies compared to the other FeB ions. Interestingly, these vibrations are along the -chains. Similarly, the phonon DOS projected onto the site shows a large anisotropy. Also in this case, the energies of vibrations along the -chains, which in the plane are parallel to the direction, are shifted to lower values with a maximum around 15 meV. These two peaks at 10 and 15 meV come only from two sites, and thus their contributions to the total DOS are not very strong. However, they are clearly visible as shoulders in the experimental and theoretical DOSs presented in Fig. 6.
The dynamical anisotropy was further investigated by calculating the mean square displacement (MSD) tensor. The diagonal elements of the MSD tensors of all inequivalent FeB atoms obtained for the monoclinic structure at K are presented in Tab. 1. The largest value of the MSD is found for the Fe atom, which shows the strongest vibrational anisotropy in the phonon DOS. The average displacement of this Fe atom along the direction exceeds 70% and is larger than along the direction. The second largest MSD is for the atom along the direction. These enhanced atomic displacements should couple strongly to charge fluctuations between FeB ions and participate in the polaronic soft modes recently observed in optical experiments Baldini et al. (2020).
VI Final discussion and summary
The results presented in the previous section demonstrate a significant impact of the charge-orbital order on lattice dynamics in the monoclinic phase of magnetite. A very good agreement between the calculated and measured phonon spectra indicates that the coupling between the charge-orbital distribution (trimerons) and phonons is well described in our calculations. Through a detailed analysis of the phonon DOS projected into all nonequivalent sites, we revealed that some trimerons modify strongly the vibrations of central Fe ions. This trimeron-phonon coupling is especially strong for the trimerons oriented along the main directions of the monoclinic structure inducing a large shift of phonon DOS to lower energies. Our results show for the first time that the charge-orbital ordering induce strong anisotropy of the lattice dynamics in the monoclinic phase of magnetite.
The obtained results can be compared with other studies which probe the local charge distribution on FeB ions. The NMR and Mössbauer measurements combined with DFT calculations revealed that all -sites can be divided into three groups with the ratio 8:5:3 Řezníček et al. (2015, 2017); Chlan et al. (2018); Kołodziej et al. (2020). The first group consists of 8 Fe3+ ions, the second group includes 5 Fe2+ ions in which electrons occupy the or orbitals, and the third group comprises 3 Fe2+ ions with occupied orbitals. The last group of Fe ions is characterized by lower effective magnetic fields and larger electric field gradients Řezníček et al. (2017). Interestingly, two -sites that show the strongest phonon anisotropy belong to this group of ions ( and sites, which correspond to and sites in Refs. Řezníček et al. (2015, 2017)). However, a phonon DOS projected into a single site depends not only on the local valence but also on the charge distribution in the neighborhood of a given atom. This explains the different phonon DOS of the site, which also belongs to the third group, when compared to the and sites.
The present studies demonstrate the influence of static charge-orbital order on phonons. We remark that recent optical conductivity and pump-probe experiments discovered soft electronic modes, which can be explained as the excitations of the trimeron order coupled to atomic vibrations Baldini et al. (2020). To model these modes, we considered the coherent tunneling of polarons, which corresponds to charge fluctuations between the and sites in the plane. Such tunneling induces effectively a shift of the trimeron along the direction. Similar movement is possible along the direction in the plane, where the charge localized at the site can tunnel to the or site. The present calculations show that the trimerons in these two planes couple strongly to the low-energy vibrations with the largest displacements, and therefore they should participate in the polaronic excitations discovered recently by terahertz spectroscopy Baldini et al. (2020). These excitations—which propagate along two perpendicular directions—should have different energies due to the anisotropy in lattice and electronic dynamics. This hypothesis can be confirmed in the future by means of polarization-resolved terahertz experiments on untwinned crystals.
We have shown that the existence of the short-range order above the Verwey transition, preserving the local geometry of the monoclinic structure, is well supported by various experiments Subías et al. (2005); Perversi et al. (2019). Since the nearest neighbor distances have a dominant impact on interatomic forces and phonon energies, the presence of the short-range order may explain small differences between the phonon spectra measured below and above . Moreover, the short-range order explains why the phonon DOS calculated for the structure agrees better with the high-temperature NIS data than the computation performed for the perfect cubic structure. Since the deviation from the ideal cubic geometry is observed up to the Curie temperature Perversi et al. (2019), the short-range order may determine the lattice dynamics and the thermodynamic properties of magnetite in a wide range of temperatures.
We suggest that the influence of the static charge-orbital order on phonons found in our studies could still be present above . However, dynamical effects become very important in the high-temperature phase. The existence of charge fluctuations coupled to phonons is the origin of strong neutron and x-ray diffuse scattering Fujii et al. (1975); Shapiro et al. (1976); Yamada et al. (1980); Siratori et al. (1998); Bosak et al. (2014) as well as the anharmonic effects revealed by the IXS studies Hoesch et al. (2013). In this case, both the static displacements from the high-symmetry cubic positions and charge fluctuations may contribute to anharmonic behavior above the Verwey transition.
In summary, we have investigated the lattice dynamical properties of magnetite by performing the DFT calculations for the cubic and monoclinic structures. The results obtained for the low-temperature monoclinic phase show a very good agreement with the experimental data, indicating that the electronic ground state and interatomic forces are well reproduced in the calculations. Most importantly, we have demonstrated that the trimeron order strongly influences the vibrational properties of Fe atoms and this we take as an evidence for strong trimeron-phonon coupling.
In particular, the trimerons with occupied orbitals induce a strong dynamical anisotropy between the main crystallographic directions in the monoclinic structure. This anisotropy is related to the enhanced atomic displacements, which may be closely related to the soft charge modes that were observed in the optical measurements Baldini et al. (2020). The phonon density of states calculated for the perfect cubic structure deviates from that of the NIS measurements, which can be explained by the existence of the short-range order in magnetite above the Verwey transition. The local lattice distortions, which modify the charge distribution, influence the interatomic forces and determine the phonon energies at higher temperatures.
Acknowledgements
This work was supported by the European Regional Development Fund in the IT4Innovations National Supercomputing center—Path to Exascale project, No. CZ.02.1.01/0.0/0.0/16013/0001791 within the Operational Programme Research, Development and Education, and Donau project No. 8X20050 by Ministry and Education of the Czech Republic. P.P. and A.M.O. kindly acknowledge the support by Narodowe Centrum Nauki (NCN, Poland), Projects No. 2017/25/B/ST3/02586 and No. 2016/23/B/ST3/00839. A. M. Oleś is grateful for the Alexander von Humboldt Foundation Fellowship (Humboldt-Forschungspreis). W.T. acknowledges support from the Polish National Agency for Academic Exchange under the “Polish Returns 2019” Program, Grant No. PPN/PPO/2019/1/00014/U/0001. Work at MIT was supported by the US Department of Energy, BES DMSE, Award number DE-FG02-08ER46521 and by the Gordon and Betty Moore Foundation’s EPiQS Initiative grant GBMF9459. E.B. and C.A.B. acknowledge additional support from the Swiss National Science Foundation under Fellowships P2ELP2-172290 and P400P2-183842 and the National Science Foundation Graduate Research Fellowship under Grant No. 1122374, respectively.
References
- Verwey (1939) E. J. W. Verwey, “Electronic conduction of magnetite (Fe3O4) and its transition point at low temperatures,” Nature 144, 327 (1939).
- Verwey and Haayman (1941) E. J. W. Verwey and P. W. Haayman, “Electronic conductivity and transition point of magnetite Fe3O4,” Physica 8, 979 – 987 (1941).
- Bragg (1915) W. H. Bragg, “The structure of magnetite and the spinels,” Nature 95, 561 (1915).
- Samuelsen et al. (1968) E. J. Samuelsen, E. J. Bleeker, L. Dobrzynski, and T. Riste, “Neutron Scattering from Magnetite below 119 K,” J. Appl. Phys. 39, 1114 (1968).
- Yamada et al. (1968) T. Yamada, K. Suzuki, and S. Chikazumi, “Electron microscopy of orthorhombic phase in magnetite,” Appl. Phys. Lett. 13, 172 (1968).
- Yoshida and Iida (1977) J. Yoshida and S. Iida, “X-ray diffraction study on the low temperature phase of magnetite,” J. Phys. Soc. Jap. 42, 230 (1977).
- Iizumi et al. (1982) M. Iizumi, T. F. Koetzle, G. Shirane, S. Chikazumi, M. Matsui, and S. Todo, “Structure of magnetite (Fe3O4) below the Verwey transition temperature,” Acta Crystallographica Section B 38, 2121 (1982).
- Wright et al. (2001) J. P. Wright, J. P. Attfield, and P. G. Radaelli, “Long range charge ordering in magnetite below the Verwey transition,” Phys. Rev. Lett. 87, 266401 (2001).
- Wright et al. (2002) J. P. Wright, J. P. Attfield, and P. G. Radaelli, “Charge ordered structure of magnetite Fe3O4 below the Verwey transition,” Phys. Rev. B 66, 214422 (2002).
- Senn et al. (2012a) M. S. Senn, J. P. Wright, and J. P. Attfield, “Charge order and three-site distortions in the Verwey structure of magnetite,” Nature 481, 173 (2012a).
- Huang et al. (2006) D. J. Huang, H.-J. Lin, J. Okamoto, K. S. Chao, H.-T. Jeng, G. Y. Guo, C.-H. Hsu, C.-M. Huang, D. C. Ling, W. B. Wu, C. S. Yang, and C. T. Chen, “Charge-orbital ordering and Verwey transition in magnetite measured by resonant soft x-ray scattering,” Phys. Rev. Lett. 96, 096401 (2006).
- Nazarenko et al. (2006) E. Nazarenko, J. E. Lorenzo, Y. Joly, J. L. Hodeau, D. Mannix, and C. Marin, “Resonant x-ray diffraction studies on the charge ordering in magnetite,” Phys. Rev. Lett. 97, 056403 (2006).
- Schlappa et al. (2008) J. Schlappa, C. Schüßler-Langeheine, C. F. Chang, H. Ott, A. Tanaka, Z. Hu, M. W. Haverkort, E. Schierle, E. Weschke, G. Kaindl, and L. H. Tjeng, “Direct observation of orbital ordering in magnetite,” Phys. Rev. Lett. 100, 026406 (2008).
- Joly et al. (2008) Y. Joly, J. E. Lorenzo, E. Nazarenko, J.-L. Hodeau, D. Mannix, and C. Marin, “Low-temperature structure of magnetite studied using resonant x-ray scattering,” Phys. Rev. B 78, 134110 (2008).
- Lorenzo et al. (2008) J. E. Lorenzo, C. Mazzoli, N. Jaouen, C. Detlefs, D. Mannix, S. Grenier, Y. Joly, and C. Marin, “Charge and orbital correlations at and above the Verwey phase transition in magnetite,” Phys. Rev. Lett. 101, 226401 (2008).
- Blasco et al. (2011) J. Blasco, J. García, and G. Subías, “Structural transformation in magnetite below the Verwey transition,” Phys. Rev. B 83, 104105 (2011).
- Tanaka et al. (2012) A. Tanaka, C. F. Chang, M. Buchholz, C. Trabant, E. Schierle, J. Schlappa, D. Schmitz, H. Ott, P. Metcalf, L. H. Tjeng, and C. Schüßler-Langeheine, “Symmetry of orbital order in Fe3O4 studied by Fe resonant x-ray diffraction,” Phys. Rev. Lett. 108, 227203 (2012).
- Řezníček et al. (2015) R. Řezníček, V. Chlan, H. Štěpánková, and P. Novák, “Hyperfine field and electronic structure of magnetite below the Verwey transition,” Phys. Rev. B 91, 125134 (2015).
- Řezníček et al. (2017) R. Řezníček, V. Chlan, H. Štěpánková, P. Novák, J. Żukrowski, A. Kozłowski, Z. Kakol, Z. Tarnawski, and J. M. Honig, “Understanding the Mössbauer spectrum of magnetite below the Verwey transition: Ab initio calculations, simulation, and experiment,” Phys. Rev. B 96, 195124 (2017).
- Leonov et al. (2004) I. Leonov, A. N. Yaresko, V. N. Antonov, M. A. Korotin, and V. I. Anisimov, “Charge and orbital order in Fe3O4,” Phys. Rev. Lett. 93, 146404 (2004).
- Jeng et al. (2004) H.-T. Jeng, G. Y. Guo, and D. J. Huang, “Charge-orbital ordering and Verwey transition in magnetite,” Phys. Rev. Lett. 93, 156403 (2004).
- Jeng et al. (2006) H.-T. Jeng, G. Y. Guo, and D. J. Huang, “Charge-orbital ordering in low-temperature structures of magnetite: GGA+ investigations,” Phys. Rev. B 74, 195115 (2006).
- Piekarz et al. (2006) P. Piekarz, K. Parlinski, and A. M. Oleś, “Mechanism of the Verwey transition in magnetite,” Phys. Rev. Lett. 97, 156402 (2006).
- Piekarz et al. (2007) P. Piekarz, K. Parlinski, and A. M. Oleś, “Origin of the Verwey transition in magnetite: Group theory, electronic structure, and lattice dynamics study,” Phys. Rev. B 76, 165124 (2007).
- Pinto and Elliott (2006) H. P. Pinto and S. D. Elliott, “Mechanism of the Verwey transition in magnetite: Jahn-Teller distortion and charge ordering patterns,” J. Phys.: Condens. Matter 18, 10427 (2006).
- Yamauchi et al. (2009) K. Yamauchi, T. Fukushima, and S. Picozzi, “Ferroelectricity in multiferroic magnetite Fe3O4 driven by noncentrosymmetric Fe2+/Fe3+ charge-ordering: First-principles study,” Phys. Rev. B 79, 212404 (2009).
- Senn et al. (2012b) M. S. Senn, I. Loa, J. P. Wright, and J. P. Attfield, “Electronic orders in the Verwey structure of magnetite,” Phys. Rev. B 85, 125119 (2012b).
- Note (1) The Fe2+ denotes Fe ions with slightly smaller valency and larger occupancy of the minority-spin orbitals as compared with a Fe3+ ion.
- Baldini et al. (2020) E. Baldini, C. A. Belvin, M. Rodriguez-Vega, I. O. Ozel, D. Legut, A. Kozlowski, A. M. Oleś, K. Parlinski, P. Piekarz, J. Lorenzana, G. A. Fiete, and N. Gedik, “Discovery of the soft electronic modes of the trimeron order in magnetite,” Nature Physics 16, 541 (2020).
- Walz (2002) F. Walz, “The Verwey transition—a topical review,” J. Phys.: Condens. Matter 14, R285 – R340 (2002).
- Moran and Lüthi (1969) T. J. Moran and B. Lüthi, “Elastic and Magnetoelastic Effects in Magnetite,” Phys. Rev. 187, 710 (1969).
- Schwenk et al. (2000) H. Schwenk, S. Bareiter, C. Hinkel, B. Lüthi, Z. Kakol, A. Kozlowski, and J.M. Honig, “Charge ordering and elastic constants in Fe3-xZnxO4,” Eur. Phys. J. B 13, 491 (2000).
- Chiba et al. (1975) K. Chiba, K. Suzuki, and S. Chikazumi, “Diffuse electron scattering from magnetite above the Verwey transition temperature,” J. Phys. Soc. Jap. 39, 839 (1975).
- Fujii et al. (1975) Y. Fujii, G. Shirane, and Y. Yamada, “Study of the 123-K phase transition of magnetite by critical neutron scattering,” Phys. Rev. B 11, 2036–2041 (1975).
- Shapiro et al. (1976) S. M. Shapiro, M. Iizumi, and G. Shirane, “Neutron scattering study of the diffuse critical scattering associated with the Verwey transition in magnetite (Fe3O4),” Phys. Rev. B 14, 200 (1976).
- Yamada et al. (1980) Y. Yamada, N. Wakabayashi, and R. M. Nicklow, “Neutron diffuse scattering in magnetite due to molecular polarons,” Phys. Rev. B 21, 4642 (1980).
- Siratori et al. (1998) K. Siratori, Y. Ishii, Y. Morii, S. Funahashi, S. Todo, and A. Yanase, “Neutron diffuse scattering study of the high temperature phase of Fe3O4 - i, determination of atomic displacements at the x point in the Brillouin zone,” J. Phys. Soc. Jap. 67, 2818 (1998).
- Bosak et al. (2014) A. Bosak, D. Chernyshov, M. Hoesch, P. Piekarz, M. Le Tacon, M. Krisch, A. Kozłowski, A. M. Oleś, and K. Parlinski, “Short-range correlations in magnetite above the Verwey temperature,” Phys. Rev. X 4, 011040 (2014).
- Hoesch et al. (2013) M. Hoesch, P. Piekarz, A. Bosak, M. Le Tacon, M. Krisch, A. Kozłowski, A. M. Oleś, and K. Parlinski, “Anharmonicity due to electron-phonon coupling in magnetite,” Phys. Rev. Lett. 110, 207204 (2013).
- Subías et al. (2005) G. Subías, J. García, and J. Blasco, “EXAFS spectroscopic analysis of the Verwey transition in Fe3O4.” Phys. Rev. B 71, 155103 (2005).
- Perversi et al. (2019) G. Perversi, E. Pachoud, J. Cumby, J. M. Hudspeth, J. P. Wright, S. A. J. Kimber, and J. Paul Attfield, “Co-emergence of magnetic order and structural fluctuations in magnetite,” Nature Communications 10, 2857 (2019).
- Anderson (1956) P. W. Anderson, “Ordering and antiferromagnetism in ferrites,” Phys. Rev. 102, 1008 (1956).
- Ihle and Lorenz (1986) D. Ihle and B. Lorenz, “Small-polaron conduction and short-range order in Fe3O4,” J. Phys. C: Solid State Physics 19, 5239 (1986).
- Boekema et al. (1986) C. Boekema, R. L. Lichti, K. C. B. Chan, V. A. M. Brabers, A. B. Denison, D. W. Cooke, R. H. Heffner, R. L. Hutson, and M. E. Schillaci, “Experimental evidence for a Mott-Wigner glass phase of magnetite above the Verwey temperature,” Phys. Rev. B 33, 210 (1986).
- Park et al. (1998) S. K. Park, T. Ishikawa, and Y. Tokura, “Charge-gap formation upon the Verwey transition in Fe3O4,” Phys. Rev. B 58, 3717 (1998).
- Schrupp et al. (2005) D. Schrupp, M. Sing, M. Tsunekawa, H. Fujiwara, S. Kasai, A. Sekiyama, S. Suga, T. Muro, V. A. M. Brabers, and R. Claessen, “High-energy photoemission on Fe3O4: Small polaron physics and the Verwey transition,” Europhys. Lett. 70, 789 (2005).
- Caicedo et al. (2014) J. M. Caicedo, J. Fontcuberta, and G. Herranz, “Magnetopolaron-induced optical response in transition metal oxides,” Phys. Rev. B 89, 045121 (2014).
- Huang et al. (2017) H. Y. Huang, Z. Y. Chen, R.-P. Wang, F. M. F. de Groot, W. B. Wu, J. Okamoto, A. Chainani, A. Singh, Z.-Y. Li, J.-S. Zhou, H.-T. Jeng, G. Y. Guo, Je-Geun Park, L. H. Tjeng, C. T. Chen, and D. J. Huang, “Jahn-Teller distortion driven magnetic polarons in magnetite,” Nature Communications 8, 15929 (2017).
- Yamada (1975) Y. Yamada, “Charge ordering and lattice instability in magnetite,” AIP Conf. Proc. 24, 79–85 (1975).
- Senn et al. (2013) M. S. Senn, J. P. Wright, and J. P. Attfield, “The Verwey phase of magnetite—a long-running mystery in magnetism,” J. Korean Phys. Soc. 62, 1372 (2013).
- Senn et al. (2015) M. S. Senn, J. P. Wright, J. Cumby, and J. P. Attfield, “Charge localization in the Verwey structure of magnetite,” Phys. Rev. B 92, 024104 (2015).
- Watanabe and Brockhouse (1962) H. Watanabe and B.N. Brockhouse, “Observation of optical and acoustical magnons in magnetite,” Physics Letters 1, 189 (1962).
- Samuelsen and Steinsvoll (1974) E. J. Samuelsen and O. Steinsvoll, “Low-Energy Phonons in Magnetite,” physica status solidi (b) 61, 615 (1974).
- Borroni et al. (2017a) S. Borroni, G. S. Tucker, F. Pennacchio, J. Rajeswari, U. Stuhr, A. Pisoni, J. Lorenzana, H. M. Rønnow, and F. Carbone, “Mapping the lattice dynamical anomaly of the order parameters across the Verwey transition in magnetite,” New J. Phys. 19, 103013 (2017a).
- Seto et al. (2003) M. Seto, S. Kitao, Y. Kobayashi, R. Haruki, Y. Yoda, T. Mitsui, and T. Ishikawa, “Site-specific phonon density of states discerned using electronic states,” Phys. Rev. Lett. 91, 185505 (2003).
- Handke et al. (2005) B. Handke, A. Kozłowski, K. Parlinski, J. Przewoznik, T. Ślezak, A. I. Chumakov, L. Niesen, Z. Kakol, and J. Korecki, “Experimental and theoretical studies of vibrational density of states in single-crystalline thin films,” Phys. Rev. B 71, 144301 (2005).
- Kołodziej et al. (2012) T. Kołodziej, A. Kozłowski, P. Piekarz, W. Tabiś, Z. Kakol, M. Zajac, Z. Tarnawski, J. M. Honig, A. M. Oleś, and K. Parlinski, “Nuclear inelastic scattering studies of lattice dynamics in magnetite with a first- and second-order Verwey transition,” Phys. Rev. B 85, 104301 (2012).
- Grimes (1972) N. W. Grimes, “Off-centre ions in compounds with spinel structure,” Phil. Mag.: J. Theor. Exp. Appl. Phys. 26, 1217 (1972).
- Verble (1974) J. L. Verble, “Temperature-dependent light-scattering studies of the Verwey transition and electronic disorder in magnetite,” Phys. Rev. B 9, 5236 (1974).
- Degiorgi et al. (1987) L. Degiorgi, I. Blatter-Mörke, and P. Wachter, “Magnetite: Phonon modes and the Verwey transition,” Phys. Rev. B 35, 5421 (1987).
- Graves et al. (1988) P. R. Graves, C. Johnston, and J. J. Campaniello, “Raman scattering in spinel structure ferrites,” Materials Research Bulletin 23, 1651 (1988).
- Gasparov et al. (2000) L. V. Gasparov, D. B. Tanner, D. B. Romero, H. Berger, G. Margaritondo, and L. Forró, “Infrared and Raman studies of the Verwey transition in magnetite,” Phys. Rev. B 62, 7939 (2000).
- Gupta et al. (2002) R. Gupta, A. K. Sood, P. Metcalf, and J. M. Honig, “Raman study of stoichiometric and Zn-doped Fe3O4,” Phys. Rev. B 65, 104430 (2002).
- Yazdi et al. (2013) M. B. Yazdi, K.-Y. Choi, D. Wulferding, P. Lemmens, and L. Alff, “Raman study of the Verwey transition in magnetite thin films,” New J. Phys. 15, 103032 (2013).
- Kumar et al. (2014) A. Kumar, S. Chaudhary, D. K. Pandya, and S. K. Sharma, “Evidence of electron-phonon and spin-phonon couplings at the Verwey transition in Fe3O4,” Phys. Rev. B 90, 024302 (2014).
- Borroni et al. (2018) S. Borroni, J. Teyssier, P. Piekarz, A. B. Kuzmenko, A. M. Oleś, J. Lorenzana, and F. Carbone, “Light scattering from the critical modes of the Verwey transition in magnetite,” Phys. Rev. B 98, 184301 (2018).
- Borroni et al. (2017b) S. Borroni, E. Baldini, V. M. Katukuri, A. Mann, K. Parlinski, D. Legut, C. Arrell, F. van Mourik, J. Teyssier, A. Kozlowski, P. Piekarz, O. V. Yazyev, A. M. Oleś, J. Lorenzana, and F. Carbone, “Coherent generation of symmetry-forbidden phonons by light-induced electron-phonon interactions in magnetite,” Phys. Rev. B 96, 104308 (2017b).
- Borroni et al. (2020) S. Borroni, G. S. Tucker, U. Stuhr, J. Lorenzana, H. M. Rønnow, and F. Carbone, “Energy domain versus time domain precursor fluctuations above the Verwey transition in magnetite,” Phys. Rev. B 101, 054303 (2020).
- Kresse and Furthmüller (1996) G. Kresse and J. Furthmüller, “Efficient iterative schemes for ab initio total-energy calculations using a plane-wave basis set,” Phys. Rev. B 54, 11169 (1996).
- Kresse and Furthmüller (1996) G. Kresse and J. Furthmüller, Comput. Mater. Sci. 6, 15 (1996).
- Blöchl (1994) P. E. Blöchl, “Projector augmented-wave method,” Phys. Rev. B 50, 17953 (1994).
- Perdew et al. (2008) J. P. Perdew, A. Ruzsinszky, G. I. Csonka, O. A. Vydrov, G. E. Scuseria, L. A. Constantin, X. Zhou, and K. Burke, “Restoring the density-gradient expansion for exchange in solids and surfaces,” Phys. Rev. Lett. 100, 136406 (2008).
- Liechtenstein et al. (1995) A. I. Liechtenstein, V. I. Anisimov, and J. Zaanen, “Density-functional theory and strong interactions: Orbital ordering in Mott-Hubbard insulators,” Phys. Rev. B 52, R5467 (1995).
- Parlinski et al. (1997) K. Parlinski, Z. Q. Li, and Y. Kawazoe, “First-principles determination of the soft mode in cubic ZrO2,” Phys. Rev. Lett. 78, 4063 (1997).
- Parlinski (2015) K. Parlinski, Software Phonon ver. 6.15, Cracow, Poland (2015).
- Gajdoš et al. (2006) M. Gajdoš, K. Hummer, G. Kresse, J. Furthmüller, and F. Bechstedt, “Linear optical properties in the projector-augmented wave methodology,” Phys. Rev. B 73, 045112 (2006).
- Chlan et al. (2018) V. Chlan, J. Żukrowski, A. Bosak, Z. Kakol, A. Kozłowski, Z. Tarnawski, R. Řezníček, H. Štěpánková, P. Novák, I. Biało, and J. M. Honig, “Effect of low zn doping on the verwey transition in magnetite single crystals: Mössbauer spectroscopy and x-ray diffraction,” Phys. Rev. B 98, 125138 (2018).
- Kołodziej et al. (2020) T. Kołodziej, I. Biało, W. Tabiś, M. Zubko, J. Żukrowski, K. Łatka, J. E. Lorenzo, C. Mazzoli, Z. Kakol, A. Kozłowski, Z. Tarnawski, E. Wilke, P. Babik, V. Chlan, R. Řezníček, H. Štěpánková, P. Novák, Y. Joly, J. Niewolski, and J. M. Honig, “Magnetic field induced structural changes in magnetite observed by resonant x-ray diffraction and mössbauer spectroscopy,” Phys. Rev. B 102, 075126 (2020).