Electronic, vibrational, and electron-phonon coupling properties in SnSe2 and SnS2 under pressure
Abstract
The tin-selenide and tin-sulfide classes of materials undergo multiple structural transitions under high pressure leading to periodic lattice distortions, superconductivity, and topologically non-trivial phases, yet a number of controversies exist regarding the structural transformations in these systems. We perform first-principles calculations within the framework of density functional theory and a careful comparison of our results with available experiments on SnSe2 reveals that the apparent contradictions among high-pressure results can be attributed to differences in experimental conditions. We further demonstrate that under hydrostatic pressure a superstructure can be stabilized above 20 GPa in SnS2 via a periodic lattice distortion as found recently in the case of SnSe2, and that this pressure-induced phase transition is due to the combined effect of Fermi surface nesting and electron-phonon coupling at a momentum wave vector = . In addition, we investigate the contribution of nonadiabatic corrections on the calculated phonon frequencies, and show that the quantitative agreement between theory and experiment for the high-energy phonon mode is improved when these effects are taken into account. Finally, we examine the nature of the superconducting state recently observed in SnSe2 under nonhydrostatic pressure and predict the emergence of superconductivity with a comparable critical temperature in SnS2 under similar experimental conditions. Interestingly, in the periodic lattice distorted phases, the critical temperature is found to be reduced by an order of magnitude due to the restructuring of the Fermi surface.
I Introduction
Tin-based binary compounds, SnxSey and SnxSy, have emerged as promising candidates for electronic, optoelectronic, photovoltaic, and thermoelectric applications Ke2013 ; Vidal2012 ; Sinsermsuksakul2014 ; Zhao2014 ; Ding2015 ; Yu2016 ; Zhao2016 ; Dewandre2016 as well as platforms for exploring exotic states of matter Chen2017 ; Yu2017 ; Marini2019 ; Zhou2020 ; Wu2019 . Similar to other layered metal chalcogenide materials Qi2016 ; Pan2015 ; Leroux2015 ; Sipos2008 ; Paudyal2020 ; Ying2018 ; Calandra2011 ; Ali2014 , it has been found that under increased pressure and/or temperature these compounds undergo substantial changes in their structural and electronic properties, special interest being paid to those materials that can host charge density wave (CDW), superconducting, or topologically non-trivial phases Chen2017 ; Yu2017 ; Marini2019 ; Zhou2020 ; Wu2019 ; Nguyen-Cong2018 ; Gonzalez2018 ; Timofeev1997 ; Neto2001 ; Kang2015 ; Valla2004 ; Zhou2018 ; Ying2018 .
In the dichalcogenide systems, pressure-induced structural phase transitions have been reported for both SnSe2 and SnS2. For example, two theoretical studies have predicted that SnSe2 becomes thermodynamically unstable above 18-20 GPa and then decomposes into Sn3Se4 (space group ) and Se Yu2017 ; Nguyen-Cong2018 . A similar decomposition has been theoretically shown to take place in the sister compound SnS2, which remains thermodynamically stable up to approximately 28 GPa Gonzalez2018 . We would like to note in passing that both 3:4 compounds have been recently predicted to be superconducting with values of 3.3-4.7 K at 10 GPa Yu2017 ; Marini2019 , and 21.9 K at 30 GPa Gonzalez2018 , respectively. Although the formation of Sn3Se4 and Sn3S4 has been reported in experiments Yu2017 ; Albers1961 , the presence of a superconducting state in these materials still awaits experimental confirmation.
While SnSe2 is no longer on the convex hull tie-line at higher pressures and also becomes dynamically unstable, we have shown in a previous study Ying2018 that it can be stabilized in a supercell through a periodic lattice distortion (PLD) and that it can, in fact, be realized in experiments. In particular, under applying pressure, SnSe2 becomes metallic in the 8-13 GPa range, with a typical metallic behavior above 17 GPa, and transitions to the PLD phase at around 17 GPa. The agreement between theory and experiment was very good, and the experimentally observed phase transition has been successfully ascribed to a combined effect of electron-phonon (e-ph) coupling and Fermi surface (FS) nesting. This is in contrast to transitional metal dichalcogenides (TMDs), where FS nesting is found to only play a minor role in creating the CDW instability Calandra2011 ; Heil2017 ; Johannes2008 ; Calandra2009 ; Weber2011 . Interestingly, in another recent high-pressure experimental study Zhou2018 , neither the proposed theoretical decomposition Yu2017 ; Nguyen-Cong2018 nor the transformation to the PLD phase Ying2018 were detected up to 46 GPa. Instead, electrical resistance measurements in compressed SnSe2 showed an insulator-to-metallic transition above 15.2 GPa and the appearance of a superconducting state around 18.6 GPa.
In the present study, we first address the apparent contradiction among high-pressure experimental results in SnSe2 above 20 GPa. Next, we explore whether a superstructure can also be stabilized in SnS2 via a PLD by providing a detailed comparison of the electronic, vibrational, and e-ph properties of the two compounds. We expand on our previous work Ying2018 to improve the quantitative agreement between theory and experiment with respect to the pressure dependence of the phonon mode. In particular, we investigate the effect of LO-TO splitting and nonadiabatic corrections on the calculated phonon frequencies. Finally, we investigate the origin of the superconducting state recently observed in SnSe2 under nonhydrostatic pressure, and shed light on the superconducting properties of SnS2 and the PLD phases of the two systems at higher pressures.
II Methods
First-principles calculations were performed within the density functional theory (DFT) using the Quantum Espresso (QE) QE code. We employed optimized norm-conserving Vanderbilt (ONCV) pseudopotentials Hamann2013 with the Perdew-Burke-Ernzerhof (PBE) exchange-correlation functional in the generalized gradient approximation PBE , where the Sn , Se , and S orbitals were included as valence electrons. To properly treat the long-range dispersive interactions, we used the non-local van der Waals (vdW) density functional optB86b-vdW optB86b ; vdW . A plane wave kinetic-energy cutoff value of 60 Ry, a Marzari-Vanderbilt cold smearing Marzari1999 value of 0.01 Ry, and a -centered Monkhorst-Pack Monkhorst1976 k-mesh for the three-atom unit cell and k-mesh for the nine-atom supercell were used for the Brillouin-zone (BZ) integration. The atomic positions and lattice parameters were optimized until the self-consistent energy was converged within eV and the maximum Hellmann-Feynman force on each atom was less than 0.005 eV/Å. The dynamical matrices and the linear variation of the self-consistent potential were calculated within density-functional perturbation theory (DFPT) Baroni2001 on the irreducible set of a regular q-mesh for the three-atom unit cell and q-mesh for the nine-atom supercell.
The EPW code Giustino2007 ; EPW was used to compute e-ph interactions and related properties. The electronic wavefunctions required for the Wannier-Fourier interpolation WANN1 ; WANN2 were calculated on a uniform -centered k-grid for the three-atom unit cell. Ten maximally localized Wannier functions (one and three orbitals for each Sn atom and three orbitals for each chalcogen atom) were used to describe the electronic structure near the Fermi level (). A uniform k-mesh was used to evaluate the adiabatic phonon self-energy and static bare susceptibility, while 2 million random k points were used to estimate the phonon spectral function in the nonadiabatic regime. Both sets of calculations were performed along a high-symmetry path in q-space with smearings of 25 meV (electrons) and 0.05 meV (phonons). Uniform k-point and q-point grids were used for the superconductivity calculations in the three-atom unit cell (the in-plane meshes were reduced by a factor of three in the nine-atom supercell). The Matsubara frequency cutoff was set to 0.4 eV and the Dirac deltas were replaced by Lorentzians of width 25 meV (electrons) and 0.1 meV (phonons) when solving the isotropic Migdal-Eliashberg equations.
III Results
III.1 Crystal structure evolution under pressure
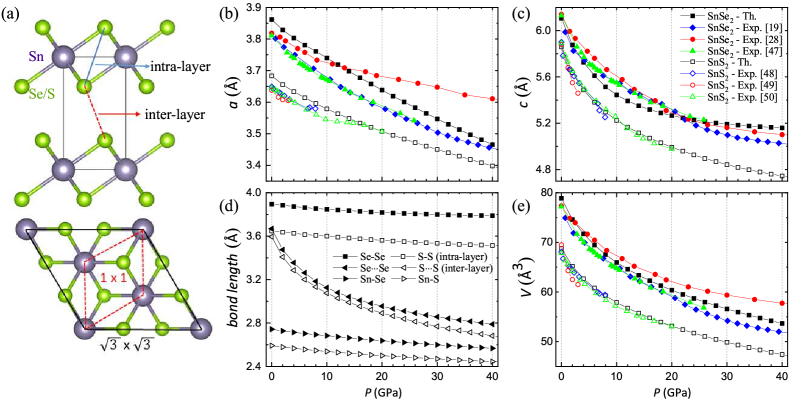
At ambient conditions, bulk SnSe2 and SnS2 crystallize in the hexagonal, close-packed CdI2-type structure with space group (No. 164) Huang2014 ; Ying2018 . The unit cell contains three atoms, where every Sn atom occupies the center of an octahedron formed by six chalcogen atoms (Se or S) [see Fig. 1(a)]. We refer to this high-symmetry structure as the 1 phase. Fig. 1(b)-(e) presents the optimized structural parameters as a function of pressure, together with available experimental data for comparison Zhou2018 ; Ying2018 ; Borges2018 ; Knorr2001 ; Hazen1978 ; Filso2016 .
As pointed out in previous studies Hazen1978 ; Knorr2001 ; Filso2016 , the contraction of the unit cell under compression is highly anisotropic. According to our theoretical results for hydrostatic pressure, the lattice parameter along the axis decreases almost linearly with increasing pressure, while that along the axis shrinks quickly before beginning a slower descent. This anisotropic compression can be related to the rapid decrease in the inter-layer SeSe/SS distance (i.e., the distance between the chalcogen atoms in adjacent layers) versus the intra-layer Se-Se/S-S and Sn-Se/Sn-S distances due to the weaker vdW inter-layer interaction relative to the stronger covalent intra-layer bonding.
Up to 10 GPa, there are no appreciable differences seen in the compressibility rates in the two systems. For instance, the lengths of the and axes at 10 GPa are reduced by about 3% and 11% with respect to their zero-pressure values in both cases. As the pressure increases, the compressibility rate along the axis becomes slightly smaller in SnS2 than in SnSe2, following the expected trend that a more covalent intra-layer bond is less compressible Borges2018 [see Supplemental Fig. S1 SM ]. The compressibility rate along the axis, on the other hand, displays the opposite behavior. This can be empirically understood from the relatively more localized nature of the orbitals of S-2 compared to the orbitals of Se-2, which gives rise to a weaker interaction across the vdW gap in SnS2 and thus increased compressibility.
The present theoretical results for the pressure dependence of the cell parameters are in very good agreement with all experimental data in the low pressure region between 0 and 10 GPa [see Fig. 1]. Beyond this point, the pressure transmitting medium used in various experiments can cause considerable differences between the compressed lattice parameters. The largest deviation is observed for the compression of the axis in SnSe2 beyond 10 GPa in Ref. [Zhou2018, ] and is attributed to nonhydrostatic pressure conditions in the experimental setup. A similar, but smaller effect, was also found in SnS2 Knorr2001 ; Filso2016 .
We next discuss the thermodynamic and dynamic stability of SnSe2 and SnS2 under compression. With respect to the full phase diagram, our calculations agree well with the findings reported in literature, namely that SnSe2 and SnS2 lie above the convex hull tie-line for pressures above approximately 20 and 40 GPa, respectively [see Supplemental Fig. S2 SM ]. The occurrence of a lattice instability is established by calculating the full phonon dispersion relations in the harmonic approximation in the three-atom 1 unit cell. As shown in Supplemental Fig. S3 SM , the lowest-energy vibrational mode has an imaginary frequency at the point of the BZ at 20 GPa, indicating that the two systems have become dynamically unstable. Based on the above results, it would be expected that the systems will either decompose into more stable products or undergo a crystal transformation into a nearby minima in the configuration space by following the eigenvector of a soft phonon mode.
The successful synthesis of Sn3Se4 in laser-heated diamond anvil cells Yu2017 points towards the first scenario, but no traces of the Sn3Se4 phase were detected in the high-pressure synchrotron x-ray diffraction (XRD) patterns measured at room temperature in two other recent studies Ying2018 ; Zhou2018 . This implies that a relatively large activation barrier needs to be overcome for the system to decompose, requiring not only high pressures but also high temperatures.
Evidence for the second scenario has also been provided in our combined experimental and theoretical work on SnSe2 Ying2018 . Namely, the formation of a superlattice has been revealed through the sudden appearance of several reflections at in XRD patterns and of two new peaks in the Raman spectra above 17 GPa. In addition, it has been shown that energetically more stable structures with lower symmetry can be constructed as detailed below. Here we will refer to the derivatives of the undistorted 1 structure created via a PLD as 2. The fact that SnSe2 has not been synthesized in the 2 structure in the study by Zhou et al. Zhou2018 suggests that the formation of this metastable phase is strongly dependent on the experimental conditions. While the NaCl powder used in our high-pressure XRD experiments ensured a quasi-hydrostatic pressure environment below 40 GPa Ying2018 , the silicone oil used as a pressure transmitting medium by Zhou et al. produced nonhydrostatic pressures above 13.2 GPa Zhou2018 . A similar situation has been observed for TMDs, where different pressure conditions give rise to variations in the structural and electronic properties. Yang2019 ; Duwal2016 . For instance, in the case of WS2, the transition from the 2 to 2 phase occurred under nonhydrostatic, but not under hydrostatic pressure Duwal2016 .
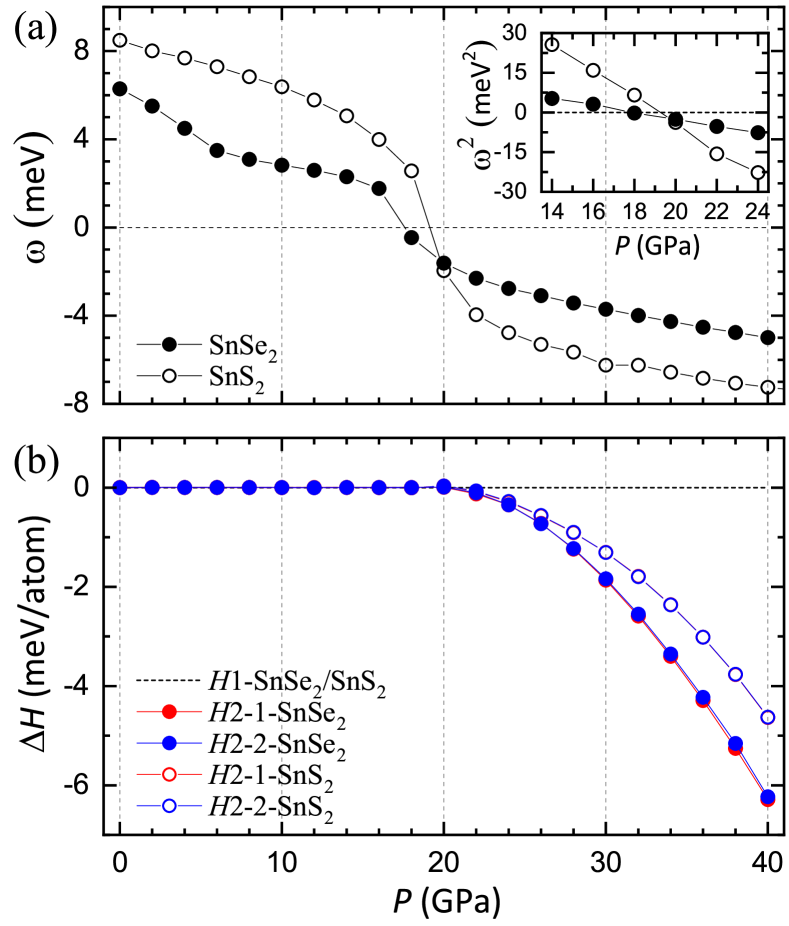
We now focus our attention on understanding whether a superstructure can also be stabilized in SnS2 via a PLD. Since the point of the unit cell folds onto the point in the supercell, dynamical stability calculations can be performed by determining the phonon frequencies at the point of the nine-atom 1 structure. As pressure is increased, the two nearly degenerate lowest-energy phonon modes with and symmetry soften and become imaginary as shown in Fig. 2(a). The linear evolution of with pressure [Fig. 2(a) inset] is a characteristic feature of a soft-mode phase transition Fujimoto2005 ; Kolmogorov2012 , enabling us to estimate the critical transition pressure when goes to zero. In this case, we obtain 18 GPa for SnSe2 and 19 GPa for SnS2, respectively.
To construct the energetically preferred structural derivatives of the original 1 phase, we follow the same strategy employed in our previous work on SnSe2 Ying2018 . We displace the atomic coordinates according to the eigenvectors of (2-1 phase) and (2-2 phase) modes as well as a linear combination of the two eigenvectors (2-3 phase) to better explore the adiabatic potential energy surface. As for SnSe2, the resulting distorted structures for the supercell are fully relaxed and found to converge to three distinct configurations based on the structure analysis performed with the MAISE package Hajinazar2020 . The lattice parameters, space groups, and Wyckoff positions of 2 structures at 30 GPa are given in Table. S1 and the crystal structures are shown in Fig. S4 SM . Since 2-3 is an intermediate phase along the pathway that transforms 2-1 into 2-2, we will only concentrate on the 2-1 and 2-2 structures in our further discussion.
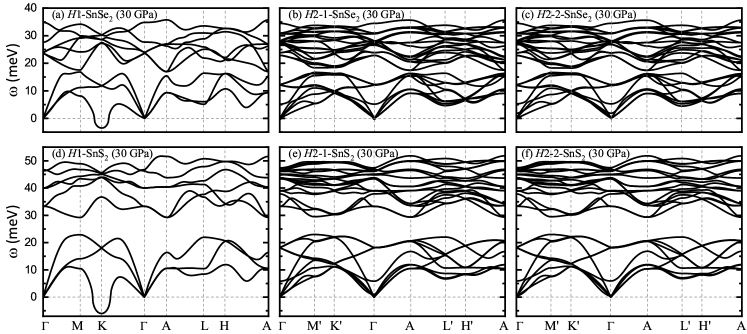
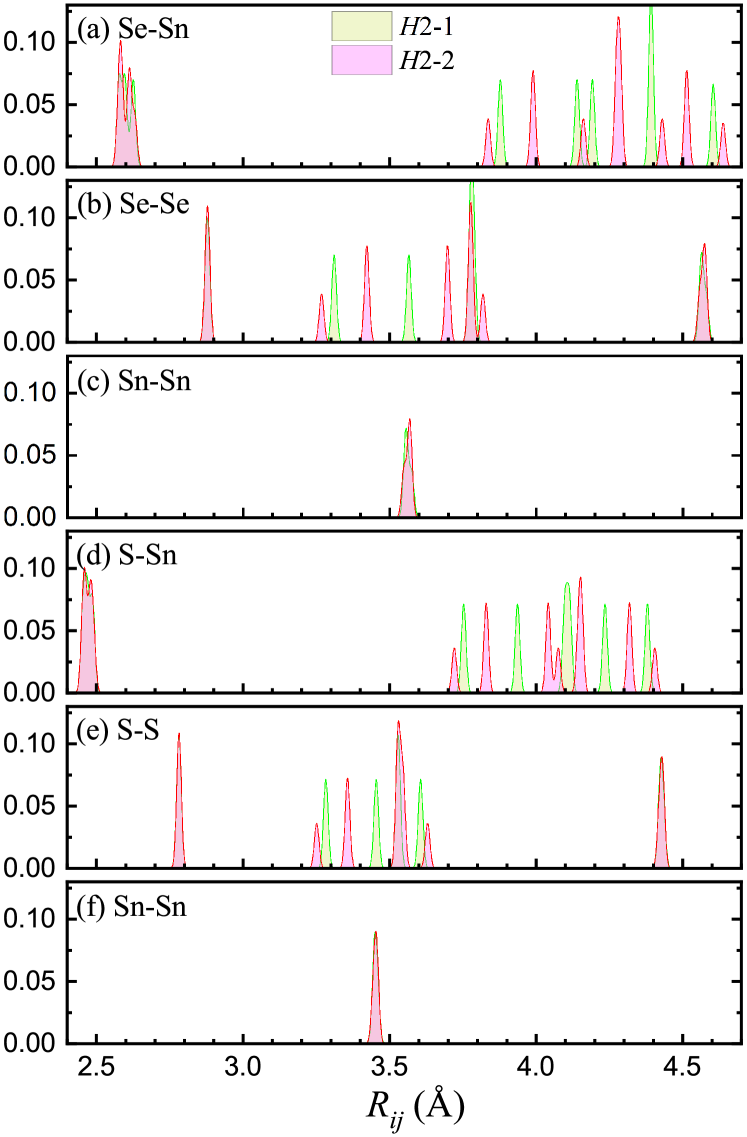
As can be appreciated from the pressure dependence plots of the relative enthalpy in Fig. 2(b), the phases are energetically more favorable above 18 and 20 GPa for SnSe2 and SnS2, respectively. This is in good agreement with our phonon calculations at 30 GPa, showing no imaginary frequencies and demonstrating the dynamical stability of the predicted 2 phases [Fig. 3]. We find the derivatives to be virtually degenerate in enthalpy and no distinguishable differences between their phonon spectra. A comparison of the radial distribution functions (RDFs) shown in Fig. 4 along with an estimate of the similarity factor (defined as the RDF dot product between two structures) provide further evidence that the 2-1 and 2-2 configurations are indeed distinct despite having similar enthalpies. In this case, using a Gaussian spread of 0.008 Hajinazar2020 , we find a similarity factor of 0.5358 and 0.6102 between the 2-1 and 2-2 structures for the SnSe2 and SnS2 systems, respectively. Noticeably, the main difference in the RDFs comes from the second-nearest neighbor, explaining the similar covalent network and, therefore, the very similar vibrational and low-energy electron properties of the 2 derivatives. Based on the RDF analysis, we can establish that the distorted configurations are nearby local minima, a situation encountered in other systems Shah2013 .
III.2 Electronic properties
In this section we systematically analyze the band structure of SnSe2 and SnS2 under hydrostatic and nonhydrostatic pressure. At zero pressure, both systems are found to be semiconducting with an indirect band gap of 0.62 eV in SnSe2 and 1.35 eV in SnS2, respectively. As for bulk TMDs consisting of the same transition metal, the compound with the most electronegative chalcogen has the largest band gap Gusakova2017 ; Zunger1978 ; DiSalvo1976 ; Reshak2003 . While this is the correct trend, we need to keep in mind in our following discussion that the size of the band gaps are underestimated relative to those extracted from experiments Domingo1966 ; Burton2016 ; Manou1996 ; Kumagai2016 ; Kudrynskyi2020 or calculated with the GW approximation or the HSE06 hybrid functional Kumagai2016 ; Gonzalez2016 .
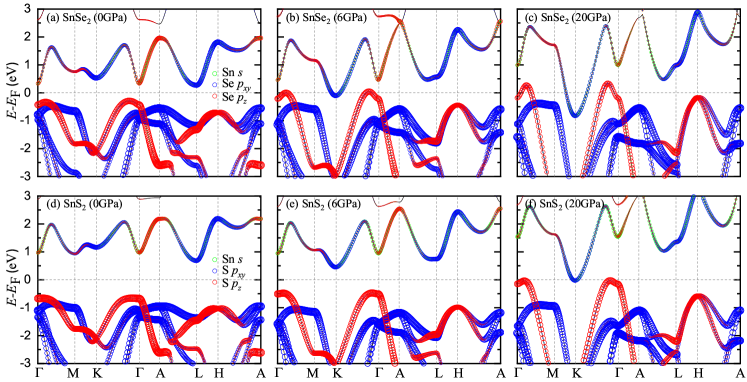
Figure 5 shows the calculated hydrostatic band structures for the 1 phase in the three-atom unit cell at 0, 6, and 20 GPa; band structures at other pressures are given in Supplemental Fig. S5 SM . The bottom of the conduction band displays a mixture of Sn with chalcogen (Se or S) orbitals along the in-plane directions and with chalcogen orbitals along the out-of-plane directions. The top of the valence band, on the other hand, consists almost entirely of chalcogen orbitals. Under compression, the orbital character of the bands remains largely unaffected, but the bandwidths expand as indicated by the increase in the slope of the dispersion curves. Near the Fermi level, the most significant change takes place in the lowest conduction band level along the segment. Due to a greater overlap between the chalcogen and Sn orbitals, the band energy at the point decreases, eventually dropping below the valence band maximum and closing the band gap. As a result, a pressure-induced semiconductor-to-metal transition is estimated to occur at 6 and 20 GPa in SnSe2 and SnS2, respectively.
The predicted metallization pressures are consistent with available theoretical results Nguyen-Cong2018 ; Ying2018 ; Filso2016 , but lower than the experimental values as anticipated from the underestimation of the band gaps in the PBE approximation. Additional changes in the metallization pressure are also expected under nonhydrostatic pressure conditions. DFT results show that a transition at a higher (lower) pressure is favored under in-plane (out-of-plane) uniaxial compressive strain [see Supplemental Fig. S6 SM ]. This trend is in agreement with experimental resistivity measurements in SnSe2 where a semiconductor-to-metal transition was observed between 8-13 GPa under quasi-hydrostatic pressure Ying2018 compared to a transition above 15.2 GPa under nonhydrostatic pressure Zhou2018 . As can be seen in Fig. 1(b), the in-plane compression in the latter study is considerable smaller, thus pushing the metallization point to a higher pressure.
To get a better understanding of how the internal structural parameters of the layers, the inter-layer distance, and the choice of chalcogen atom affect the electronic transition, we calculate the electronic dispersions of (i) SnSe2 structure at 0 GPa in which the Se atoms are substituted with S and the atomic coordinates are either kept unchanged (labeled as SnSe2-str-S) or allowed to relax (labeled as SnSe2-str-S-relaxed), and (ii) SnS2 structure at 0 GPa in which the S atoms are substituted with Se and the atomic coordinates are either kept unchanged (labeled as SnS2-str-Se) or allowed to relax (labeled as SnS2-str-Se-relaxed).
As shown in Supplemental Fig. S7 SM , the effect of replacing Se with S is an up-shift of the lowest conduction band states and, consequently, a slight increase in the band gap from 0.62 to 0.75 eV. Allowing the atoms to relax gives an additional up-shift of 0.15 eV since the intra-layer distance is reduced to almost the ideal value in SnS2. However this up-shift is still not large enough to reach the band gap value of SnS2. If, on the other hand, we use the SnS2 structure with the Se pseudopotential, as in calculation (ii), we see an opposite trend since now the lowest conduction band states move down in energy. The band gap reduces from 1.35 to 0.90 eV without atomic relaxation and further to 0.22 eV once the atoms are allowed to relax. The reduction by a factor of almost three of the band gap relative to the value in ideal SnSe2 can be ascribed to the presence of slightly more charge in the vdW gap as the inter-layer distance is compressed by almost 10%. Supplemental Figs. S8 and S9 SM show total charge and charge redistribution plots for the configurations described above. Overall, the metallization process is driven by the cooperative effect of both chemical and structural factors.
We further study the evolution of the charge density with pressure. Similar to TMDs, we find that under compression more electronic charge moves away from the Sn atoms and accumulates along the intra-layer bonds formed by Sn with the chalcogen atoms and in the inter-layer region between the chalcogen atoms Nayak2014 ; Guo2013 ; Rajaji2018 [Supplemental Figs. S10 SM ]. This view is also supported by the increase in the in-plane average charge at the middle of the vdW gap under applied pressure [see Supplemental Figs. S11 SM showing the in-plane average charge as a function of the perpendicular direction with respect to the layer]. This behavior is in contrast to intercalated carbon and boron layered compounds where, under applied pressure, the inter-layer charge from the intercalant atoms is forced out to the covalent sheets Zhang2006 ; Kim2006 ; Calandra2007-2 .
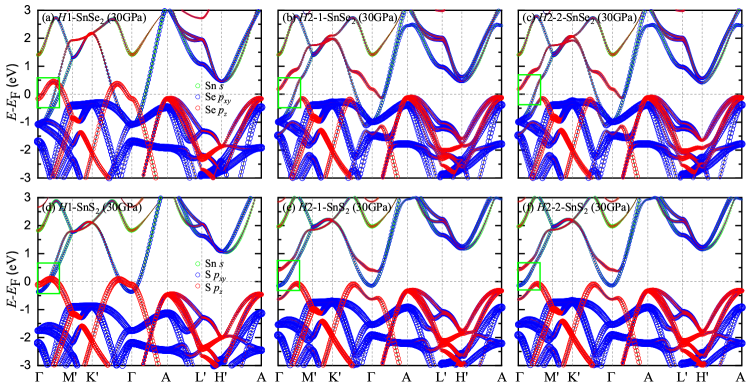
Finally, in Fig. 6 we compare the electronic structure of 1 and 2 phases in the supercell for the two systems. As shown in our previous study on SnSe2 Ying2018 , the main difference lies in the lifting of electronic degeneracy near the Fermi level along the and directions in the 2 structures. Compared to the parent 1 phase, there is an out-of-plane displacement of the Sn atoms resulting in a slight buckling of the Sn layers and a shift of the chalcogen atoms with respect to the center of the octahedron [see Supplemental Fig. S4 SM ]. This modulation of atomic positions leads to the avoidance of crossings between the bands with mixed Sn and chalcogen orbitals and the band with chalcogen character. Similarly to the phonon spectra in Fig. 3, there are no noticeable differences between the band structure plots of the derivatives.
III.3 Vibrational properties
In low-dimensional or layered systems, the appearance of a superlattice is often the signature of a CDW transition, as for example in TMDs Johannes2008 ; Calandra2009 . In these materials, it has been established that the wave vector dependence of the e-ph coupling is crucial in understanding the CDW formation, while the FS nesting has been found to only play a minor role Calandra2011 ; Heil2017 ; Johannes2008 ; Calandra2009 ; Weber2011 . As presented in our previous study on SnSe2 Ying2018 , the breaking of electronic degeneracies by a phonon-modulated lattice distortion, the reduction of the density of states (DOS) at the Fermi level, and the softening of a low-energy phonon are key signatures of a momentum-dependent e-ph coupling CDW instability. In this section, we want to investigate if the same reasoning is true for SnS2 as well.
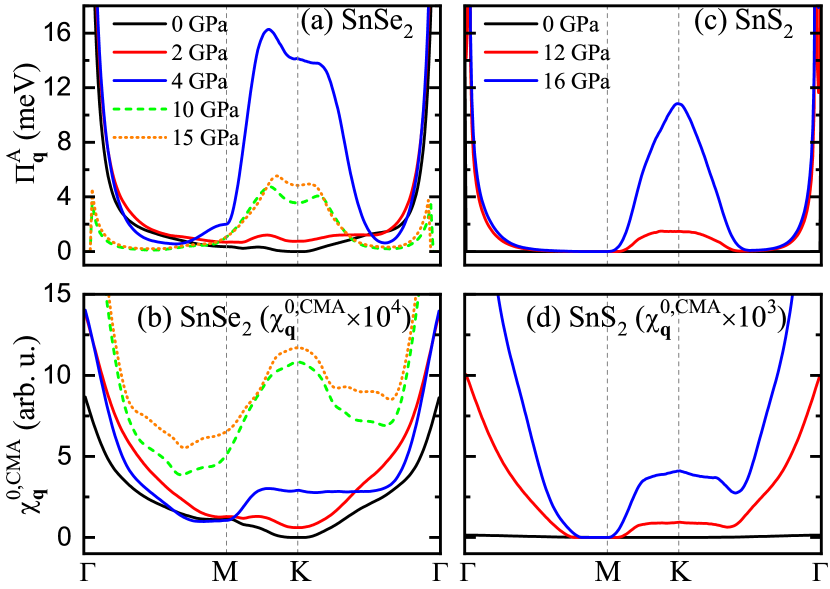
To address the microscopic mechanism responsible for the phase transition and the origin of phonon softening at , we calculate the adiabatic phonon self-energy () for the lowest-energy phonon mode and the static bare susceptibility in the constant matrix approximation () using the following equations Giustino2017 ; EPW ; Zhang2005
| (1) | |||||
| (2) |
Here, 2 is the spin degeneracy factor, and represent single-particle energies and Fermi-Dirac occupation factors, respectively, and is the BZ volume. The screened e-ph matrix elements were obtained as , where represents the Kohn-Sham single-particle eigenstates, is the derivative of the self-consistent potential, and is the phonon frequency associated with phonon branch and wave vector . The bare matrix element is calculated by multiplying the screened e-ph matrix elements with the electronic dielectric function at =0 []. Thus, the matrix elements in Eqn. (1) can be replaced by note3 .
Both and are properties of the FS bands and those electronic states close to them, yet is purely electronic, while includes the fully anisotropic e-ph interaction. As can be appreciated in Fig. 7, we observe an increasing response of and at the point in both systems with increasing pressure, meaning that both FS nesting as well as the e-ph coupling strength increase at the BZ regions close to as the critical pressure for the phase transition is approached. This leads us to the conclusion that both FS nesting and strong e-ph interactions are providing important contributions in creating the PLD instability in SnS2, in close analogy to SnSe2 Ying2018 ; note1 ; note2 .
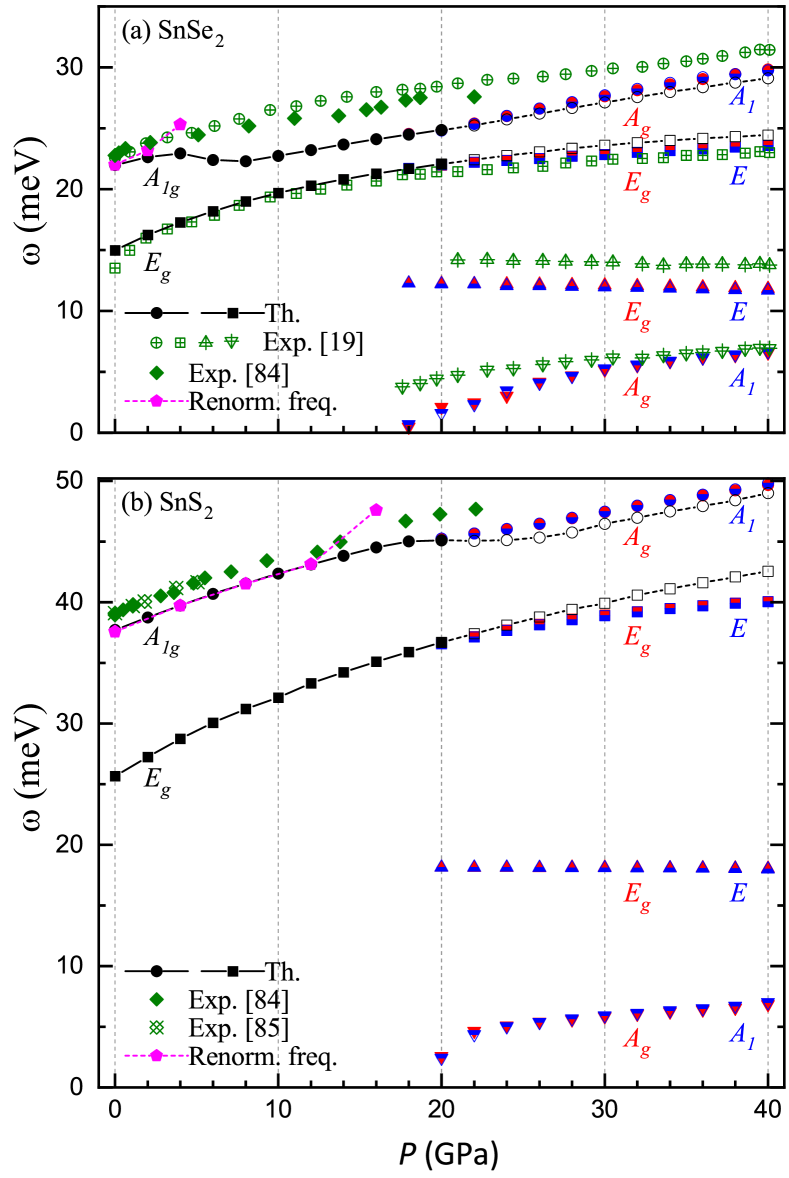
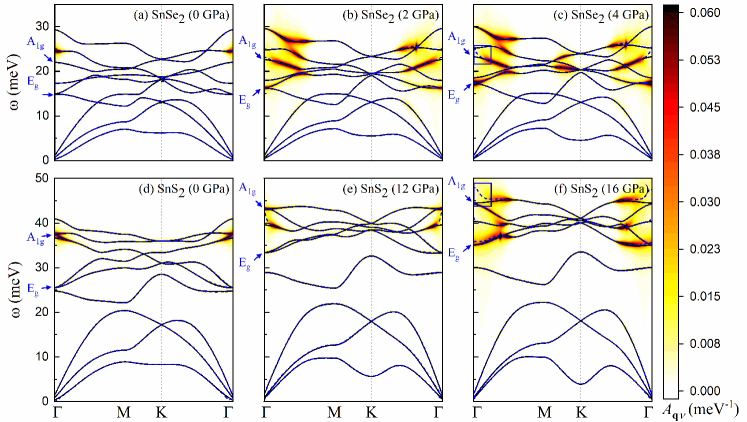
Having identified the PLD instability in SnS2 to be of the same origins as in SnSe2, we carry on to compare the materials’ Raman-active modes’ frequencies as a function of pressure, as shown in Fig. 8. The high energy mode increases monotonically as a function of pressure in both SnSe2 and SnS2. The high energy mode, on the other hand, shows a noticeable change of slope at approximately 6 and 20 GPa in the case of SnSe2 and SnS2, respectively. This can be related to the semiconductor-to-metal transition in both systems as also supported by Supplemental Fig. S12 SM . After the phase transition, due to the in-plane tripling of the unit cell, two additional Raman-active modes appear at 17 GPa for SnSe2 and at 20 GPa for SnS2, in good agreement with available experimental data Ying2018 .
The pressure dependence of the high-energy mode for SnSe2 is in very good agreement with the experimental results, however, the high-energy mode, while reproducing nicely the qualitative trend, underestimates the phonon energies by meV at 0 GPa and meV at 6 GPa (the metallization pressure) compared to experiments Ying2018 . Recent studies on other insulators and semiconductors show that the underestimation of phonon energies with respect to experiments can be due to the neglection of nonadiabatic effects in the theoretical approach Pisana2007 ; Caudal2007 ; Calandra2007 ; Saitta2008 ; Calandra2010 . In order to assess the effect of nonadiabatic corrections on the phonon dispersions in our systems, we employed a field-theoretic framework Giustino2017 , where the phonon self-energy can be partitioned into adiabatic and nonadiabatic contributions, i.e., . Thus, the nonadiabatic corrections to the self-energy as a function of the phonon mode and wave vector are given by:
with being a positive infinitesimal number. The nonadiabatic phonon spectral function Allen1972 ; Caruso2017 can then be calculated using
| (4) |
Equation (4) reveals that a strong response of the system is expected at the nonadiabatic phonon frequency, , when the denominator is very small or vanishes. The renormalized nonadiabatic phonon energy, that is, the phonon energy modified by the phonon self-energy of Eqn. (III.3) is thus given by
| (5) |
The nonadiabatic spectral functions and the nonadiabatic phonon dispersions obtained via Eqns. (4) and (5) at various pressures along the direction for SnSe2 and SnS2 are reported in Fig. 9. As can be appreciated from Fig. 9, the nonadiabatic effects are very small in both systems at ambient pressure. As the pressure increases (and the band gap decreases), the renormalization of the mode energy becomes significant around 4 GPa in SnSe2 and around 16 GPa in SnS2. In particular, the mode in SnSe2 hardens by meV at 4 GPa [Fig. 9(c)], improving the quantitative agreement of our calculations with the experiments Ying2018 [see also Fig. 8]. Similarly, the mode in SnS2 hardens by meV at 16 GPa as shown in Fig. 9(f). For the mode, where the agreement between experiments and theory has already been very good, the nonadiabatic corrections are found to be very small.
As SnSe2 and SnS2 are polar semiconductors at ambient and low pressures, we also want to address the topic of LO-TO splitting. At ambient pressure, we observe a LO-TO splitting of 7 meV for SnSe2 and 11.8 meV for SnS2 [see Supplemental Fig. S13 SM ]. With increasing pressure, the band gap decreases and the value for the dielectric function increases. In turn, the magnitude of the LO-TO splitting decreases, in accordance with experimental measurements in other polar semiconductors Wagner2000 ; Goni2001 . Interestingly, however, at the critical pressures above which our compounds become metallic, our calculations still yield finite values for the splitting (around 6.4 meV for SnSe2 and 10 meV for SnS2). A possible explanation for the residuary LO-TO splitting is that in the pressure regions, where the materials pass through the semiconductor-metal phase transition, the charge carrier concentration is so low that the long-range Coulomb interactions are not fully screened, thus allowing for finite LO-TO splitting. In the fully metallic state at higher pressures, the long-range Coulomb interactions are screened completely leading to the degeneracy of LO and TO modes. Although highly interesting, resolving the intermediate bad metal phase would go beyond the scope of this work and is therefore the focus of future investigations.
III.4 Superconducting properties
Experimental evidence of pressure-induce superconductivity in SnSe2 has been recently provided based on electrical transport and synchrotron XRD measurements Zhou2018 . The superconducting state is observed to emerge at 18.6 GPa and to reach a maximum of about 6.1 K, which remains nearly constant in a large pressure range between 30.1 and 50.3 GPa. Earlier studies have demonstrated superconductivity in bulk and thin films SnSe2 through intercalation and gating Ohara1992 ; Li2017 ; Song2019 ; Wu2019 as well as interface superconductivity in SnSe2/ion-liquid and SnSe2/graphene Zeng2018 ; Zhang2018 .
In this section we investigate the origin of the observed superconducting transition in SnSe2 using the Migdal-Eliashberg (ME) formalism implemented in the EPW code EPW ; Margine2013 . To facilitate the comparison with the experimental results of Zhou et al. Zhou2018 , the superconducting properties are calculated at the experimental unit cell parameters for nonhydrostatic pressure points at 23 and 30 GPa while allowing the atomic positions to relax. The resulting electronic structure and phonon dispersion are shown in Supplemental Figs. S14-S16 SM . A comparison with the plots under hydrostatic conditions at 20 and 30 GPa [Figs. 5, 6, and S3] demonstrate that the electronic structure is highly insensitive to the crystal structure parameters while the phonon frequencies are slightly affected. For instance, according to our phonon calculations within the harmonic approximation a lattice instability starts developing at 20 and 30 GPa under hydrostatic and nonhydrostatic conditions, respectively. Since the pressure-dependence of the lowest acoustic mode at the point is responsible for the dynamical instability in this compound, the reduced in-plane compressibility rate in the latter case leads to a decrease in the phonon softening rate and consequently an increase in the stability region up to 30 GPa. While this trend is in the right direction, the transition pressure is still underestimated compared to the nonhydrostatic experiments in Ref. [Zhou2018, ] that showed no structural phase transition or decomposition up to 46 GPa. The situation is reminiscent of the one encountered in NbSe2 and NbS2, where the instability found at the harmonic level has been shown to be weakened or even removed when quantum anharmonic effects are taken into account, and therefore suppress the formation of the CDW phase Leroux2015 ; Heil2017 . A similar scenario occurring in SnSe2 would extend the stabilization region to higher pressures as found in experiment. To check this point, we re-evaluated the phonons at the point with a larger smearing value of 0.03 Ry and indeed found that the imaginary phonon mode is removed, thus preserving the dynamic stability [see dash line in Supplemental Fig. S16(a) SM ].
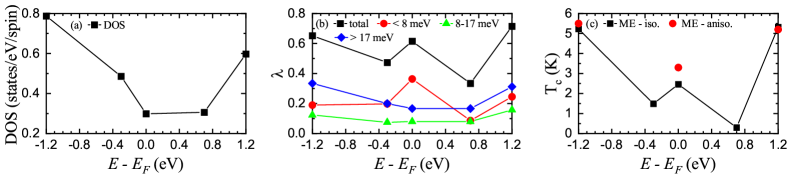
In order to understand the origin of the superconducting state, we evaluate the Eliashberg spectral function and the corresponding e-ph coupling strength . A comparative analysis of the and the atomically resolved phonon DOS (PHDOS) at the experimental lattice cell parameters at 23 GPa [Supplemental Fig. S15 SM ] reveals that the low-frequency phonons below 8 meV associated with both Sn and Se vibrations contribute 60% of the total , while the phonons in the high-frequency region between 17 and 32 meV dominated by Se atoms vibrations give approximately 30% of [Fig. 10(b)]. Using a typical value of , we predict a of 2.5 and 3.3 K from the numerical solutions of the isotropic and anisotropic ME gap equations Margine2013 ; EPW , slightly below the 4.0 K onset temperature () of electrical resistance drop at 22 GPa reported in Ref. [Zhou2018, ]. The results are almost unchanged when the calculations are performed at the experimental lattice cell parameters at 30 GPa [Supplemental Fig. S16 SM ]. For the point phonons computed at the larger smearing value of 0.03 Ry, we get and an isotropic K with .
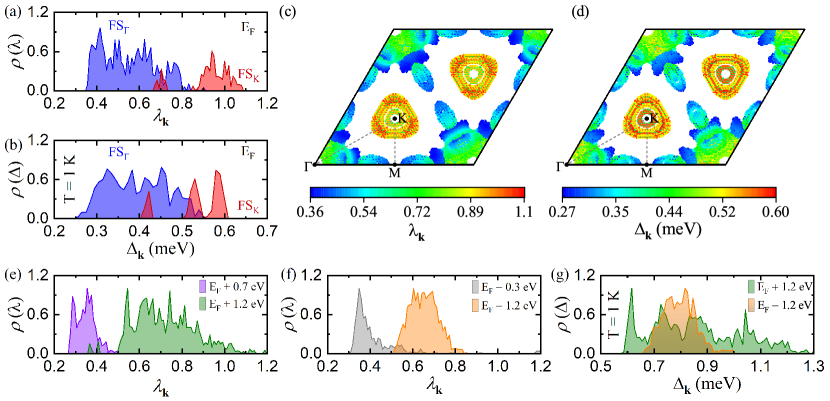
Considering that superconductivity in SnSe2 has been achieved experimentally either in Se-deficient Zhou2018 or intercalated Ohara1992 ; Song2019 ; Wu2019 ; Li2017 samples, we further investigate the impact of doping on the predicted via a rigid shift of , chosen to match particular features either in the valence or in the conduction band, for the structure at the experimental lattice cell parameters at 23 GPa. The results summarized in Fig. 10 can be rationalized in terms of the changes taking place at the FS upon raising or lowering the Fermi level. In the undoped systems, the momentum-resolved e-ph coupling strength on the FS displays a highly anisotropic distribution (between 0.3 and 1.1) where the lower and upper regions of the spectra can be associated with the and -centered pockets, respectively [Fig. 11(a),(c)]. A continuous distribution with a sizable anisotropy is also found for the superconducting gap on the FS as shown in Fig. 11(b),(d). When is moved up by 0.7 eV, the spread in is reduced to a much narrower range of 0.3-0.5 since the -centered holelike FS sheet vanishes. However, the spread goes back to the wider range once the system is doped until the Fermi level matches the first peak in the conduction band DOS as two additional FS sheets are introduced, thus opening extra scattering channels. This leads to an enhancement in both and K, the latter in good agreement with the maximum value found experimentally. Similar trends are also observed when the Fermi level is shifted down. It is also worth noting that the non-linear dependence of the total with doping correlates closely with that of the low-energy phonons [Fig. 10], indicating that these modes play a decisive role in raising the e-ph coupling strength and in this system.
For completeness, we also analyze the superconducting properties of SnS2. Assuming that the dynamical stability of SnS2 can be extended to higher pressures under nonhydrostatic compression as for SnSe2, we perform superconductivity calculations at 30 GPa and used a smearing value of 0.04 Ry for the phonons at the point in order to remove the imaginary frequency. The calculated PHDOS and Eliashberg spectral function comprise of two well defined regions separated by a gap between the acoustic and optical branches [Supplemental Fig. S18 SM ]. Integrating , the strength of the e-ph coupling is estimated to be 1.08. From the solutions of the isotropic and anisotropic ME gap equations with , we obtain a of 4.6 and 5.9 K, respectively [Supplemental Figs. S19-S20 SM ]. The values of and are twice larger than those in SnSe2 due to the enhanced coupling of the acoustic phonons dominated by Sn vibrations with the electronic state present at the Fermi level. Similar to SnSe2, the strongest coupling takes place on the -centered FS, but both and exhibit a much broader distribution profile. We also find that is strongly affected by changes in the FS topology when is shifted up or down. Namely, the e-ph coupling drops significantly as the contribution of the low-energy acoustic modes is drastically reduced and large doping is required to raise back the .
Finally, we investigate SnSe2 and SnS2 compounds in the 2-1 structure as potential superconductors. The results are presented in Supplemental Figs. S21-S23 SM . Despite the close resemblance between the DOS and PHDOS of the parent and superlattice structures, the in 2-1 phase is found to be an order of magnitude lower than in the 1 phase. This can be linked to a decrease in the e-ph coupling over the full phonon range due to the reorganization that takes place at the FS. Looking at the electronic band structure in the supercell [region enclosed by the green box in Fig. 6], it can be seen that the -centered FS sheet disappears as a gap opens in the electronic band dominated by Se orbitals. An increase in the DOS at is expected to produce a marked enhancement in , particularly under hole doping as multiple bands will cross the Fermi level. In SnSe2 a 0.3 eV down shift in results in an isotropic K, while in SnS2 a 0.5 eV down shift leads to K.
IV Conclusions
In this work, we have performed a comparative study of SnSe2 and SnS2 at ambient conditions and pressures up to 40 GPa. We show that the apparent contradictions among high-pressure results on SnSe2 can be attributed to differences in experimental conditions and that inclusion of nonadiabatic effects improves the quantitative agreement with the measured Raman-active phonon frequencies. We further demonstrate that a periodic lattice transition, of a similar origin to the one observed in SnSe2, also occurs in SnS2 above 20 GPa. In addition, we examine the nature of the superconducting state recently observed in SnSe2 under nonhydrostatic pressure, and provide evidence that the superconducting transition can be explained within a standard phonon-mediated mechanism. The emergence of superconductivity with a comparable critical temperature in SnS2 under similar experimental conditions is also predicted. Finally, we show that in the high pressure PLD 2-1 phase the is reduced by an order of magnitude compared to the high-symmetry 1 phase in both systems, a fact that we attribute to a restructuring and suppression of large parts of the Fermi surface.
Conflicts of interest
There are no conflicts to declare.
Acknowledgements.
The authors thank J. Ying, V. V. Struzhkin, and F. Caruso for useful discussions. C. H. acknowledges support by the Austrian Science Fund (FWF) Project No. P32144-N36 and the VSC-3 of the Vienna University of Technology. G. P. K., H. P., and E. R. M. acknowledge support from the National Science Foundation (Award No. OAC–1740263). This work used Spiedie cluster at Binghamton University and Comet cluster at the San Diego Supercomputer Center through allocation TG-DMR180071. Comet is a dedicated XSEDE cluster XSEDE , which is supported by National Science Foundation Grant No. ACI-1548562.References
- (1) F. Ke, J. Yang, C. Liu, Q. Wang, Y. Li, J. Zhang, L. Wu, X. Zhang, Y. Han, B. Wu, Y. Ma, and C. Gao, “High-pressure electrical-transport properties of SnS: experimental and theoretical approaches”, J. Phys. Chem. C 117, 6033 (2013).
- (2) J. Vidal, S. Lany, M. d’Avezac, A. Zunger, A. Zakutayev, J. Francis, and J. Tate, “Band-structure, optical properties, and defect physics of the photovoltaic semiconductor SnS”, Appl. Phys. Lett. 100, 032104 (2012).
- (3) P. Sinsermsuksakul, L. Sun, S. W. Lee, H. H. Park, S. B. Kim, C. Yang, and R. G. Gordon, “Overcoming efficiency limitations of SnS‐based solar cells”, Adv. Energy Mater. 4, 1400496 (2014).
- (4) L.-D. Zhao, S.-H. Lo, Y. Zhang, H. Sun, G. Tan, C. Uher, C. Wolverton, V. P. Dravid, and M. G. Kanatzidis, “Ultralow thermal conductivity and high thermoelectric figure of merit in SnSe crystals”, Nature 508, 373 (2014).
- (5) G. Ding, G. Gao, and K. Yao , “High-efficient thermoelectric materials: The case of orthorhombic IV-VI compounds”, Sci. Rep. 5, 9567 (2015).
- (6) H. Yu, S. Dai, and Y. Chen , “Enhanced power factor via the control of structural phase transition in SnSe”, Sci. Rep. 6, 26193 (2016).
- (7) L. D. Zhao, G. Tan, S. Hao, J. He, Y. Pei, H. Chi, H. Wang, S. Gong, H. Xu, V. P. Dravid, C. Uher, “Ultrahigh power factor and thermoelectric performance in hole-doped single-crystal SnSe”, Science 351, 141 (2016).
- (8) A. Dewandre, O. Hellman, S. Bhattacharya, A. H. Romero, G. K. H. Madsen, and M. J. Verstraete, “Two-step phase transition in SnSe and the origins of its high power factor from first principles”, Phys. Rev. B 117, 276601 (2016).
- (9) X. Chen, P. Lu, X. Wang, Y. Zhou, C. An, Y. Zhou, C. Xian, H. Gao, Z. Guo, C. Park, B. Hou, K. Peng, X. Zhou, J. Sun, Y. Xiong, Z. Yang, D. Xing, and Y. Zhang, “Topological Dirac line nodes and superconductivity coexist in SnSe at high pressure”, Phys. Rev. B 96, 165123 (2017).
- (10) H. Yu, W. Lao, L. Wang, K. Li, and Y. Chen, “Pressure-stabilized tin selenide phase with an unexpected stoichiometry and a predicted superconducting state at low temperatures”, Phys. Rev. Lett. 118, 137002 (2017).
- (11) G. Marini, P. Barone, A. Sanna, C. Tresca, L. Benfatto, and G. Profeta, “Superconductivity in tin selenide under pressure”, Phys. Rev. Mater. 3, 114803 (2019).
- (12) J. Zhou, S. Zhang, and J. Li, “Normal-to-topological insulator martensitic phase transition in group-IV monochalcogenides driven by light”, NPG Asia Mater. 12, 1 (2020).
- (13) H. Wu, S. Li, M. Susner, S. Kwon, M. Kim, T. Haugan, B. Lv, “Spacing dependent and cation doping independent superconductivity in intercalated 1T two dimensional SnSe2”, 2D Mater. 6, 045048. (2019).
- (14) Y. Qi, P. G. Naumov, M. N. Ali, C. R. Rajamathi, W. Schnelle, O. Barkalov, M. Hanfland, S.-C. Wu, C. Shekhar, Y. Sun, V. Sü, M. Schmidt, U. Schwarz, E. Pippel, P. Werner, R. Hillebrand, T. Förster, E. Kampert, S. Parkin, R. J. Cava, C. Felser, B. Yan, and S. A. Medvedev, “Superconductivity in Weyl semimetal candidate MoTe2”, Nat. Commun. 7, 11038 (2016).
- (15) X. C. Pan, X. Chen, H. Liu, Y. Feng, Z. Wei, Y. Zhou, Z. Chi, L. Pi, F. Yen, F. Song, X. Wan, Z. Yang, B. Wang, G. Wang, and Y. Zhang, “Pressure-driven dome-shaped superconductivity and electronic structural evolution in tungsten ditelluride”, Nat. Commun. 6, 7805 (2015).
- (16) M. Leroux, I. Errea, M. L. Tacon, S.-M. Souliou, G. Garbarino, L. Cario, A. Bosak, F. Mauri, M. Calandra, and P. Rodiere, “Strong anharmonicity induces quantum melting of charge density wave in 2H-NbSe2 under pressure”, Phys. Rev. B 92, 140303 (2015).
- (17) B. Sipos, A. F. Kusmartseva, A. Akrap, H. Berger, L. Forró, and E. Tutiš, “From Mott state to superconductivity in 1T-TaS2”, Nat. Mater. 7, 960 (2008).
- (18) H. Paudyal, S. Poncé, F. Giustino, and E. R. Margine, “Superconducting properties of MoTe2 from anisotropic Migdal-Eliashberg theory”, Phys. Rev. B 101, 214515 (2020).
- (19) J. Ying, H. Paudyal, C. Heil, X. J. Chen, V. V. Struzhkin, and E. R. Margine, “Unusual pressure-induced periodic lattice distortion in SnSe2”, Phys. Rev. Lett. 121, 027003 (2018).
- (20) M. Calandra and F. Mauri, “Charge-density wave and superconducting dome in TiSe2 from electron-phonon interaction”, Phys. Rev. Lett. 106, 196406 (2011).
- (21) M. N. Ali, J. Xiong, S. Flynn, J. Tao, Q. D. Gibson, L. M. Schoop, T. Liang, N. Haldolaarachchige, M. Hirschberger, N. P. Ong, and R. J. Cava, “Large, non-saturating magnetoresistance in WTe2”, Nature 514, 205 (2014).
- (22) K. Nguyen-Cong, J. M. Gonzalez, B. A. Steele, I. I. Oleynik, “Tin-Selenium compounds at ambient and high pressures”, J. Phys. Chem. 122, 18274 (2018).
- (23) J. M. Gonzalez, K. Nguyen-Cong, B. A. Steele, and I. I. Oleynik, “Novel phases and superconductivity of tin sulfide compounds”, J. Chem. Phys. 148, 194701 (2018).
- (24) Y. A. Timofeev, B. V. Vinogradov, and V. B. Begoulev, “Superconductivity of tin selenide at pressures up to 70 GPa”, Phys. Solid State 39, 207 (1997).
- (25) A. H. C. Neto, “Charge density wave, superconductivity, and anomalous metallic behavior in 2D transition metal dichalcogenides”, Phys. Rev. Lett. 86, 4382 (2001).
- (26) D. Kang, Y. Zhou,W. Yi, C. Yang, J. Guo, Y. Shi, S. Zhang, Z. Wang, C. Zhang, S. Jiang, A. Li, K. Yang, Q. Wu, G. Zhang, L. Sun, and Z. Zhao, “Superconductivity emerging from a suppressed large magnetoresistant state in tungsten ditelluride”, Nat. Commun. 6, 7804 (2015).
- (27) T. Valla, A.V. Fedorov, P. D. Johnson, P-A. Glans, C. McGuinness, K. E. Smith, E.Y. Andrei, and H. Berger, “Quasiparticle spectra, charge-density waves, superconductivity, and electron-phonon coupling in 2H-NbSe2”, Phys. Rev. Lett. 92, 086401 (2004).
- (28) Y. Zhou, B. Zhang, X. Chen, C. Gu, C. An, Y. Zhou, K. Cai, Y. Yuan, C. Chen, H. Wu, R. Zhang, C. Park, Y. Xiong, X. Zhang, K. Wang, and Z. Yang, “Pressure-induced metallization and robust superconductivity in pristine 1-SnSe2”, Adv. Electron. Mater. 4, 1800155 (2018).
- (29) W. Albers and K. Schol, “The P-T-X phase diagram of the system Sn-S”, Philips Res. Repts. 16, 329 (1961).
- (30) C. Heil, S. Poncé, H. Lambert, M. Schlipf, E. R. Margine, and F. Giustino, “Origin of superconductivity and latent charge density wave in NbS2”, Phys. Rev. Lett. 119, 087003 (2017).
- (31) M. Calandra, I. Mazin, and F. Mauri, “Effect of dimensionality on the charge-density wave in few-layer 2H-NbSe2”, Phys. Rev. B 80, 241108 (2009).
- (32) M. D. Johannes and I. I. Mazin, “Fermi surface nesting and the origin of charge density waves in metals”, Phys. Rev. B 77, 165135 (2008).
- (33) F. Weber, S. Rosenkranz, J.-P. Castellan, R. Osborn, R. Hott, R. Heid, K.-P. Bohnen, T. Egami, A. H. Said, and D. Reznik, “Extended phonon collapse and the origin of the charge-density wave in 2H-NbSe2”, Phys. Rev. Lett. 107, 107403 (2011).
- (34) P. Giannozzi, O. Andreussi, T. Brumme, O. Bunau, M. B. Nardelli, M. Calandra, R. Car, C. Cavazzoni, D. Ceresoli, M. Cococcioni et al., “Advanced capabilities for materials modelling with Quantum ESPRESSO”, J. Phys.: Condens. Matter 29, 465901 (2017).
- (35) D. R. Hamann, “Optimized norm-conserving Vanderbilt pseudopotentials”, Phys. Rev. B 88, 085117 (2013).
- (36) J. P. Perdew, K. Burke, and M. Ernzerhof, “Generalized gradient approximation made simple”, Phys. Rev. Lett. 77, 3865 (1996).
- (37) J. Klimeš, D. R. Bowler, and A. Michaelides, “Van der Waals density functionals applied to solids”, Phys. Rev. B 83, 195131 (2011).
- (38) J. Klimeš, D. R. Bowler, and A. Michaelides, “Chemical accuracy for the van der Waals density functional”, J. Phys.: Condens. Matter 22, 022201 (2010).
- (39) N. Marzari, D. Vanderbilt, A. De Vita, and M. Payne, “Thermal contraction and disordering of the Al (110) surface”, Phys. Rev. Lett. 82, 3296 (1999).
- (40) H. J. Monkhorst and J. D. Pack, “Special points for Brillouin-zone integrations”, Phys. Rev. B 13, 5188 (1976).
- (41) S. Baroni, S. de Gironcoli, A. D. Corso, and P. Giannozzi, “Phonons and related crystal properties from density-functional perturbation theory”, Rev. Mod. Phys. 73, 515 (2001).
- (42) F. Giustino, M. L. Cohen, and S. G. Louie, “Electron-phonon interaction using Wannier functions”, Phys. Rev. B 76, 165108 (2007).
- (43) S. Poncé, E. R. Margine, C. Verdi, and F. Giustino, “EPW: Electron-phonon coupling, transport and superconducting properties using maximally localized Wannier functions”, Comput. Phys. Commun. 209, 116 (2016).
- (44) N. Marzari, A. A. Mostofi, J. R. Yates, I. Souza, and D. Vanderbilt, “Maximally localized Wannier functions: Theory and applications”, Rev. Mod. Phys. 84, 1419 (2012).
- (45) G. Pizzi, V. Vitale, R. Arita, S. Bluegel, F. Freimuth, G. Géranton, M. Gibertini, D. Gresch, C. Johnson, T. Koretsune et al., “Wannier90 as a community code: new features and applications”, J. Phys.: Condens. Matter (2019).
- (46) Y. Huang, E. Sutter, J. T. Sadowski, M. Cotlet, O. L. Monti, D. A. Racke, M. R. Neupane, D. Wickramaratne, R. K. Lake, B. A. Parkinson, and P. Sutter, “Tin disulfide-an emerging layered metal dichalcogenide semiconductor: materials properties and device characteristics”, ACS Nano 8, 10743 (2014).
- (47) Z. V. Borges, C. M. Poffo, J. C. de Lima, S. M. Souza, D. M. Trichôs, and R. S. de Biasi, “High-pressure angle-dispersive X-ray diffraction study of mechanically alloyed SnSe2”, J. Appl. Phys. 124, 215901 (2018).
- (48) K. Knorr, L. Ehm, M. Hytha, B. Winkler, and W. Depmeier, “The High pressure behaviour of SnS2: X-Ray powder diffraction and quantum mechanical calculations up to 10 GPa”, Phys. Stat. Sol. 223, 435 (2001).
- (49) R. M. Hazen, L. W. Finger, “The crystal structures and compressibilities of layer minerals at high pressure. I. SnS2, berndtite”, American Mineralogist 63, 289 (1978).
- (50) M. . Fils, E. Eikeland, J. Zhang, S. R. Madsen and B. B. Iversen, “Atomic and electronic structure transformations in SnS2 at high pressures: a joint single crystal X-ray diffraction and DFT study”, Dalton Trans. 45, 3798 (2016).
- (51) See Supplemental Material at [url] for Figs. S1-S23 and Table S1.
- (52) L. Yang, L. Dai, H. Li, H. Hu, K. Liu, C. Pu, M. Hong, and P. Liu, “Pressure-induced metallization in MoSe2 under different pressure conditions”, RSC Adv. 9, 5794 (2019).
- (53) S. Duwal and C.-S. Yoo, “Shear-induced isostructural phase transition and metallization of layered tungsten disulfide under nonhydrostatic compression”, J. Phys. Chem. C 120, 5101 (2016).
- (54) M. Fujimoto, “The Physics of Structural Phase Transitions”, Springer-Verlag New York, second edition, (2005).
- (55) A. N. Kolmogorov, S. Shah, E. R. Margine, A. K. Kleppe, and A. P. Jephcoat, “Pressure-driven evolution of the covalent network in CaB6”, Phys. Rev. Lett. 109, 075501 (2012).
- (56) S. Hajinazar, A. Thorn, E. D. Sandoval, S. Kharabadze, and A. N. Kolmogorova, “MAISE: Construction of neural network interatomic models and evolutionary structure optimization”, arXiv:2005.12131v2.
- (57) S. Shah and A. N. Kolmogorov, “Stability and superconductivity of Ca-B phases at ambient and high pressure”, Phys. Rev. B 88, 014107 (2013).
- (58) J. Gusakova, X. Wang, L. L. Shiau, A. Krivosheeva, V. Shaposhnikov, V. Borisenko, V. Gusakov, and B. K. Tay, “Electronic properties of bulk and monolayer TMDs: theoretical study within DFT framework (GVJ-2e method)”, Phys. Status Solidi A 214, 1700218 (2017).
- (59) A. Zunger and A. J. Freeman, “Band structure and lattice i Mbility of TiSe2”, Phys. Rev. B 17, 1839 (1978).
- (60) F. J. Di Salvo, D. E. Moncton, and J. V. Waszezak, “Electronic properties and superlattice formation in the semimetal TiSe2”, Phys. Rev. B 14, 4321 (1976).
- (61) A. H. Reshak and S. Auluck, “Electronic and optical properties of the 1T phases of TiS2, TiSe2, and TiTe2”, Phys. Rev. B 68, 245113 (2003).
- (62) G. Domingo, R. S. Itoga, and C. R. Kannewurf, “Fundamental optical absorption in SnS2, and SnSe2”, Phys. Rev. 143, 536 (1966).
- (63) L. A. Burton, T. J. Whittles, D. Hesp, W. M. Linhart, J. M. Skelton, B. Hou, R. F. Webster, G. O’Dowd, C. Reece, D. Cherns, D. J. Fermin, T. D. Veal, V. R. Dhanak, and A. Walsh, “Electronic and optical properties of single crystal SnS2: an earth-abundant disulfide photocatalyst”, J. Mater. Chem. A 4, 1312 (2016).
- (64) P. Manou, J.A. Kalomiros, A.N. Anagnostopoulos, and K. Kambas, “Optical properties of SnSe2 single crystals”, Phys. Rev. 143, 536 (1966).
- (65) Y. Kumagai, L. A. Burton, A. Walsh, and F. Oba, “Electronic Structure and Defect Physics of Tin Sulfides: SnS, Sn2S3, and SnS2”, Phys. Rev. Appl. 6, 014009 (2016).
- (66) Z. R. Kudrynskyi, X. Wang, J. Sutcliffe, M. A. Bhuiyan, Y. Fu, Z. Yang, O. Makarovsky, L. Eaves, A. Solomon, V. T. Maslyuk, Z. D. Kovalyuk, L. Zhang, and A. Patané, “Van der Waals SnSe2(1-x)S2x alloys: composition-dependent bowing coefficient and electron–phonon interaction”, Adv. Funct. Mater. 30, 1908092 (2020).
- (67) J. M. Gonzalez and I. I. Oleynik, “Layer-dependent properties of SnS2 and SnSe2 two-dimensional materials”, Phys. Rev. B 94, 125443 (2016).
- (68) H. Guo, T. Yang, P. Tao, Y. Wang, and Z. Zhang, “High pressure effect on structure, electronic structure, and thermoelectric properties of MoS2”, J. Appl. Phys. 113, 013709 (2013).
- (69) V. Rajaji, U. Dutta, P. C. Sreeparvathy, S. Ch. Sarma, Y. A. Sorb, B. Joseph, S. Sahoo, S. C. Peter, V. Kanchana, and C. Narayana, “Structural, vibrational, and electrical properties of 1T-TiTe2 under hydrostatic pressure: experiments and theory”, Phys. Rev. B 97, 085107 (2018).
- (70) A. P. Nayak, S. Bhattacharyya, J. Zhu, J. Liu, X. Wu, T. Pandey, C. Jin, A. K. Singh, D. Akinwande,and J.-F. Lin, “Pressure-induced semiconducting to metallic transition in multilayered molybdenum disulphide”, Nat. Commun. 5, 1 (2014).
- (71) L. Zhang, Y. Xie, T. Cui, Y. Li, Z. He, Y. Ma, and G. Zou, “Pressure-induced enhancement of electron-phonon coupling in superconducting CaC6 from first principles”, Phys. Rev. B 74, 184519 (2006).
- (72) J. S. Kim, L. Boeri, and R. K. Kremer, and F. S. Razavi, “Effect of pressure on superconducting Ca-intercalated graphite CaC6”, Phys. Rev. B 74, 214513 (2006).
- (73) M. Calandra, A. N. Kolmogorov, and S. Curtarolo, “Search for high in layered structures: The case of LiB”, Phys. Rev. B 75, 144506 (2007).
- (74) F. Giustino, “Electron-phonon interactions from first principles”, Rev. Mod. Phys. 89, 015003 (2017).
- (75) P. Zhang, S. G. Louie, and M. L. Cohen, “Nonlocal Screening, Electron-Phonon Coupling, and Phonon Renormalization in Metals”, Phys. Rev. Lett. 94, 225502 (2005).
- (76) We want to note at this point that there has been a mistake in the calculation of and in Ref. Ying2018, , related to the wannierization of the Fermi surface bands. We have repeated all calculations and found that while the corrected results differ quantitatively, the qualitative characteristics and the conclusions drawn remain valid.
- (77) In the case of those pressures, where SnSe2 is in the metallic phase, has been approximated using the standard expression due to the fact that diverges for metals.
- (78) Due to the layered structure of the considered compounds, the dielectric function exhibits a slight anisotropy with respect to its in-plane and out-of-plane components, as shown in Supplemental Fig. S13 SM . The differences between calculations using the in-plane, the out-of-plane or an average of the two are negligible. For simplicity and consistency, all results presented in the paper where therefore obtained using the in-plane value of the dielectric function.
- (79) S. Pisana, M. Lazzeri, C. Casiraghi, K. S. Novoselov, A. K. Geim, A. C. Ferrari, and F. Mauri, “Breakdown of the adiabatic Born–Oppenheimer approximation in graphene”, Nat. Mater. 6, 198 (2007).
- (80) N. Caudal, A. M. Saitta, M. Lazzeri, and F. Mauri, “Kohn anomalies and nonadiabaticity in doped carbon nanotubes”, Phys. Rev. B 75, 115423 (2007).
- (81) M. Calandra, M. Lazzeri, and F. Mauri, “Anharmonic and nonadiabatic effects in MgB2: Implicationsfor the isotope effect and interpretation of Raman spectra”, Physica C 456, 38 (2007).
- (82) A. M. Saitta, M. Lazzeri, M. Calandra, and F. Mauri, “Giant Nonadiabatic Effects in Layer Metals: Raman Spectra of Intercalated Graphite Explained”, Phys. Rev. Lett. 100, 226401 (2008).
- (83) M. Calandra, G. Profeta, and F. Mauri, “Adiabatic and nonadiabatic phonon dispersion in a Wannier function approach”, Phys. Rev. B 82, 165111 (2010).
- (84) S. V. Bhatt, M. P. Deshpande, V. Sathe, S. H. Chaki, “Effect of pressure and temperature on Raman scattering and an anharmonicity study of tin dichalcogenide single crystals”, Solid State Commun. 201, 54 (2015).
- (85) A. N. Utyuzh, Y. A. Timofeev, and G. N. Stepanov, “Effect of pressure on raman spectra of SnS2 single crystals”, Phys. Solid State 52, 352 (2010).
- (86) P. B. Allen, “Neutron spectroscopy of superconductors”, Phys. Rev. B 6, 2577 (1972).
- (87) F. Caruso, M. Hoesch, P. Achatz, J. Serrano, M. Krisch, E. Bustarret, and F. Giustino, “Nonadiabatic Kohn Anomaly in Heavily Boron-Doped Diamond”, Phys. Rev. Lett. 119, 017001 (2017).
- (88) J.-M. Wagner and F. Bechstedt, “Pressure dependence of the dielectric and lattice-dynamical properties of GaN and A1N”, Phys. Rev. B 62, 4526 (2000).
- (89) A. R. Goñi, H. Siegle, K. Syassen, C. Thomsen, and J.-M. Wagner, “Effect of pressure on optical phonon modes and transverse effective charges in GaN and AlN”, Phys. Rev. B 64, 035205 (2001).
- (90) D. O’Hare, H. V. Wong, S. Hazell, J. W. Hodby, “Relatively isotropic superconductivity at 8.3 K in the Lamellar organometallic intercalate SnSeCo(-C5H5)”, Adv. Mater. 4, 658 (1992).
- (91) Z. Li, Y. Zhao, K. Mu, H. Shan, Y. Guo, J. Wu, Y. Su, Q. Wu, Z. Sun,A. Zhao, X. Cui, C. Wu, and Y. Xie, “Molecule-confined engineering toward superconductivity and ferromagnetism in two-dimensional superlattice”, J. Am. Chem. Soc. 139, 16398 (2017).
- (92) Y. Song, X. Liang, J. Guo, J. Deng, G. Gao, and X. Chen, “Superconductivity in Li-intercalated 1-SnSe2 driven by electric field gating”, Phys. Rev. Mater. 3, 054804 (2019).
- (93) J. Zeng, E. Liu, Y. Fu, Z. Chen, C. Pan, C. Wang, M. Wang, Y. Wang, K. Xu, S. Cai, X. Yan, Y. Wang, X. Liu, P. Wang, S. J. Liang, Y. Cui, H. Y. Hwang, H. Yuan, and F. Miao, “Gate-induced interfacial superconductivity in 1T-SnSe2”, Nano Lett. 18, 1410 (2018).
- (94) Y. M. Zhang, J. Q. Fan, W. L. Wang, D. Zhang, L. Wang, W. Li, K. He, C. L. Song, X. C. Ma, and Q. K. Xue, “Observation of interface superconductivity in a SnSe2/epitaxial graphene van der Waals heterostructure”, Phys. Rev. B 98, 220508(R) (2018).
- (95) E. R. Margine and F. Giustino, “Anisotropic Migdal-Eliashberg theory using Wannier functions”, Phys. Rev. B 87, 024505 (2013).
- (96) J. Towns, T. Cockerill, M. Dahan, I. Foster, K. Gaither, A. Grimshaw, V. Hazlewood, S. Lathrop, D. Lifka, G. D. Peterson, R. Roskies, J. R. Scott, and N. Wilkins-Diehr, “XSEDE: Accelerating scientific discovery”, Comput. Sci. Eng. 16, 62 (2014).