Evidence for
Direct and Indirect Gap in FeSi
from Electron Tunneling Spectroscopy
Abstract
We report electron tunneling spectroscopy studies on single crystalline FeSi sample performed for the case of homogeneous tunnel junction (TJ) contacts and for the case of counter electrode made from Pt-Rh alloy. Our results reveal that while the tunneling spectroscopy in the configuration with Pt-Rh tip is preferably sensitive to the d-partial density of states (DOS) and to the indirect energy gap, the FeSi-FeSi type of TJ yields the spectroscopic information on the c-partial DOS and on the direct gap in FeSi.
pacs:
71.27.+a, 71.28.+d, 75.30.Mb, 73.40.GkI INTRODUCTION
Cubic compound FeSi is well known by the unusual physical properties arising from its unconventional band structure. Despite the fact that FeSi is a d-transition metal compound, it shares certain characteristic features with rare earth hybridization gap semiconductors such as SmB6, YbB12 or Ce3Bi4Pt3, in which the hybridization of f- and conduction electrons is believed to take place. As a rule, FeSi is placed into the same special group of heavy electron systems with a narrow gap, named “Kondo insulators” or “Kondo semiconductors” Degiorgi (1999); Riseborough (2000).
According to transport and optical studies, at high temperatures FeSi can be characterized as a dirty metal Hunt et al. (1994); Schlesinger et al. (1993). As the temperature falls to around 300 K, it shows a metal to semiconductor crossover Sales et al. (1994) and behaves as a narrow gap semiconductor below 100 K Sales et al. (1994); Mihalik et al. (1996); Paschen et al. (1997). A value of the activation energy differs from about 50 meV to 110 meV upon the used experimental method Schlesinger et al. (1993); Sales et al. (1994); Mihalik et al. (1996); Paschen et al. (1997); Fäth et al. (1998); Aarts and Volodin (1995); Samuely et al. (1996). At the lowest temperatures FeSi has a metallic character Hunt et al. (1994); Paschen et al. (1997); Degiorgi et al. (1995).
Several different theoretical approaches have been suggested to explain striking properties and an origin of the energy gap in FeSi Mattheiss and Hamann (1992); Mandrus et al. (1995); Jarlborg (1995); Rozenberg et al. (1996). A simple physical picture assumes that instead of f-electrons in the rare earth semiconductors, a set of rather localized d-orbitals having a strong on-site repulsion, hybridizes in FeSi with a broad itinerant conduction band of noninteracting c-electrons forming in this way two bands separated by the gap Degiorgi (1999); Sales et al. (1994); Rozenberg et al. (1996). According to the theory of Rozenberg, Kotliar and Kajueter Rozenberg et al. (1996), the d-electron partial DOS shows opening of an indirect gap, , accompanied by the formation of strong and narrow quasiparticle bands visible as two symmetric peaks on either side of the Fermi level. A direct gap, , in c-electron partial DOS is merely a dip without peaks in the framework of this model Rozenberg et al. (1996). Moreover it is expected that Rozenberg et al. (1996). In accordance with number of published experimental results, it appears that the magnetic gap probed by magnetic susceptibility Schlesinger et al. (1993); Sales et al. (1994); Mihalik et al. (1996); Paschen et al. (1997) and optical reflectivity Mihalik et al. (1996); Paschen et al. (1997); Samuely et al. (1996) measurements is the larger direct gap, and that the transport gap reflected in resistivity Schlesinger et al. (1993); Sales et al. (1994); Mihalik et al. (1996); Paschen et al. (1997); Samuely et al. (1996), point contact spectroscopy Mihalik et al. (1996); Samuely et al. (1996) and tunneling spectroscopy Fäth et al. (1998) measurements is the smaller indirect gap. In this paper we show for the first time that tunneling spectroscopy is sensitive to both electron subsystems, and so that it can probe not only the indirect but also the direct gap in FeSi.
II EXPERIMENT
The samples used for experiments were pieces of the same FeSi single crystal grown from the melt by the “tri-arc” Czochralski technique, for which magnetic, transport, photo-emission, point-contact spectroscopy, as well as infrared studies were reported previously Mihalik et al. (1996); Samuely et al. (1996); Breuer et al. (1997). The ratio of low temperature to room temperature resistivity, is an indication for high quality sample Samuely et al. (1996). In addition, the electron probe microanalysis did not reveal a presence of any second phase Mihalik et al. (1996). As reported before, the value of the transport gap obtained from resistivity data is 56 meV, while the magnetic susceptibility studies indicate the gap of 95 meV or 103 meV, depending on the fitting method used Mihalik et al. (1996).
The tunneling measurements were performed by the scanning tunneling spectroscopy approach using mechanically controlled TJs in two different configurations: (i) with Pt-Rh tip as a counter electrode and, for the first time as we know, (ii) with the tip made from a piece of the same FeSi single crystal as the studied sample. The Pt-Rh tip was prepared from commercially available Pt0.9Rh0.1 wire. Differential conductance, , was numerically calculated from the measured current-voltage characteristics. It should be mentioned that due to the formation of an oxide layer on the FeSi surface, the TJ electrodes were in mechanical contact, separated just by this native insulating surface layer.

III RESULTS AND DISCUSSION
Typical differential conductance curves taken with Pt-Rh tip at 4.2 K and 300 K are shown in Fig. 1. As temperature was lowered from 300 K to 4.2 K, in the region of 300 mV the differential conductance increased except the vicinity of the zero-bias, where a strong and sharp dip was formed, with the minimum of (almost) the same value as the zero bias conductance at 300 K. (Here should be noted that there is a relatively strong dependence of the zero bias conductance on the width of the interval used for calculation of numerical derivation. We used the widest possible interval still not increasing the zero bias conductance; this is the reason for a bigger error of curve at 4.2 K in Fig. 1.) Exemplary spectra of the FeSi-FeSi configuration are depicted in Fig. 2. The conductances observed at 300 K seem to be very similar to those measured out with Pt-Rh tip. On the other hand, the spectra taken at 4.2 K exhibit qualitatively different features, as they show a visible decrease of the differential conductance under the values of the 300 K curve in the whole energy interval corresponding to 300 mV. The zero-bias conductance shows the greatest decrease, but at 4.2 K it remains still finite.
According to Hammers Hammers (1989), the differential conductance in the tip-sample configuration can be expressed by
| (1) |
where and are the state densities of the sample and the tip, respectively, at location and at the energy , measured with respect to their individual Fermi levels; is the tunneling transmission probability for electrons with energy at applied bias voltage . The upper and the lower signs in equation (1) correspond to a positive and a negative sample bias, respectively Hammers (1989). At any fixed location, increases monotonically with and contributes by a smoothly varying “background”, on which the spectroscopic information is superimposed Hammers (1989). Because of the smooth and monotonic increase, a structure in as a function of usually can be assigned to changes in the state density via the first term of equation (1), thus permitting the DOS to be determined as a function of energy at any particular location on the surface Hammers (1989). Analogously, if DOS changes due to a variance of temperature, the change in DOS at constant energy is correspondingly detected as the change of at the voltage . The change of the DOS due to the temperature variance from to can be then inferred from the difference . (Of course, in such a case the effects due to temperature smoothing are neglected. Because of the energy scale, which is a few thousand Kelvins in our case, such an approximation seems to be acceptable.)
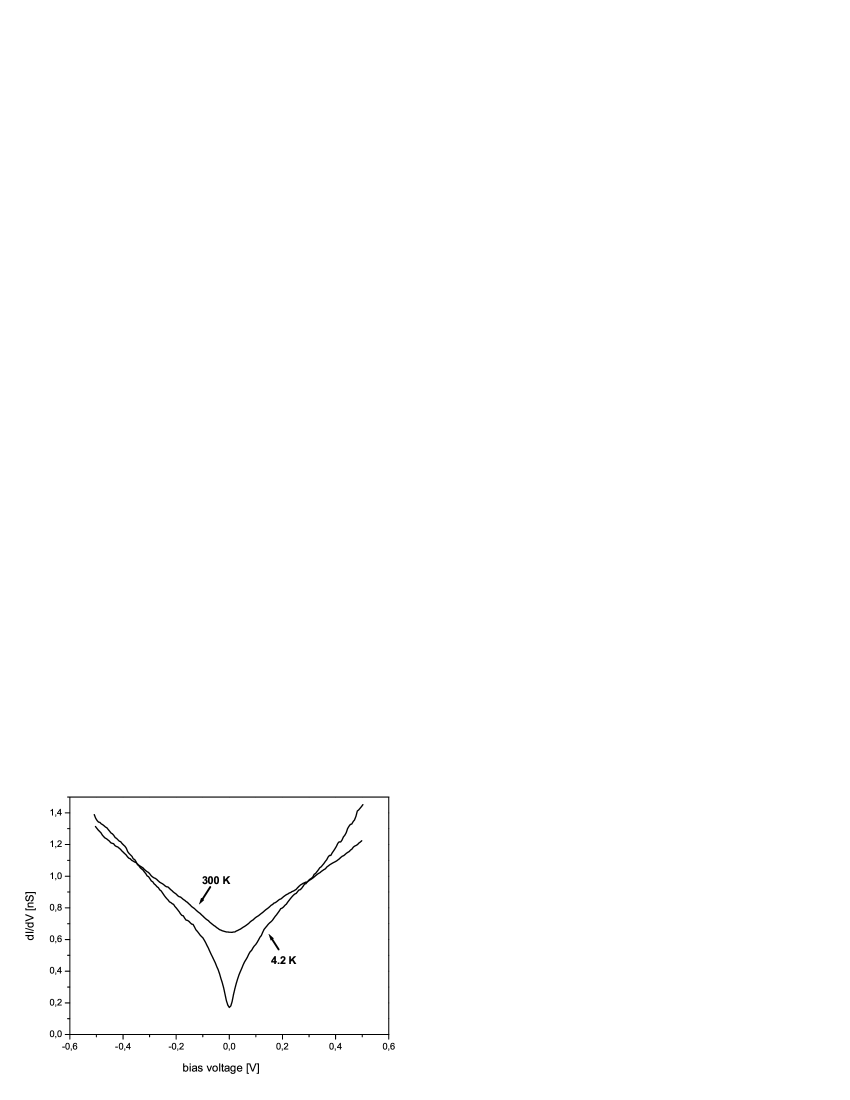
Fig. 3 shows the difference between the curves taken at 300 K and 4.2 K for both TJ configurations. The curve at the top, corresponding to the contacts with Pt-Rh tip, shows two almost symmetrical local maxima at both sides of the Fermi level with estimated peak-to-peak distance of about 110 meV, separated by the dip with the minimum of practically the zero-value at the zero-bias. Because of the temperature independent DOS of Pt-Rh tip, the observed influence of the temperature on the tunnel spectra should reflect changes in the DOS of FeSi only. In spite of the fact that the obtained curve can not be without a renormalization quantitatively related to the DOS, it clearly indicates a formation of two symmetrically placed peaks at gap edges. (According to the finite values of the differential conductance in all the studied cases, it would be probably more appropriate to speak about the direct and the indirect “pseudogap” in FeSi. Nevertheless, for the purposes of this paper we will use the term “gap”.) The difference curve for FeSi-FeSi configuration at the bottom of Fig. 3, is negative in the whole region of 300 mV with the strong dip centered at the zero bias. Such a behavior can be attributed to a decrease of the quasiparticle DOS around the Fermi level by falling the temperature from the room one to 4.2 K. As follows from the subsequent discussion, we have associated the curve at the top and at the bottom of Fig. 3 with the temperature change of the d- and the c-partial DOS, respectively.
As emphasized by Tromp Tromp (1989), because of the determination of the tunneling current by the tunneling transmission probability and by the DOS of both electrodes, in addition to a finite DOS there must be a significant overlap between the corresponding sample and tip wave functions Tromp (1989). If the sample has a large DOS, but these states do not overlap with the tip, they are inaccessible in the tunneling experiment Tromp (1989).

In the case of the heterogeneous TJs with the metallic Pt-Rh tip, a sufficient overlap of the rather spatially extended wave function of conduction electrons of the tip with that of the correlated c- and d-electrons in FeSi can be expected. Because of much larger and peaked d-partial DOS a major tunnel current will originate from d-electrons. In fact, the shape of the curve at the top of Fig. 3 strongly resembles the experimental results of other authors 111see Fig. 3 in Fäth et al. (1998) and the situation in d-partial DOS proposed by the theory of Rozenberg, Kotliar and Kajueter Rozenberg et al. (1996). Therefore, in agreement with Fäth and coworkers Fäth et al. (1998), we conclude that the tunneling spectroscopy measurements on the tunnel junctions with the counter electrode from the metal without electron correlation effects probe preferably the much larger and peaked d-partial DOS in FeSi.
In replacing the Pt-Rh tip by FeSi tip, the relatively slowly decaying wave function of conduction electrons of Pt-Rh tip is then replaced by the wave functions of correlated c- and d-electrons of FeSi. Due to the localized nature of d-electrons their wave function is less spatially extended than one of c-electrons, so it is reasonable to expect that an overlap between the c- states will be dominating here. In spite of the high density of d- states, the tunneling process in FeSi-FeSi type of TJ seems to be predominantly governed by the lower-density c-electrons, as the effect of the overlap between the c- states seems to be superior to the effect of high density of d- states. In addition to this, the shape of the curve at the bottom of Fig. 3 resembles the theoretically predicted change of the c-partial DOS due to temperature variation in the region of the direct gap Rozenberg et al. (1996). Based on the given arguments we conclude that the FeSi-FeSi tunneling configuration yields preferably the spectroscopic information on c-partial DOS.
According to the previous discussion, the dip observed in TJs with Pt-Rh tip is associated with the indirect gap. Although the shape of the dip is modified due to Shottky barrier effect Fäth et al. (1998), its width should still correlate with the width of the indirect gap. As is associated with transport measurements Paschen et al. (1997); Rozenberg et al. (1996), it is to be expected that the width of this dip will be comparable with the transport gap value previously derived for the studied sample from the resistivity data Mihalik et al. (1996). In Fig. 3, where is correspondingly indicated, a definite correlation between and the width of the dip can be seen. On the other hand, the magnetic gap is related to the direct gap Paschen et al. (1997); Rozenberg et al. (1996). The width of the magnetic gap of our sample 95 (or 103 meV, depending on the fitting procedure used) Mihalik et al. (1996) is larger than in accordance with the theoretical predictions Rozenberg et al. (1996). The comparison of with the width of the dip visible in the curve at the bottom of Fig. 3 requires taking into account that in FeSi-FeSi type of TJ there are gap structures at both sides of the TJ. So that (analogously like it is in superconductor-insulator-superconductor TJs), the decrease of the differential conductance should develop in the energy interval of . Doubled values of are indicated in Fig. 3. Although the determination of the dip width is not straightforward, it can be seen that the indicated values of lie in the crossover between the dip region and the background region, and so, it can be said that the width of the dip region correlates with the . The observed good correspondence between our tunneling data and the earlier results of the transport and magnetic studies, provides a further support for the interpretation of the tunneling data given above.
IV CONCLUSIONS
Our tunneling spectroscopy studies of FeSi have revealed that two types of electron subsystems and two different energy gaps are present in FeSi. Depending on the used type of the counter electrode, the lowering of temperature from 300 K to 4.2 K causes either the formation of the peaks in the partial DOS, which we associate with the properties of d-electrons and with the indirect gap; or decrease of the partial DOS at and in the vicinity of the Fermi level, what we assign to the direct gap formation in the c-partial DOS. The obtained results strongly support the theoretical model of Rozenberg, Kotliar and Kajueter Rozenberg et al. (1996) and correlate well with the independent evaluation of the transport and the magnetic gap of our FeSi sample. Moreover, our work shows that the type of spectroscopic information obtained by tunneling spectroscopy can be “selected” by the type of counter electrode used. For the more detailed information on the role of the counter electrode material and on the properties of correlated electron subsystems in FeSi, additional experiments are going to be done at various temperatures, utilizing several types of counter electrode materials.
ACKNOWLEDGEMENTS
This work was supported by the VEGA Grant 2/4050/04, the Project APVT-51-031704, and the Centre of Low Temperature Physics operated as the Centre of Excellence of the Slovak Academy of Sciences under Contract No. I/2/2003. The low-temperature STS-head and STS control electronics were provided by Laboratories of Applied Research 222Laboratories of Applied Research, Atletická 16, 040 01 Košice, Slovakia.
References
- Degiorgi (1999) L. Degiorgi, Reviews of Modern Physics 71, 687 (1999).
- Riseborough (2000) P. S. Riseborough, Advances in Physics 49, 257 (2000).
- Hunt et al. (1994) M. B. Hunt, M. A. Chernikov, E. Felder, H. R. Ott, Z. Fisk, and P. Canfield, Phys. Rev. B 50, 14933 (1994).
- Schlesinger et al. (1993) Z. Schlesinger, Z. Fisk, H.-T. Zhang, M. B. Maple, J. F. DiTusa, and G. Aeppli, Phys. Rev. Lett. 71, 1748 (1993).
- Sales et al. (1994) B. C. Sales, E. C. Jones, B. C. Chakoumakos, J. A. Fernandez-Baca, H. E. Harmon, J. W. Sharp, and E. H. Volckmann, Phys. Rev. B 50, 8207 (1994).
- Mihalik et al. (1996) M. Mihalik, M. Timko, P. Samuely, N. Tomašovičová-Hudáková, P. Szabó, and A. A. Menovsky, J. Magnetism and Magn. Mat. 157/158, 637 (1996).
- Paschen et al. (1997) S. Paschen, E. Felder, M. A. Chernikov, L. Degiorgi, H. Schwer, H. R. Ott, D. P. Young, J. L. Sarrao, and Z. Fisk, Phys. Rev. B 56, 12916 (1997).
- Fäth et al. (1998) M. Fäth, J. Aarts, A. A. Menovsky, G. J. Nieuwenhuys, and J. A. Mydosh, Phys. Rev. B 58, 15483 (1998).
- Aarts and Volodin (1995) J. Aarts and A. P. Volodin, Physica B 206, 43 (1995).
- Samuely et al. (1996) P. Samuely, P. Szabó, M. Mihalik, N. Hudáková, and A. A. Menovsky, Physica B 218, 185 (1996).
- Degiorgi et al. (1995) L. Degiorgi, M. Hunt, and H. R. Ott, Physica B 206-207, 810 (1995).
- Mattheiss and Hamann (1992) L. F. Mattheiss and D. R. Hamann, Phys. Rev. B 47, 13114 (1992).
- Mandrus et al. (1995) D. Mandrus, J. L. Sarrao, A. Migliori, J. D. Thompson, and Z. Fisk, Phys. Rev. B 51, 4763 (1995).
- Jarlborg (1995) T. Jarlborg, Phys. Rev. B 51, 11106 (1995).
- Rozenberg et al. (1996) M. J. Rozenberg, G. Kotliar, and H. Kajueter, Phys. Rev. B 54, 8452 (1996).
- Breuer et al. (1997) K. Breuer, S. Messerli, D. Purdie, M. Garnier, M. Hengsberger, Y. Baer, and M. Mihalik, Phys. Rev. B 56, R7061 (1997).
- Hammers (1989) R. J. Hammers, Annu. Rev. Phys. Chem. 40, 531 (1989).
- Tromp (1989) R. M. Tromp, J. Phys.: Condens. Matter. 1, 10211 (1989).