Semantics-Guided Representation Learning
with Applications to Visual Synthesis
Abstract
Learning interpretable and interpolatable latent representations has been an emerging research direction, allowing researchers to understand and utilize the derived latent space for further applications such as visual synthesis or recognition. While most existing approaches derive an interpolatable latent space and induces smooth transition in image appearance, it is still not clear how to observe desirable representations which would contain semantic information of interest. In this paper, we aim to learn meaningful representations and simultaneously perform semantic-oriented and visually-smooth interpolation. To this end, we propose an angular triplet-neighbor loss (ATNL) that enables learning a latent representation whose distribution matches the semantic information of interest. With the latent space guided by ATNL, we further utilize spherical semantic interpolation for generating semantic warping of images, allowing synthesis of desirable visual data. Experiments on MNIST and CMU Multi-PIE datasets qualitatively and quantitatively verify the effectiveness of our method.
Index Terms:
Representation learning, Semantic interpolationI Introduction
In the field of machine learning and computer vision, learning interpretable representations has been active research topic [19, 8, 2, 9], benefiting a range of applications such as visual classification, retrieval and synthesis. Most existing approaches approach such tasks by deriving interpolatable latent spaces, resulting in smooth transition in visual appearances. However, it is still not clear how to observe desirable representations which would contain semantic information of interest. In this paper, we address a novel task of learning semantically interpretable yet interpolatable representations with applications to visual analysis.
Approaches for representation learning can be divided into supervised and unsupervised settings. For supervised learning, take face recognition for example, one needs to extract discriminative representations from input images of different identities. Previous works like [19, 22, 16, 21, 3, 23] use various constraints or regularizers for making features of the same person to be simialar, while those of different people to be distant from each other. As for retrieval tasks like [8, 14], one needs to derive effective representations, so that intra and inter-category properties can be observed.
On the other hand, to address unsupervised representation learning, a number of generative models have been proposed. For example, autoencoder (AE)-based models like [20, 11] are presented to ensure the derived latent features to sufficiently represent data information. Goodfellow et al. [5] propose Generative Adversarial Networks (GANs), which further exhibits promising ability in image generation. To extend GANs for representation disentanglement, recent works like [2, 15, 10, 13] decompose the latent representation into distinct parts, with the goal of distilling the attributes of interest (e.g., pose, expression, etc.).
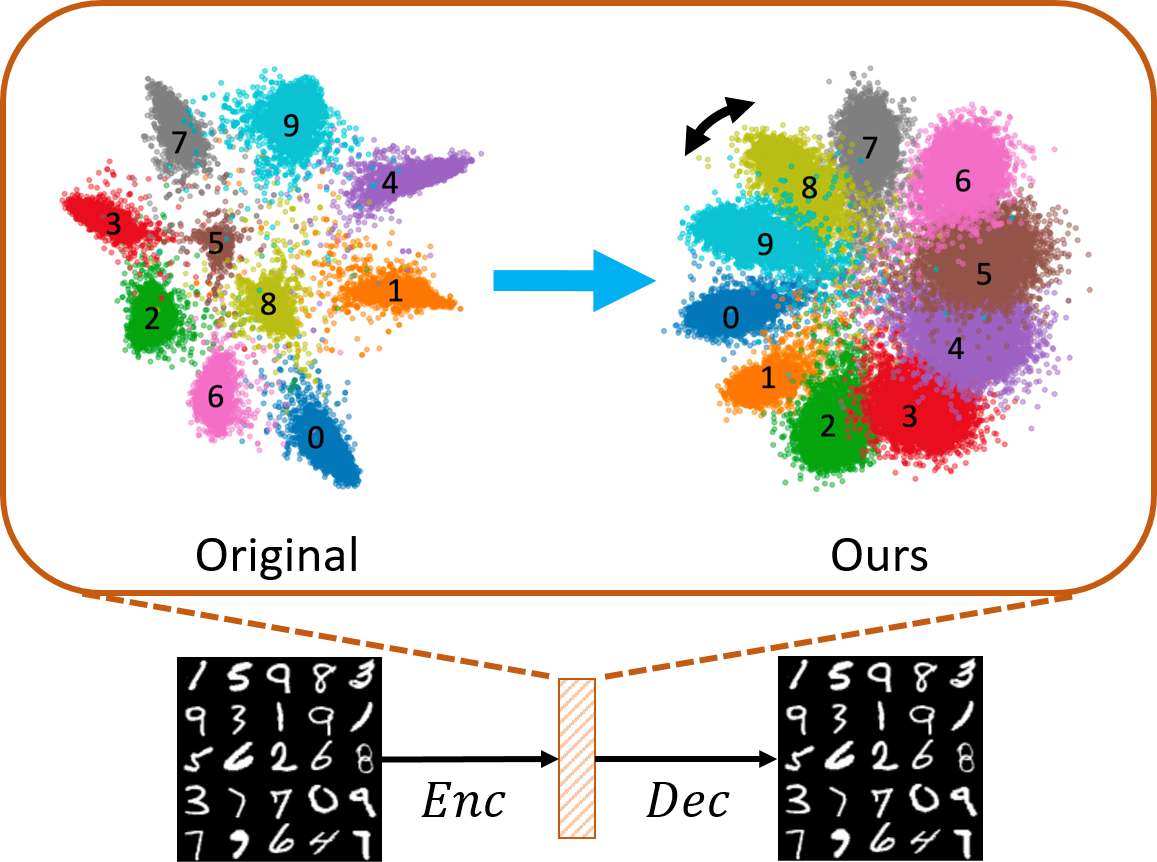
However, it is worth noting that existing representation learning works generally focus on learning representation for either classification or synthesis guarantees. It is not clear how to observe desirable representations which would contain proper semantic information. Berthelot et al. [1] leverages regularization strategy with the specific goal of encouraging improved interpolation ability, showing solid ability in performing interpolation for producing meaningful representation. However, to the best of our knowledge, most existing works are not able to generate latent representations which semantically match the visual data of interest via interpolation. Take MNIST [12] in Figure 1 for example, when interpolating autoencoder-based latent features of images between digits 0 and 2, instead of semantic warping of images following the numerical order (i.e., digits ), the output images would visually and gradually warp from digits 0 to 6, and then finally to 2.
To address the above novel yet challenging problem, we propose a novel Angular Triplet-Neighbor Loss (ATNL) for deriving latent representations whose distribution would match the semantic information. As depicted in Figure 1, we aim to learn a latent representation for visual data with distribution semantically fitting the associated learning task. Inspired by FaceNet [19] and SphereFace [16], we propose unique semantics-guided loss with novel spherical semantic interpolation techniques, which allows our model to generate semantically desirable image outputs. In addition to standard quantitative and qualitative evaluation on our derive latent representations, we uniquely apply our model as a data hallucination technique, which synthesizes visual data of particular categeries and address few-shot learning tasks.
We now highlight the contributions of our work as follows:
-
•
We are among the first to explore desirable semantic distribution of latent representations, resulting in interpretable and interpolatable representations.
-
•
We propose an Angular Triplet-Neighbor Loss (ATNL), followed by spherical semantic interpolation, which utilizes task-oriented semantic information for representation learning.
-
•
In addition to qualitative and quantitative evaluation on our learned representation, we further extend our learning strategy as a data hallucination technique, which is successfully applied for few-shot image classification.
II Related Work
II-A Unsupervised Representation Learning
When ground truth labels are not observed, one needs to perform unsupervised learning to derive deep feature representations. With data recovery guarantees, autoencoder (AE) and variational autorencoder (VAE) [11] have been proposed. While the generative model of Generative Adversarial Networks (GANs) [5] is able to produce realistic visual data, it lacks the ability to extract particular features corresponding to the attributes of interest. To allow disentanglement of such features, info-GAN [2] maximizes mutual information between latent variables and data variation. Bidirectional GAN (BiGAN) [4] achieves representation learning via incorporating an encoder to a vanilla GAN. Based on the architectures of VAE and GAN, recent models of DRIT [13] and MUNIT [10] extend UNIT [15] for translating images across domains, resulting domain-invariant features as the derived latent representation. Berthelot et al. [1] further extend AE with adversarial regularizer, and propose Adversarially Constrained Autoencoder Interpolation (ACAI) which encourage the images recovered by latent representation interpolation to be realistic.
II-B Supervised Representation Learning
To realized supervised representation learning, contrastive loss [7] and triplet loss [19] have been applied to increase Euclidean distance between different category for discriminative feature embedding. Wenl et al. [22] propose the center loss to better cluster deep features of each identity, aiming at reducing intra-class variance. Liu et al. [17] propose a large margin softmax (L-Softmax) by adding angular constraints to each identity to improve feature discrimination. Angular softmax (A-Softmax) [16] further improves L-Softmax by normalizing the weights of last fully connected layer for improved face recognition. Other loss functions [8, 23, 21, 3, 14] extended from the above losses have demonstrated promising performances on the associated learning tasks. Nevertheless, even under supervised learning settings, existing works on representation learning cannot easily generate or manipulate latent representations which semantically match the images of interest via interpolation (see 1 for example).
III Semantics-Guided Representation Learning
III-A VAE for Representation Learning
The use of variational autoencoders (VAE) for image recovery (i.e., output ) while resulting in latent features for describing the input images. Its an encoder to map an input image into a latent subspace with latent code , whose distribution fits the Gaussian distribution . On the other hand, the decoder in VAE is designed to reconstruct the input image from . The L1 loss is typically applied on the output image as the reconstruction loss of VAE, which measures the difference between and :
| (1) |
And, the KL divergence is calculated to fit the observed latent representation distribution to , i.e.,
| (2) |
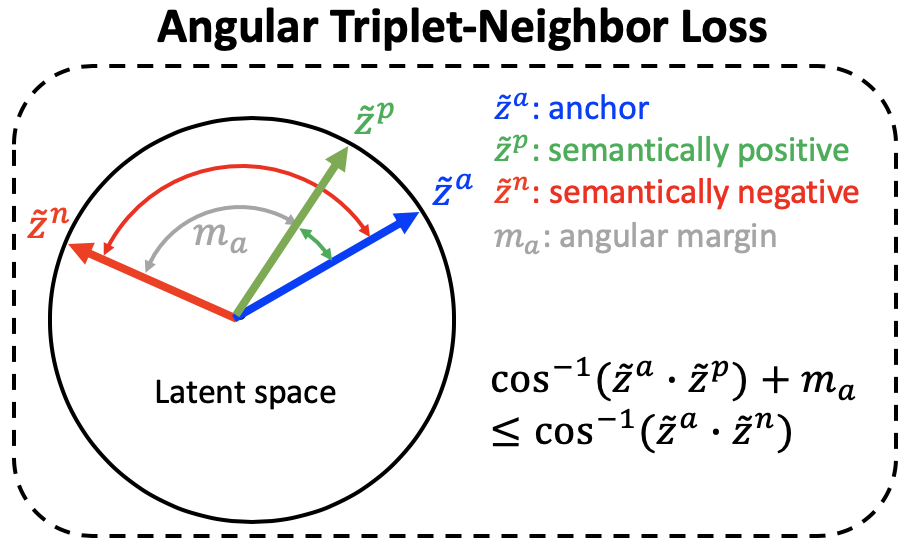
Since VAE focuses on deriving continuous latent subspaces for representing image features with recovery guarantees, it does not necessarily describe such features based on their semantic information. As illustrated in Figure 2 and detailed later, we introduce an novel Angular Triplet-Neighbor Loss (ATNL) at the latent representation of VAE. This not only fits data latent distribution as the aforementioned Gaussian one, it additionally allows the resulting latent features to exhibit their semantic information of interest.
III-B Angular Triplet-Neighbor Loss (ATNL)
To overcome the aforementioned limitations in current VAE-based deep learning models for image generation and understanding, we introduce a novel Angular Triplet-Neighbor Loss (ATNL) to existing VAE frameworks. Inspired by FaceNet [19], we extend the original triplet loss to better describe and match task-specific semantic information in derived latent space. To start, we have the th input image as the anchor (with latent code ). Instead of simply viewing image data of the same and different categories as positive and negative samples as FaceNet does, we choose to as the semantically-positive samples, whose categories are the same or semantically similar to that of . As for the samples of the remaining categories, they will be simply viewed as the negative ones . The above semantic relationship between samples would be determined based on the task of interest. Take handwritten digit classification for example, given an anchor sample of digit 5, its semantically-positive samples would be those of digits 4 and 6. And, the samples in the remaining categories (i.e., digits other than 4, 5, and 6) would be semantically-negative ones .
With semantics-dependent positive and negative samples determined, we advance the angular-based metrics to calculate the ATNL. As depicted in Figure 2, we normalize the latent code/features of input images, map them onto a unit hypersphere (i.e., ), and calculate the following equation for satisfying ATNL:
| (3) |
where and () denote normalized features and the associate inner product operation, respectively. We have as the angular margin, which is a data-dependent hyperparameter to select.
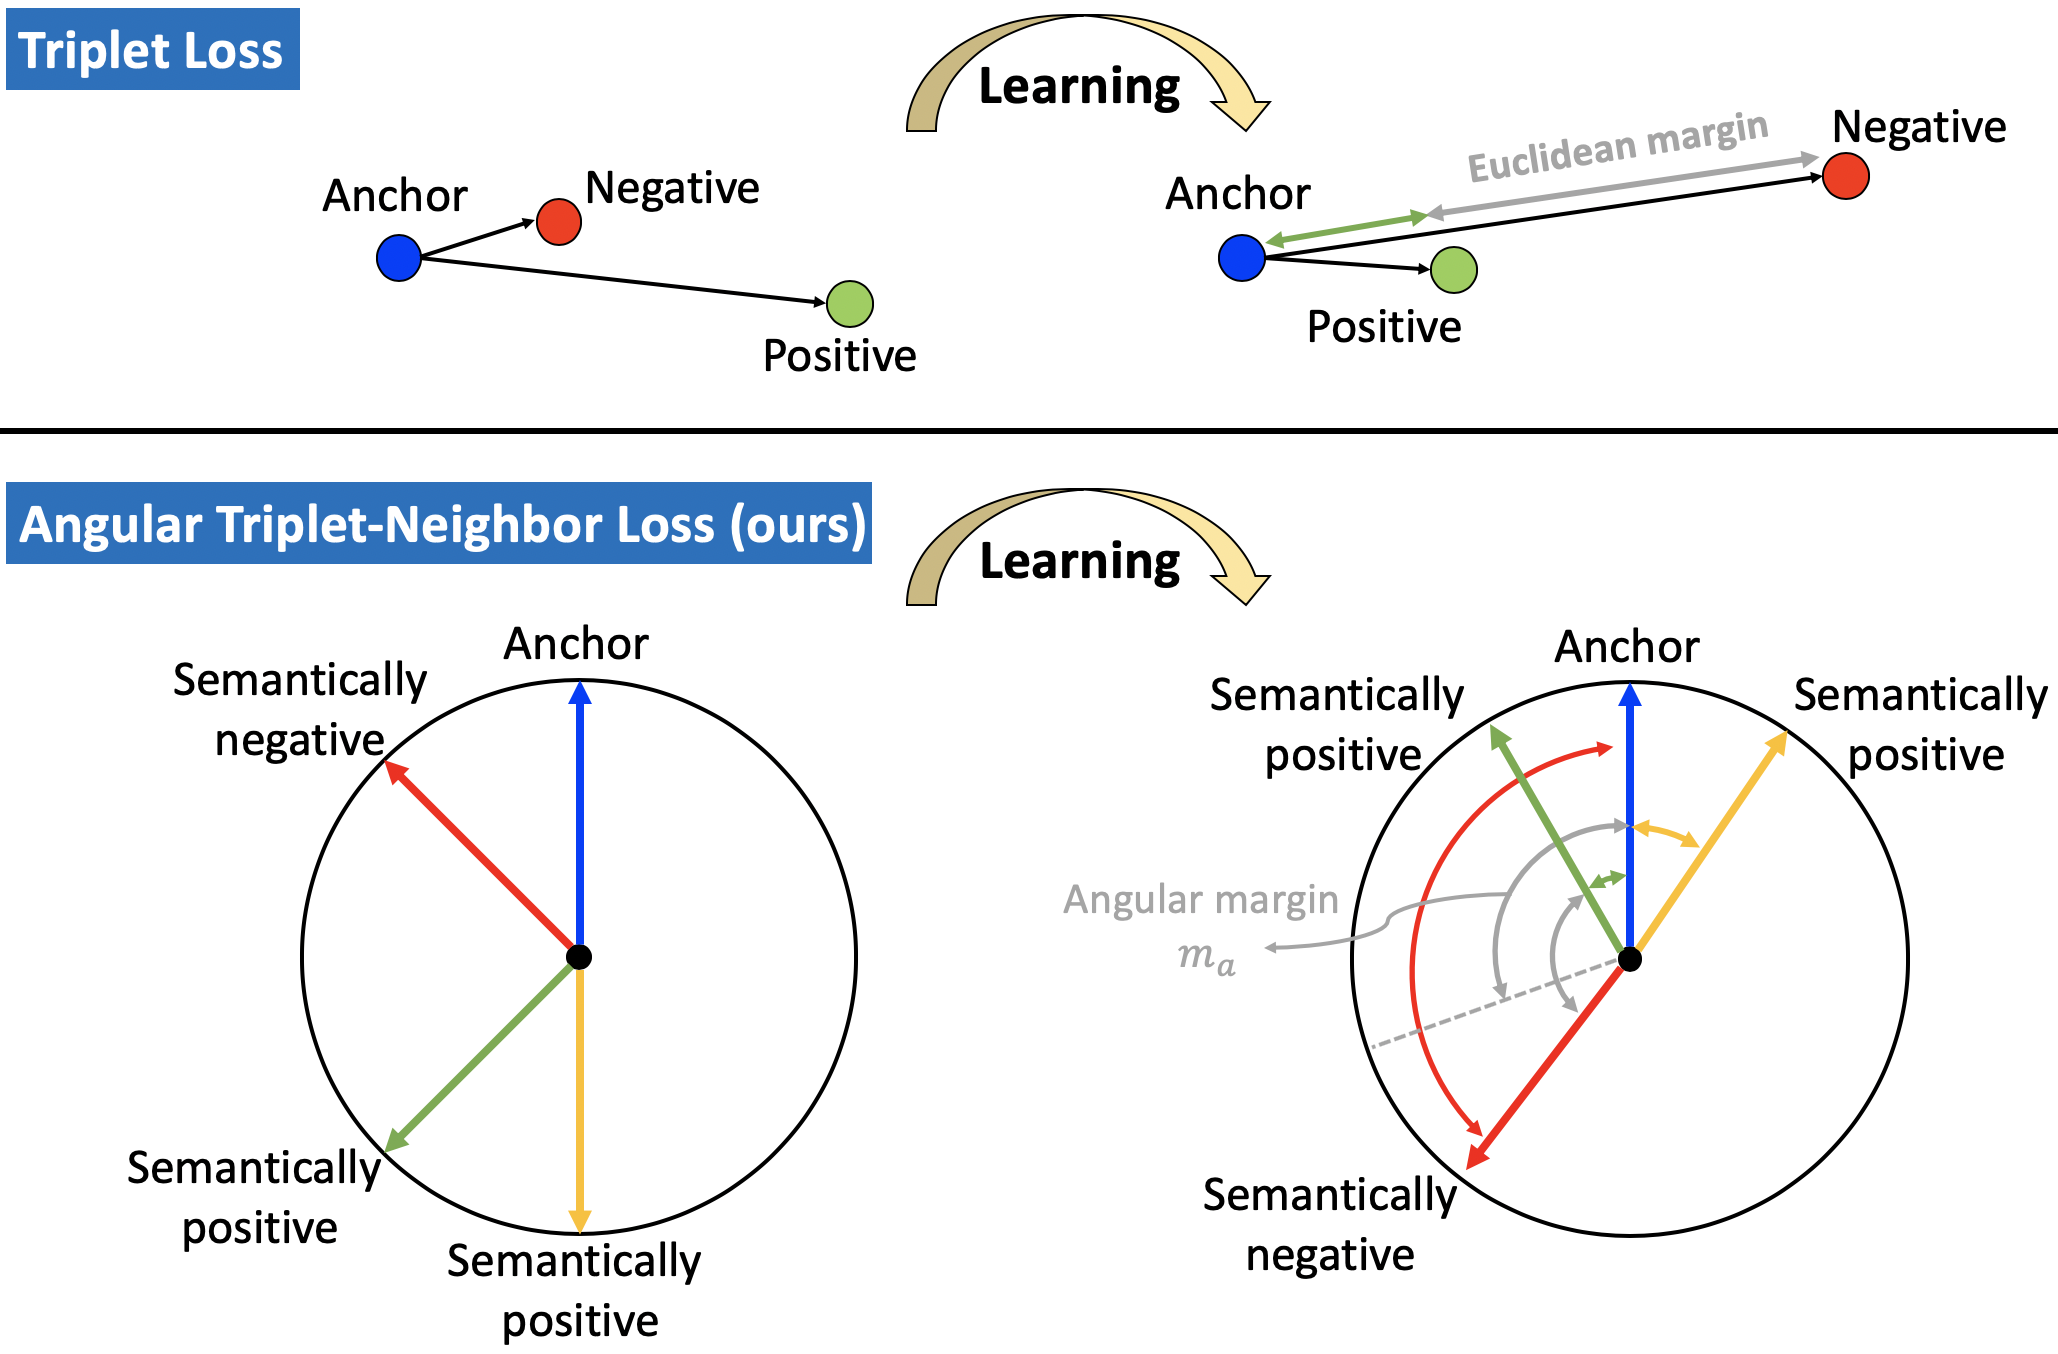
It is worth noting that, the use of angular-based metrics requires one to normalize the data onto a unit hypersphere. As noted by ATCL [14] and SphereFace [16], this provides geometric interpretation for the projected data. More precisely, the separation (i.e., margin ) between data would be in a fixed range of [0, ]. This is how we adopt angular-based triplet loss instead of traditional triplet loss in our work.
Figure 3 illustrates the difference between the standard triplet loss and our ATNL. Later we will explain the unit-sphere normalization is necessary in our model, which makes semantics-guided image generation possible.
To learn the encoder for VAEs, we thus calculate ATNL at the latent space by:
| (4) |
Similar to the practical use of triplet loss during training, generating all semantically positive/negative triplet combinations would not be computationally feasible. Alternatively, one possible solution is to select hard triplets, which better contribute to the learning of our models. Thus, we follow [19] and utilize BatchSampler for online triplet selection, which has been shown to improve learning effectiveness and efficiency.
The total loss of our framework is as follows:
| (5) |
where , and are hyperparameters of , and , respectively.
III-C Semantics-Guided Image Generation
As described in [1], image generation and manipulation can be realized by interpolating latent features. In general, linear interpolation is the standard technique to apply, which is easily implemented by:
| (6) |
where and are the two latent representations of interest, and the weight is a controllable parameter, range from 0 to 1. With , the output image can be produced by .
However, image generation via the above linear interpolation simply outputs images with intermediate visual appearance recovered by and between and . Take the earlier example of handwritten digit recognition for example, There is no guarantee that images of digit 5 can be interpolated and manipulated by the latent features of digits 4 and 6.
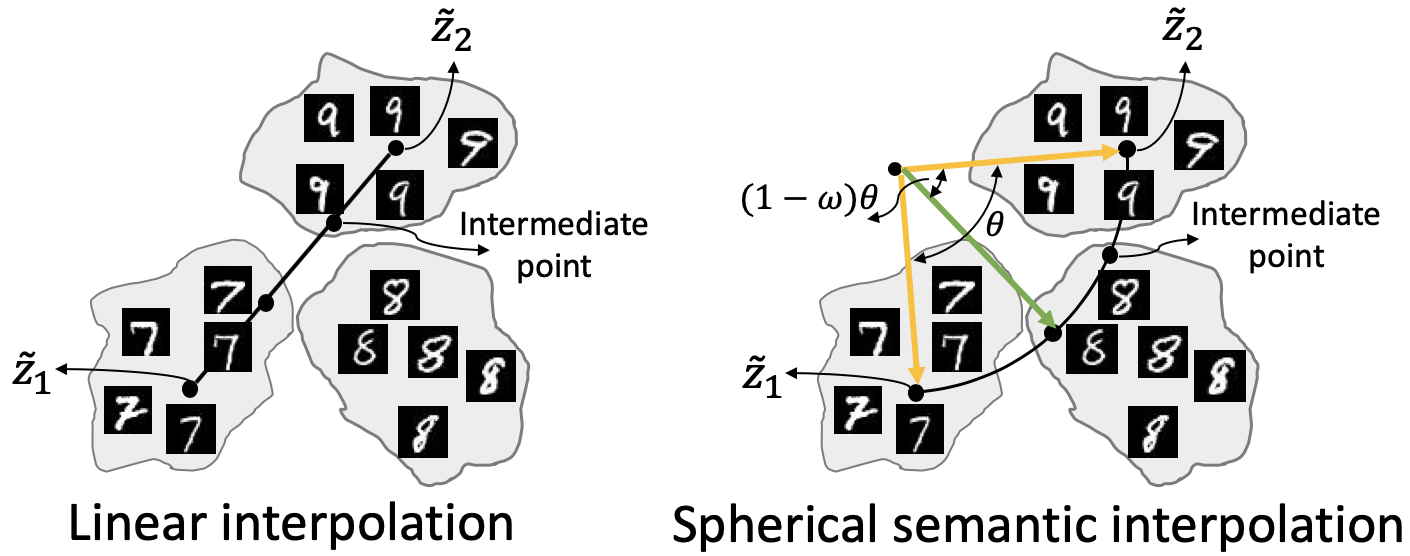
With our ATNL and data normalized onto a unit hypersphere, we perform semantics-guided image generation by advancing spherical semantic interpolation, which is performed as follows:
| (7) |
As illustrated shown in Figure 4, this operation allows one to generate semantics-guided images from two images of interest, which cannot be easily achieved by standard image recovery via linear interpolation.
IV Experiments
IV-A Datasets
We first consider MNIST [12], which consists of 60,000/10,000 training/testing handwritten digit images of 10 classes. All images are resized from 2828 to 3232 in our experiments. We also use CMU Multi-PIE [6] for our experiments face images. CMU Multi-PIE contains face images with viewpoint, illumination and expression variations. We only use a subset of CMU Multi-PIE with viewpoint variants (24,402 images with 7 viewpoints from -90 degrees to 90 degrees per 30 degrees). All images are resized from 128128 to 6464 in our experiments.
IV-B Implementation Details
We implemented our model via PyTorch [18]. The backbone employs VAE [11] and the encoder consists of 3 convolution layers with filter size 44 followed by three fully connected layers. The decoder consists of 3 fully connected layers followed by 3 convolution layers. For hyper-parameters, we set , , . For MNIST, we set , and we treat the contiguous numbers as semantically positive neighbors while others as the negatives. We also treat digit 0 and digit 9 as neighbors. For Multi-PIE, . We treat contiguous pose of degrees as semantically positive neighbors. It takes 3 hours to train our model for 30 epochs with batch size 256 on a single Nvidia GeForce GTX 1080Ti.
IV-C Visualization via t-SNE projection
MNIST.
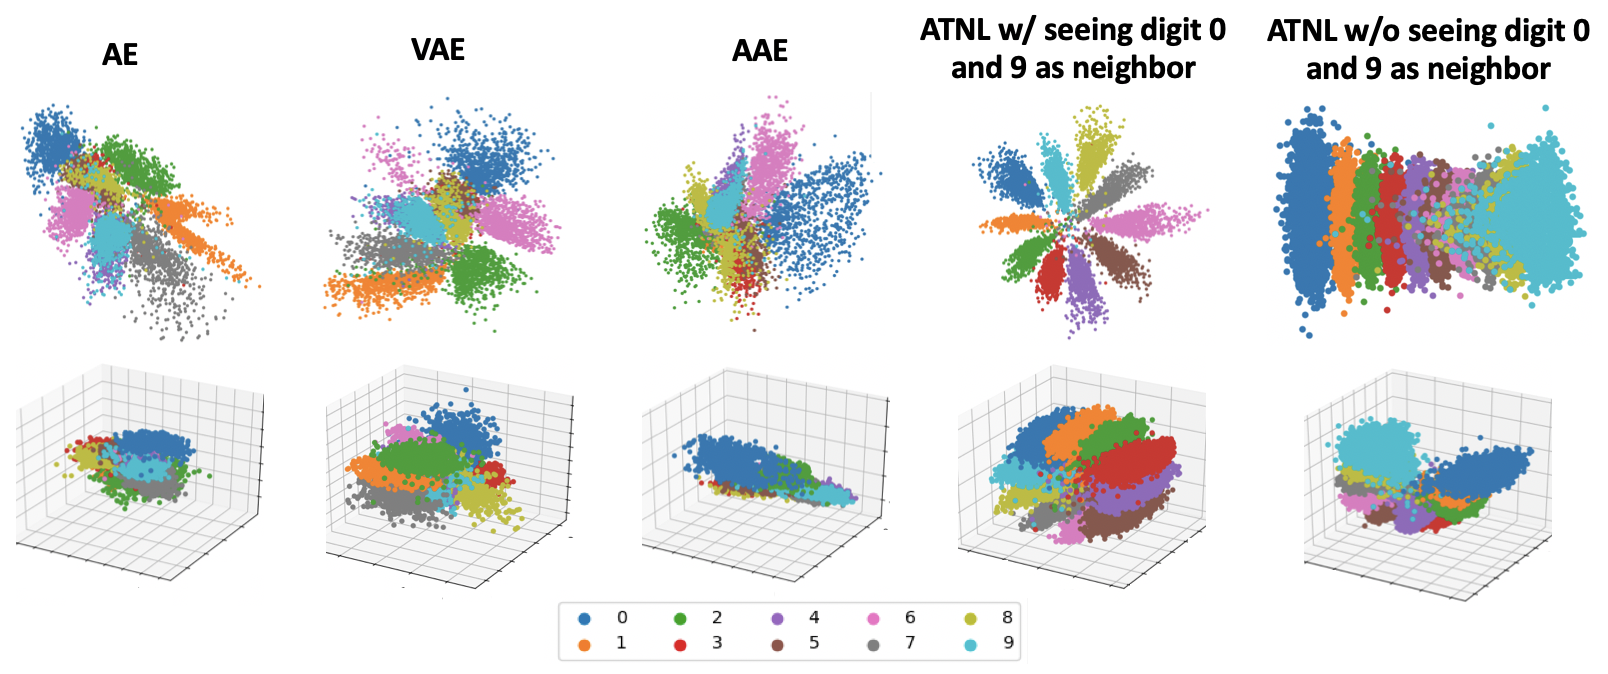
We now visualize latent representation derived by AE, VAE, AAE, and VAE with our proposed ATNL on MNIST in Figure 5. We provide the results of both 2D t-SNE and 3D t-SNE results on the latent representation of the above models. It is important to note that, the representation produced by our ATNL (the last column) is properly clustered with respect to class of digits with task-oriented semantic information, showing that the derived latent representation by our ATNL has preserved the most perceivable semantic information. Once the ATNL loss is excluded (standard VAE), the resulted representation exhibits several overlapping parts shown in the second column.
CMU Multi-PIE.
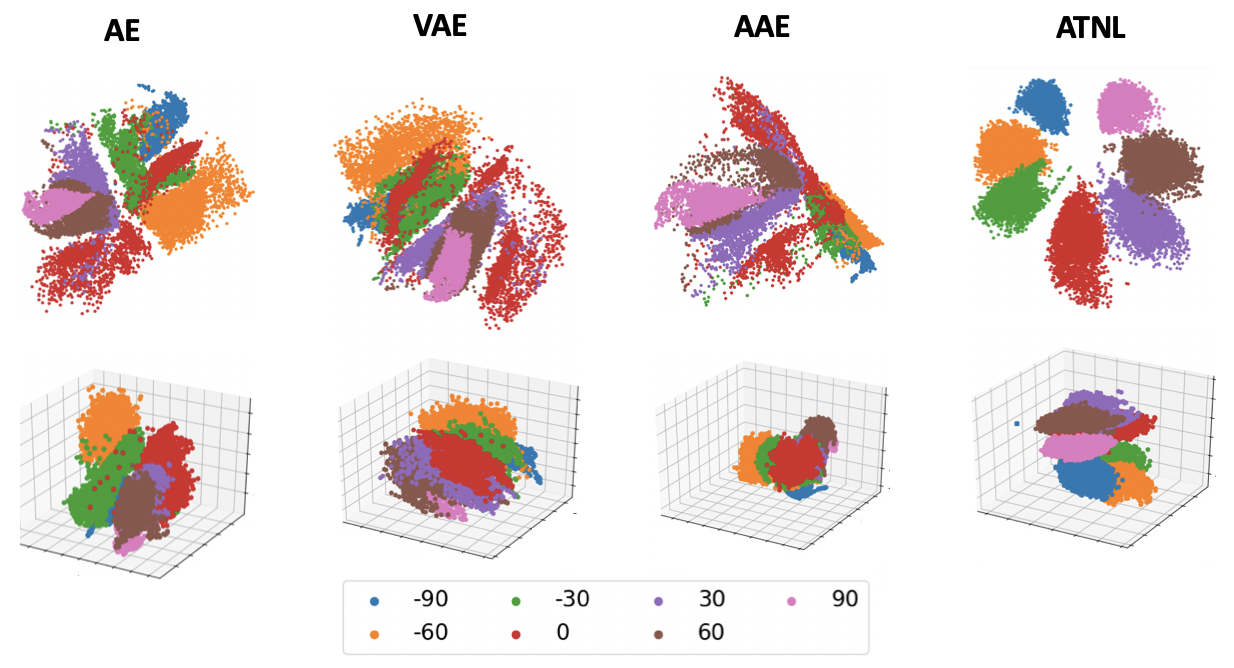
We further present qualitative results on the latent representations derived by AE, VAE, AAE and VAE with our proposed ATNL on CMU Multi-PIE in Figure 6. We provide the results of 2D t-SNE and 3D t-SNE results on the latent representation of the above models. Images belonging to same category were visualized in specific color. It is worth repeating that, the representation produced by our ATNL (the last column) on the CMU Multi-PIE is also properly clustered with respect to class of digits, demonstrating sufficient task-oriented semantic information.
IV-D Linear vs. Spherical Semantic Interpolation
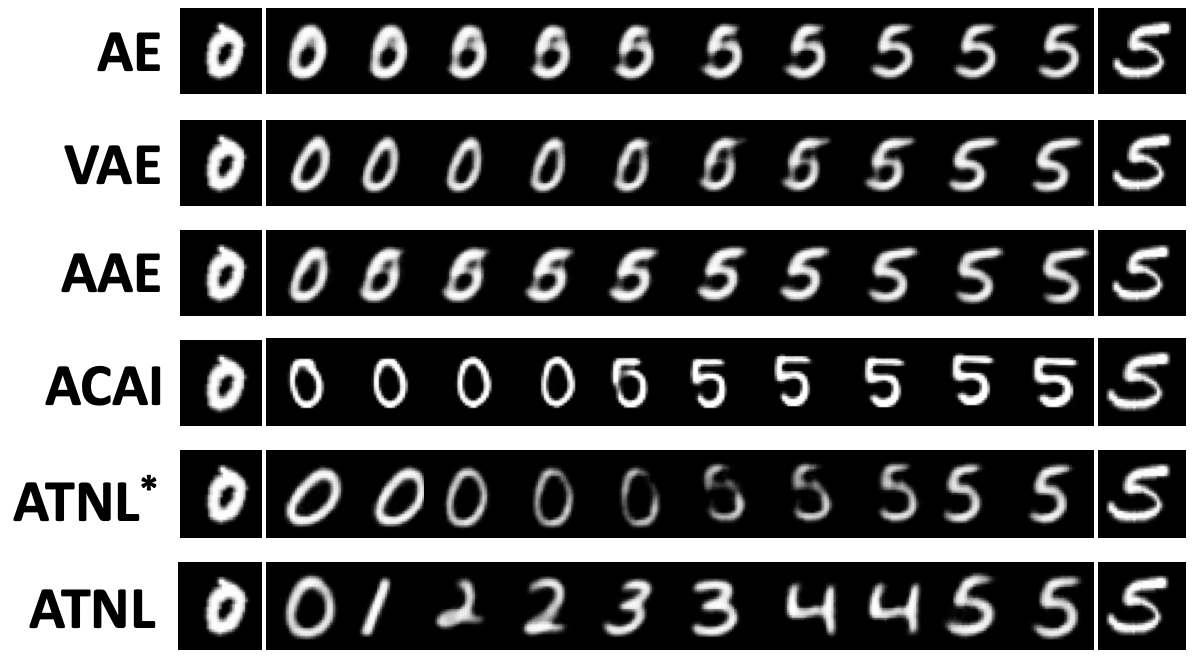
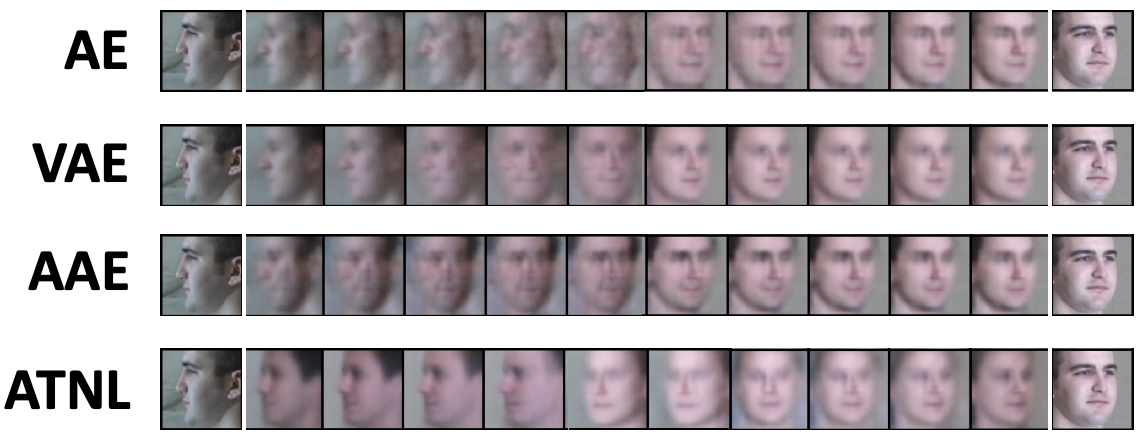
We now further assess the ability of our ATNL in describing distribution of latent representation. Given two images of different digit as inputs, we compare image outputs produced by AE, VAE, AAE, ACAI, ATNL∗ with linear interpolation and our ATNL with spherical semantic interpolation in Figure 7. As shown in the first to fifth rows in Figure 7, AE, VAE, AAE, and ACAI, ATNL∗ simply performed linear interpolation of latent representations in manipulating output images, which were visually and gradually warped from digit 0 to digit 5. On the other hand, our ATNL was able to interpolate latent vectors producing images in semantics/digit order (i.e., digits interpolation for AE, VAE, AAE and spherical semantic interpolation for our ATNL. As shown in Figure 8, the output images were produced by interpolating face images in -90 degrees and those in 30 degrees. Similar to MNIST, our ATNL on Multi-PIE was also able to properly generate images in semantics/pose order, while previous models simply produced image outputs with visual appearance changes. From the above experiments, the ability of our ATNL in representation learning and describing task-oriented semantic information can be verified.
| Dataset | Unsup. | Sup. | ||
|---|---|---|---|---|
| AE | VAE | VAE-TL | Ours | |
| MNIST | 99.14 | |||
| CMU Multi-PIE | 92.41 | |||
IV-E Quantitative Evaluation
We further conduct quantitative experiments for examining the effectiveness of our ATNL in representation learning. For fair comparison, we employ a simple one-layer classifier (1 linear layers followed by softmax) for two classification tasks. The number of class in MNIST is 10 for digit classification and the number of class in CMU Multi-PIE is 7 for pose classification. We adopt AE and VAE as our baseline models while we employ VAE with additional triplet loss (VAE-TL), as our comparative model. As shown in Table I, we report the classification performance on both MNIST and CMU Multi-PIE, which achieve and at accuracy, respectively. The experiment demonstrates that our designed Angular Triplet-Neighbor Loss (ATNL) yields the superiority in two classification tasks.
IV-F Assessment of Interpolated Images
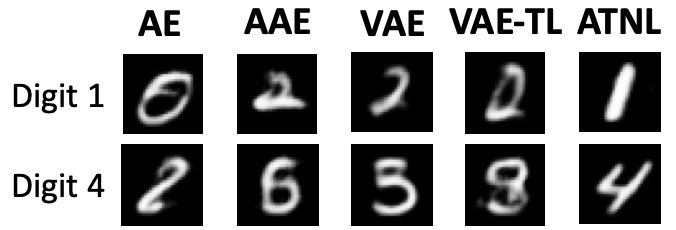
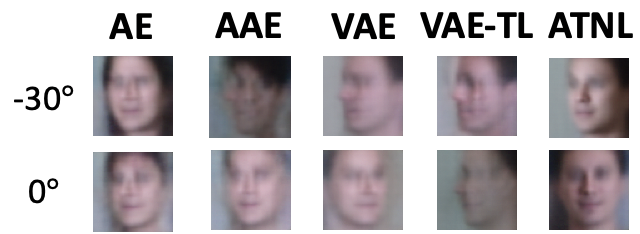
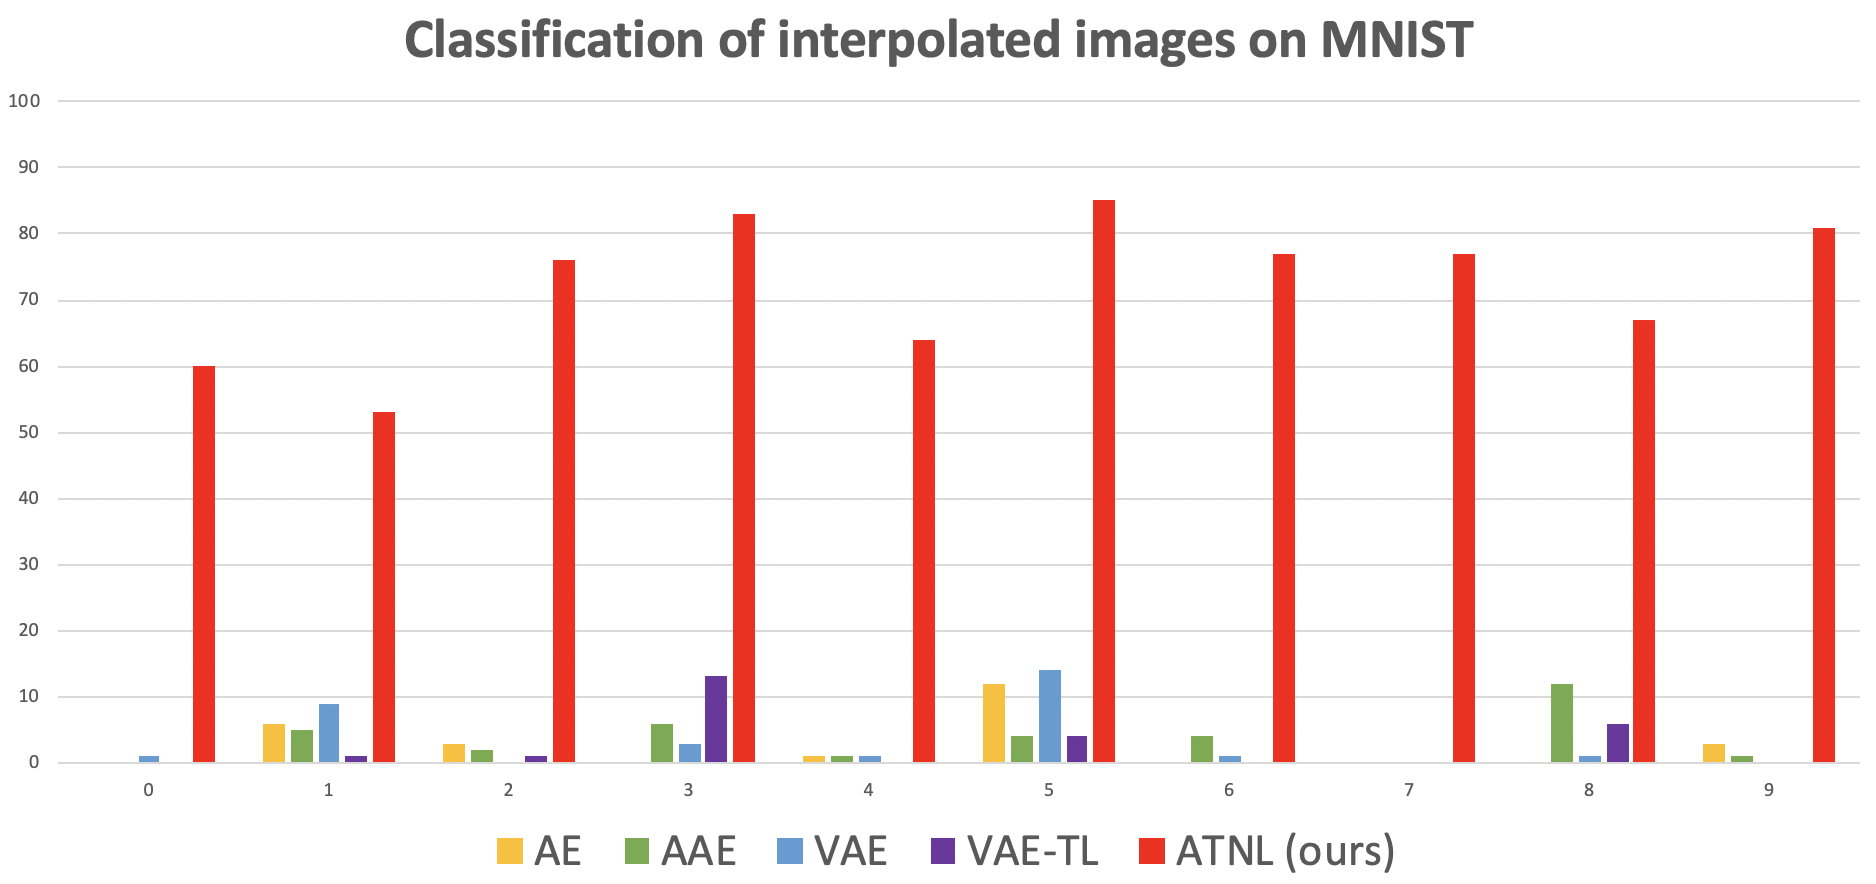
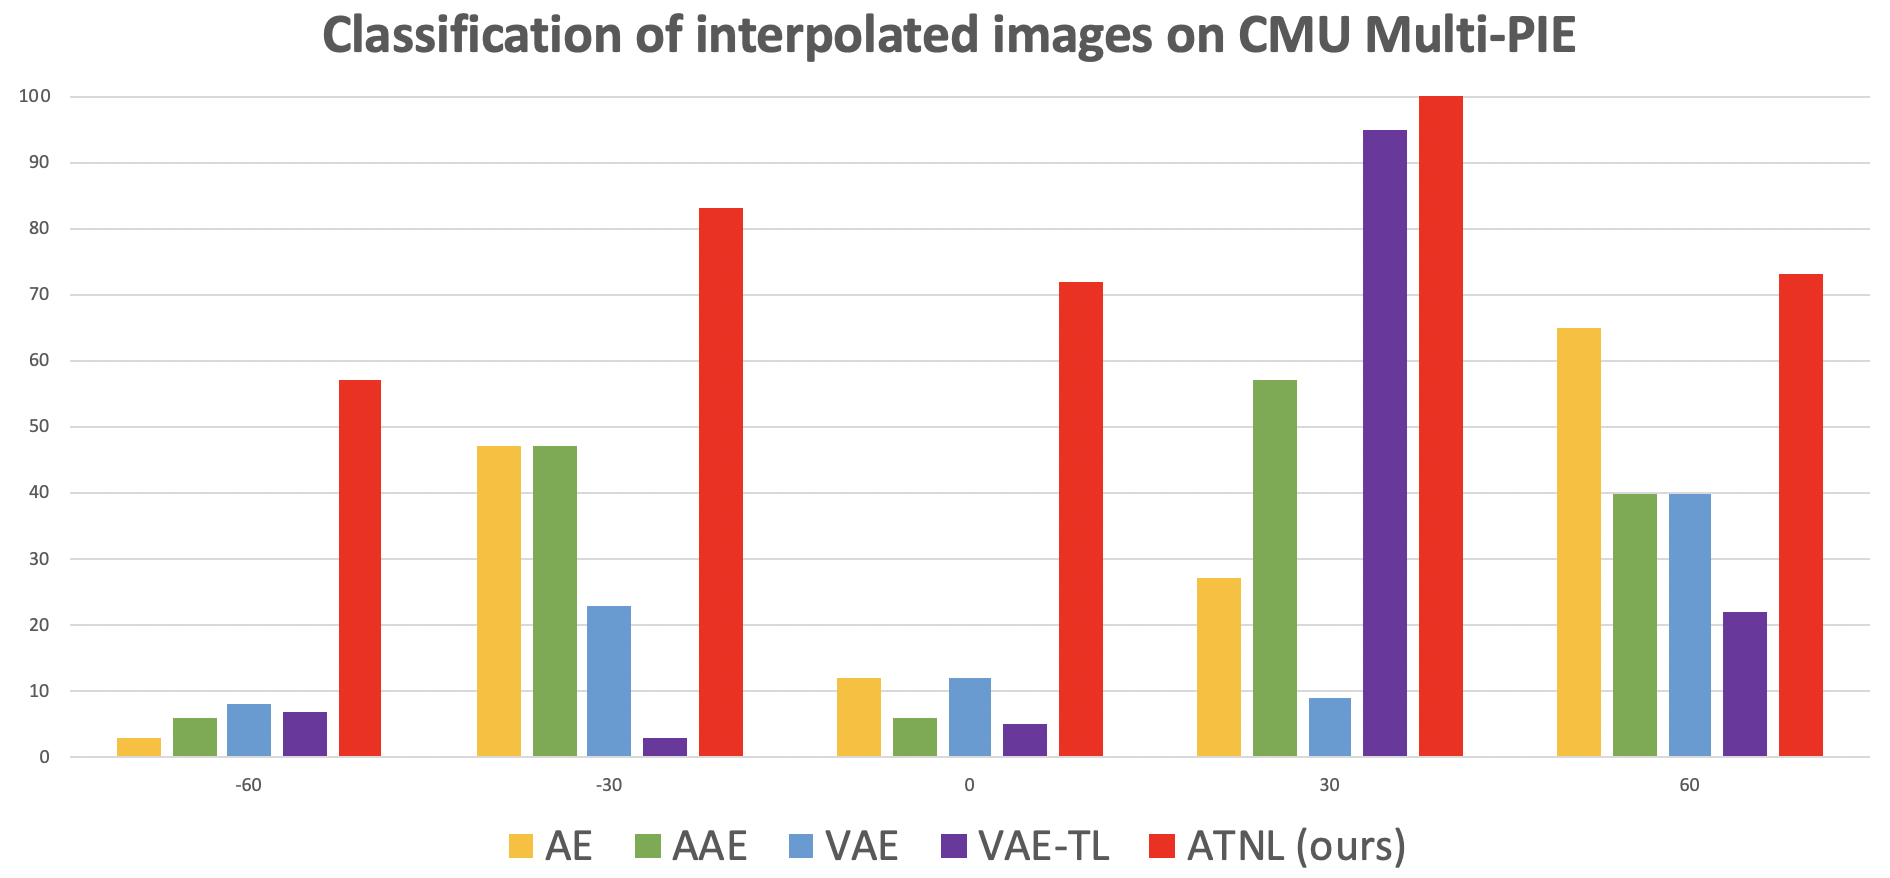
We now qualitatively and quantitatively evaluate the interpolated images synthesized by our ATNL. We adopt linear interpolation for AE, AAE, VAE and VAE-TL and spherical semantic interpolation for our ATNL, and assess the synthesized images are interpolated by their semantic neighbors (e.g., the neighbors of digit 1 are digits 0 and 2 for MNIST). The example interpolated images are shown in Figure 9 and Figure 10, respectively. Also, as shown in Figure 11 and Figure 12, we report the classification performance on such interpolated images. From the above figures, we see that the images synthesized by our ATNL were visually practical and allowed very promising recognition performances.
IV-G Extension as Data Hallucination for Few-Shot Learning
We further apply our learned representation with spherical semantic interpolation as a data hallucination technique for few-shot learning (FSL). That is, instead of applying standard data augmentation techniques, we interpolate images from their semantic neighbors to increase data for categories with few training samples. Both K-nearest-neighbor (KNN) and standard Convolution Neural Networks (CNN) are applied as classifiers. As shown in Table II, we achieved the highest ac curacies on MNIST, which were clearly superior to those reported by baseline and standard data augmentation techniques. This confirms that, when the semantic labels are known, our proposed model can be properly served as a data hallucination technique for FSL tasks.
| Method | Classifiers | |
|---|---|---|
| KNN | CNN | |
| w/o data hallucination | ||
| w/ data augmentation (baseline) | ||
| w/ ATNL data augmentation (ours) | 78.7 | 94.4 |
IV-H Ablation Studies
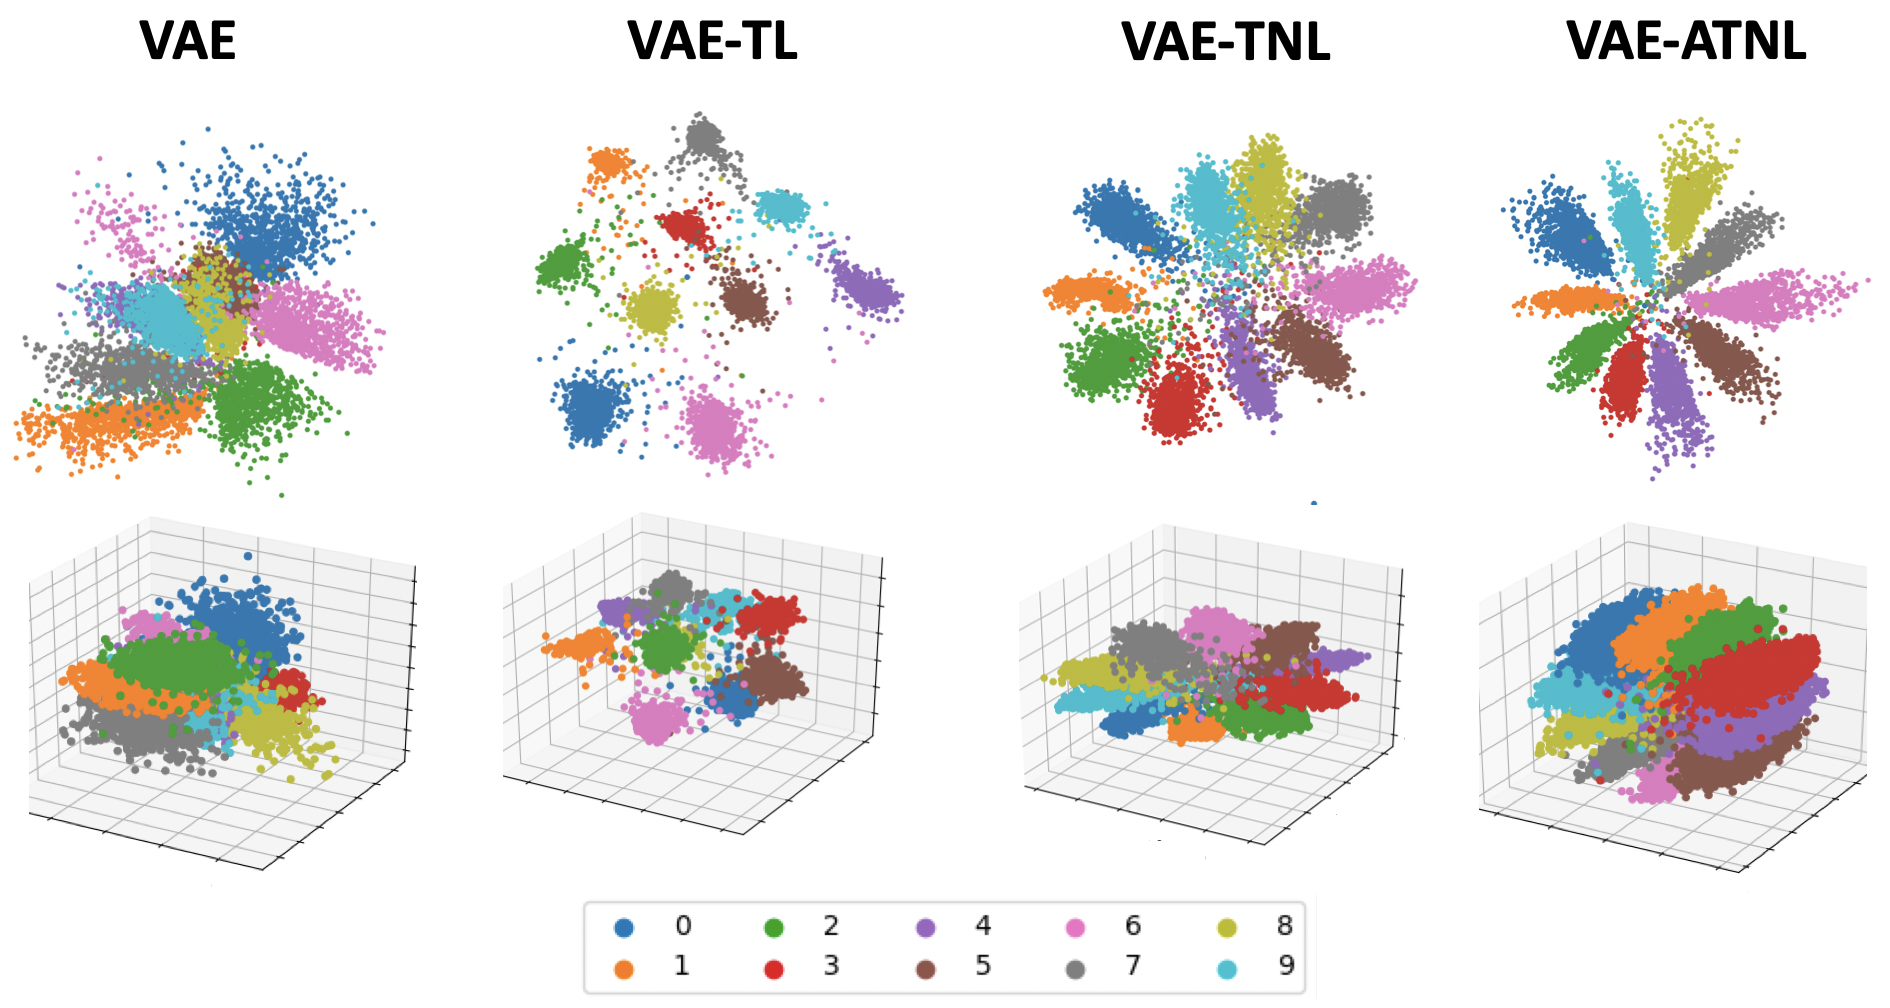
We visualize latent representations derived by VAE, VAE with triplet loss (VAE-TL), VAE with triplet loss based on our semantically positive/negative neighbors (VAE-TNL), and VAE-ATNL (ours) using MNIST in Figure 13. By both 2D and 3D t-SNE results, we see that of the same digit derived from VAE-TNL and VAE-ATNL were properly clustered while the clustering results exhibited task-oriented semantic information. Finally, derived by VAE-ATNL (ours) were mapped on to a spherical hyperplan with better separation between classes, showing that the derived latent representation by VAE-ATNL (ours) has preserved the most perceivable semantic information and geometric interpretation.
V Conclusion
In this paper, we addressed the learning of interpretatble and interpolatable latent representations of visual data. By observing task-oriented semantics information, we proposed Angular Triplet-Neighbor Loss (ATNL) can be applied to existing generative models like VAE and have the latent representation distributions fit the associated semantic information. Together with the presented spherical semantic interpolation, we are able to synthesize images with particular categories of interest. In the experiments, we provided qualitative and quantitative results on two benchmark datasets, along with ablation studies and visualization to verify the effectiveness of our work. Moreover, we further apply our model as a data hallucination technique for few-shot learning, which is a practical yet challenging tasks in computer vision.
Acknowledgments
This work was supported in part by the Ministry of Science and Technology of Taiwan under grant MOST 109-2634-F-002-037.
References
- [1] D. Berthelot, C. Raffel, A. Roy, and I. Goodfellow, “Understanding and improving interpolation in autoencoders via an adversarial regularizer,” in Proceedings of the International Conference on Learning Representations (ICLR), 2019.
- [2] X. Chen, Y. Duan, R. Houthooft, J. Schulman, I. Sutskever, and P. Abbeel, “Infogan: Interpretable representation learning by information maximizing generative adversarial nets,” in Advances in Neural Information Processing Systems (NIPS), 2016.
- [3] J. Deng, J. Guo, N. Xue, and S. Zafeiriou, “Arcface: Additive angular margin loss for deep face recognition,” arXiv preprint arXiv:1801.07698, 2019.
- [4] J. Donahue, P. Krähenbühl, and T. Darrell, “Adversarial feature learning,” in Proceedings of the International Conference on Learning Representations (ICLR), 2017.
- [5] I. Goodfellow, J. Pouget-Abadie, M. Mirza, B. Xu, D. Warde-Farley, S. Ozair, A. Courville, and Y. Bengio, “Generative adversarial nets,” in Advances in Neural Information Processing Systems (NIPS), 2014, pp. 2672–2680.
- [6] R. Gross, I. Matthews, J. Cohn, T. Kanade, and S. Baker, “Multi-pie,” Image and Vision Computing, vol. 28, no. 5, pp. 807–813, 2010.
- [7] R. Hadsell, S. Chopra, and Y. LeCun, “Dimensionality reduction by learning an invariant mapping,” in Proceedings of the IEEE Conference on Computer Vision and Pattern Recognition (CVPR), 2006.
- [8] X. He, Y. Zhou, Z. Zhou, S. Bai, and X. Bai, “Triplet-center loss for multi-view 3d object retrieval,” in Proceedings of the IEEE Conference on Computer Vision and Pattern Recognition (CVPR), 2018.
- [9] I. Higgins, L. Matthey, A. Pal, C. Burgess, X. Glorot, M. Botvinick, S. Mohamed, and A. Lerchner, “beta-vae: Learning basic visual concepts with a constrained variational framework,” in Proceedings of the International Conference on Learning Representations (ICLR), 2017.
- [10] X. Huang, M.-Y. Liu, S. Belongie, and J. Kautz, “Multimodal unsupervised image-to-image translation,” in Proceedings of the European Conference on Computer Vision (ECCV), 2018.
- [11] D. P. Kingma and M. Welling, “Auto-encoding variational bayes,” arXiv preprint arXiv:1312.6114, 2013.
- [12] Y. LeCun, L. Bottou, Y. Bengio, P. Haffner et al., “Gradient-based learning applied to document recognition,” Proceedings of the IEEE, vol. 86, no. 11, pp. 2278–2324, 1998.
- [13] H.-Y. Lee, H.-Y. Tseng, J.-B. Huang, M. K. Singh, and M.-H. Yang, “Diverse image-to-image translation via disentangled representations,” in Proceedings of the European Conference on Computer Vision (ECCV), 2018.
- [14] Z. Li, C. Xu, and B. Leng, “Angular triplet-center loss for multi-view 3d shape retrieval,” in Proceedings of the AAAI Conference on Artificial Intelligence (AAAI), 2019.
- [15] M.-Y. Liu, T. Breuel, and J. Kautz, “Unsupervised image-to-image translation networks,” in Advances in Neural Information Processing Systems (NIPS), 2017.
- [16] W. Liu, Y. Wen, Z. Yu, M. Li, B. Raj, and L. Song, “Sphereface: Deep hypersphere embedding for face recognition,” in Proceedings of the IEEE Conference on Computer Vision and Pattern Recognition (CVPR), 2017.
- [17] W. Liu, Y. Wen, Z. Yu, and M. Yang, “Large-margin softmax loss for convolutional neural networks,” in Proceedings of the International Conference on Machine Learning (ICML), 2016.
- [18] A. Paszke, S. Gross, S. Chintala, G. Chanan, E. Yang, Z. DeVito, Z. Lin, A. Desmaison, L. Antiga, and A. Lerer, “Automatic differentiation in pytorch,” in Advances in Neural Information Processing Systems Workshops (NIPS Workshops), 2017.
- [19] F. Schroff, D. Kalenichenko, and J. Philbin, “Facenet: A unified embedding for face recognition and clustering,” in Proceedings of the IEEE Conference on Computer Vision and Pattern Recognition (CVPR), 2015.
- [20] P. Vincent, H. Larochelle, I. Lajoie, Y. Bengio, and P.-A. Manzagol, “Stacked denoising autoencoders: Learning useful representationsina deep network with a local denoising criterion,” Journal of Machine Learning Research, 2010.
- [21] H. Wang, Y. Wang, Z. Zhou, X. Ji, D. Gong, J. Zhou, Z. Li, and W. Liu, “Cosface: Large margin cosine loss for deep face recognition,” in Proceedings of the IEEE Conference on Computer Vision and Pattern Recognition (CVPR), 2018.
- [22] Y. Wen1, K. Zhang1, Z. Li1, and Y. Qiao, “A discriminative feature learning approachfor deep face recognition,” in Proceedings of the European Conference on Computer Vision (ECCV), 2016.
- [23] Y. Zheng, D. K. Pal, and M. Savvides, “Ring loss: Convex feature normalization for face recognition,” in Proceedings of the IEEE Conference on Computer Vision and Pattern Recognition (CVPR), 2018.