Fermi-LAT Observations of V549 Vel 2017: a Sub-Luminous Gamma-Ray Nova?
Abstract
We report on the -LAT detection (with significance) as well as the multi-wavelength analysis of the 2017 nova eruption V549 Vel. Unlike the recent shock-powered novae ASASSN-16ma and V906 Car, the optical and -ray light curves of V549 Vel show no correlation, likely implying relatively weak shocks in the eruption.
Gaia detected a candidate progenitor of V549 Vel and found a parallax measurement of mas, equivalent to a mode distance of pc (90% credible interval of 380–1050 pc). The progenitor was also observed by the 2MASS and WISE surveys. When adopting the Gaia distance, the spectral energy distribution of the progenitor is close to that of a G-type star. Swift/XRT detected the supersoft X-ray emission of the nova (–40 keV) since day 236, and the inferred blackbody size is comparable to that of other novae assuming pc (i.e., cm). However, there is also an unknown astrometric excess noise of mas found in the Gaia data, and the inferred distance becomes controversial. If the Gaia distance is accurate, the -ray luminosity of V549 Vel will be as low as erg s-1, making it the least luminous -ray nova known so far. This may imply that the shock properties responsible for the -ray emission in V549 Vel are different from those of the more luminous events. If the nova is located farther away, it is likely a symbiotic system with a giant companion as the observed progenitor.
Subject headings:
novae, cataclysmic variables — gamma rays: stars — X-rays: general1. Introduction
V549 Vel (also known as ASASSN-17mt) is a 11.3-mag optical transient in the Galactic plane (), discovered by the All Sky Automated Survey for SuperNovae (ASAS-SN; Shappee et al. 2014) on 23 September 2017 (MJD 58019; Stanek et al. 2017). It was first detected when the field just became observable to ASAS-SN after an -day seasonal gap (Stanek et al. 2017). Gaia detected it independently as Gaia19dff111http://gsaweb.ast.cam.ac.uk/alerts/alert/Gaia19dff/ and found that it is still in quiescence on 2 September 2017, shortening the gap to 21 days. The transient was later spectroscopically identified as a classical nova in the optically thick stage (or the “Fe curtain” state; Luckas 2017). Furthermore, a possible progenitor system was found in the Gaia ( mag, mag, and mag), 2MASS ( mag, mag, and mag), and WISE ( mag, mag, mag, and mag) catalogs (Pessev 2017). According to Gaia DR2 (Lindegren et al. 2018), the distance to the nova could be less than 1 kpc. One month after the optical discovery, a weak but significant GeV -ray emission signal was detected at the nova position by Fermi-LAT (Li et al. 2017a). If the Gaia distance is accurate, V549 Vel will be the closest and also the least luminous -ray nova known to date.
In this paper, we present a multi-wavelength analysis of V549 Vel based on the observations taken by Fermi-LAT, Swift/XRT, and the Asiago Novae & Symbiotic stars (ANS) collaboration. We also discuss whether V549 Vel can be a sub-luminous -ray nova and, if so, a possible scenario that explains its anomalous features relative to other Fermi-detected events.
2. Fermi-LAT Observations
We downloaded the LAT data (Pass 8 with P8R3_SOURCE_V2 instrument response functions) taken between 8 July 2017 (MJD 57942, the last day of ASAS-SN non-detection) and 4 December 2017 (MJD 58091, day 73 since the first optical detection on MJD 58019) from the Fermi Science Support Center (FSSC). The analysis tools and the auxiliary database, fermitools (version 1.0.5) and fermitools-data (version 0.17), were used for all of the data reduction and analysis processes.
The LAT data was selected and reduced based on the analysis threads in FSSC. We chose a region of interest (ROI) of centred on the nova position. All the events collected within the ROI were further selected so that all events belong to the SOURCE class (i.e., evclass=128) with the event type FRONT or BACK (i.e., evtype=3). As Earth’s limb is a bright source of -rays to contaminate the LAT observations, all events with zenith angles larger than are therefore excluded. In addition, all the data must be collected during the good time intervals (GTIs) defined by the gtmktime criterion, (DATA_QUAL0)&&(LAT_CONFIG==1).
We used the standard binned likelihood analysis to extract the -ray spectral properties of V549 Vel. A spatially-resolved -ray emission model for the ROI was constructed based on the LAT 8-year Source Catalog (4FGL; The Fermi-LAT collaboration 2019). All 4FGL sources located within from V549 Vel are included in the emission model. All the field sources are at least away from the nova. Most of them are much fainter than V549 Vel according to the flux reported in Li et al. (2017a). Therefore, we fixed all the spectral parameters, except for the normalization parameters for the Vela Pulsar (4FGL J0835.3-4510), Vela X (4FGL J0833.1-4511e), and Vela Junior (4FGL J0851.9-4620e), the only three -ray sources that are brighter than V549 Vel within , for simplicity. Besides 4FGL point/extended sources, we employed the background emission models, gll_iem_v07.fits and iso_P8R3_SOURCE_V2_v1.txt, to account for the Galactic diffuse emission and the extragalactic isotropic diffuse emission, respectively. The normalization of the Galactic diffuse component is allowed to vary during fitting, while that of the isotropic diffuse background is fixed at 1, otherwise it will go down to 0.67 (i.e., only 67% of the default contribution). We note that fixing the extragalactic isotropic diffuse component do not affect the fitting result significantly–all best-fit parameters of V549 Vel are well consistent with each other within their 1- uncertainties. For our target V549 Vel, we assumed a simple power-law model emission model at the ASAS-SN nova position. More complicated models were not considered given the low photon statistics.
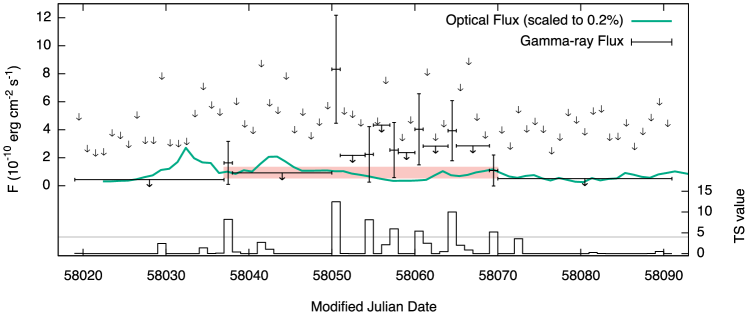
First, we used the likelihood analysis to extract a quick-look LAT light curve with daily bins. The nova was detected in seven bins with the test statistic, (i.e., the detection significance in ) with the peak significance at on MJD 58050. Based on the first and last dates of the detections, we define the -ray active phase as MJD 58037–58070 (day 19–52 since the nova discovery). It is worth noting that the -ray flux of the nova was just below the threshold on MJD 58072 (i.e., ) when Swift-XRT started to observe and detect the nova (further analysis and discussion can be found in §5 and §6.1, respectively). Using the model file described in the previous paragraph, we ran the likelihood analysis with the LAT data collected in this time interval. The nova is significantly detected with , equivalent to a detection significance of . The best-fit photon index and energy flux are and erg cm-2 s-1. We then fixed all spectral parameters of the model file, except the normalizations of the Galactic diffuse emission and V549 Vel, and re-extract the LAT light curve (Figure 1), which actually looks very similar to the preliminary version. Using the same model and gtfindsrc, the optimized position of the -ray source is (132.581, 47.7272; J2000.0) with a 95% error radius of 54. The location is entirely consistent with the nova position with an offset of just 25.
3. ANS Optical Observations
From 26 September 2017 (2 days after the ASASSN discovery) to 8 April 2019 (MJD 58022–58581), the nova was observed nearly daily (when the visibility allows) in Landolt , , and bands the with ANS Collaboration telescope ID 2100, which is a 40-cm located in San Pedro de Atacama (Chile). Data reduction involves all usual steps of correction for bias, dark, and flat. The transformation for the instantaneous local photometric system to the Landolt (2009) equatorial standard system is performed via a highly accurate local photometric sequence, which is pruned and improved with each revisit of the field. With the end of the observing campaign, all observations are re-reduced one final time on the ANS Collaboration central server against the final version of such local photometric sequence, with colour equations ensuing both the highest internal consistency and accurate placing of the data on the Landolt photometric system. All measurements have been performed in aperture mode, with no need to revert to PSF-fitting mode given the low stellar density in the field. Further details on the network of ANS Collaboration telescopes and their operation are provided by (Munari et al. 2012) and (Munari & Moretti 2012).
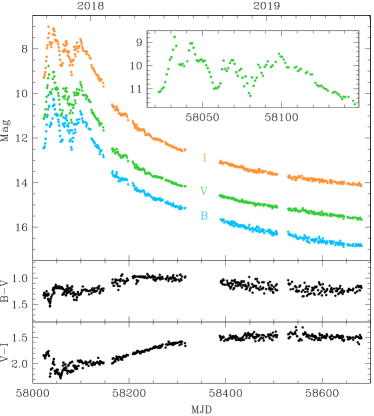
Figure 2 presents the observed , , and -band light curves with the and evolutions shown in the lower panels. In the first 100 days of the light curves, V549 Vel showed at least four jitters of amplitudes of 1–2.5 mag on a time-scale of month, indicating that it is a J-class nova (Strope et al. 2010). After 100 days, the nova faded smoothly until the end of the monitoring. Assuming a power-law decline model of with MJD 58020.39 (the ASASSN discovery date), we found that the decline can be well described by a three-segment broken power-law model with the best-fit parameters: , , and , with the two breaks at and days.
As mentioned in the Introduction (§1), V549 Vel could be very nearby. Based on the Gaia parallax measurement, the distance to the nova could be pc (see the next section, §4, for more details), resulting in mag as the maximum absolute magnitude of V549 Vel in the ANS light curve. In the absolute magnitude distribution of the novae in M31, the absolute magnitude of a nova could be as faint as mag at maximum (2- level below the mean value of mag; Shafter 2017). However, the obtained absolute magnitude of V549 Vel is 1.7 mag fainter, likely indicating either a greater distance or the existence of an even brighter nova peak missed prior to the nova discovery.
To allow a direct comparison between the powers radiated in the -ray and optical bands, bolometric correction (BC) was applied on the -band light curve. The BC factors were calculated according to the colour temperatures at different epochs inferred by K (Budding & Demircan 2007; Kitchin 2009; Mamajek et al. 2015). We comment that the method may not be ideal as the nova is not a perfect blackbody, but it is still a good approximation for estimating the bolometric fluxes. The reddening correction was done by assuming a typical maximum for classical novae, i.e., (van den Bergh & Younger 1987; Hachisu & Kato 2016), which gives (or mag with ). This value indeed agrees well with the one inferred from the Swift/UVOT photometry taken in , , , and bands (Page et al. 2018). Figure 1 shows the resultant bolometric light curve of V549 Vel (green curve), of which the shape has no big difference from the uncorrected ones.
4. Pre-explosion optical detection
Following the progenitor study by Pessev (2017), we searched the Gaia (Gaia Collaboration et al. 2018), 2MASS (Skrutskie et al. 2006), and WISE (Wright et al. 2010) catalogs at the ASAS-SN position (, ) (J2000.0) with a search radius of , and found the reported progenitor in all the catalogs. The offset is as small as in the Gaia map. We randomly chose an ANS image taken in June 2018 (the nova was mag, which is about 10 times brighter than the candidate progenitor) for a better positional constraint. Using 13 bright (i.e., mag) and low proper motion (i.e., slower than mas yr-1 in both RA and Decl. directions) Gaia sources in the field, we construct a Gaia-based astrometric solution for the ANS image with an accuracy of (the quadratic sum of the rms uncertainties in RA and Decl. directions). Under this improved solution, the nova is located at , (J2000.0) and the candidate progenitor is just away from it. We also noticed a preliminary astrometry for V549 Vel reported on the Gaia Photometric Science Alerts page (identified as Gaia19dff; see §1), which is entirely consistent with our solution (offset: ). Because of the unknown accuracy of the preliminary solution, it was not used in the following analysis.
We performed Monte Carlo simulations to test whether these sub-arcsec matches can be easily reproduced by chance. In the simulations, we generated random positions within from the nova, which contains 340 real sources in the Gaia catalog. Less than 0.1% of the simulated stars can find a Gaia match within , indicating a significance of of the nova-Gaia match.
From the parallax measurement of Gaia DR2 (i.e., mas, which has been corrected for the global zero point of mas; Lindegren et al. 2018), the distance to the progenitor source is around pc (the mode value) with a 90% Bayesian credible interval of 380–1050 pc (Bailer-Jones et al. 2018), indicating that V549 could be the closest -ray emitting nova known to date. However, a large astrometric excess noise of mas is also presented in the catalog, showing that there is a significant difference between the data and the astrometric solution. Nevertheless, we take pc as a reference and further discussions on the issue will be given in §6.3 and §6.4.
The progenitor source is not particularly bright with mag (NOMAD; Zacharias et al. 2004), equivalent to an absolute magnitude of –5.4 mag for –1050 pc, if inferred in the previous section is applied.
It is well known that cataclysmic variables (CVs) are the progenitors of classical novae, and thus the Gaia progenitor would probably be a CV, if V549 Vel is nearby. If the accretion is active, large variability can be seen in CVs. In the WISE catalog (43 epochs in MJD 55343–45 and 55533–35), V549 Vel’s progenitor is classified as a stable system with Variability flag = 2 and 1 in the and bands, respectively (i.e., a source is considered stable if the flag is less than 6). Besides, no previous outburst of V549 Vel has been reported in the literature. The stability might suggest a low accretion rate of the system. Moreover, CVs with high accretion rates are bright because of the accretion disk. For example, V392 Per, which also exhibited as a -ray nova in 2018 (Li et al. 2018), has V-band absolute magnitudes from to 2.3 mag during the quiescence (Darnley & Starrfield 2018; Munari et al. 2020). If V549 Vel had the same quiescent level, the extinction has to be – mag ( pc is assumed), which is higher than the values obtained from the ANS (i.e., mag). We therefore argue that the accretion rate of V549 Vel was relatively low in quiescence. In this context, the companion stellar emission could dominate in the pre-nova observations.
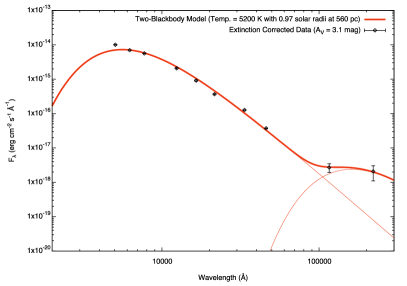
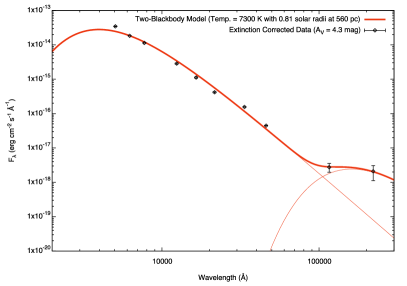
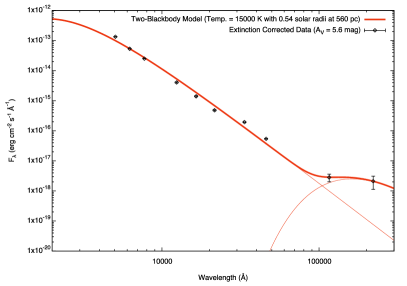
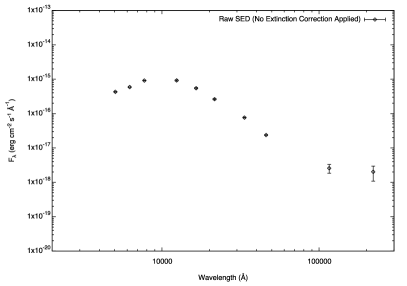
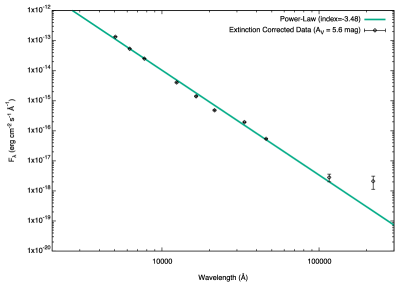
By assuming the progenitor source as a blackbody, we measured the surface temperature as well as the size of the companion using the spectral energy distribution (SED) comprised of the data from Gaia, 2MASS, and WISE (Figure 3). Three extinction curves, Cardelli et al. (1989); Yuan et al. (2013); Fitzpatrick (1999), were used to deredden the SED in the optical/near-infrared (IR), mid-IR, and far-IR bands, respectively. Besides the extinction value mag deduced in §4, we also adopted (duplicated), 4.3, and 5.6 mag inferred from the lower-bound, best-fit, and upper-bound hydrogen column densities (i.e., cm-2; converted with mag; Güver & Özel 2009) obtained from the X-ray spectral analysis during the supersoft X-ray phase (see the next section, §5, for a more complete analysis). We note that the value was measured in a very late phase of the eruption (days 253–389), during which the contribution from the ejecta should be limited. In the WISE (m) and (m) bands, there is a clear IR emission excess (Figure 3), which is indicative of warm dust around the star, probably a circumbinary disk around the CV (Spruit & Taam 2001; Taam & Spruit 2001). An additional blackbody was therefore included. In all of the fits, the IR excess can be well modelled by a warm blackbody of K and (or 0.4 au; pc assumed). No uncertainty is given as there is no degree of freedom for the IR excess model.
The extinction corrected SEDs can be well described by blackbody radiation. The best-fit temperatures are K (for mag), K (for mag), and K (for mag) with radii of , , and , respectively, if pc. The SEDs are in general slightly brighter than the models at the blue end, possibly indicating an accretion component. Among the fits, the mag set is consistent with a Sun-like star, and the corresponding extinction also matches well with the reddening inferred from the ANS light curves, i.e., (see §3). Nevertheless, we note that the SED models considered here do not take the accretion, however weak, into account, and therefore the stellar types and luminosity classes inferred could vary if an improved model is used.
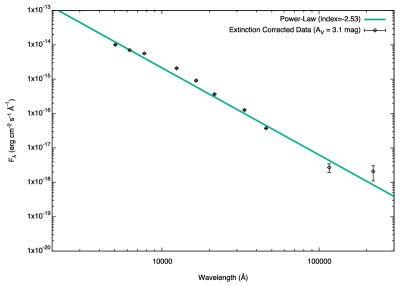
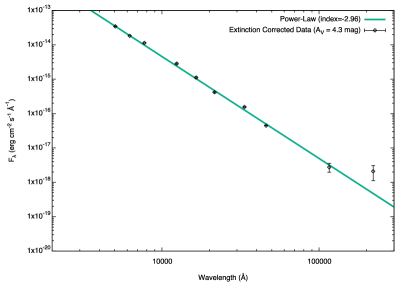
We also fitted the SEDs with a power-law model to explore other possibilities, e.g., an accretion-dominated system with hot plasma. With the power law, the IR excess is marginally seen only in the band. We therefore skipped the warm blackbody component for simplicity. The best-fit spectral indices are (for mag), (for mag), and (for mag). In general, the two SEDs with higher extinctions give very good fits to the power-law model. While the fit for mag is reasonably good, the SED is slightly curved in the log-log plot, and does not fully follow a power law (Figure 4). Given that mag is likely the correct extinction as it is consistent with both the ANS and X-ray analyses, we slightly favour the blackbody fit that provides a better description for the SED, if mag.

5. Neil Gehrels Swift XRT Observations
Swift-XRT has observed V549 Vel 33 times during the 2017 outburst (from MJD 58072 to 58427), and the nova was clearly detected in the XRT’s energy domain (Page et al. 2018). The X-ray emission was first detected on day 54 (MJD 58072) since the ASAS-SN discovery with a plasma temperature of 1–2 keV based on the APEC model. It is important to note that the nova was also marginally detected with by Fermi-LAT on the same day. Since day 236 (MJD 58254), supersoft X-ray emission with a blackbody temperature of eV was also seen until the last XRT observation taken on day 409 or MJD 58427 (Page et al. 2018, 2019).
We downloaded the Swift-XRT observations and re-analysed parts of the dataset to aim for a better understanding of the system. In particular, we wish to make constraints on the nova distance based on the supersoft thermal X-ray emission and measure the flux ratio between the X-rays and -rays on day 54 (around MJD 58072).
HEAsoft (version 6.24) was used to reduce and analyse the XRT data with the HEASARC’s calibration database (CALDB; version 20180710). The light curve and spectra were extracted using the task xrtgrblc that applies count-rate dependent regions to optimize the signal-to-noise ratio (S/N) of the products. The obtained light curve (0.3–10 keV) is consistent that shown in Page et al. (2019). We also extract a hardness ratio curve (i.e., hard-to-soft X-ray count ratio with 1.5 keV as the energy cut) for the data selection that will be described in the next paragraph. Figure 5 shows the light and hardness ratio curves of V549 Vel in the supersoft X-ray phase.
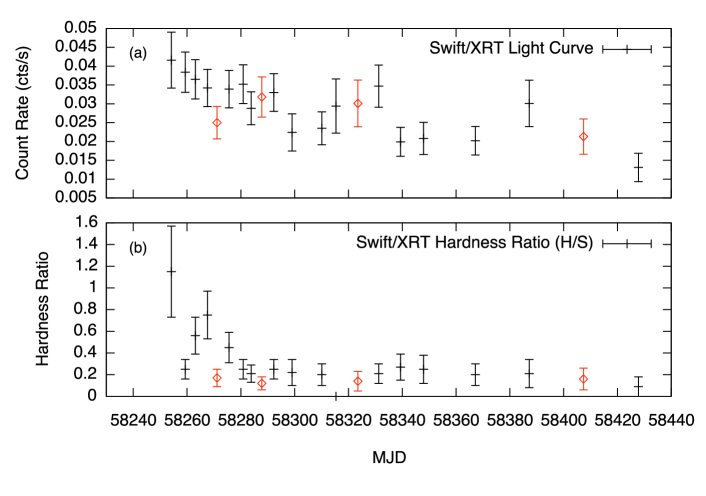
We first focused on the spectral analysis of the supersoft emission. As the photon statistics per individual observation is not great, we performed stacked analysis to estimate the blackbody temperature as well as its size. While the supersoft X-ray emission is fairly stable throughout the observed period, only those observations with similar X-ray hardnesses and count rates were used to ensure that all stacked data were taken in very similar spectral states. The selection criteria are “0.2 hardness 0.1” and “0.04 cts/s count rate 0.02 cts/s”. We note that the boundaries of the criterion are decided rather arbitrarily and selection bias could exist, but the result should still be sufficient to check whether the supersoft X-ray emitting region has a sensible size at the Gaia distance. Four observations (days 253, 269, 305, and 389; or MJD 58271, 58287, 58323, and 58407) were finally selected and the total exposure time is about 6 ksec.
XSPEC was used for the spectral fitting. Since the total number of counts in the four observations (including background) is only 117, C-Statistic is used as the fit statistic and we binned the spectrum to at least one count per bin as suggested by the Swift team. The stacked spectrum can be well fitted with phabs*(apec+bbodyrad) that was also used in the analysis of Page et al. (2018).
Strong absorption was found with cm-2. For the APEC component, the best-fit temperature is keV with an unabsorbed flux of erg cm-2 s-1 (0.3–10 keV). The supersoft X-ray component has a blackbody temperature of eV and an unabsorbed flux of erg cm-2 s-1 in 0.3–1 keV, equivalent to an emission size of cm in radius. The inferred blackbody temperature is consistent with keV presented in Page et al. (2018). To elaborate the uncertainty estimation, 90% confidence limits were computed using the XSPEC command error with the blackbody temperature fixed at the best-fit value. If the parameter is not frozen, the lower bound of will keep hitting the zero ground in the calculation. If we let the code continue, it gives keV and cm (90% confidence).
For the first XRT spectrum taken on MJD 58072 (when the -ray emission was marginally detected on day 54), a single-component APEC model is enough to give a good fit with cm-2 and keV. The fitting result is consistent with that of Page et al. (2018). Based on these parameters, the unabsorbed flux is inferred to be erg cm-2 s-1 (0.3–10 keV). Compared with the marginal Fermi-LAT detection of erg cm-2 s-1, the X-ray-to--ray flux ratio is about 5%. The 1- confidence interval is roughly 2–77%, which is estimated by the possible range allowed by the 68% uncertainties of the corresponding X-ray and -ray fluxes.
6. Discussion and conclusion
6.1. Thermal X-ray emission from shocks
While supersoft X-ray emission of novae originates from the white dwarf atmosphere, hard X-rays ( keV) are generally believed to come from shocks (see, e.g., Orio et al. 2001). These shocks can be either external shocks formed when the nova ejecta runs into the circumstellar medium, or internal shocks formed when the nova outflows of different speeds collide. For -ray emitting novae, Metzger et al. (2014) theoretically showed that thermal hard X-rays can be produced in the internal shocks that radiate the observed -ray emission. In this sense, concurrent X-ray and -ray observations of a nova could put crucial constraints on the radiative efficiency and also the particle acceleration efficiency of the internal shocks.
In V549 Vel, the quasi-simultaneous Swift and Fermi-LAT flux measurements taken on MJD 58072 result in a flux ratio of 2–77%, unambigously showing that the -ray luminosity is higher. This, despite the difference in the X-ray energy ranges, is in agreement with the result of the recent Fermi-LAT and NuSTAR concurrent observations of the two novae V5855 Sgr and V906 Car, which yield 0.1–1% (Nelson et al. 2019) and 2% (Sokolovsky et al. 2020; Aydi et al. 2020), respectively. However, in the nova shock model of Metzger et al. (2014) with standard parameters assumed, one would expect to observe much brighter thermal X-ray emission—10 to 1000 times more luminous than the -ray flux—and this contradiction was also found in V5855 Sgr and V906 Car.
Nelson et al. (2019) and Aydi et al. (2020) argued that the low X-ray luminosity indicates an X-ray suppression in the shocks, which could be due to thin-shell instabilities at the shock front. In the standard one-dimensional solution, the post-shock temperature can be written as K for nova shocks ( is the shock velocity here; Steinberg & Metzger 2018), which is around keV for . However, in multi-dimensional cases, thin-shell instabilities would generate a corrugated shock structure, which can significantly suppress the thermal X-rays radiated from the shocks (Steinberg & Metzger 2018). This suppression mechanism could also explain the low X-ray-to--ray flux ratio of V549 Vel. In the quasi-simultaneous Swift observation, V549 Vel showed a plasma temperature of keV that is a few times lower than the value expected for a planar shock (i.e., keV), supporting the scenario. Considering also the fact that all the three Fermi-detected novae that were observed (quasi-)simultaneously in X-rays and -rays have similar low X-ray fluxes, it is likely that the X-ray suppression is very common in the nova shocks that radiate observable -rays.
Some of the above arguments are in part based on a marginal Fermi-LAT detection of V549 Vel (i.e., ). Because of the low significance, the -ray flux inferred by the likelihood analysis could be inaccurate. If the detection is not real, the actual -ray flux would be much lower and the X-ray luminosity could be more consistent with the theoretical prediction with no suppression. Unfortunately, the quasi-simultaneous Swift data was the first X-ray data taken for V549 Vel, and therefore no further X-ray constraint can be placed on the system when it was brighter in -rays.
Another interesting X-ray property of V549 Vel is the low value observed during the -ray active phase (i.e., cm-2) compared to that of V5855 Sgr and V906 Car, which are up to cm-2. In Metzger et al. (2014), internal shocks are formed when a fast nova outflow interacts with a dense external shell (DES). In the case of classical novae (e.g., ASASSN-16ma Li et al. 2017b), the DES usually refers to a slow and dense outflow launched during the earlier phase in the eruption (Metzger et al. 2015). We argue that the much lower of V549 Vel implies a very different physical origin of the DES in the system (i.e., not a slow ejecta). It could be related to the ambient dust that causes the IR excess found in the SED of the progenitor (Figure 3; see §4), which will be discussed in §6.4.
6.2. Uncorrelated optical and -ray light curves
In ASASSN-16ma, Li et al. (2017b) found a strong correlation between the optical and -ray light curves, which shows the dominance of the shock emission in the optical band (see also the analysis and discussion in Munari et al. 2017). The recent Fermi-LAT and BRITE (Pablo et al. 2016) observations of V906 Car (also known as ASASSN-18fv) confirmed such a correlation, and hence, showed that the shock optical emission is common in nova eruptions (Aydi et al. 2020). Using the Fermi-LAT observation and the photometric data from ANS, we have made a direct comparison between the -ray and bolometric corrected optical light curves (Figure 1). Unlike ASASSN-16ma and V906 Car, the emission of V549 Vel in the energy bands are not correlated at all. The deviation is particularly clear in the first month since the explosion (i.e., about MJD 58020–58030 in Figure 1), where two bright optical flares were observed but no significant -ray emission is detected during the periods. Although there was a daily Fermi-LAT detection on MJD 58037, it sits right at the local minimum between the two optical flares and does not look like to be associated with the optical flux.
The uncorrelated optical and -ray light curves of V549 Vel indicates that the majority of the optical emission is not shock-powered. We speculate that the shocks still emitted optical emission, but the flux was just too weak to take over in the band.
When the nova was optically fainter in MJD 58037 and 58050–58070, the average -ray emission was in the order of % of the optical flux, which is comparable to the AAVSO optical and Fermi-LAT -ray observations of ASASSN-16ma that finds (Li et al. 2017b). The shock emission could contribute significantly to the observed ANS optical light curve in these time intervals, during which a correlation between the optical and -ray light curves could be possibly observed. But still, no obvious correlation can be seen in the period, either because the S/N of the LAT data is too low, or the actual shock emission fraction was much higher than % in -rays (i.e., ).
6.3. The Gaia distance measurement
The pre-nova Gaia parallax measurement of V549 Vel indicates that the nova could be as nearby as –1050 pc (90% Bayesian credible interval), with a posterior mode of pc, to us (Bailer-Jones et al. 2018). Adopting pc, the Gaia counterpart could be a low-mass star of G type (we caution that the result is highly sensitive to the extinction as well as the SED model adopted). At the same distance, the supersoft X-ray emission observed by Swift-XRT would have a blackbody size of cm in radius, which is fully consistent with that of some well-known systems, e.g., RS Oph with cm observed in the 2006 outburst (Osborne et al. 2011; note also that, if cm presented in §5 is considered, a greater distance to V549 Vel could also lead to a consistent result). All these observational facts are suggestive of a nearby classical nova residing within 1 kpc of the Sun.
On the other hand, the maximum magnitude of V549 Vel in the ANS light curve is too faint for a regular nova at pc. In addition, given the presumed proximity, the foreground Galactic extinction should be low (e.g., , estimated by the Stilism 3D dust map; Lallement et al. 2014; Capitanio et al. 2017), contradicting the reddening of derived by the previous analyses.
The reliability of the distance measurement is certainly a major factor on the issue. As mentioned in §4, there is a large excess noise of mas in the standard five-parameter astrometric solution of V549 Vel (i.e., positions, proper motions, and parallax; see the sections 3.6 and 5.1.2 of Lindegren et al. 2012 for details), indicating a large discrepancy between the data and the solution.
In Gaia DR2, all the cataloged sources were assumed to be single stars, and therefore astrometric excess noises can be found in unresolved binaries due to the orbital motions (Lindegren et al. 2018). Yet, for pc, mas is equivalent to 380, which is too large for the orbit of a CV (i.e., in the order of ). Alternatively, the progenitor could be a symbiotic binary located at a much farther away distance, and the obtained Gaia parallax is merely the result of the orbital motion of the giant companion. In this scenario, the tensions regarding the faintness of the nova and the large extinction observed would be immediately relieved either. However, if the distance to the nova is, e.g., kpc (to make the radius of the giant as ), mas and mas will refer to and , which are also too large for a typical symbiotic binary (the projected size is smaller than a few hundred with orbital periods of 200–1000 days; see, e.g., Mikołajewska 2003). In some extreme symbiotic systems, the orbital sizes can reach 10,000 (e.g., V407 Cyg; Hinkle et al. 2013; Giroletti et al. 2020), but their orbital periods are too long (i.e., years) to mimic the parallax effect that is on a yearly time-scale.
Another possibility is that the astrometric excess noise is not due to the binary nature of the system, but instead, because of the extended feature that we have observed in the WISE data. Assuming pc, the feature would have a radius of , which is more comparable to the excess noise. It is possible that the scattered light from the warm dust affect the point spread function (PSF) of V549 Vel’s progenitor to cause some of the excess noise, although the significance of the effect is unclear.
The Gaia DR2 parallax for V549 Vel is noisy, yet some possible scenarios for the origin of the astrometric excess noise are consistent with a nearby distance. Depending on the distance, V549 Vel would be a rare sub-luminous -ray nova or a more ordinary symbiotic system. The former case, which needs further investigations on the implications, will be discussed in the next section (with pc as a reference).
6.4. If V549 Vel is nearby
| \topruleName | Distance estimation method | Distance | 222 erg s-1, which is the -ray luminosity of V549 Vel assuming pc. | References | |
|---|---|---|---|---|---|
| (kpc) | ( erg s-1) | ||||
| V5668 Sgr | NIR analysis on the dust shell | 2.0 | 8.5 | Cheung et al. (2016); Banerjee et al. (2016) | |
| V959 Mon | High-resolution radio imaging | 1.4 | 16 | Ackermann et al. (2014); Linford et al. (2015) | |
| V1369 Cen | High-resolution spectroscopy | 2.0 | 18 | Cheung et al. (2016); Mason et al. (2018) | |
| V339 Del | Gaia Parallax: mas | 2.1 | 19 | Ackermann et al. (2014); Schaefer (2018) | |
| Nova Ret 2020 | Gaia Parallax: mas | 2.7 | 53 | Li et al. (2020); Bailer-Jones et al. (2018) | |
| V407 Cyg | Secondary star classification | 2.7 | 90 | Ackermann et al. (2014); Munari et al. (1990) | |
| V5855 Sgr | Magnitude on day 15 after peak | 4.5 | 201 | Nelson et al. (2019) | |
| V5856 Sgr | Maximum magnitude-rate of decline | 4.2 | 232 | Li et al. (2017b) | |
| V906 Car | Reddening study | 4.0 | 490 | Aydi et al. (2020) | |
| V1324 Sco | Reddening study | Ackermann et al. (2014); Finzell et al. (2015) | |||
| V392 Per | Gaia Parallax: mas | 4.2 | 1080 | Li et al. (2018); Schaefer (2018) |
Since the Galactic foreground extinction should be low as mentioned in the previous section, the relatively high reddening observed in V549 Vel implies a high intrinsic extinction that is possibly related to the warm dust gas detected in the pre-nova WISE observations.
At pc, the marginally-detected -ray counterpart would have a very low luminosity of erg s-1 compared to other LAT-detected novae that typically radiate at erg s-1 (Table LABEL:tab:Lg). Among all the -ray novae with estimated distances in the literature, V5668 Sgr is the least luminous -ray nova before V549 Vel, but its luminosity is still nearly an order of magnitude higher than that of V549 Vel. Even if kpc is adopted for V549 Vel, the luminosity of V5668 Sgr is still 2.5 times higher. The sub-luminous -ray emission of V549 Vel (and perhaps V5668 Sgr also) could be a hint of a slightly different scenario from that of the other brighter -ray novae. We suspect that the DES that the nova ejecta collided with is neither earlier slower ejecta (e.g., ASASSN-16ma; Li et al. 2017b) nor a pre-existing red-giant wind (e.g., V407 Cygni; Abdo et al. 2010), but the warm dust cloud surrounding the binary observed by WISE, of which the mass density is presumed to be low to produce the low -ray flux. The cloud could be a circumbinary disk, which was theoretically predicted in CVs (Spruit & Taam 2001; Taam & Spruit 2001). Interestingly, there have been hints of pre-explosion winds in some other shock-powered transient classes, e.g., luminous red novae and Type IIn supernovae (Metzger & Pejcha 2017), which might be related to the origin of the circumbinary disk. While the physical properties of the disk are mostly unclear, the hydrogen column density () of V549 Vel is around times lower than that of V5855 Sgr and V906 Car (see §6.1), likely indicating the low density of the dust cloud. Indeed, the ratio is in the same order as the observed -ray luminosity ratio between V549 Vel and the more luminous ones. The shocks that only plow through such a low-density medium are likely non-radiative. While the non-radiative shocks could still produce optical emission, the efficiency would be much lower than that of the radiative ones observed in, e.g., ASASSN-16ma (Li et al. 2017b) and V906 Car (Aydi et al. 2020; see also Metzger et al. 2014). This makes the missing correlation between the -ray and optical light curves reasonable. We suspect that the -ray spectrum of V549 Vel is also different from those originating from radiative shocks (see the “universal” -ray spectral models for novae proposed by Franckowiak et al. 2018). However, the LAT photon statistics of V549 Vel are just too poor for a meaningful comparison.
7. Summary
V549 Vel is a weak -ray nova with a poorly constrained Gaia distance of 380–1050 pc (i.e., with an astrometric excess noise of mas). This makes V549 Vel potentially the least luminous -ray nova known to date. While the nearby Gaia distance is consistent with that inferred from the supersoft X-ray emission as well as the progenitor’s observations, the peak absolute magnitude of the nova is rather dim and this likely suggests a longer distance. Future Gaia DR3 data may be able to clarify the issue.
No correlation can be found between the optical and -ray light curves taken by ANS and the Fermi-LAT, respectively. This could be due to the low S/N of the LAT data, or more likely, that the shock emission is not sufficiently strong to dominate in the optical band. In addition, the relatively low X-ray absorption during the -ray active phase (i.e., cm-2) likely indicates that the nova ejecta was interacting with a low-density medium, possibly a circumbinary disk that was detected as the IR excess in the pre-nova observations. This provides a possible explanation for the low -ray luminosity observed, if it is a nearby nova.
References
- Abdo et al. (2010) Abdo, A. A., Ackermann, M., Ajello, M., et al. 2010, Science, 329, 817
- Ackermann et al. (2014) Ackermann, M., Ajello, M., Albert, A., et al. 2014, Science, 345, 554
- Aydi et al. (2020) Aydi, E., Sokolovsky, K. V., Chomiuk, L., et al. 2020, Nature Astronomy
- Bailer-Jones et al. (2018) Bailer-Jones, C. A. L., Rybizki, J., Fouesneau, M., Mantelet, G., & Andrae, R. 2018, AJ, 156, 58
- Banerjee et al. (2016) Banerjee, D. P. K., Srivastava, M. K., Ashok, N. M., & Venkataraman, V. 2016, MNRAS, 455, L109
- Budding & Demircan (2007) Budding, E., & Demircan, O. 2007, Introduction to Astronomical Photometry, Vol. 6
- Capitanio et al. (2017) Capitanio, L., Lallement, R., Vergely, J. L., Elyajouri, M., & Monreal-Ibero, A. 2017, A&A, 606, A65
- Cardelli et al. (1989) Cardelli, J. A., Clayton, G. C., & Mathis, J. S. 1989, ApJ, 345, 245
- Cheung et al. (2016) Cheung, C. C., Jean, P., Shore, S. N., et al. 2016, ApJ, 826, 142
- Darnley & Starrfield (2018) Darnley, M. J., & Starrfield, S. 2018, Research Notes of the American Astronomical Society, 2, 24
- Finzell et al. (2015) Finzell, T., Chomiuk, L., Munari, U., & Walter, F. M. 2015, ApJ, 809, 160
- Fitzpatrick (1999) Fitzpatrick, E. L. 1999, PASP, 111, 63
- Franckowiak et al. (2018) Franckowiak, A., Jean, P., Wood, M., Cheung, C. C., & Buson, S. 2018, A&A, 609, A120
- Gaia Collaboration et al. (2018) Gaia Collaboration, Brown, A. G. A., Vallenari, A., et al. 2018, A&A, 616, A1
- Giroletti et al. (2020) Giroletti, M., Munari, U., Körding, E., et al. 2020, A&A, 638, A130
- Güver & Özel (2009) Güver, T., & Özel, F. 2009, MNRAS, 400, 2050
- Hachisu & Kato (2016) Hachisu, I., & Kato, M. 2016, ApJS, 223, 21
- Hinkle et al. (2013) Hinkle, K. H., Fekel, F. C., Joyce, R. R., & Wood, P. 2013, ApJ, 770, 28
- Kitchin (2009) Kitchin, C. R. 2009, Astrophysical Techniques, Fifth Edition (CRC Press)
- Lallement et al. (2014) Lallement, R., Vergely, J. L., Valette, B., et al. 2014, A&A, 561, A91
- Landolt (2009) Landolt, A. U. 2009, AJ, 137, 4186
- Li et al. (2017a) Li, K.-L., Chomiuk, L., & Strader, J. 2017a, The Astronomer’s Telegram, 10977, 1
- Li et al. (2018) —. 2018, The Astronomer’s Telegram, 11590, 1
- Li et al. (2020) Li, K.-L., Kong, A., Aydi, E., et al. 2020, The Astronomer’s Telegram, 13868, 1
- Li et al. (2017b) Li, K.-L., Metzger, B. D., Chomiuk, L., et al. 2017b, Nature Astronomy, 1, 697
- Lindegren et al. (2012) Lindegren, L., Lammers, U., Hobbs, D., et al. 2012, A&A, 538, A78
- Lindegren et al. (2018) Lindegren, L., Hernández, J., Bombrun, A., et al. 2018, A&A, 616, A2
- Linford et al. (2015) Linford, J. D., Ribeiro, V. A. R. M., Chomiuk, L., et al. 2015, ApJ, 805, 136
- Luckas (2017) Luckas, P. 2017, The Astronomer’s Telegram, 10795
- Mamajek et al. (2015) Mamajek, E. E., Torres, G., Prsa, A., et al. 2015, arXiv e-prints, arXiv:1510.06262
- Mason et al. (2018) Mason, E., Shore, S. N., De Gennaro Aquino, I., et al. 2018, ApJ, 853, 27
- Metzger et al. (2015) Metzger, B. D., Finzell, T., Vurm, I., et al. 2015, MNRAS, 450, 2739
- Metzger et al. (2014) Metzger, B. D., Hascoët, R., Vurm, I., et al. 2014, MNRAS, 442, 713
- Metzger & Pejcha (2017) Metzger, B. D., & Pejcha, O. 2017, MNRAS, 471, 3200
- Mikołajewska (2003) Mikołajewska, J. 2003, in Astronomical Society of the Pacific Conference Series, Vol. 303, Symbiotic Stars Probing Stellar Evolution, ed. R. L. M. Corradi, J. Mikolajewska, & T. J. Mahoney, 9
- Munari et al. (2017) Munari, U., Hambsch, F. J., & Frigo, A. 2017, MNRAS, 469, 4341
- Munari et al. (1990) Munari, U., Margoni, R., & Stagni, R. 1990, MNRAS, 242, 653
- Munari & Moretti (2012) Munari, U., & Moretti, S. 2012, Baltic Astronomy, 21, 22
- Munari et al. (2020) Munari, U., Moretti, S., & Maitan, A. 2020, A&A, 639, L10
- Munari et al. (2012) Munari, U., Bacci, S., Baldinelli, L., et al. 2012, Baltic Astronomy, 21, 13
- Nelson et al. (2019) Nelson, T., Mukai, K., Li, K.-L., et al. 2019, ApJ, 872, 86
- Orio et al. (2001) Orio, M., Covington, J., & Ögelman, H. 2001, A&A, 373, 542
- Osborne et al. (2011) Osborne, J. P., Page, K. L., Beardmore, A. P., et al. 2011, ApJ, 727, 124
- Pablo et al. (2016) Pablo, H., Whittaker, G. N., Popowicz, A., et al. 2016, PASP, 128, 125001
- Page et al. (2019) Page, K. L., Beardmore, A. P., & Osborne, J. P. 2019, arXiv e-prints, arXiv:1908.02004
- Page et al. (2018) Page, K. L., Walter, F. M., Kuin, N. P. M., Osborne, J. P., & Darnley, M. J. 2018, The Astronomer’s Telegram, 11649
- Pessev (2017) Pessev, P. 2017, The Astronomer’s Telegram, 10774
- Schaefer (2018) Schaefer, B. E. 2018, MNRAS, 481, 3033
- Shafter (2017) Shafter, A. W. 2017, ApJ, 834, 196
- Shappee et al. (2014) Shappee, B. J., Prieto, J. L., Grupe, D., et al. 2014, ApJ, 788, 48
- Skrutskie et al. (2006) Skrutskie, M. F., Cutri, R. M., Stiening, R., et al. 2006, AJ, 131, 1163
- Sokolovsky et al. (2020) Sokolovsky, K. V., Mukai, K., Chomiuk, L., et al. 2020, MNRAS, 497, 2569
- Spruit & Taam (2001) Spruit, H. C., & Taam, R. E. 2001, ApJ, 548, 900
- Stanek et al. (2017) Stanek, K. Z., Kochanek, C. S., Shields, J. V., et al. 2017, The Astronomer’s Telegram, 10772
- Steinberg & Metzger (2018) Steinberg, E., & Metzger, B. D. 2018, MNRAS, 479, 687
- Strope et al. (2010) Strope, R. J., Schaefer, B. E., & Henden, A. A. 2010, AJ, 140, 34
- Taam & Spruit (2001) Taam, R. E., & Spruit, H. C. 2001, ApJ, 561, 329
- The Fermi-LAT collaboration (2019) The Fermi-LAT collaboration. 2019, arXiv e-prints, arXiv:1902.10045
- van den Bergh & Younger (1987) van den Bergh, S., & Younger, P. F. 1987, A&AS, 70, 125
- Wright et al. (2010) Wright, E. L., Eisenhardt, P. R. M., Mainzer, A. K., et al. 2010, AJ, 140, 1868
- Yuan et al. (2013) Yuan, H. B., Liu, X. W., & Xiang, M. S. 2013, MNRAS, 430, 2188
- Zacharias et al. (2004) Zacharias, N., Monet, D. G., Levine, S. E., et al. 2004, in American Astronomical Society Meeting Abstracts, Vol. 205, American Astronomical Society Meeting Abstracts, 48.15