A Survey on Deep Learning and Explainability for Automatic Report Generation from Medical Images
Abstract.
Every year physicians face an increasing demand of image-based diagnosis from patients, a problem that can be addressed with recent artificial intelligence methods. In this context, we survey works in the area of automatic report generation from medical images, with emphasis on methods using deep neural networks, with respect to: (1) Datasets, (2) Architecture Design, (3) Explainability and (4) Evaluation Metrics. Our survey identifies interesting developments, but also remaining challenges. Among them, the current evaluation of generated reports is especially weak, since it mostly relies on traditional Natural Language Processing (NLP) metrics, which do not accurately capture medical correctness.
1. Introduction
The rapid and successful development of deep learning in research fields such as Computer Vision (Khan et al., 2020) and Natural Language Processing (NLP) (Otter et al., 2020) has found an important application area in healthcare, sustaining the promise of a future with more efficient and affordable medical care. Research over the last five years shows a clear improvement in computer-aided detection (CAD), specifically in disease prediction from medical images (Wang et al., 2016; Rajpurkar et al., 2017; Gale et al., 2017; Tsai and Tao, 2019; Hwang et al., 2019) as well as from Electronic Health Records (EHR) (Shickel et al., 2017), by using deep neural networks (DNN) and treating the problem as supervised classification or segmentation tasks. Recently, Topol (Topol, 2019) indicates that the need for diagnosis and reporting from image-based examinations far exceeds the current medical capacity of physicians in the US. This situation promotes the development of automatic image-based diagnosis as well as automatic reporting. Furthermore, the lack of specialist physicians is even more critical in resource-limited countries (Rosman et al., 2019), and therefore the expected impacts of this technology would become even more relevant.
However, the elaboration of high-quality medical reports from medical images, such as chest X-rays, computed tomography (CT) or magnetic resonance (MRI) scans, is a task that requires a trained radiologist with years of experience. In this context, deep learning (DL) combined with other Artificial Intelligence (AI) techniques appears as a viable and promising solution to alleviate the physician scarcity problem, by both automating the report generation process and enhancing radiologists’ performance through assisted report-generation. AI is set to have a significant impact on the medical imaging market and, hence, how radiologists work, with the ultimate goal of better patient outcomes. The pace of research in this area is rapid, and to the best of our knowledge, previous surveys on this topic (Pavlopoulos et al., 2019; Allaouzi et al., 2018; Monshi et al., 2020) do not cover aspects of explainability (Gunning, 2017), medical correctness and physician-centered evaluation. This article enhances these previous surveys by analyzing more than twenty additional works and datasets. Furthermore, unlike previous surveys, in this article we pay special attention to explainable AI (XAI). XAI is a set of methods and technologies, which will allow physicians to better understand the rationale behind automatic reports from black-box algorithms (Guidotti et al., 2018), potentially increasing trust for their actual clinical use.
Contribution. We summarize the state of research in automatic report generation from medical images. We perform an exhaustive review of the literature, consisting of 40 articles published in journals, conferences, and conference workshops proceedings. We first present an overview of the task (section 2), followed by the survey methodology for search and selection of papers (section 3), and the research questions driving this research (section 4). We then analyze papers regarding four dimensions: Datasets used (image modalities and clinical conditions, in section 5.1), Model Design (standard practices, input and output, visual and language components, domain knowledge, auxiliary tasks, and optimization strategies, in section 5.2), Explainability (section 5.3) and Evaluation Metrics (section 5.4). We also compare model performance of several articles (section 5.5), identifying unsolved challenges across all reviewed papers and proposing potential avenues for future research (section 6). Lastly, we discuss the limitations of this work (section 7) and offer the main conclusions (section 8). Our survey provides valuable insights to guide future research on automatic report generation from medical images.
2. Task Overview
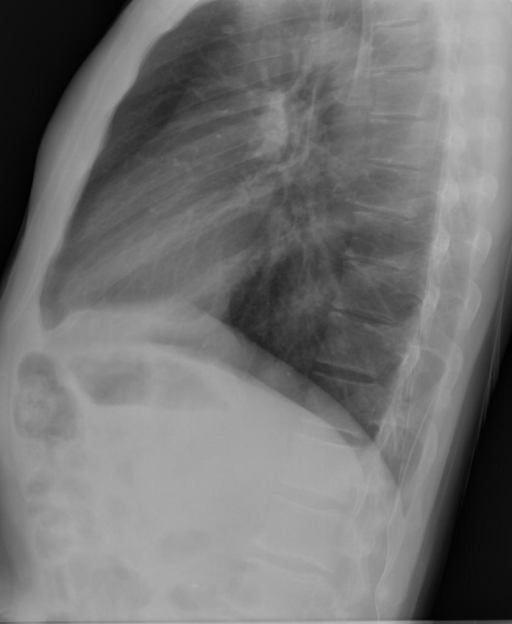
From a purely computational perspective, the following is the main task addressed by most articles analyzed in this survey: given as input one or more medical images of a patient, a text report is output that is as similar as possible to one generated by a radiologist. From a machine learning point of view, creating a system that performs such a task would require learning a generative model from instances of reports written by radiologists. Figure 1 presents one example of such a report, taken from the IU X-ray dataset (Demner-Fushman et al., 2015). We see two input X-ray images (frontal and lateral), and below them some annotations (Tags) –some manually annotated by a radiologist and others automatically annotated–, and on the right side the report with four different sections (comparison, indication, findings, and impression). If we consider the clinical workflow of generating a medical imaging report, several aspects should be taken into account before diving into a concrete implementation.
  Manual tags: Calcified Granuloma/lung/upper lobe/right
Automatic tags: Calcified granuloma
Manual tags: Calcified Granuloma/lung/upper lobe/right
Automatic tags: Calcified granuloma
|
Comparison: Chest radiographs XXXX. Indication: XXXX-year-old male, chest pain. Findings: The cardiomediastinal silhouette is within normal limits for size and contour. The lungs are normally inflated without evidence of focal airspace disease, pleural effusion, or pneumothorax. Stable calcified granuloma within the right upper lung. No acute bone abnormality. Impression: No acute cardiopulmonary process. |
Frontal and lateral chest x-rays, manually and automatically annotated tags, and a written report with four sections.
The first aspect is considering additional patient information in the process of report generation. Most of the time, the physician asking for medical imaging is the primary care physician or a medical specialist. This implies that when radiologists write a report, they generally have patient-relevant clinical information, usually provided in the section Indication as shown in Figure 1. Also, the Comparison section can provide information of a serial follow-up procedure, to evaluate the evolution of a patient over time (e.g., aneurysm, congenital heart disease). Then, one decision can be whether or not to use these Indication and Comparison data to generate the sections Findings, Impression, or both of them.
Second, the model for report generation should consider the diversity on medical images as well as body regions and conditions. There are several types of medical images, such as X-rays, CT, MRI, PET and SPECT. This implies that a model for text report generation that deals with only one type of input medical image might not solve it for other types. Also, ideally, a model should be able to generate reports from different parts of the human anatomy and diverse medical conditions. To adequately achieve this task, different body regions must have a balanced and sizable training set. Many works surveyed in this article focus on one specific part of the body and particular illnesses which limits the applicability of these methods to generalize to all possible diagnosis tasks.
Lastly, even if an AI system has perfect report generation accuracy, we might wonder if we can trust a machine in such a critical domain. One of the reasons for preferring a radiologist rather than an automated, highly accurate AI system is the chance of understanding the rationale behind the findings and impressions. In this sense, explainable AI (Gunning, 2017) is of great importance in securing their adoption in a clinical setting.
3. Survey Methodology: Search and selection of papers
To collect the papers reviewed, we performed three main steps: retrieval, selection, and exclusion. We further describe each step in the following paragraphs.
Study retrieval. To retrieve the articles we used seven search engines, namely Google Scholar, PubMed, Scopus, ACM Digital Library, Web of Knowledge, IEEE Xplore and Springer; and two specific queries, plus other more relaxed queries, described in Table 1. The relaxed queries returned articles already found with the two main queries. In this step we only considered journals, conference and conference workshop proceedings.
Study selection. Given the query results, a selection was performed applying inclusion criteria by reading title, abstract, and keywords of each paper. If there was uncertainty after reading these sections, we included it for revision and decided afterward if it should be excluded with exclusion criteria. The inclusion criteria were the following: at least a part of the study focused on report generation from medical images. The images can be from any kind (e.g., X-ray, MRI scans, CT scans), must be from humans, and may include one or more pathologies of any type111In practice, most datasets reviewed present one or more pathologies, since the detection of medical conditions is one of the main motivations of these studies.. The report must be in natural language form, comprising at least one or more sentences, and must be automatically or semi-automatically generated by a computational system that employs a DL technique. Note that the method may contain steps that do not involve DL, such as rule-based decisions. The system must receive as input one or more medical images, and it also might receive additional input, such as patient clinical history. A semi-automated system may include a human in the process, expressly, by using additional input provided by the human. We included 45 works in total.
Study exclusion. After thoroughly reading each paper selected, we used two exclusion criteria to discard works that were not relevant for this survey. First, if the paper did not propose a specific computational approach to solve the report generation problem, for example, if presented a web application using existing methods, or presented an assessment of feasibility. Second, if the task being addressed was different from natural language report generation from medical images, for example, report summarizing, disease classification from images, medical image segmentation, or any others. We ruled out 5 works with these exclusion criteria, leaving a total of 40 papers. The amount of papers found in each step is detailed in Table 1.
| Query | Google Scholar | PubMed | Scopus | ACM | WoK | IEEE Xplore | Springer | Total |
| 1 | 32 | 1 | 19 | 2 | 9 | 7 | 13 | 34 |
| 2 | 21 | 2 | 20 | 2 | 11 | 3 | 18 | 37 |
| Selected with inclusion criteria (all queries) | 45 | |||||||
| Discarded with exclusion criteria (Hicks et al., 2018; Wang et al., 2019; Akazawa et al., 2019; Wu et al., 2018; Loveymi et al., 2020) | 5 | |||||||
| Total articles (Jing et al., 2018; Liu et al., 2019; Huang et al., 2019; Yuan et al., 2019; Li et al., 2018, 2019b; Wang et al., 2018; Xue et al., 2018; Zhang et al., 2017a; Li et al., 2019a; Xiong et al., 2019; Singh et al., 2019; Maksoud et al., 2019; Gale et al., 2019; Tian et al., 2018; Gu et al., 2019; Yin et al., 2019; Tian et al., 2019; Ma et al., 2018; Alsharid et al., 2019; Gasimova, 2019; Gajbhiye et al., 2020; Harzig et al., 2019a; Biswal et al., 2020; Xie et al., 2019; Zeng et al., 2018; Harzig et al., 2019b; Xue and Huang, 2019; Sun et al., 2019; Zhang et al., 2020b; Han et al., 2018; Li and Hong, 2019; Jing et al., 2019; Shin et al., 2016; Hasan et al., 2018b; Shin et al., 2016; Zhang et al., 2017a; Zeng et al., 2018; Kisilev et al., 2016; Moradi et al., 2016; Wu et al., 2017; Spinks and Moens, 2019; Zeng et al., 2020) | 40 | |||||||
Query 1: (medical OR medicine OR health) AND ”report generation” AND (images OR image).
Query 2: (medical OR medicine OR health) AND (images OR image) AND (report OR diagnostic OR description OR caption) AND (generation OR automatic) in ABSTRACT.
Relaxed queries: (medical report generation), (medical report image), (diagnostic captioning).
4. Research Questions
This survey aims to answer the following research questions regarding the task of natural language report generation from medical images:
-
(1)
What datasets are used in this area? What diseases and imaging techniques are considered?
-
(2)
What deep learning methods are the most commonly employed?
-
(3)
What explainability or interpretability techniques are used?
-
(4)
How are the proposed models evaluated? What metrics are used?
-
(5)
How is the performance of the automatic methods? Which method can be considered state of the art or showing the best performance?
-
(6)
What are the main unsolved challenges? What are the potential avenues for future work?
5. Analysis of papers reviewed
5.1. Datasets
We identify 18 report datasets containing images and reports written by experts, and 9 classification datasets, which provide an image and the presence or absence of a list of abnormalities. Most of the collections are publicly available (10 and 8 report and classification datasets, respectively), while the rest are proprietary. In most cases, the datasets focus on one or more pathologies, and include both samples with presence and absence of these. Table 2 presents the main characteristics for the public collections, including a list of papers that used them. We next discuss the main remarks regarding report and classification datasets.
| Dataset | Year | Image Type | # images | # reports | # patients | Used by papers |
| Report datasets | ||||||
| IU X-ray (Demner-Fushman et al., 2015) | 2015 | Chest X-Ray | 7,470 | 3,955 | 3,955 | (Jing et al., 2018; Liu et al., 2019; Huang et al., 2019; Yuan et al., 2019; Li et al., 2018, 2019b; Wang et al., 2018; Xue et al., 2018; Li et al., 2019a; Xiong et al., 2019; Singh et al., 2019; Yin et al., 2019; Tian et al., 2019; Gasimova, 2019; Gajbhiye et al., 2020; Harzig et al., 2019a; Biswal et al., 2020; Xie et al., 2019; Xue and Huang, 2019; Zhang et al., 2020b; Jing et al., 2019; Shin et al., 2016) |
| MIMIC-CXR (Johnson et al., 2019a, b) | 2019 | Chest X-Ray | 377,110 | 227,827 | 65,379 | (Liu et al., 2019) |
| PadChest(Bustos et al., 2019) | 2019 | Chest X-Ray | 160,868 | 109,931 | 67,625 | None |
| ImageCLEF Caption 2017 (Eickhoff et al., 2017) | 2017 | Biomedical | 184,614 | 184,614 | - | (Hasan et al., 2018b) |
| ImageCLEF Caption 2018 (García Seco de Herrera et al., 2018) | 2018 | Biomedical | 232,305 | 232,305 | - | None |
| ROCO (Pelka et al., 2018) | 2018 | Multiple radiology | 81,825 | 81,825 | - | None |
| PEIR Gross (Jing et al., 2018) | 2017 | Gross lesions | 7,442 | 7,442 | - | (Jing et al., 2018) |
| INBreast(Moreira et al., 2012) | 2012 | Mammography X-ray | 410 | 115 | 115 | (Sun et al., 2019; Li and Hong, 2019) |
| STARE (Hoover, 1975) | 1975 | Retinal fundus | 400 | 400 | - | None |
| RDIF(Maksoud et al., 2019) | 2019 | Kidney Biopsy | 1,152 | 144 | 144 | (Maksoud et al., 2019) |
| Classification datasets | ||||||
| CheXpert (Irvin et al., 2019) | 2019 | Chest X-Ray | 224,316 | 0 | 65,240 | (Yuan et al., 2019; Zhang et al., 2020b) |
| ChestX-ray14 (Wang et al., 2017) | 2017 | Chest X-Ray | 112,120 | 0 | 30,805 | (Li et al., 2019b; Wang et al., 2018; Li et al., 2019a; Xiong et al., 2019; Biswal et al., 2020; Xue and Huang, 2019; Jing et al., 2019) |
| LiTS (Christ et al., 2017) | 2017 | Liver CT scans | 200 | 0 | - | (Tian et al., 2018) |
| ACM Biomedia 2019 (Hicks et al., 2019) | 2019 | Gastrointestinal tract | 14,033 | 0 | - | (Harzig et al., 2019b) |
| DIARETDB0 (Kauppi et al., 2006) | 2006 | Retinal fundus | 130 | 0 | - | (Wu et al., 2017) |
| DIARETDB1 (Kälviäinen and Uusitalo, 2007) | 2007 | Retinal fundus | 89 | 0 | - | (Wu et al., 2017) |
| Messidor (Decencière et al., 2014; Abràmoff et al., 2013) | 2013 | Retinal fundus | 1,748 | 0 | 874 | (Wu et al., 2017) |
| DDSM (Heath et al., 2001) | 2001 | Mammography X-ray | 10,480 | 0 | - | (Kisilev et al., 2016) |
The third column in Table 2 lists the image modalities for each dataset, showing chest X-rays concentrates most of the efforts in report datasets (Demner-Fushman et al., 2015; Johnson et al., 2019b; Bustos et al., 2019; Li et al., 2018; Gu et al., 2019), though there are also datasets with biomedical images from varied types (Eickhoff et al., 2017; García Seco de Herrera et al., 2018; Pelka et al., 2018; Jing et al., 2018), mammography (Moreira et al., 2012) and hip X-rays (Gale et al., 2017), ultrasound images (Alsharid et al., 2019; Zeng et al., 2018), retinal images (Hoover, 1975), doppler echocardiographies (Moradi et al., 2016), cervical images (Ma et al., 2018), and kidney (Maksoud et al., 2019) and bladder biopsies (Zhang et al., 2017a). This adds an extra challenge, since different kinds of exams may need different solutions, as the clinical conditions will be diverse. For example, a fundus retinal image may differ significantly from a chest X-ray; or a radiologist analyzing an X-ray may follow a different procedure than a pathologist reading a biopsy.
From the public report datasets, IU X-ray (Demner-Fushman et al., 2015) is the most commonly used, consisting of 7,470 frontal and lateral chest X-rays and 3,955 reports. Additionally, each report was manually annotated with Medical Subject Heading (MeSH)222https://www.nlm.nih.gov/mesh/meshhome.html (Rogers, 1963) and RadLex (Langlotz, 2006) terms, and automatically annotated with MeSH terms using the MTI (Mork et al., 2013) system plus the negation tool from MetaMap (Aronson and Lang, 2010). Figure 1 shows a sample image and report from this dataset. Note that for deep learning methods, the amount of data may seem insufficient, compared to general domain datasets with millions of samples, such as ImageNet (Deng et al., 2009). This issue could be addressed with pre-training or data augmentation techniques. Also, this may be partially solved with the more recent datasets MIMIC-CXR (Johnson et al., 2019b) or PadChest (Bustos et al., 2019), which contain 377,110 and 160,868 images respectively, but have not been widely used yet.
All report datasets include images and reports, and most of them also include labels for each report. Furthermore, INbreast (Moreira et al., 2012) includes contours locating the labels in the images, the Ultrasound collection (Zeng et al., 2018, 2020) includes bounding boxes locating organs, and IU X-ray (Demner-Fushman et al., 2015) and RDIF (Maksoud et al., 2019) include additional text written by the physician who requested the exam. The complete detail of additional information is shown in Table 9 in appendix 9.1. This information can be leveraged as a supplementary context to further improve the system performance. On the one hand, the labels and image localization can be used to design auxiliary tasks (see section 5.2.5), and to further evaluate the text generation process (see section 5.4). On the other hand, the indication may contain additional information not present in the image, such as a patient’s previous condition, which in some cases may be essential to address the task (Maksoud et al., 2019).
Lastly, many works use classification datasets, which do not provide a report for each image, but a set of clinical conditions or abnormalities present or absent in the image. In most cases, this kind of information is used to perform image classification as pre-training, an intermediate, or an auxiliary task to generate the report. One remarkable case is the CheXpert dataset (Irvin et al., 2019), which contains 224,316 images, and was also presented with the CheXpert labeler, an automatic rule-based tool that annotates 14 labels (abnormalities) as present, absent or uncertain from the natural language reports. This tool was used to label the images from the dataset, is also used in MIMIC-CXR (Johnson et al., 2019b) to tag the reports, and in some works to evaluate the generated reports, as discussed in the Metrics section (5.4). Notice the classification dataset list is not comprehensive, as it only includes datasets that were used in at least one of the reviewed works.
Synthesis
The datasets cover multiple image modalities and body parts, though most efforts focus on chest X-rays. This opens a potential research avenue to explore other image types and diseases, using existing solutions or raising new methods. Additionally, most collections provide valuable supplementary information, such as abnormality tags and/or localization, which can be used to design auxiliary tasks and to evaluate the performance.
5.2. Model Design
In this section, we present an analysis of existent DL model designs, starting with a general overview of common design practices. Most models in the literature follow a standard design pattern. There is a visual component consisting at its core of a Convolutional Neural Network (CNN) (Krizhevsky et al., 2012) that processes one or more input images in order to extract visual features. Then, a language component follows, typically based on well-known NLP neural architectures (e.g., LSTM (Hochreiter and Schmidhuber, 1997), BiLSTM (Graves and Schmidhuber, 2005), GRU (Chung et al., 2014), Transformer (Vaswani et al., 2017)) responsible for text processing and report generation. Also, a widespread practice for the language component is to retrieve the visual information in an adaptive manner via an attention mechanism, as the report is written. Many papers follow variations of this pattern inspired by influential works from the image captioning domain (Vinyals et al., 2015; Xu et al., 2015), which are frequently cited and used as baselines. Optionally, some models receive or generate additional input or output, and a few models incorporate some form of domain knowledge explicitly in the generation process. Figure 2 presents a summary illustration of a general model architecture found in the literature. Next, we analyze model designs according to 6 dimensions: (1) input and output, (2) visual component, (3) language component, (4) domain knowledge, (5) auxiliary tasks and (6) optimization strategies.
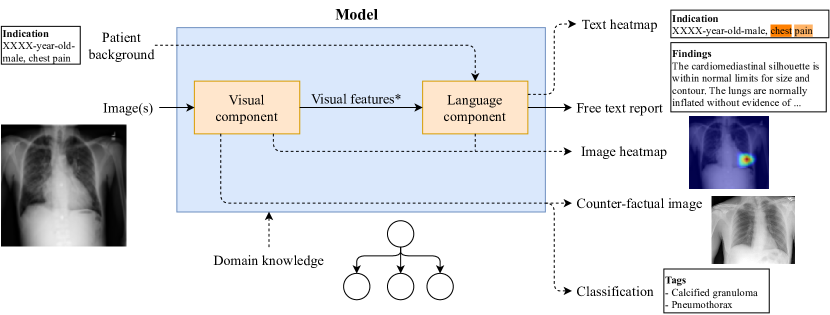
General model architecture found in the literature review. The model consists of a visual and a language component. There are two possible inputs, image(s) and patient background; and five possible outputs, free text report, a heatmap over the input text, a heatmap over the input image, a counter-factual image, and classification output. Additionally, explicit domain knowledge can be incorporated in the model.
5.2.1. Input and Output
| Category | Value or Type | Used by papers |
| Input | ||
| Image Type | Chest X-Ray | (Jing et al., 2018; Liu et al., 2019; Huang et al., 2019; Yuan et al., 2019; Li et al., 2018, 2019b; Wang et al., 2018; Xue et al., 2018; Li et al., 2019a; Xiong et al., 2019; Singh et al., 2019; Gu et al., 2019; Yin et al., 2019; Tian et al., 2019; Gasimova, 2019; Gajbhiye et al., 2020; Harzig et al., 2019a; Biswal et al., 2020; Xie et al., 2019; Xue and Huang, 2019; Zhang et al., 2020b; Jing et al., 2019; Shin et al., 2016; Spinks and Moens, 2019) |
| Mammography X-ray | (Sun et al., 2019; Li and Hong, 2019; Kisilev et al., 2016) | |
| Hip X-Ray | (Gale et al., 2019) | |
| Ultrasound video frames | (Alsharid et al., 2019; Zeng et al., 2018; Kisilev et al., 2016; Zeng et al., 2020) | |
| CW Doppler echocardiography | (Moradi et al., 2016) | |
| Gastrointestinal tract examination frames | (Harzig et al., 2019b) | |
| Gross lesions | (Jing et al., 2018) | |
| Bladder biopsy | (Zhang et al., 2017a) | |
| Kidney biopsy | (Maksoud et al., 2019) | |
| Liver tumor CT scans | (Tian et al., 2018) | |
| Cervical neoplasm WSI | (Ma et al., 2018) | |
| Spine MRI | (Han et al., 2018) | |
| Fundus retinal images | (Wu et al., 2017) | |
| Biomedical images | (Hasan et al., 2018b) | |
| Number of images | 1 | (Jing et al., 2018; Liu et al., 2019; Huang et al., 2019; Wang et al., 2018; Zhang et al., 2017a; Li et al., 2019a; Xiong et al., 2019; Singh et al., 2019; Gale et al., 2019; Gu et al., 2019; Yin et al., 2019; Tian et al., 2019; Ma et al., 2018; Alsharid et al., 2019; Gasimova, 2019; Gajbhiye et al., 2020; Harzig et al., 2019a; Biswal et al., 2020; Zeng et al., 2018; Harzig et al., 2019b; Xue and Huang, 2019; Sun et al., 2019; Han et al., 2018; Li and Hong, 2019; Jing et al., 2019; Shin et al., 2016; Hasan et al., 2018b; Kisilev et al., 2016; Moradi et al., 2016; Wu et al., 2017; Spinks and Moens, 2019; Zeng et al., 2020) |
| 2 | (Yuan et al., 2019; Li et al., 2018, 2019b; Xue et al., 2018; Xie et al., 2019; Zhang et al., 2020b) | |
| Any | (Maksoud et al., 2019; Tian et al., 2018) | |
| Text | Indication | (Huang et al., 2019; Maksoud et al., 2019) |
| Indication and findings | (Tian et al., 2019) | |
| Prefix sentence and keywords | (Biswal et al., 2020) | |
| Partial report or caption | (Alsharid et al., 2019; Gajbhiye et al., 2020) | |
| Output | ||
| Report | Generative multi-sentence (unstructured) | (Jing et al., 2018; Liu et al., 2019; Huang et al., 2019; Yuan et al., 2019; Wang et al., 2018; Xue et al., 2018; Li et al., 2019a; Xiong et al., 2019; Singh et al., 2019; Maksoud et al., 2019; Gu et al., 2019; Yin et al., 2019; Tian et al., 2019; Gajbhiye et al., 2020; Harzig et al., 2019a; Xie et al., 2019; Xue and Huang, 2019; Sun et al., 2019; Zhang et al., 2020b; Jing et al., 2019) |
| Generative multi-sentence structured | (Zhang et al., 2017a; Tian et al., 2018) | |
| Generative single-sentence | (Gale et al., 2019; Alsharid et al., 2019; Gasimova, 2019; Zeng et al., 2018; Li and Hong, 2019; Shin et al., 2016; Hasan et al., 2018b; Wu et al., 2017; Spinks and Moens, 2019; Zeng et al., 2020) | |
| Template-based | (Ma et al., 2018; Harzig et al., 2019b; Han et al., 2018; Kisilev et al., 2016; Moradi et al., 2016) | |
| Hybrid template - generation/edition | (Li et al., 2018, 2019b; Biswal et al., 2020) | |
| Classification | MeSH concepts or similar | (Jing et al., 2018; Yuan et al., 2019; Gu et al., 2019; Yin et al., 2019; Tian et al., 2019; Harzig et al., 2019a, b; Sun et al., 2019; Shin et al., 2016) |
| Abnormalities/diseases presence or absence | (Li et al., 2019b; Wang et al., 2018; Li et al., 2019a; Xiong et al., 2019; Biswal et al., 2020; Zeng et al., 2018; Zhang et al., 2020b; Jing et al., 2019; Spinks and Moens, 2019; Zeng et al., 2020) | |
| Abnormalities/diseases characterization or severity level | (Zhang et al., 2017a; Gale et al., 2019; Ma et al., 2018; Kisilev et al., 2016) | |
| Body parts or organs | (Alsharid et al., 2019; Zeng et al., 2018; Moradi et al., 2016; Zeng et al., 2020) | |
| Image modality | (Hasan et al., 2018b) | |
| Normal or abnormal sentence | (Harzig et al., 2019a; Xie et al., 2019; Jing et al., 2019) | |
| Image Heatmap | Attention-based per word | (Liu et al., 2019; Wang et al., 2018; Zhang et al., 2017a) |
| Attention-based per sentence | (Jing et al., 2018; Huang et al., 2019; Xue et al., 2018; Xue and Huang, 2019) | |
| Attention-based per report | (Li et al., 2019b) | |
| CAM (Zhou et al., 2016) | (Ma et al., 2018; Harzig et al., 2019b) | |
| Grad-CAM (Selvaraju et al., 2017) | (Yuan et al., 2019; Li et al., 2019a) | |
| SmoothGrad (Smilkov et al., 2017) | (Gale et al., 2019) | |
| Activation-based attention (Komodakis and Zagoruyko, 2017) | (Spinks and Moens, 2019) | |
| Bounding Box (Faster R-CNN (Ren et al., 2015)) | (Zeng et al., 2020; Kisilev et al., 2016) | |
| Disease and body part pixel-level classification | (Tian et al., 2018; Han et al., 2018) | |
| Text Heatmap | Attention based per word | (Huang et al., 2019) |
| Others | Counter-factual example generation | (Spinks and Moens, 2019) |
Table 3 presents a summary of this analysis.
Input. With respect to image type, most papers (24) used chest X-rays, whereas the other papers are more or less equally distributed over other image types. A total of 32 models receive a single image (e.g. a single chest X-ray view), 6 models receive 2 images (both frontal and lateral chest X-ray views), and 2 models receive an arbitrary number of images (e.g. multi-slice abdominal CT scans). Most models in the literature only handle visual input. However, 6 works (Huang et al., 2019; Maksoud et al., 2019; Tian et al., 2019; Biswal et al., 2020; Alsharid et al., 2019; Gajbhiye et al., 2020) explored the use of complementary input text, reporting performance gains in most cases. For example, two works (Huang et al., 2019; Maksoud et al., 2019) encode an indication paragraph with a BiLSTM. Similarly, MTMA (Tian et al., 2019) encodes the report’s indication and findings sections with a BiLSTM per sentence first, and then a LSTM produces a final vector representation. Similarly, two works (Alsharid et al., 2019; Gajbhiye et al., 2020) use LSTM/BiLSTM to encode a partial report or caption as input, in order to predict the next word. Unlike other works, CLARA (Biswal et al., 2020) uses a software package, Lucene (Branko et al., 2010), to perform text-based retrieval of report templates. The input text is processed by Lucene as a search query, and the retrieved templates are paraphrased by an encoder-decoder network to generate the final report.
Output. All models output a natural language report. According to the extension of the report and the general strategy used to produce it, we group papers into five categories: (1) Generative multi-sentence (unstructured): these models generate a multi-sentence report, word by word, with freedom to decide the number of sentences and the words in each sentence. (2) Generative multi-sentence structured: similar to the previous category, but always output a fixed number of sentences, and each sentence always has a pre-defined topic. These models are designed for datasets where reports follow a rigid structure. (3) Generative single-sentence: generate a report word by word, but only output a single sentence. These models are designed for datasets with simple one-sentence reports. (4) Template-based: use human-designed templates to produce the report, for example performing a classification task followed by if-then rules, template selection and template filling. This simplifies the report generation task for the model, at the expense of making it less flexible and requiring the human designing of templates and rules. And lastly (5) Hybrid template - generation/edition: use templates and also have the freedom to generate sentences word by word. This can be accomplished by choosing between a template or generating a sentence from scratch (Li et al., 2018), or by editing/paraphrasing a previously selected template (Li et al., 2019b; Biswal et al., 2020).
In addition to the report itself, many models also output complementary classification predictions, such as presence or absence of abnormalities or diseases, MeSH concepts, body parts or organs, among others. These are often referred to as labels or tags, and are commonly used in the language component, as will be discussed in section 5.2.3. Many models can also output heatmaps over an image highlighting relevant regions using different techniques, such as explicit visual attention weights computed during report generation, saliency maps methods (e.g., CAM, Grad-CAM, SmoothGrad or activation-based attention), bounding box regression, and pixel-level classification (image segmentation). Also, one model (Huang et al., 2019) can output a heatmap over its input text and one model (Spinks and Moens, 2019) can generate a counter-factual example to justify its decision. We will discuss all these outputs more in detail and their use in the explainability section (5.3).
5.2.2. Visual Component
The most important observation is that all surveyed works use CNNs to process the input images. This is not surprising since CNNs have dominated the state of the art in computer vision for several years (Khan et al., 2020). The typical visual processing pipeline consists of a CNN that receives an input image and outputs a volume of feature maps of dimensions , where and denote spatial dimensions (width and height) and denotes the channel dimensions (depth or number of feature maps). These visual features are then leveraged by the language component to make decisions for report generation (e.g., which sentence to write, which template to retrieve, next word to output, etc.), typically by way of an attention mechanism.
However, some works did not strictly follow this pattern. For example, in two works (Gu et al., 2019; Sun et al., 2019) a CNN is used for multi-label classification of tags, which are then mapped to embedded vectors via embedding matrix lookup. Thus, the report generation module only has access to these tag vectors but no access to the visual features themselves. Similarly, two works (Jing et al., 2018; Yin et al., 2019) classify and look up tag embedding vectors, but unlike the previous works, the language component uses co-attention to access both tags vectors and visual features simultaneously. Their ablation analysis showed that the semantic information provided by these tags complements the visual information and improves the model’s performance in report generation. Other works (Li et al., 2019b; Zhang et al., 2020b) used graph neural networks immediately after the CNN to encode the visual information in terms of medical concepts and their relations. Thus, the language component receives the intermediate graph representation instead of the raw visual features. The ablation analysis by Zhang et al. (Zhang et al., 2020b) showed some performance gains thanks to the graph neural network. Vispi (Li et al., 2019a) implements a two-stage procedure, where two distinct CNNs are used. In the first stage a DenseNet 121 (Huang et al., 2017) classifies abnormalities in the image, and then Grad-CAM (Selvaraju et al., 2017) is used to localize and crop a region of the image for each detected class. Then, in the second stage the multiple image crops are treated as independent images and processed by a typical CNN+LSTM architecture, with ResNet 101 (He et al., 2016) as the CNN. A similar idea was followed in RTMIC (Xiong et al., 2019), where a DenseNet 121 is pretrained for classification in ChestX-ray14 (Wang et al., 2017) and CAM is used to get image crops for each class.
| Architecture | Used by papers |
|---|---|
| DenseNet (Huang et al., 2017) | (Liu et al., 2019; Li et al., 2019a; Xiong et al., 2019; Zhang et al., 2020b; Li et al., 2018, 2019b; Gale et al., 2019; Yin et al., 2019; Biswal et al., 2020) |
| ResNet (He et al., 2016) | (Huang et al., 2019; Yuan et al., 2019; Xue et al., 2018; Harzig et al., 2019a; Xue and Huang, 2019; Li et al., 2019a; Gu et al., 2019; Wang et al., 2018; Gasimova, 2019; Jing et al., 2019; Ma et al., 2018) |
| VGG (Simonyan and Zisserman, 2014) | (Jing et al., 2018; Hasan et al., 2018b; Maksoud et al., 2019; Alsharid et al., 2019; Gasimova, 2019; Gajbhiye et al., 2020; Zeng et al., 2018; Li and Hong, 2019; Kisilev et al., 2016; Zeng et al., 2020; Moradi et al., 2016) |
| Faster R-CNN (Ren et al., 2015) | (Kisilev et al., 2016; Zeng et al., 2020) |
| Inception V3 (Szegedy et al., 2016) | (Singh et al., 2019) |
| GoogLeNet (Szegedy et al., 2015) | (Shin et al., 2016) |
| MobileNet V2 (Howard et al., 2017) | (Harzig et al., 2019b) |
| SRN (Zhu et al., 2017a) | (Gu et al., 2019) |
| U-Net (Ronneberger et al., 2015) | (Sun et al., 2019) |
| EcNet | (Zhang et al., 2017a) |
| FCN + shallow CNN | (Tian et al., 2018) |
| RGAN | (Han et al., 2018) |
| StackGAN (Zhang et al., 2017b) (slightly modified version) | (Spinks and Moens, 2019) |
| CNN | (Tian et al., 2019; Spinks and Moens, 2019) |
| CNN (unspecified architecture) | (Xie et al., 2019; Wu et al., 2017) |
We observe a wide variety of CNN architectures used in the literature, though most works employ standard designs. Table 4 presents a summary. The most common ones are ResNet (11 works), VGG (11 works), and DenseNet (9 works). Other standard architectures used are Faster R-CNN, Inception V3, GoogLeNet, MobileNet V2, Spatial Regularization Network (SRN) and U-Net. Five works used ad hoc architectures not previously published (marked with (*) in Table 4). For example, EcNet is an ad hoc architecture used in MDNet (Zhang et al., 2017a) and was proposed as an improvement over ResNet. However, the authors acknowledged that its design resembles DenseNet, which was published the same year (2017). RGAN, proposed by Han et al. (Han et al., 2018), is a novel architecture that follows the generative adversarial network (GAN) (Goodfellow et al., 2014) approach, with a generative module comprising the encoder and decoder parts of an atrous convolution autoencoder (ACAE) with a spatial LSTM between them. Similarly, Spinks and Moens (Spinks and Moens, 2019) used a slightly modified version of a StackGAN (Zhang et al., 2017b) to learn the mapping from report encoding to chest X-ray images, and a custom CNN to learn the inverse mapping. Both are trained together, but only the latter is part of the report generation pipeline during inference.
5.2.3. Language Component
| Architecture | Used by papers |
|---|---|
| GRU | (Shin et al., 2016) |
| LSTM | (Singh et al., 2019; Gu et al., 2019; Gasimova, 2019; Zeng et al., 2018; Sun et al., 2019; Li and Hong, 2019; Shin et al., 2016; Hasan et al., 2018b; Wu et al., 2017; Zeng et al., 2020) |
| LSTM with attention | (Wang et al., 2018; Zhang et al., 2017a; Li et al., 2019a; Gale et al., 2019; Tian et al., 2018) |
| Hierarchical LSTM with attention | (Jing et al., 2018; Liu et al., 2019; Huang et al., 2019; Yuan et al., 2019; Zhang et al., 2020b; Yin et al., 2019; Tian et al., 2019) |
| Hierarchical: Sentence LSTM + Dual Word LSTM (normal/abnormal) | (Harzig et al., 2019a; Xie et al., 2019; Jing et al., 2019) |
| Recurrent BiLSTM-attention-LSTM | (Xue et al., 2018; Maksoud et al., 2019; Xue and Huang, 2019) |
| Partial report encoding + FC layer (next word) | (Alsharid et al., 2019; Gajbhiye et al., 2020) |
| Transformer | (Xiong et al., 2019) |
| ARAE | (Spinks and Moens, 2019) |
| Template based | (Ma et al., 2018; Harzig et al., 2019b; Han et al., 2018; Kisilev et al., 2016; Moradi et al., 2016) |
| Hybrid template retrieval + generation/edition | (Li et al., 2019b; Biswal et al., 2020; Li et al., 2018) |
The job of the language component is to generate the report. In contrast to the visual component, in the literature we find a greater variety of approaches and creative ideas applied to this component. Table 5 presents a high-level summary of this analysis.
The simplest approach is the use of a recurrent neural network, such as LSTM or GRU, to generate the full report word by word. Nine works (Singh et al., 2019; Gu et al., 2019; Gasimova, 2019; Zeng et al., 2018; Sun et al., 2019; Li and Hong, 2019; Hasan et al., 2018b; Wu et al., 2017; Zeng et al., 2020) used LSTM and one work (Shin et al., 2016) tried both GRU and LSTM. All these works have in common that the GRU/LSTM receives an encoding vector from the visual component at the beginning and the full report is decoded from it. This encoding vector is typically a vector of global features output by the CNN. However, two of these works (Gu et al., 2019; Sun et al., 2019) compute a weighted sum of tag embedding vectors and provide that as input to the LSTM. Five works (Wang et al., 2018; Zhang et al., 2017a; Li et al., 2019a; Gale et al., 2019; Tian et al., 2018) used LSTM enhanced with an attention mechanism. In addition to the initial input, the LSTM equipped with attention can selectively attend to visual features from the visual component at each recurrent step. This typically leads to improved performance in all papers.
A known problem for recurrent networks such as LSTM is that they are not very good at generating very long texts (Pascanu et al., 2013). This is not a worrying issue when reports are short, however, it can become one for long multi-sentence reports. Two papers (Zhang et al., 2017a; Tian et al., 2018) worked around this by generating each sentence independently with a single LSTM and then concatenating these sentences together. They accomplished this by providing the LSTM with a vector that indicates the sentence type as first input. This worked well in their case because the models were designed for structured reports, i.e., a fixed number of sentences per report and a fixed topic per sentence. Vispi (Li et al., 2019a) adopts a similar strategy: for each disease a dedicated LSTM generates the corresponding sentence, and the final report is the concatenation of them.
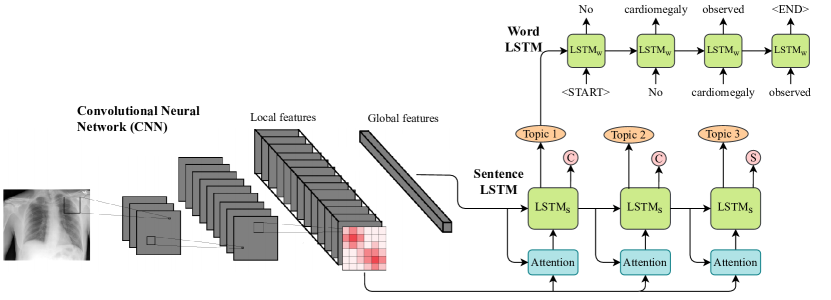
To tackle the generation of unstructured multi-sentence reports, a group of papers followed what we call the Hierarchical LSTM with attention approach: a Sentence LSTM generates a sequence of topic vectors, and a Word LSTM receives a topic vector and generates a sentence word by word. In this setting, the attention mechanism can be present at the sentence level, the word level or both. Figure 3 shows an illustrative example. Seven works (Jing et al., 2018; Liu et al., 2019; Huang et al., 2019; Yuan et al., 2019; Zhang et al., 2020b; Yin et al., 2019; Tian et al., 2019) followed this approach. A common result in these papers is that a Hierarchical LSTM yields better performance in multi-sentence report generation than a single, flat LSTM. A few papers (Harzig et al., 2019a; Xie et al., 2019; Jing et al., 2019) went one step further and replaced the normal Word LSTM with a Dual Word LSTM: the model has a gating mechanism at the sentence level that decides if the sentence will describe an abnormality (e.g., a detected cardiomegaly) or a healthy case. Thus, there are two Word LSTMs, one for normal and one for abnormal sentences. The goal is to improve the generation of abnormal sentences by having a Word LSTM that specializes in generating them. In contrast, a single Word LSTM for everything can lead to overlearning of normal sentences and underlearning of abnormal ones, as the latter are typically less frequent due to class imbalances in datasets. The ablation analyses of these works show performance gains, thanks to this approach.
Another approach for multi-sentence report generation is the Recurrent BiLSTM-attention-LSTM approach. The basic idea is to have a LSTM generate one sentence at a time, each time conditioned on a BiLSTM based encoding of the previous sentence and the output of an attention mechanism. The process is repeated recurrently sentence by sentence until the full report is generated. Three papers used this approach (Maksoud et al., 2019; Xue et al., 2018; Xue and Huang, 2019).
Two works (Alsharid et al., 2019; Gajbhiye et al., 2020) approached report generation as simply learning to predict the next word given a partial report and an image. The models have dedicated components, such as LSTM and BiLSTM, for encoding the partial report and the image, and the next word is predicted by an FC layer. This approach simplifies the task (i.e., predict the next word given everything that comes before), but in practice requires that the model be applied recurrently one word at a time to produce a full report, which has quadratic instead of linear complexity.
Only one work, RTMIC (Xiong et al., 2019), has explored the use of the Transformer (Vaswani et al., 2017) architecture for report generation. In RTMIC multiple image crops are obtained using Grad-CAM, then from each crop a feature vector is obtained, and finally a Transformer converts these vectors into a report. The paper’s results show some performance gains in CIDEr and BLEU with respect to some baselines that do not use the Transformer. Likewise, Spinks and Moens (Spinks and Moens, 2019) were the only ones to use an adversarially regularized autoencoder (ARAE) (Zhao et al., 2017) to generate reports. Their model combines an ARAE with a StackGAN and a normal CNN, achieving better performance than a convolutional caption generation baseline in several NLP metrics.
We also identify a group of papers (Ma et al., 2018; Harzig et al., 2019b; Han et al., 2018; Kisilev et al., 2016; Moradi et al., 2016) following a Template based approach. The language component in these works operates programmatically by following if-then rules or other heuristics in order to retrieve, fill and/or combine templates from a database in order to generate a report. The visual component typically outputs discrete classification labels that the language component processes programmatically. In the case of Harzig et al. 2019b (Harzig et al., 2019b), image localizations per class are also recovered using CAM (Zhou et al., 2016), and in the case of Han et al. (Han et al., 2018) the visual component outputs an image segmentation. In both cases the language component includes special localization-based rules or templates, thus incorporating location information in the generated report. Kisilev et al. (Kisilev et al., 2016) followed a different approach: a multi-layer perceptron learns to map image encodings to doc2vec (Le and Mikolov, 2014) representations of corresponding reports. During inference, the ground-truth report with the closest doc2vec representation is retrieved.
Lastly, we identify three papers (Li et al., 2019b; Biswal et al., 2020; Li et al., 2018) following the Hybrid template retrieval + generation/edition approach. These works seek to combine the benefits of templates with the flexibility of a generative module to either generate sentences from scratch or paraphrase templates as needed on a case-by-case basis. KERP (Li et al., 2019b) uses Graph Transformers (GTR) to map the visual input into a sequence of templates from a curated database. A Paraphrase GTR then maps each template to its paraphrased version. HRGR (Li et al., 2018) follows the hierarchical LSTM approach with a twist—it replaces the Word LSTM with a gate module that chooses between two options: retrieving a template or generating a sentence from scratch (via a Word LSTM). Lastly, CLARA (Biswal et al., 2020) is somewhat different, as it was designed as an interactive tool to assist a human to write reports. A human introduces anchor words and the prefix of a sentence, and Lucene (Branko et al., 2010) processes them as a query to retrieve sentence templates from a database. A sequence-to-sequence network then reads and paraphrases each sentence template to get the final report. CLARA can also operate fully automatically by receiving an empty prefix and predicting the anchor words itself. According to reported results, the model consistently achieved better performance than many baselines.
5.2.4. Domain knowledge
Although all works used datasets from the medical domain to train their models, which can be considered a form of domain knowledge transfer, some works took special steps to explicitly incorporate additional knowledge from experts into their design. Concretely, we identify two incipient trends in the application of domain knowledge: 1) the use of graph neural networks right after the CNN, providing an architectural bias to guide the model to identify medical concepts and their relations from the images; and 2) enhancing the model’s report generation with access to an external template database curated by experts.
KERP (Li et al., 2019b) incorporates knowledge at the architectural level using graph neural networks. The authors manually designed an abnormality graph and a disease graph, where each node represents an abnormality or disease, and the edges are built based on their co-occurrences in the training set. Some example abnormalities are “low lung volumes” and “enlarged heart size”, whereas diseases represent a higher level of abstraction, for example “emphysema” or “consolidation”. The information flows from image features (encoded by a CNN) to the abnormality graph, and then to the disease graph, via inter-node message passing. This biases the network to encode the visual information in terms of abnormalities, diseases and their relations. Similarly, Zhang et al. (Zhang et al., 2020b) created an observations graph, containing 20 nodes of chest abnormalities or body parts, where conditions related to the same organ or tissue are connected by edges. Their ablation analysis showed some performance gains, thanks to the graph neural network.
In seven works (Li et al., 2018, 2019b; Biswal et al., 2020; Harzig et al., 2019b; Han et al., 2018; Kisilev et al., 2016; Moradi et al., 2016) the authors provided their models with a curated set of template sentences that are further processed in the language component to output a full report. Three works (Han et al., 2018; Harzig et al., 2019b; Kisilev et al., 2016) used manually curated templates and if-then based programs to select and fill them. CLARA (Biswal et al., 2020) uses a database indexing all sentences from the training set reports for text-based retrieval, which are then paraphrased by a generative module. Similarly, KERP (Li et al., 2019b) has access to a template database mined from the training set, which are also paraphrased later. In HRGR (Li et al., 2018) the most common sentences in the datasets were mined and then manually grouped by meaning to further reduce repetitions. In this work the authors showed that HRGR learned to prefer templates about 80% of the time and only generate sentences from scratch the remaining 20%, suggesting that templates can be quite useful to generate most sentences in reports.
5.2.5. Auxiliary Tasks
Although the main objective in most papers is to learn a model for report generation from medical images, many works also include and optimize auxiliary tasks to boost their performance. A summary of these tasks is presented in Table 10 in appendix 9.2. The most common auxiliary tasks are multi-label (16 papers) and single-label (11 papers) classification. These tasks are generally intended to provide additional supervision to the model’s visual component, in order to improve the CNN’s capabilities to extract quality visual features. Some common tasks are identifying the presence or absence of different abnormalities, diseases, organs, body parts, medical concepts, detecting image modality, etc. Datasets often used for this purpose are ChestX-ray14 (Wang et al., 2017) and CheXpert (Irvin et al., 2019), where the common practice is to pretrain the CNN in those datasets before moving on to report generation. Many papers report better performance in report generation thanks to these auxiliary classification tasks. The three works (Harzig et al., 2019a; Xie et al., 2019; Jing et al., 2019) following the hierarchical approach with Dual Word LSTM used a classification task to supervise the gating mechanism that chooses between generating a normal sentence, an abnormal sentence or stopping. Two models (Tian et al., 2018; Han et al., 2018) perform a segmentation task. Tian et al. (Tian et al., 2018) trained a fully convolutional network (FCN) with segmentation masks of a liver and tumor, and Han et al. (Han et al., 2018) trained an RGAN for pixel level classification. Similarly, two models (Kisilev et al., 2016; Zeng et al., 2020) use a Faster-RCNN (Ren et al., 2015) trained for detection and classification of bounding boxes enclosing lesions or other regions of interest in the images.
Two works (Maksoud et al., 2019; Yin et al., 2019) used regularization supervision on attention weights. CORAL8 (Maksoud et al., 2019) receives regularization supervision on its visual attention weights to prevent them from degrading into uniform distribution, which would offer no advantage over average pooling. Similarly, Yin et al. (Yin et al., 2019) added two regularizations to their model’s attention weights: one on the weights over spatial visual features and another on the weights over tag embedding vectors. In both works the attention supervision provided a significant contribution to the performance.
Two works (Yin et al., 2019; Moradi et al., 2016) included a task to enforce a matching between embeddings from two different sources. Yin et al. (Yin et al., 2019) projected the topic vectors from the Sentence LSTM and the word embeddings from the respective ground-truth sentence into a common semantic space, and enforced a matching via contrastive loss (Chopra et al., 2005). This task significantly improved the Sentence LSTM’s training and the model’s overall performance. Moradi et al. (Moradi et al., 2016) trained a MLP for mapping image visual encodings (obtained by a VGG network) to the vector representation of its corresponding ground-truth report (obtained via doc2vec (Le and Mikolov, 2014), which in itself was another auxiliary task), by minimizing the Euclidean distance. The trained MLP was then used to predict doc2vec representations for unseen images and retrieve the report with the closest representation. Two works (Tian et al., 2019; Spinks and Moens, 2019) used text autoencoders, which allow learning compact representations of unlabeled data in a self-supervised manner: an encoder network maps the input into a latent representation, and a decoder network has to recover the original input back. MTMA (Tian et al., 2019) uses a BiLSTM to encode the sentences of the indication and findings sections of a report (input text), in order to generate the impression section (output). To improve the encoding quality of the BiLSTM, the authors trained the decoder branch of a hierarchical autoencoder (Li et al., 2015) to recover the original sentence from the BiLSTM encoding. The experimental results showed that the autoencoder supervision provided a significant boost to the model’s performance. Spinks and Moens (Spinks and Moens, 2019) trained an ARAE (Zhao et al., 2017) (1) to learn compact representations of reports (serving as input to a GAN that generates chest X-ray images) and (2) to recover a report given an arbitrary compact representation (used in inference mode for report generation).
Lastly, Spinks and Moens (Spinks and Moens, 2019) were the only ones to also implement cycle-consistency tasks (Zhu et al., 2017b) to train a GAN and an inverse mapping CNN together, to make both chest X-ray image generation and encoding more robust. These tasks will be further detailed in the next section.
5.2.6. Optimization Strategies
In addition to the architecture and the tasks a model can perform, a very important aspect is the optimization strategy used to learn the model’s parameters. In this section we present an analysis of the optimization strategies used in the literature. A summary of this section is presented in Table 11 in appendix 9.3.
Visual Component. We first analyze the visual component optimization, identifying three general optimization decisions. The first one is whether to use a CNN from the literature with its weights pretrained in ImageNet (Deng et al., 2009). This is a very common transfer learning practice from the computer vision literature in general (Kornblith et al., 2019), so it is natural to see it used in the medical domain too. However, it has been shown that ImageNet pretraining may not transfer as well to medical image tasks as they normally do to other domains, due to very dissimilar image distributions (Raghu et al., 2019). Therefore, a very common second decision is whether or not to train/fine-tune the visual component with auxiliary medical image tasks, such as most of the classification and segmentation tasks discussed in the previous section (5.2.5). The third decision is whether to freeze the visual component weights during report generation training or continue updating them in an end-to-end manner.
Report Generation. We identify two general optimization strategies in the literature: Teacher-forcing (TF) and Reinforcement Learning (RL). Teacher-forcing (Williams and Zipser, 1989) is by far the most common, as it is adopted by 32 papers (Jing et al., 2018; Huang et al., 2019; Yuan et al., 2019; Li et al., 2019b; Wang et al., 2018; Xue et al., 2018; Zhang et al., 2017a; Li et al., 2019a; Singh et al., 2019; Maksoud et al., 2019; Gale et al., 2019; Tian et al., 2018; Gu et al., 2019; Yin et al., 2019; Tian et al., 2019; Alsharid et al., 2019; Gasimova, 2019; Gajbhiye et al., 2020; Harzig et al., 2019a; Biswal et al., 2020; Xie et al., 2019; Zeng et al., 2018; Xue and Huang, 2019; Sun et al., 2019; Zhang et al., 2020b; Li and Hong, 2019; Jing et al., 2019; Shin et al., 2016; Hasan et al., 2018b; Wu et al., 2017; Spinks and Moens, 2019; Zeng et al., 2020). The basic idea in teacher-forcing is to train a model to predict each word of the report conditioned on the previous words, therefore learning to imitate the ground truth word by word. The model typically has a softmax layer that predicts the next word, and cross entropy is the loss function of choice to measure the error and compute gradients for backpropagation. We think teacher-forcing is so widespread in the literature because of its simplicity and general applicability, as it is agnostic to the application domain (whether it be report generation in medicine or captioning of everyday images).
In contrast, 5 works (Liu et al., 2019; Li et al., 2018; Xiong et al., 2019; Jing et al., 2019; Li and Hong, 2019) explored the use of reinforcement learning (RL) (Kaelbling et al., 1996). The main reason to use RL is the flexibility it offers to optimize non-differentiable reward functions, allowing researchers to be more creative and explore new rewards that may guide the model’s learning toward domain-specific goals of interest. For example, Liu et al. (Liu et al., 2019) used RL to train their model to optimize the weighted sum of two rewards: (1) a natural language reward (CIDEr (Vedantam et al., 2015)) and (2) a Clinically Coherent Reward (CCR), where the latter was proposed to measure the clinical accuracy of a generated report compared to a ground-truth reference using the CheXpert labeler tool (Irvin et al., 2019). Their goal was to equip their model with two skills: natural language fluency (encouraged by CIDEr) and clinical accuracy (encouraged by CCR). Other examples of the use of RL are: the direct optimization of CIDEr (Li et al., 2018; Xiong et al., 2019), particularly in the training of a complicated hybrid template-retrieval and text generation model (Li et al., 2018); directly optimizing BLEU-4 after a previous teacher-forcing warmup phase (Jing et al., 2019); and the training of the generator network of a GAN used for report generation, where the reward is provided by the discriminator network (Li and Hong, 2019).
As a side note, we would like to highlight the work by Zhang et al. (Zhang et al., 2020a) on medical report summarization (a related task where the report is the input and with no images), illustrating how RL can be used in this setting to optimize both fluency and factual correctness. As rewards they used ROUGE (Lin, 2004) and a Factual Correctness reward based on the CheXpert labeler tool (Irvin et al., 2019) (very similar to the CCR proposed by Liu et al. (Liu et al., 2019)). This work is a good example of the benefits of RL over teacher-forcing for text generation in a medical domain. The paper presents the results of a human evaluation with two board-certified radiologists and the model trained with RL achieved better results than the same model trained with teacher-forcing, and even slightly better results than the human baseline.
Other Losses or Training Strategies. This category encompasses the remaining optimization strategies found in the literature. The most important one is multitask learning (Caruana, 1997), adopted by 14 papers (Jing et al., 2018; Li et al., 2019b; Wang et al., 2018; Zhang et al., 2017a; Maksoud et al., 2019; Tian et al., 2018; Yin et al., 2019; Tian et al., 2019; Ma et al., 2018; Harzig et al., 2019a; Jing et al., 2019; Kisilev et al., 2016; Spinks and Moens, 2019; Zeng et al., 2020). The main idea is to jointly train a model in multiple complementary tasks, so that the model can learn robust parameters that perform well in all of them. Some works (Jing et al., 2018; Wang et al., 2018; Zhang et al., 2017a; Tian et al., 2018; Yin et al., 2019; Tian et al., 2019; Harzig et al., 2019a) trained the visual and language components simultaneously in multiple tasks in an end-to-end manner, i.e. report generation plus other auxiliary tasks. Other examples are the simultaneous training of object detection and attribute classification (Kisilev et al., 2016), diagnostic classification and cycle-consistency tasks (Spinks and Moens, 2019), among others. Most of these papers report benefits from training in this way.
As already discussed in section 5.2.5, two works (Maksoud et al., 2019; Yin et al., 2019) used auxiliary supervision on the attention weights of their models. These auxiliary losses were jointly optimized with the rest of the model in report generation, effectively having a regularizer effect. Yin et al. (Yin et al., 2019) are also the only ones that included an auxiliary contrastive loss (Chopra et al., 2005) to provide a direct supervision to the Sentence LSTM, thus improving their model’s performance. Notice that all these works are examples of multitask learning too. Three papers (Kisilev et al., 2016; Moradi et al., 2016; Zeng et al., 2020) used regression losses. Two of them (Kisilev et al., 2016; Zeng et al., 2020) included a bounding box regression loss as part of Faster R-CNN (Ren et al., 2015) training, and Moradi et al. (Moradi et al., 2016) included a regression loss to minimize the Euclidean distance between VGG and doc2vec embeddings. As previously discussed in section 5.2.5, another optimization strategy is the use of autoencoders for the self-supervised learning of text representations. In MTMA (Tian et al., 2019) an autoencoder was used to provide an auxiliary supervision over the BiLSTM and was jointly trained with the rest of the model in a multitask learning fashion. Spinks and Moens (Spinks and Moens, 2019) instead trained an ARAE in a first stage, then froze its weights and used the learned text embedding to support the subsequent training of a GAN.
Lastly, three works used GANs (Han et al., 2018; Li and Hong, 2019; Spinks and Moens, 2019). As mentioned when discussing RL, Li et al. (Han et al., 2018) used a GAN strategy to train their model for report generation, where the generative module generates a report and the discriminator determines whether it is real or fake. Similarly, Han et al. (Li and Hong, 2019) proposed RGAN, where the generator outputs segmentation maps from spine radiographs and the discriminator determines if a given segmentation map is real or fake. Spinks and Moens (Spinks and Moens, 2019) implemented a modified version of a StackGAN (Zhang et al., 2017b) to generate chest X-ray images from input text representations. In their case, they trained the GAN using two cycle-consistency (Zhu et al., 2017b) losses: (1) image embedding image and (2) embedding image embedding. In both cases, an auxiliary inverse mapping CNN was used to close the cycle.
Synthesis
Overall, we can observe that designing a model for report generation from medical images is a complex task that involves engineering decisions at multiple levels: inputs and outputs, visual component, language component, domain knowledge, auxiliary tasks and optimization strategies. In each of these dimensions there are different approaches adopted in the reviewed literature, and the current state of research does not allow us to recommend an “optimal model design”, mainly for reasons we will discuss in the Metrics and Performance Comparison sections (5.4 and 5.5). Nevertheless, there are valuable insights in the literature that may lead to better results, and thus are worth having in mind. For example, the use of CNNs (such as DenseNet or ResNet) as visual component and training in auxiliary medical image tasks; the use of input text alongside the images; providing the language component with tag information in addition to the visual features (e.g. medical concepts identified in the image); leveraging template databases curated with domain knowledge; or the use of multitask learning combining multiple sources of supervision. Lastly, to improve report quality from a medical perspective, the use of reinforcement learning with adequate reward functions appears as the most promising approach.
5.3. Explainability
There have been multiple attempts on providing a definition for explainability in the Explainable Artificial Intelligence (XAI) area (Reyes et al., 2020; Doshi-Velez and Kim, 2017; Lipton, 2018). For the task of report generation from medical images, we use a similar definition by Doshi-Velez and Kim (Doshi-Velez and Kim, 2017): the ability to justify an outcome in understandable terms for a human, and we use it interchangeably with the term interpretability. In this medical context, an automated system requires high explainability levels as two main facts hold: the decisions derived from the system will probably have direct consequences for patients, and the diagnosis task is not trivial and susceptible to human judgement (Reyes et al., 2020; Doshi-Velez and Kim, 2017). Furthermore, the explanation methods employed in this medical task should attempt to solve several related aspects: align with clinicians’ expectations and acquire their trust, increase system transparency, assess results quality, and allow addressing accountability, fairness and ethical concerns (Ahmad et al., 2018; Reyes et al., 2020; Tonekaboni et al., 2019).
There are many ways to address the explainability aspect of AI systems in the medical domain, as listed in the recent survey on interpretable AI for radiology by Reyes et al. (Reyes et al., 2020). Multiple categories can be identified, starting with global vs local, the former refers to explanations regarding the whole system’s operation, and the latter to explanations for one sample. For local explanations, there are different kinds of approaches, such as feature importance, concept-based, example-based, and uncertainty, to mention a few. Feature importance methods attempt to compute a level of importance for each input value, to understand which characteristics were most relevant to make a decision; for example, gradient-based methods for CNNs such as Grad-CAM (Selvaraju et al., 2017), Guided Backpropagation (Springenberg et al., 2015) or DeepLIFT (Shrikumar et al., 2017); and other techniques such as LIME (Ribeiro et al., 2016). In concept-based methods, like TCAV (Kim et al., 2018) or RCV (Graziani et al., 2018), the contributions to the prediction from multiple concepts are quantified, so the user can check if the concepts used by the model are correct. Example-based approaches present additional examples with the output, either with a similar outcome, so the user can look for a common pattern, or with an opposite outcome (counter-factual). Uncertainty methods provide the level of confidence of the model for a given prediction. For global explanations, there are sample-based approaches, such as SP-LIME (Ribeiro et al., 2016), or methods to directly increase the transparency of the system.
Despite the importance of explainability in this area, only two reviewed works focused explicitly on this topic. Gale et al. (Gale et al., 2019) proposed the automatic generation of a natural language report as an explanation for a classification task; however, their approach does not include an explanation for the report. Spinks and Moens (Spinks and Moens, 2019) present a counter-factual local explanation, as will be detailed in subsection 5.3.1. Additionally, in 29 works the model architecture generates a secondary output that can also be presented as a local explanation. We distinguish three types of outputs: classification (section 5.3.2), heatmap over the input image (section 5.3.3), and heatmap over the input text (section 5.3.4). These were already summarized in Table 3 in the Input and Output section (5.2.1). Next, the explanaibility aspects of the outputs are discussed.
5.3.1. Counter factual
Spinks and Moens (Spinks and Moens, 2019) proposed an architecture to both classify a disease and generate a caption from a chest X-ray, based on GANs and autoencoders, as detailed in the Model Design section (5.2). Thus, to provide a local explanation, at inference time the input image is encoded into a latent vector, which is used to generate a new chest X-ray and a new report, both of them subject to result in the nearest alternative classification, i.e., the nearest diagnosis. With this information, a user could compare the original X-ray with the generated image, and attempt to understand why the model has reached its decision.
5.3.2. Classification
As explained in the Auxiliary Tasks section (5.2.5), many deep learning architectures include multi-label classification to improve performance, providing a set of classified concepts as secondary output. Even though in most papers this kind of output is not presented as an explanation of the report, we consider that its nature could improve the transparency of the model, which is an important way of improving the interpretability in a medical context (Tonekaboni et al., 2019). By providing this detection information from an intermediate step of the model’s process, an expert could further understand the internal process, validate the decision with their domain knowledge and calibrate their trust in the system.
As shown in Table 3 from section 5.2.1, the terms classified are very diverse. Some works classify very broad concepts, such as body parts or organs (Zeng et al., 2018; Alsharid et al., 2019; Moradi et al., 2016; Zeng et al., 2020), or image modality (Hasan et al., 2018b). Other works perform a more specific classification, such as diseases or abnormalities (Zeng et al., 2018; Wang et al., 2018; Biswal et al., 2020; Li et al., 2019b; Zhang et al., 2020b; Zeng et al., 2020; Spinks and Moens, 2019; Kisilev et al., 2016), or a normal or abnormal status at sentence level (Xie et al., 2019). Lastly, several works (Harzig et al., 2019a; Jing et al., 2018; Tian et al., 2019; Gu et al., 2019; Yin et al., 2019; Sun et al., 2019; Yuan et al., 2019; Shin et al., 2016) classify over a subset of MeSH terms or similar, which may contain a mix of general broad medical concepts and specific abnormalities or conditions. We believe that this additional output would be useful for an expert, though the specific concepts should provide much richer information. If the classification is more specific, the user will be able to validate on a much narrower scope the system’s performance.
5.3.3. Image heatmap
In the papers reviewed, there are three different approaches to generating heatmaps over the input image, each of them with a different interpretation. First, many architectures employ an attention mechanism over the image spatial features during the report generation, as it was discussed in the Language Component section (5.2.3). These mechanisms can be leveraged to produce a heatmap indicating the image regions that were most important to generate the report. In particular, some models provide a heatmap for each word (Zhang et al., 2017a; Wang et al., 2018; Liu et al., 2019), for each sentence (Jing et al., 2018; Huang et al., 2019; Xue et al., 2018; Xue and Huang, 2019), or for the whole report (Li et al., 2019b). By showing these feature importance maps, an expert should be able to determine if the model is focusing on the correct regions of the image, which could improve their trust on the system.
Second, some works use particular deep learning architectures to perform image segmentation, i.e. classification and localization at the same time. The model by Ma et al. (Ma et al., 2018) uses a CNN to classify the severity of four different key characteristics of cervical cancer, and then uses an attention mechanism over the visual spatial features to generate heatmaps indicating the position of each relevant property. Tian et al. (Tian et al., 2018) used an FCN to classify each pixel of an image with the presence of a liver or tumor, and the result is averaged with an attention map to further improve localization. Han et al. (Han et al., 2018) proposed the ACAE module (see section 5.2.3 for details), which is used to classify at pixel level different parts of the spine (vertebrae, discs or neural foramina), and if they show an abnormality or not. Kisilev et al. (Kisilev et al., 2016) and Spinks and Moens (Spinks and Moens, 2019) used a Faster R-CNN (Ren et al., 2015) architecture to detect image regions with lesion and body parts of interest.
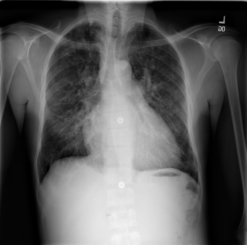
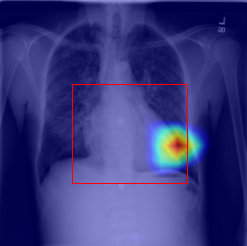
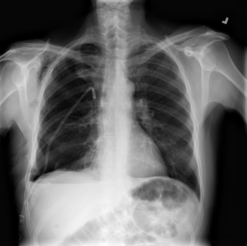
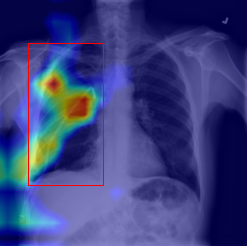
Lastly, some works use gradient- or activation-based methods for CNNs to generate a saliency map indicating the regions of most importance for a classification, such as CAM (Zhou et al., 2016), Grad-CAM (Selvaraju et al., 2017), SmoothGrad (Smilkov et al., 2017), or the one proposed by Zagoruyko and Komodakis (Komodakis and Zagoruyko, 2017). Refer to Table 3 in the Input and Output section (5.2.1) for a list of the papers using each technique. To determine which of these methods performs better in a general setting, Adebayo et al. (Adebayo et al., 2018) performed multiple evaluations (“sanity checks”) over Grad-CAM, SmoothGrad, and other similar methods, and showed that Grad-CAM should be more reliable in terms of correlation with the input images and the classification made. As an example of these techniques, Figure 4 shows two chest X-rays from the ChestX-ray14 dataset (Wang et al., 2017) with a heatmap generated with CAM, plus an expert-annotated bounding box locating the abnormality (provided with the dataset).
|
|
|---|---|
| Cardiomegaly | Pneumothorax |
Two chest X-rays showing abnormalities, alongside a heatmap indicating the regions of most importance for the neural network, plus a bounding-box locating the abnormality.
In both segmentation and saliency map methods, the heatmap information provides much richer information than classification alone, as it also includes the location of an specific concept, such as an abnormality or a body part. Providing this type of explanation should allow an expert to assess the localization capabilities of the model and the system accuracy, thus improving the model’s transparency throughout its process.
5.3.4. Text heatmap
The model proposed by Huang et al. (Huang et al., 2019) also receives text as input, which indicates the reason for performing the imaging study on the patient. In a similar fashion to the input image cases, the architecture includes an attention mechanism over the input text, which provides a heatmap indicating the input phrases or sentences that were most relevant to generate each word in the output. With this feature importance map an expert should be able to determine if the model is focusing on the correct words in the input text.
Synthesis
All the explainability approaches are local explanations given by a secondary output, either indicating feature importance (image and text heatmap), increasing the model’s transparency (classification) or providing a counter-factual example. However, in most of the works the authors do not explicitly mention it as an interpretability improvement, and in almost all cases there is no formal evaluation, as will be discussed in subsection 5.4.3. Hence, we believe this is an understudied aspect of the medical report generation task, given the superficial or nonexistent analysis it receives in most of the reviewed works. Additionally, counter-factual techniques could be further studied, and other approaches not found in the literature could be explored, such as prediction uncertainty or global explanations, which may be quite relevant for clinicians (Tonekaboni et al., 2019).
5.4. Evaluation Metrics
There are different ways to assess a medical report generated by an automated system. We divide the evaluation metrics used in the literature into three categories, depending on the aspect being assessed: text quality, medical correctness and explainability. Also, each evaluation method can be either automatic or performed manually by humans. Each of the categories and metrics are presented next, and Table 6 shows a summary of the metrics used by each paper.
| Category | Metric or evaluation | Used by papers |
| Text quality (automatic) | BLEU based | (Jing et al., 2018; Liu et al., 2019; Huang et al., 2019; Yuan et al., 2019; Li et al., 2018, 2019b; Wang et al., 2018; Xue et al., 2018; Zhang et al., 2017a; Li et al., 2019a; Xiong et al., 2019; Singh et al., 2019; Maksoud et al., 2019; Gale et al., 2019; Tian et al., 2018; Gu et al., 2019; Yin et al., 2019; Tian et al., 2019; Alsharid et al., 2019; Gasimova, 2019; Gajbhiye et al., 2020; Harzig et al., 2019a; Biswal et al., 2020; Xie et al., 2019; Zeng et al., 2018; Xue and Huang, 2019; Sun et al., 2019; Zhang et al., 2020b; Li and Hong, 2019; Jing et al., 2019; Shin et al., 2016; Hasan et al., 2018b; Spinks and Moens, 2019; Zeng et al., 2020) |
| ROUGE-L | (Jing et al., 2018; Liu et al., 2019; Huang et al., 2019; Yuan et al., 2019; Li et al., 2018, 2019b; Wang et al., 2018; Xue et al., 2018; Zhang et al., 2017a; Li et al., 2019a; Singh et al., 2019; Maksoud et al., 2019; Tian et al., 2018; Gu et al., 2019; Yin et al., 2019; Tian et al., 2019; Alsharid et al., 2019; Gajbhiye et al., 2020; Harzig et al., 2019a; Xie et al., 2019; Zeng et al., 2018; Xue and Huang, 2019; Zhang et al., 2020b; Jing et al., 2019; Spinks and Moens, 2019; Zeng et al., 2020) | |
| METEOR based | (Jing et al., 2018; Yuan et al., 2019; Wang et al., 2018; Xue et al., 2018; Zhang et al., 2017a; Singh et al., 2019; Maksoud et al., 2019; Gu et al., 2019; Yin et al., 2019; Gajbhiye et al., 2020; Harzig et al., 2019a; Zeng et al., 2018; Xue and Huang, 2019; Li and Hong, 2019; Spinks and Moens, 2019; Zeng et al., 2020) | |
| CIDEr based | (Jing et al., 2018; Liu et al., 2019; Huang et al., 2019; Li et al., 2018, 2019b; Zhang et al., 2017a; Li et al., 2019a; Xiong et al., 2019; Singh et al., 2019; Yin et al., 2019; Gajbhiye et al., 2020; Harzig et al., 2019a; Biswal et al., 2020; Xie et al., 2019; Zeng et al., 2018; Xue and Huang, 2019; Sun et al., 2019; Zhang et al., 2020b; Jing et al., 2019; Spinks and Moens, 2019; Zeng et al., 2020) | |
| SPICE | (Li and Hong, 2019) | |
| Grammar Bot | (Alsharid et al., 2019) | |
| Sentence variability | (Harzig et al., 2019a) | |
| Text quality (with humans) | AMT study | (Li et al., 2018, 2019b) |
| Medical correctness (automatic, report based) | MIRQI (precision, recall, F1) | (Zhang et al., 2020b) |
| MeSH Accuracy | (Huang et al., 2019) | |
| Keyword ratio (accuracy, sensitivity, specificity) | (Wu et al., 2017) | |
| Keyword Accuracy | (Xue et al., 2018; Xie et al., 2019) | |
| Medical Abnormality Terminology Detection (precision, FPR) | (Li et al., 2018) | |
| Abnormality Detection (precision, FPR) | (Jing et al., 2019) | |
| Medical Abnormality Detection (accuracy, precision, recall) | (Liu et al., 2019) | |
| Abnormality CNN classifier (accuracy, PR-AUC) | (Biswal et al., 2020) | |
| Semantic descriptors | (Moradi et al., 2016) | |
| ARS | (Alsharid et al., 2019) | |
| Medical correctness (automatic, auxiliary tasks) | ROC-AUC | (Li et al., 2019b; Wang et al., 2018; Li et al., 2019a; Zhang et al., 2020b) |
| Accuracy | (Zhang et al., 2017a; Zeng et al., 2018; Shin et al., 2016; Ma et al., 2018; Kisilev et al., 2016; Zeng et al., 2020) | |
| Recall/sensitivity | (Yin et al., 2019; Harzig et al., 2019b) | |
| Precision | (Yin et al., 2019; Harzig et al., 2019b; Kisilev et al., 2016) | |
| Specificity | (Harzig et al., 2019b) | |
| Pixel level accuracy | (Han et al., 2018) | |
| Pixel level specificity | (Han et al., 2018) | |
| Pixel level sensitivity | (Han et al., 2018) | |
| Pixel level dice score | (Han et al., 2018; Tian et al., 2018) | |
| Medical correctness (with experts) | Assess correctness of the nature of hip fractures | (Gale et al., 2019) |
| Accept/reject rating | (Tian et al., 2018) | |
| Assess medical and grammatical correctness, and relevance | (Alsharid et al., 2019) | |
| Agree with diagnosis | (Spinks and Moens, 2019) | |
| Explainability (with experts) | Counter factual X-ray vs Saliency map | (Spinks and Moens, 2019) |
| Reports vs SmoothGrad (classification explanation) | (Gale et al., 2019) |
5.4.1. Text quality metrics
The methods in this category measure general quality aspects of the generated text, and are originated from translation, summarizing or captioning tasks. The most widely used metrics in the papers reviewed are BLEU (Papineni et al., 2002), ROUGE-L (Lin, 2004), METEOR (Banerjee and Lavie, 2005; Lavie and Agarwal, 2007) and CIDEr (Vedantam et al., 2015), which measure the similarity of a target text (also referred to as candidate), against one or more reference texts (ground truth). These metrics are mainly based on counting n-gram matchings between the candidate and the ground truth. BLEU is precision-oriented, ROUGE-L and METEOR are F1-scores that can be biased towards precision or recall with a given parameter, and CIDEr attempts to capture both precision and recall through a TF-IDF score. Most of these metrics have variants and parameters for their calculation: ROUGE is a set of multiple metrics, being ROUGE-L the only one used in this task; METEOR has variants presented by the same authors (Denkowski and Lavie, 2010, 2011, 2014); and CIDEr was presented with the CIDEr-D variant to prevent gameability effects.
SPICE (Anderson et al., 2016) is a metric designed for the image captioning task, and evaluates the underlying meaning of the sentences describing the image scene, partially disregarding fluency or grammatical aspects. Specifically, the text is parsed as a graph, capturing the objects, their described characteristics and relations, which are then measured against the ground truth using an F1-score. Even though SPICE attempts to assess the semantic information in a caption, we believe it is not suitable for medical reports, as the graph parsing is designed for general domain objects. Nonetheless, Zhang et al. (Zhang et al., 2020b) presented the medical correctness metric MIRQI, applying a similar idea in a specific medical domain, which we will discuss in the next subsection (5.4.2).
Besides standard captioning metrics, we identified two other approaches to measure text quality. First, Alsharid et al. (Alsharid et al., 2019) used Grammar Bot333https://www.grammarbot.io/, a rule and statistics based automated system that counts the grammatical errors in sentences. Second, Harzig et al. 2019a (Harzig et al., 2019a) measured the sentence variability, by counting the different sentences in a set of reports. They argue that the sentences indicating abnormalities occur very rarely in the dataset, while the ones indicating normality are the most frequent. Hence, a certain level of variability is desired, and a system generating reports with low variability may indicate that not all medical conditions are being captured.
Lastly, both works from Li et al. (Li et al., 2018, 2019b) performed human evaluation with non-expert users via Amazon Mechanical Turk (AMT), following the same procedure. The authors presented two reports to the AMT participants, one generated with the proposed model and one generated with the CoAtt model (Jing et al., 2018) as baseline, and asked them to choose the most similar with the ground truth in terms of fluency, abnormalities correctness and content coverage. The results shown that their report was preferred around 50-60% of the cases, while the baseline around 20-30% (for the rest, none or both were preferred). We categorize this evaluation as a text quality metric, as the participants are not experts, and their answers are not fine-grained (i.e., did not specify what failed: fluency, correctness or coverage; or by how much they failed).
5.4.2. Medical correctness metrics
While the most common purpose of the text quality metrics is to measure the similarity between the generated report and a ground truth, they do not necessarily capture the medical facts in the reports (Boag et al., 2020; Zhang et al., 2020a; Liu et al., 2019; Babar et al., 2021; Pino et al., 2021, 2020). For example, the sentences “effusion is observed” and “effusion is not observed” are very similar, thus may present a very high score for any metric based on n-gram matching, though the medical facts are the exact opposite. Therefore, an evaluation directly measuring the reports correctness is required, not necessarily taking into account fluency, grammatical rules or text quality in general. From the literature reviewed, in ten works (Huang et al., 2019; Xue et al., 2018; Li et al., 2018; Jing et al., 2019; Liu et al., 2019; Biswal et al., 2020; Alsharid et al., 2019; Zhang et al., 2020b; Moradi et al., 2016; Wu et al., 2017) the authors presented an automatic metric to address this issue, four works (Gale et al., 2019; Tian et al., 2018; Alsharid et al., 2019; Spinks and Moens, 2019) did a formal expert evaluation, and multiple works (Yuan et al., 2019; Li et al., 2019b; Wang et al., 2018; Zhang et al., 2017a; Li et al., 2019a; Yin et al., 2019; Ma et al., 2018; Zeng et al., 2018; Harzig et al., 2019b; Zhang et al., 2020b; Shin et al., 2016; Tian et al., 2018; Zeng et al., 2020; Spinks and Moens, 2019; Kisilev et al., 2016) evaluated medical correctness indirectly from auxiliary tasks. The methods are listed in Table 6 and are further discussed next.
In several works the authors presented a method that detects concepts in the generated and ground truth reports, and compare the results using common classification metrics, such as accuracy, F1-score, and more. The main difference between these methods lies in how the concepts are automatically detected in the reports. The simplest approaches are keyword-based, which consists in reporting the ratio of a set of keywords found between the generated report and ground truth, like MeSH Accuracy (Huang et al., 2019) that uses MeSH terms, and Keyword Accuracy that uses 438 MTI terms (presented by Xue et al. (Xue et al., 2018) and used in A3FN (Xie et al., 2019)). Similarly, Medical Abnormality Terminology Detection (Li et al., 2018) calculates precision and false positive rate of the 10 most frequent abnormality-related terms in the dataset; and Wu et al. (Wu et al., 2017) calculated accuracy, sensitivity and specificity for a set of keywords.
Other approaches are abnormality-based, which attempt to directly classify abnormalities from the report by different means: Abnormality Detection (Jing et al., 2019) uses manually designed patterns; Medical Abnormality Detection (Liu et al., 2019) uses the CheXpert labeler tool (Irvin et al., 2019); Biswal et al. (Biswal et al., 2020) used a character-level CNN (Zhang et al., 2015) that classifies multiple CheXpert labels (Irvin et al., 2019); and Moradi et al. (Moradi et al., 2016) used a proprietary software to extract semantic descriptors. Lastly, Anatomical Relevance Score (ARS) (Alsharid et al., 2019) is a body-part-based approach, which detects the anatomical elements mentioned in a report considering the vocabulary used. Though these methods may be useful for measuring medical correctness to a certain degree, there is no consensus or standard, and there is no formal evaluation of the correlation with expert judgement. From the discussed techniques, Alsharid et al. (Alsharid et al., 2019) are the only authors that also performed an expert evaluation of the generated reports, though they did not conduct a correlation or similar analysis to validate the ARS method.
Zhang et al. (Zhang et al., 2020b) went further with the concept extraction and presented Medical Image Report Quality Index (MIRQI), which works in a similar fashion as the SPICE (Anderson et al., 2016) metric presented in the text quality subsection (5.4.1). MIRQI applies ideas from NegBio (Peng et al., 2018) and the CheXpert labeler (Irvin et al., 2019) to identify diseases or medical conditions in the reports, considering synonyms and negations, and uses the Stanford parser (Chen and Manning, 2014) to obtain semantic dependencies and finer-grained attributes from each sentence, such as severity, size, shape, body parts, etc. With this information, an abnormality graph is built for each report, where each node is a disease with its attributes, and the nodes are connected if they belong to the same organ or tissue. Lastly, the graphs from the ground truth and generated reports are matched node-wise, and MIRQI-p (precision), MIRQI-r (recall) and MIRQI-F1 (F1-score) are computed. Compared to the formerly discussed correctness metrics, we believe this approach seems more robust to assess the medical facts in the reports, as it attempts to capture the attributes and relations, opposed to the concepts only. However, the authors did not present an evaluation against expert judgement, so we cannot determine if this metric is sufficient.
Considering human evaluation, only a few works (Gale et al., 2019; Tian et al., 2018; Alsharid et al., 2019; Spinks and Moens, 2019) present a formal expert medical correctness assessment. In the work by Alsharid et al. (Alsharid et al., 2019) a medical professional assessed the reports on a Likert Scale from 0 to 2 in four different aspects: accurately describes the image, presents no incorrect information, is grammatically correct and is relevant for the image; the results were further separated for samples from different body parts, showing averages between 0.5 and 1. Gale et al. (Gale et al., 2019) asked a radiologist to evaluate the correctness of the hip fractures description, finding that the fracture’s character was properly described 98% of the cases, while the fracture location only for 90%. In the work by Tian et al. (Tian et al., 2018) a medical expert evaluated 30 randomly selected reports with a rating from 1 (definite accept) to 5 (definite reject), scoring an average of 2.33. Lastly, Spinks and Moens (Spinks and Moens, 2019) asked four questions to three experts regarding the generated reports, where the third and fourth questions measured correctness: “Do you agree with the proposed diagnosis?”, answering 0 (no) or 1 (yes) and “How certain are you about your final diagnosis?”, from 1 (not sure) to 4 (very sure). The average scores were high (0.88 and 3.75), showing agreement with the model’s diagnosis, and certainty on the experts’ diagnoses. The other questions concerned explainability aspects, and are detailed in the next subsection (5.4.3). So far, there is no standard approach to perform an expert evaluation, though we believe the first two approaches provide finer-grained information than the latter two, and hence should be more useful for determining in which cases the models are failing and for designing improvements. The certainty question should also be very useful, as diagnoses may be susceptible to human judgement.
Lastly, multiple papers (Yuan et al., 2019; Li et al., 2019b; Wang et al., 2018; Zhang et al., 2017a; Li et al., 2019a; Yin et al., 2019; Ma et al., 2018; Zeng et al., 2018; Harzig et al., 2019b; Zhang et al., 2020b; Shin et al., 2016; Tian et al., 2018) evaluated the performance of the auxiliary tasks with ROC-AUC, accuracy and other typical classification or segmentation metrics, as shown in Table 6. Note that in any of these cases, the task is a previous or intermediary step of the process and is not derived from the report. In consequence, even if the classification has great performance, the language component could be performing poorly, and the generated reports still may be inaccurate. Accordingly, we believe this type of measure should not be used as the primary report correctness evaluation, unless it can be proven that the report reproduces exactly the classification made (e.g. by a template-filling process).
5.4.3. Explainability metrics
Providing interpretable justifications for the model’s outcome is essential in this medical domain, and furthermore, we should be able to evaluate them to answer questions such as, does the method justify the model’s decision?, which method provides a better explanation? However, there is no consensus on evaluation methods for AI explainability, and in many cases the definition of a better explanation remains subjective (Doshi-Velez and Kim, 2017; Reyes et al., 2020; Carvalho et al., 2019).
Consequently, none of the papers reviewed used an automatic metric to assess explainability, and only two works (Gale et al., 2019; Spinks and Moens, 2019) conduct a formal human expert evaluation. Gale et al. (Gale et al., 2019) presented the report generation as an explanation of a medical image classification task, and evaluated it by comparing three methods: (a) SmoothGrad (Smilkov et al., 2017) to highlight the most important pixels used, (b) a generated report in natural language, and (c) both placed side by side. Five experts assessed 30 images, rating each explanation in a scale from 1 (unsatisfactory) to 10 (perfect); achieving average scores of (a) 4.4, (b) 7 and (c) 8.8 for each method. Though the authors emphasize the importance of the natural language explanations, their approach does not include an explanation for the report itself, so it cannot be directly used for the report generation task.
The model proposed by Spinks and Moens (Spinks and Moens, 2019) generates a chest X-ray as a counter-factual example, and they compared this explanation method against a feature importance heatmap generated with the Zagoruyko and Komodakis saliency map technique (Komodakis and Zagoruyko, 2017). Three experts evaluated 150 samples answering four questions, the first two regarding explainability aspects: “Does the explanation justify the diagnosis?” “Does the model appear to understand the important parts of the X-ray?” The answers were in a scale from 1 (no) to 4 (yes), and their method achieved a higher score than the saliency map (2.39 vs 1.31 for the first question, and 2.45 vs 1.81 for the second), showing their counter-factual approach should be better in this setting. The other two questions relate more to medical correctness, and are discussed in the previous section (5.4.2).
We believe the explanation evaluations should be very important in this area, and as there is no consensus, we outline some possible guidelines. Following ideas from Tonekaboni et al. (Tonekaboni et al., 2019), we believe three aspects from the explanations should be assessed: (1) consistency, (2) alignment with domain knowledge, and (3) user impact. First, the consistency across the data should be assessed, answering questions such as: do explanations change with variations to the input data?; or to the prediction?; or to the model design?; or with different images from the same patient? As pointed out by Tonekaboni et al. (Tonekaboni et al., 2019), inconsistent explanations may negatively affect the clinicians’ trust, and an interpretability method laying them out should be reviewed. Examples of consistency or robustness evaluations can be found in the work by Adebayo et al. (Adebayo et al., 2018) for image saliency maps, and in the work by Jain and Wallace (Jain and Wallace, 2019) for attention in recurrent neural networks.
Second, the alignment with domain knowledge should evaluate if the explanation is consistent with an expert’s knowledge: would they provide the same explanation for that decision? For instance, given a feature importance method, is the model focusing on the correct features? As an example, consider the second and third questions employed by Spinks and Moens (Spinks and Moens, 2019) detailed earlier. To mention other examples, Wang et al. (Wang et al., 2017) evaluated CAM (Zhou et al., 2016) generated heatmaps for disease classification against expert provided bounding-boxes locating the diseases, using intersection-over-union like metrics; Kim et al. (Kim et al., 2018) proposed a model to classify Diabetic Retinopathy from retina fundus images, and they compared the TCAV (Kim et al., 2018) extracted concepts against expert knowledge. Notice many works reviewed in this survey used classification or segmentation as an auxiliary task, which can be used as local explanations, and evaluated them with common metrics (such as accuracy, precision, etc.), as discussed in the previous sections (5.3 and 5.4.2). As the authors did not mention the secondary outputs as local explanations, we categorized the said evaluations as medical correctness metrics, but they are also measuring alignment with domain knowledge for the interpretability methods, and as such may be very useful.
Lastly, the user impact should attempt to answer questions like, is it a good explanation? Does it provide useful or novel information? Does it justify the model’s decision? Is it provided with an appropriate representation for the experts? As examples, the assessment proposed by Gale et al. (Gale et al., 2019) and the first question used by Spinks and Moens (Spinks and Moens, 2019) measure user impact. Notice that most of these concepts are very subjective, and the definitions, the questions and assessments will vary for different sub-domains and target experts. We believe more specific definitions and fine-grained aspects should arise in the future, as research in this topic grows. For reference, this category includes the domain appropriate representation and potential actionability concepts presented by Tonekaboni et al. (Tonekaboni et al., 2019).
Synthesis
Almost all the works include text quality metrics, though these are not able to capture the medical facts in a report (Boag et al., 2020; Zhang et al., 2020a; Liu et al., 2019; Babar et al., 2021; Pino et al., 2021, 2020). Several works proposed medical correctness assessments over the reports, but unfortunately none of the proposals was evaluated against expert judgement. The auxiliary tasks can be evaluated to measure correctness indirectly from the process, but often it will not be sufficient for the report’s correctness. Only two works evaluate explainability directly with experts, and the auxiliary tasks’ assessments could be useful to measure alignment between the explanations and domain knowledge. Overall, we believe that medical correctness should be the primary aspect to evaluate in the generated reports, using one or more automatic metrics. For now, and even though none of the metrics proposed has been evaluated against expert judgement, MIRQI (Zhang et al., 2020b) seems like the most promising approach to fulfill this purpose, as it should be able to capture richer information from the reports. Additionally, text quality metrics can be used as a secondary evaluation, since they may be useful for measuring fluency, grammar or variability, and to compare with previous baselines. Lastly, explainability evaluation methods should arise to assess multiple key aspects, such as its consistency, alignment with domain knowledge, and the user impact.
5.5. Comparison of papers’ performance
To find out which paper holds the state of the art, we need to find a common ground for fair comparison. A natural choice is the IU X-ray dataset (Demner-Fushman et al., 2015), since a majority of the surveyed papers report results in this dataset. Table 7 shows these results, separated by which report sections are generated by each paper, findings, impression or both. The findings section consists of multiple sentences, and mainly describes medical conditions observed, while the impression section is a one sentence conclusion or diagnosis. Notice Spinks and Moens (Spinks and Moens, 2019) filtered the findings section, and kept only sentences referring to one disease (Cardiomegaly). The papers that seem to show the best performance in terms of NLP metrics are KERP (Li et al., 2019b), CLARA (Biswal et al., 2020) and Xue et al. 2019 (Xue and Huang, 2019) for the findings section, MTMA (Tian et al., 2019) for the impression section, and Yuan et al. (Yuan et al., 2019), MLMA (Gajbhiye et al., 2020) and Xue et al. 2019 (Xue and Huang, 2019) for both sections. Of these, only MTMA has a large difference to its competitors, and there is no clear winner in the other sections. Some caveats, however, should be kept in mind when interpreting these results:
(1) The results reported in the literature only allow comparisons in terms of standard natural language metrics (BLEU, ROUGE-L, etc.), but from these results we cannot draw conclusions about medical correctness, since NLP metrics and clinical accuracy are not necessarily correlated.
(2) MTMA uses additional input, as discussed in section 5.2.1. Specifically, the model receives the indication and findings sections of the report to generate the impression section, at both test and train stages. In a sense, this could be seen as an enhanced summarizing approach, since the impression section contains a conclusion from the findings.
(3) Some NLP metrics, such as CIDEr, ROUGE-L and METEOR, have variants and parameters, as discussed in section 5.4. Unfortunately, most papers do not mention the specific version or implementation used.
(4) The IU X-ray dataset does not have standard training-validation-test splits. This has led researchers to define their own splits, as indicated by column Split of Table 7. These splits are not consistent across papers, making results less comparable. For example, if a model was evaluated in an easier test split, that would give it an unfair advantage over other models evaluated in harder test splits. Additionally, other decisions such the number of images per report (frontal, lateral or both), the tokenization algorithm employed, the removal of noisy sentences, the removal of words with a frequency under a given threshold, the removal of duplicate images, among other preprocessing decisions, are not always explicitly stated in papers, and these may have an impact on the results as well.
(5) These are overall results only, so a more fine-grained performance assessment on specific abnormalities or diseases is missing. This further shows the need for standardizing one or more evaluation metrics to measure the medical correctness of a generated report, considering different aspects of interest.
| Paper | BLEU-1 | BLEU-2 | BLEU-3 | BLEU-4 | ROUGE-L | METEOR | CIDEr-D | Split |
|---|---|---|---|---|---|---|---|---|
| Findings section | ||||||||
| Liu et al. (Liu et al., 2019) | 0.369 | 0.246 | 0.171 | 0.115 | 0.359 | - | 1.490 | 7:1:2 1 |
| HRGR (Li et al., 2018) | 0.438 | 0.298 | 0.208 | 0.151 | 0.369 | - | 0.343 | 7:1:2 2 |
| KERP (Li et al., 2019b) | 0.482 | 0.325 | 0.226 | 0.162 | 0.339 | - | 0.280 | 7:1:2 2 |
| TieNet (Wang et al., 2018) | 0.330 | 0.194 | 0.124 | 0.081 | 0.311 | - | 1.334 | 7:1:2 1 |
| Xue et al. 2018 (Xue et al., 2018) | 0.441 | 0.320 | 0.231 | 0.181 | 0.366 | 0.220 | 0.343 | 2,525/250 |
| RTMIC (Xiong et al., 2019) | 0.350 | 0.234 | 0.143 | 0.096 | - | - | 0.323 | 7:2:1 |
| CLARA (Biswal et al., 2020) | 0.471 | 0.324 | 0.214 | 0.199 | - | - | 0.359 | 7:1:2 |
| Xue et al. 2019 (Xue and Huang, 2019) | 0.477 | 0.332 | 0.243 | 0.189 | 0.380 | 0.223 | 0.320 | 3,031/300 |
| CMAS (Jing et al., 2019) | 0.464 | 0.301 | 0.210 | 0.154 | 0.362 | - | 0.275 | Unk |
| Findings section - Cardiomegaly sentences only | ||||||||
| Spinks and Moens (Spinks and Moens, 2019) | 0.490 | 0.350 | 0.250 | 0.180 | 0.400 | 0.270 | 0.600 | 8:1:1 |
| Impression section | ||||||||
| MTMA (Tian et al., 2019) | 0.882 | 0.874 | 0.867 | 0.860 | 0.929 | - | - | 5,461/500/500 |
| CMAS (Jing et al., 2019) | 0.401 | 0.290 | 0.220 | 0.166 | 0.521 | - | 1.457 | Unk |
| Findings + Impression sections | ||||||||
| CoAtt (Jing et al., 2018) | 0.517 | 0.386 | 0.306 | 0.247 | 0.447 | 0.217 | 0.327 | 6,470/500/500 |
| Huang et al. (Huang et al., 2019) | 0.476 | 0.340 | 0.238 | 0.169 | 0.347 | - | 0.297 | 8:1:1 |
| Yuan et al. (Yuan et al., 2019) | 0.529 | 0.372 | 0.315 | 0.255 | 0.453 | 0.343 | - | 8:2 |
| Xue et al. 2018 (Xue et al., 2018) | 0.464 | 0.358 | 0.270 | 0.195 | 0.366 | 0.274 | - | 2,775/250 |
| Vispi (Li et al., 2019a) | 0.419 | 0.280 | 0.201 | 0.150 | 0.371 | - | 0.553 | 7:1:2 |
| Singh et al. (Singh et al., 2019) | 0.374 | 0.224 | 0.153 | 0.110 | 0.308 | 0.164 | 0.360 | 6,718/350/350 |
| Yin et al. (Yin et al., 2019) | 0.445 | 0.292 | 0.201 | 0.154 | 0.344 | 0.175 | 0.342 | 6,470/500/500 |
| MLMA (Gajbhiye et al., 2020) | 0.500 | 0.380 | 0.317 | 0.278 | 0.440 | 0.281 | 1.067 | 6,429/500/500 |
| Harzig et al. 2019a (Harzig et al., 2019a) | 0.373 | 0.246 | 0.175 | 0.126 | 0.315 | 0.163 | 0.359 | 90:5:5 |
| A3FN (Xie et al., 2019) | 0.443 | 0.337 | 0.236 | 0.181 | 0.347 | - | 0.374 | 9:1 |
| Xue et al. 2019 (Xue and Huang, 2019) | 0.489 | 0.340 | 0.252 | 0.195 | 0.478 | 0.230 | 0.565 | 3,031/300 |
| Zhang et al. (Zhang et al., 2020b) | 0.441 | 0.291 | 0.203 | 0.147 | 0.367 | - | 0.304 | 5-fold CV |
6. Challenges and future work
In this section, we identify unsolved challenges in the literature and potential avenues for future research in the task of report generation from medical images.
Protocol for expert evaluation
If the ultimate goal is to develop a report generation system that meets high-quality standards, it makes sense that such a system be thoroughly tested by medical experts to evaluate its performance in different clinical settings. Most papers reviewed are weak in this regard, as only four of them (Gale et al., 2019; Tian et al., 2018; Alsharid et al., 2019; Spinks and Moens, 2019) perform a correctness evaluation with medical experts, meaning that 90% of the works does not carry out an expert evaluation, feedback that should be immensely valuable to understand the strengths and weaknesses of a model. Therefore, a clear avenue for improvement is to standardize a protocol for human evaluation of these systems by imaging experts, for example starting with chest X-rays, which is the medical image type with more datasets available and research done. A standard protocol should facilitate fair comparisons between studies and allow to assess how close a model is to meet standard criteria for deployment in a clinical setting.
The expertise of the human evaluators is an important factor to consider as well. It stands to reason that the judgement of a board-certified radiologist with years of experience should be more reliable than the judgement of a physician with limited experience. Similarly, the consensus of a team of radiologists should be preferred over a single radiologist. In the same line, measuring the inter-agreement of several radiologists can help to better assess the difficulty of the task itself (Jain et al., 2021). If radiologists tend to disagree more, this may indicate an inherent ambiguity in the task that could be the explanation for the possible underperformance of a given model.
Automatic metrics for medical correctness
Having a proper expert evaluation is desirable. However, it is not feasible to ask radiologists to manually evaluate hundreds of machine-generated reports every time a small tweak in a model is performed. Instead, one would like to have one or more automatic metrics positively correlated with expert human evaluation, in order to speed up the model design and testing cycle. We found that more than 70% of the works reviewed (29 out of 40) limit the automatic report evaluation to traditional NLP metrics such as BLEU, ROUGE-L or CIDEr, which are not designed to evaluate a report from a medical correctness point of view (Boag et al., 2020; Zhang et al., 2020a; Liu et al., 2019; Babar et al., 2021; Pino et al., 2021, 2020). Furthermore, these evaluation methods have been recently contested in other NLP tasks (van Miltenburg et al., 2020; van Miltenburg et al., 2021; Reiter, 2018; Mathur et al., 2020). Some works tried to remedy this limitation by devising their own auxiliary metrics to evaluate medical correctness to some degree (Liu et al., 2019; Huang et al., 2019; Li et al., 2018; Xue et al., 2018; Alsharid et al., 2019; Biswal et al., 2020; Xie et al., 2019; Zhang et al., 2020b; Jing et al., 2019; Moradi et al., 2016; Wu et al., 2017), which are interesting approaches. We highlight the metric MIRQI proposed very recently by Zhang et al. (Zhang et al., 2020b), which is very similar to SPICE (Anderson et al., 2016) as described in section 5.4.2, as it attempts to build a graph capturing abnormalities, their relations and attributes. We believe this is the most sophisticated metric for medical correctness found in the literature, and great ideas can be adopted from it.
Unfortunately, all the proposed metrics lack validation by medical experts, as none of the papers presents the results of a study assessing the correlation between the proposed metric and expert medical judgment. Thus, finding one or more golden automatic metrics for medical correctness remains an open problem. To solve it, the precision and accuracy of a report is critical in the medical domain and need to be captured (Zhang et al., 2020a; Babar et al., 2021; Pino et al., 2021), whereas other aspects such as natural language fluency should probably weigh less in importance. We believe designing and validating such metrics is a clear avenue for future research, with the potential to have a significant impact on the field.
Improve explainability
To build trust in an AI system, a desirable feature is the ability to provide clear and coherent explanations for its decisions (Adadi and Berrada, 2018; Došilović et al., 2018). This is particularly relevant in the healthcare domain, where decisions have to be made with extreme caution since the patient’s health is at stake. Thus, high levels of transparency, interpretability, and accountability are required to justify the outputs delivered, align to the expert’s expectations, and acquire their trust (Tonekaboni et al., 2019; Tjoa and Guan, 2019; Reyes et al., 2020).
Only two papers reviewed (Gale et al., 2019; Spinks and Moens, 2019) have explainability as a primary focus, as discussed in section 5.3, though one of them (Gale et al., 2019) does not provide an explanation for the report. Additionally, some works mention some form of local explainability in their models, but always as a secondary output and giving it a rather superficial treatment, with no rigorous evaluation. In the absence of empirical results across all papers, we cannot draw conclusions about which explanation techniques are better or worse. Thus, a potential avenue for future research is explainability with a more rigorous and empirical focus, and possibly including other approaches, such as global explanations, uncertainty, or more, which may be necessary for clinicians (Tonekaboni et al., 2019). We believe this research avenue will benefit from the feedback and evaluation of medical imaging experts, who are the end-users of these systems. What would be a suitable explanation for a radiologist? In a multi-sentence report, how should the explanation be structured? An expert’s opinion is valuable for answering these and other questions, and ultimately for assessing the explanation.
New learning strategies and architectures.
If the ultimate goal is to have a model that learns to generate accurate and useful medical reports, the optimization strategy employed should be designed to guide the model in this direction. As we saw in section 5.2.6, most papers used teacher-forcing, a training strategy which is domain-agnostic and thus suboptimal for the medical domain (Zhang et al., 2020a). Similarly, a few papers used reinforcement learning (Liu et al., 2019; Li et al., 2018; Xiong et al., 2019; Li and Hong, 2019; Jing et al., 2019) with traditional NLP metrics as rewards, which are not designed for medicine either. Only Liu et al. (Liu et al., 2019) included a domain-specific reward that explicitly promotes medical correctness. Unfortunately, a manual inspection of several generated reports conducted by the authors revealed that the model was missing positive findings (low recall) as well as failing to provide accurate descriptions of the positive findings detected.
Given these reasons, there is still room for finding better optimization strategies for image-based medical report generation. In this regard, reinforcement learning appears to be the most promising training paradigm to explore, as illustrated by the work of Zhang et al. (Zhang et al., 2020a) on factual correctness optimization in a related medical task. If a robust medical correctness metric is developed (as previously discussed in this section), then the metric could be used as a reward in a reinforcement learning setting to teach the model to generate reports that are medically correct.
Other image modalities and body regions are less explored
Most research has concentrated on chest X-rays, as 24 out of 40 papers focus their study on this image type. This modality presents a very specific nature and different characteristics from other imaging studies. For example, when a radiologist reads a chest X-ray, the focus is on the underlying anatomy and identification of possible areas of distortion based on different densities of the image. On the other hand, when analyzing a PET image, the focus is on detecting areas of increased radiotracer activity; for MRI scans, the radiologist may review several images obtained with different configurations at the same time; and for each other modality there may be more specific conditions. Hence, the results shown here are highly biased towards chest X-rays, which will not necessarily extrapolate to other scenarios.
Notice there are datasets with multiple image types or body parts, namely ImageCLEF caption (Eickhoff et al., 2017; García Seco de Herrera et al., 2018), ROCO (Pelka et al., 2018) and PEIR Gross (Jing et al., 2018), as it was mentioned in section 5.1. However, we believe their broad nature, i.e., the inclusion of many types and regions simultaneously, may be a drawback when trying to apply an advanced deep learning approach, for three main reasons. First, it is more difficult to include specific domain knowledge in the models, as the knowledge should cover all modalities and body parts. Second, assessing medical correctness is more complicated, since domain knowledge is needed to design these metrics, as noted in section 5.4. Third, it would be more challenging to provide interpretability for the model, as the explanations should cover all modalities. Ultimately, we believe better solutions can be achieved by designing them for a specific problem and setting. In conclusion, there is a clear opportunity to extend research into other image types and body regions by raising new collections with other image types, evaluating the same methods in different modalities, or further covering the existing datasets.
Explore more alternatives to include domain knowledge
As we saw in section 5.2.4, the approaches explored in the literature for incorporating domain knowledge into models are (1) the use of graph neural networks at the visual component level and (2) the use template databases curated with expert knowledge—in addition to the widespread use of auxiliary tasks, that can be viewed as a way of domain knowledge transfer as well. However, other approaches remain unexplored. A recent survey by Xie et al. (Xie et al., 2020) synthesizing over 270 papers on domain knowledge for deep learning-based medical image analysis presents interesting ideas that could be applicable to the report generation setting. For example, curriculum learning (Bengio et al., 2009) and self-paced learning (Kumar et al., 2010) could be used to imitate the learning curve from easier to harder instances that radiologists go through when they learn to interpret and diagnose images. Also, the use of handcrafted algorithms to extract visual features that better capture what radiologists focus on in an image could be used, which many works have verified to have synergistic effects in combination with the features learned by the CNN (Xie et al., 2020). This would improve the quality of the visual component and potentially translate into better reports. Studying how imaging experts analyze an image, how they focus the attention to different regions of the image as needed, could be useful to inspire innovations in model architectures in order to emulate that process.
Medical Human-AI interaction
Most reviewed works leave aside important aspects pertaining the model’s integration in a real clinical setting and its interaction with clinicians as an AI assistant. Besides high levels of accuracy, there are other needs a system should aim to meet in a medical human-AI collaboration workflow. For example, Cai et al. (Cai et al., 2019) argue that clinicians should have transparent information about the model’s overall strengths and weaknesses, its subjective point-of-view, its overall design objective and how exactly it uses the information to derive a final diagnosis. Also, Amershi et al. (Amershi et al., 2019) proposed and validated several design guidelines for general human-AI interaction that can be relevant in the context of automatic report generation, such as Make clear why the system did what it did via explanations, and Support efficient correction by making it easy to edit, refine, or recover when the AI system is wrong. Among all papers reviewed, only CLARA (Biswal et al., 2020) targets an explicit workflow with human interaction, in which a report is generated cooperatively by a human who types some preliminary text and the system autocompletes the rest.
Also, there are potential use cases that an AI assistant for report generation can face in routine practice which are not addressed in the reviewed literature. For example, (1) open-ended visual question answering (VQA): instead of a full report with too many details, a clinician might be interested in the model’s opinion on a specific aspect of the image(s). This query could be expressed as a natural language question that the model would have to answer, which would require a model with open-ended VQA capabilities. Although this is a different task than report generation, we believe the latter could be approached as giving answers to a sequence of questions from physicians, allowing a richer interaction between the expert and the system. The multiple ImageCLEF challenges involving a medical VQA task (Hasan et al., 2018a; Ben Abacha et al., 2019, 2020) and the recently published PathVQA dataset (He et al., 2020) could be helpful in exploring this direction. (2) Reporting temporal information: sometimes clinicians are interested in the evolution of a health condition by analyzing a sequence of imaging snapshots over time, rather than describing a single image. None of the surveyed papers considers this use case. (3) Quantitative Radiology: in some cases a clinician might be interested in specific numerical measurements to further assess the patient’s condition, for example, the degree of a certain property in the tissues (Jackson, 2018). This adds more complexity to the problem, since models would need the ability to make these accurate numerical measurements, in addition to interpreting them through words in the generated report. In sum, there may be different ways to fulfill the report generation task, and we believe researchers should aim to find the most useful approaches for clinicians in each specific environment.
7. Limitations
The main limitations of this survey are two. First, new papers on report generation from medical images are published relatively often, we tried to be as comprehensive as possible and include all of them, but we do not rule out that some papers may have been missed. Second, we left out of the analysis works from related tasks, such as disease classification, report summarizing, or medical image segmentation. These topics may have interesting approaches or insights on how to improve the visual features generated, how to optimize the text generation, evaluation techniques, and more.
8. Conclusions
In this work, we have reviewed the state of research in deep-learning based methods for automatic report generation from medical images, in terms of different key aspects. First, we described the report and classification datasets available and commonly used in the literature, totalling 27 collections, which cover different image modalities and body parts, and include useful tags and localization information. Second, we presented an analysis of model designs in terms of standard practices, inputs and outputs, visual components, language components, domain knowledge, auxiliary tasks, and optimization strategies. We cannot recommend an optimal model design due to the lack of proper evaluations, but several guidelines can be inferred. For instance, a robust visual component should make use of CNNs and would certainly benefit from training in auxiliary medical image tasks. Also, complementing the visual input with semantic information via tags or input text (e.g the report’s indication section) or access to a template database generally improves the language component’s performance. Multitask learning to integrate the supervision of multiple tasks and reinforcement learning to directly optimize for factual correctness or other metrics of interest in generated reports appear as the most promising optimization approaches. Third, we analyzed the interpretablity approaches employed in the literature, and found that many models provide a secondary output that can be used as a local explanation, either by providing a feature importance map, a counter-factual example, or by increasing the system’s transparency. However, only two works focused explicitly on studying this concern, by discussing extensively and providing formal evaluations. Additionally, many other approaches can be explored, and hence this remains a heavily understudied aspect of this task. Fourth, we discussed usual practices regarding evaluation metrics, and we found that most models are only evaluated with traditional n-gram based NLP metrics not designed for medicine, which are not able to capture the essential medical facts in a written report. Next, we presented a comparison of papers’ performance results on IU X-Ray, the most frequently used dataset, but limited to said NLP metrics that papers report, making us unable to judge models from a medical perspective.
Lastly, we identified challenges in the field that none of the reviewed papers has successfully addressed, and we proposed avenues for future research where we believe possible solutions could be found. The main challenges lay on improving the evaluation methods employed, by developing a standard protocol for expert evaluation and automatic metrics for medical correctness. Other important aspects are improving the explainability of models, and considering the medical human-AI interaction. We intend this survey to serve as an entry point for researchers who want an overview of the current advances in the field and also to raise awareness of critical problems that future research should focus on, with the end goal of developing mature and robust technologies that can bring value to healthcare professionals and patients in real clinical settings.
References
- (1)
- Abràmoff et al. (2013) Michael D Abràmoff, James C Folk, Dennis P Han, Jonathan D Walker, David F Williams, Stephen R Russell, Pascale Massin, Beatrice Cochener, Philippe Gain, Li Tang, et al. 2013. Automated analysis of retinal images for detection of referable diabetic retinopathy. JAMA ophthalmology 131, 3 (2013), 351–357.
- Adadi and Berrada (2018) A. Adadi and M. Berrada. 2018. Peeking Inside the Black-Box: A Survey on Explainable Artificial Intelligence (XAI). IEEE Access 6 (2018), 52138–52160.
- Adebayo et al. (2018) Julius Adebayo, Justin Gilmer, Michael Muelly, Ian Goodfellow, Moritz Hardt, and Been Kim. 2018. Sanity Checks for Saliency Maps. In Advances in Neural Information Processing Systems 31. Curran Associates, Inc., 9505–9515.
- Ahmad et al. (2018) Muhammad Aurangzeb Ahmad, Carly Eckert, and Ankur Teredesai. 2018. Interpretable Machine Learning in Healthcare. In Proc of the 2018 ACM Intl. Conf. on Bioinformatics, Computational Biology, and Health Informatics (Washington, DC, USA) (BCB ’18). ACM, New York, NY, USA, 559–560.
- Akazawa et al. (2019) Kentaro Akazawa, Ryo Sakamoto, Satoshi Nakajima, Dan Wu, Yue Li, Kenichi Oishi, Andreia V. Faria, Kei Yamada, Kaori Togashi, Constantine G. Lyketsos, Michael I. Miller, and Susumu Mori. 2019. Automated Generation of Radiologic Descriptions on Brain Volume Changes From T1-Weighted MR Images: Initial Assessment of Feasibility. Frontiers in Neurology 10 (2019), 7.
- Allaouzi et al. (2018) Imane Allaouzi, M. Ben Ahmed, B. Benamrou, and M. Ouardouz. 2018. Automatic Caption Generation for Medical Images. In Proc of the 3rd Intl. Conf. on Smart City Applications (Tetouan, Morocco) (SCA ’18). ACM, New York, NY, USA, Article 86, 6 pages.
- Alsharid et al. (2019) Mohammad Alsharid, Harshita Sharma, Lior Drukker, Pierre Chatelain, Aris T. Papageorghiou, and J. Alison Noble. 2019. Captioning Ultrasound Images Automatically. In Medical Image Computing and Computer Assisted Intervention – MICCAI 2019. Springer Intl. Publishing, Cham, 338–346.
- Amershi et al. (2019) Saleema Amershi, Dan Weld, Mihaela Vorvoreanu, Adam Fourney, Besmira Nushi, Penny Collisson, Jina Suh, Shamsi Iqbal, Paul N. Bennett, Kori Inkpen, Jaime Teevan, Ruth Kikin-Gil, and Eric Horvitz. 2019. Guidelines for Human-AI Interaction. In Proc of the 2019 CHI Conf. on Human Factors in Computing Systems (Glasgow, Scotland Uk) (CHI ’19). ACM, 1–13.
- Anderson et al. (2016) Peter Anderson, Basura Fernando, Mark Johnson, and Stephen Gould. 2016. SPICE: Semantic Propositional Image Caption Evaluation. In Computer Vision – ECCV 2016. Springer Intl. Publishing, Cham, 382–398.
- Aronson and Lang (2010) Alan R Aronson and François-Michel Lang. 2010. An overview of MetaMap: historical perspective and recent advances. Journal of the American Medical Informatics Association 17, 3 (2010), 229–236.
- Babar et al. (2021) Zaheer Babar, Twan van Laarhoven, Fabio Massimo Zanzotto, and Elena Marchiori. 2021. Evaluating diagnostic content of AI-generated radiology reports of chest X-rays. Artificial Intelligence in Medicine 116 (2021), 102075. https://doi.org/10.1016/j.artmed.2021.102075
- Banerjee and Lavie (2005) Satanjeev Banerjee and Alon Lavie. 2005. METEOR: An Automatic Metric for MT Evaluation with Improved Correlation with Human Judgments. In Proc of the ACL Workshop on Intrinsic and Extrinsic Evaluation Measures for Machine Translation and/or Summarization. ACL, Ann Arbor, Michigan, 65–72.
- Ben Abacha et al. (2020) Asma Ben Abacha, Vivek V. Datla, Sadid A. Hasan, Dina Demner-Fushman, and Henning Müller. 2020. Overview of the VQA-Med Task at ImageCLEF 2020: Visual Question Answering and Generation in the Medical Domain. In CLEF 2020 Working Notes (CEUR Workshop Proceedings). Thessaloniki, Greece.
- Ben Abacha et al. (2019) Asma Ben Abacha, Sadid A. Hasan, Vivek V. Datla, Joey Liu, Dina Demner-Fushman, and Henning Müller. 2019. VQA-Med: Overview of the Medical Visual Question Answering Task at ImageCLEF 2019. In CLEF2019 Working Notes (CEUR Workshop Proceedings). Lugano, Switzerland.
- Bengio et al. (2009) Yoshua Bengio, Jérôme Louradour, Ronan Collobert, and Jason Weston. 2009. Curriculum Learning. In Proc of the 26th Annual Intl. Conf. on Machine Learning (Montreal, Quebec, Canada) (ICML ’09). ACM, 41–48.
- Biswal et al. (2020) Siddharth Biswal, Cao Xiao, Lucas M. Glass, Brandon Westover, and Jimeng Sun. 2020. CLARA: Clinical Report Auto-Completion. In Proc of The Web Conf. 2020 (Taipei, Taiwan) (WWW ’20). ACM, New York, NY, USA, 541–550.
- Boag et al. (2020) William Boag, Tzu-Ming Harry Hsu, Matthew Mcdermott, Gabriela Berner, Emily Alesentzer, and Peter Szolovits. 2020. Baselines for Chest X-Ray Report Generation. In Proc of the Machine Learning for Health NeurIPS Workshop (Proc of Machine Learning Research), Vol. 116. PMLR, 126–140.
- Branko et al. (2010) Milosavljević Branko, Boberić Danijela, and Surla Dušan. 2010. Retrieval of bibliographic records using Apache Lucene. The Electronic Library 28, 4 (01 Jan 2010), 525–539.
- Bustos et al. (2019) Aurelia Bustos, Antonio Pertusa, Jose-Maria Salinas, and Maria de la Iglesia-Vayá. 2019. Padchest: A large chest x-ray image dataset with multi-label annotated reports. arXiv:1901.07441 (2019).
- Cai et al. (2019) Carrie J Cai, Samantha Winter, David Steiner, Lauren Wilcox, and Michael Terry. 2019. ” Hello AI”: Uncovering the Onboarding Needs of Medical Practitioners for Human-AI Collaborative Decision-Making. Proc of the ACM on Human-computer Interaction 3, CSCW (2019), 1–24.
- Caruana (1997) Rich Caruana. 1997. Multitask learning. Machine learning 28, 1 (1997), 41–75.
- Carvalho et al. (2019) Diogo V Carvalho, Eduardo M Pereira, and Jaime S Cardoso. 2019. Machine learning interpretability: A survey on methods and metrics. Electronics 8, 8 (2019), 832.
- Chen and Manning (2014) Danqi Chen and Christopher Manning. 2014. A Fast and Accurate Dependency Parser using Neural Networks. In Proc of the 2014 Conf. on Empirical Methods in Natural Language Processing (EMNLP). ACL, Doha, Qatar, 740–750.
- Chopra et al. (2005) Sumit Chopra, Raia Hadsell, and Yann LeCun. 2005. Learning a similarity metric discriminatively, with application to face verification. In 2005 IEEE Computer Society Conf. on Computer Vision and Pattern Recognition (CVPR’05), Vol. 1. IEEE, 539–546.
- Christ et al. (2017) P Christ, F Ettlinger, F Grün, J Lipkova, and G Kaissis. 2017. Lits-liver tumor segmentation challenge. ISBI and MICCAI (2017).
- Chung et al. (2014) Junyoung Chung, Caglar Gulcehre, Kyunghyun Cho, and Yoshua Bengio. 2014. Empirical evaluation of gated recurrent neural networks on sequence modeling. In NIPS 2014 Workshop on Deep Learning, December 2014.
- Decencière et al. (2014) Etienne Decencière, Xiwei Zhang, Guy Cazuguel, Bruno Lay, Béatrice Cochener, Caroline Trone, Philippe Gain, Richard Ordonez, Pascale Massin, Ali Erginay, et al. 2014. Feedback on a publicly distributed image database: the Messidor database. Image Analysis & Stereology 33, 3 (2014), 231–234.
- Demner-Fushman et al. (2015) Dina Demner-Fushman, Marc D. Kohli, Marc B. Rosenman, Sonya E. Shooshan, Laritza Rodriguez, Sameer Antani, George R. Thoma, and Clement J. McDonald. 2015. Preparing a collection of radiology examinations for distribution and retrieval. Journal of the American Medical Informatics Association 23, 2 (07 2015), 304–310.
- Deng et al. (2009) J. Deng, W. Dong, R. Socher, L. Li, Kai Li, and Li Fei-Fei. 2009. ImageNet: A large-scale hierarchical image database. In 2009 IEEE Conf. on Computer Vision and Pattern Recognition. 248–255.
- Denkowski and Lavie (2010) Michael Denkowski and Alon Lavie. 2010. Extending the Meteor Machine Translation Evaluation Metric to the Phrase Level. In Human Language Technologies: The 2010 Annual Conf. of the North American Chapter of the ACL (Los Angeles, California) (HLT ’10). ACL, USA, 250–253.
- Denkowski and Lavie (2011) Michael Denkowski and Alon Lavie. 2011. Meteor 1.3: Automatic Metric for Reliable Optimization and Evaluation of Machine Translation Systems. In Proc of the Sixth Workshop on Statistical Machine Translation (Edinburgh, Scotland) (WMT ’11). ACL, USA, 85–91.
- Denkowski and Lavie (2014) Michael Denkowski and Alon Lavie. 2014. Meteor Universal: Language Specific Translation Evaluation for Any Target Language. In Proc of the Ninth Workshop on Statistical Machine Translation. ACL, Baltimore, Maryland, USA, 376–380.
- Doshi-Velez and Kim (2017) Finale Doshi-Velez and Been Kim. 2017. Towards A Rigorous Science of Interpretable Machine Learning. stat 1050 (2017), 2.
- Došilović et al. (2018) F. K. Došilović, M. Brčić, and N. Hlupić. 2018. Explainable artificial intelligence: A survey. In 2018 41st Intl. Convention on Information and Communication Technology, Electronics and Microelectronics (MIPRO). 0210–0215.
- Eickhoff et al. (2017) Carsten Eickhoff, Immanuel Schwall, Alba García Seco de Herrera, and Henning Müller. 2017. Overview of ImageCLEFcaption 2017 - the Image Caption Prediction and Concept Extraction Tasks to Understand Biomedical Images. In CLEF2017 Working Notes (CEUR Workshop Proceedings). Dublin, Ireland.
- Gajbhiye et al. (2020) Gaurav O. Gajbhiye, Abhijeet V. Nandedkar, and Ibrahima Faye. 2020. Automatic Report Generation for Chest X-Ray Images: A Multilevel Multi-attention Approach. In Computer Vision and Image Processing. Springer Singapore, Singapore, 174–182.
- Gale et al. (2017) William Gale, Luke Oakden-Rayner, Gustavo Carneiro, Andrew P Bradley, and Lyle J Palmer. 2017. Detecting hip fractures with radiologist-level performance using deep neural networks. arXiv:1711.06504 (2017). arXiv:1711.06504
- Gale et al. (2019) W. Gale, L. Oakden-Rayner, G. Carneiro, L. J. Palmer, and A. P. Bradley. 2019. Producing Radiologist-Quality Reports for Interpretable Deep Learning.. In 2019 IEEE 16th Intl. Symposium on Biomedical Imaging (ISBI 2019). 1275–1279.
- García Seco de Herrera et al. (2018) Alba García Seco de Herrera, Carsten Eickhoff, Vincent Andrearczyk, and Henning Müller. 2018. Overview of the ImageCLEF 2018 Caption Prediction tasks. In CLEF2018 Working Notes (CEUR Workshop Proceedings). Avignon, France.
- Gasimova (2019) Aydan Gasimova. 2019. Automated Enriched Medical Concept Generation for Chest X-ray Images. In Interpretability of Machine Intelligence in Medical Image Computing and Multimodal Learning for Clinical Decision Support. Springer Intl. Publishing, Cham, 83–92.
- Goodfellow et al. (2014) Ian Goodfellow, Jean Pouget-Abadie, Mehdi Mirza, Bing Xu, David Warde-Farley, Sherjil Ozair, Aaron Courville, and Yoshua Bengio. 2014. Generative Adversarial Nets. In Advances in Neural Information Processing Systems 27. Curran Associates, Inc., 2672–2680.
- Graves and Schmidhuber (2005) Alex Graves and Jürgen Schmidhuber. 2005. Framewise phoneme classification with bidirectional LSTM and other neural network architectures. Neural networks 18, 5-6 (2005), 602–610.
- Graziani et al. (2018) Mara Graziani, Vincent Andrearczyk, and Henning Müller. 2018. Regression Concept Vectors for Bidirectional Explanations in Histopathology. In Understanding and Interpreting Machine Learning in Medical Image Computing Applications. Springer Intl. Publishing, Cham, 124–132.
- Gu et al. (2019) M. Gu, X. Huang, and Y. Fang. 2019. Automatic Generation of Pulmonary Radiology Reports with Semantic Tags. In 2019 IEEE 11th Intl. Conf. on Advanced Infocomm Technology (ICAIT). 162–167.
- Guidotti et al. (2018) Riccardo Guidotti, Anna Monreale, Salvatore Ruggieri, Franco Turini, Fosca Giannotti, and Dino Pedreschi. 2018. A survey of methods for explaining black box models. ACM computing surveys (CSUR) 51, 5 (2018), 1–42.
- Gunning (2017) David Gunning. 2017. Explainable artificial intelligence (xai). (2017).
- Han et al. (2018) Zhongyi Han, Benzheng Wei, Stephanie Leung, Jonathan Chung, and Shuo Li. 2018. Towards Automatic Report Generation in Spine Radiology Using Weakly Supervised Framework. In Medical Image Computing and Computer Assisted Intervention – MICCAI 2018. Springer Intl. Publishing, Cham, 185–193.
- Harzig et al. (2019a) Philipp Harzig, Yan-Ying Chen, Francine Chen, and Rainer Lienhart. 2019a. Addressing Data Bias Problems for Chest X-ray Image Report Generation. ArXiv abs/1908.02123 (2019).
- Harzig et al. (2019b) Philipp Harzig, Moritz Einfalt, and Rainer Lienhart. 2019b. Automatic Disease Detection and Report Generation for Gastrointestinal Tract Examination. In Proc of the 27th ACM Intl. Conf. on Multimedia (Nice, France) (MM ’19). ACM, New York, NY, USA, 2573–2577.
- Hasan et al. (2018a) Sadid A. Hasan, Yuan Ling, Oladimeji Farri, Joey Liu, Matthew Lungren, and Henning Müller. 2018a. Overview of the ImageCLEF 2018 Medical Domain Visual Question Answering Task. In CLEF2018 Working Notes (CEUR Workshop Proceedings). Avignon, France.
- Hasan et al. (2018b) Sadid A. Hasan, Yuan Ling, Joey Liu, Rithesh Sreenivasan, Shreya Anand, Tilak Raj Arora, Vivek Datla, Kathy Lee, Ashequl Qadir, Christine Swisher, and Oladimeji Farri. 2018b. Attention-Based Medical Caption Generation with Image Modality Classification and Clinical Concept Mapping. In Experimental IR Meets Multilinguality, Multimodality, and Interaction. Springer Intl. Publishing, Cham, 224–230.
- He et al. (2016) Kaiming He, Xiangyu Zhang, Shaoqing Ren, and Jian Sun. 2016. Deep residual learning for image recognition. In Proc of the IEEE Conf. on Computer Vision and Pattern Recognition (CVPR). 770–778.
- He et al. (2020) Xuehai He, Yichen Zhang, Luntian Mou, Eric Xing, and Pengtao Xie. 2020. PathVQA: 30000+ Questions for Medical Visual Question Answering. arXiv:2003.10286 (2020).
- Heath et al. (2001) Michael Heath, Kevin Bowyer, Daniel Kopans, Richard Moore, and P Kegelmeyer. 2001. The Digital Database for Screening Mammography. In Proc of the Fifth Intl. Workshop on Digital Mammography, M.J. Yaffe, ed., Medical Physics Publishing, Vol. 58. 212–218.
- Hicks et al. (2019) Steven Hicks, Michael Riegler, Pia Smedsrud, Trine B. Haugen, Kristin Ranheim Randel, Konstantin Pogorelov, Håkon Kvale Stensland, Duc-Tien Dang-Nguyen, Mathias Lux, Andreas Petlund, Thomas de Lange, Peter Thelin Schmidt, and Pål Halvorsen. 2019. ACM Multimedia BioMedia 2019 Grand Challenge Overview. In Proc of the 27th ACM Intl. Conf. on Multimedia (Nice, France) (MM ’19). ACM, 2563–2567.
- Hicks et al. (2018) Steven Alexander Hicks, Konstantin Pogorelov, Thomas de Lange, Mathias Lux, Mattis Jeppsson, Kristin Ranheim Randel, Sigrun Eskeland, Pål Halvorsen, and Michael Riegler. 2018. Comprehensible Reasoning and Automated Reporting of Medical Examinations Based on Deep Learning Analysis. In Proc of the 9th ACM Multimedia Systems Conference (Amsterdam, Netherlands) (MMSys ’18). ACM, 490–493.
- Hochreiter and Schmidhuber (1997) Sepp Hochreiter and Jürgen Schmidhuber. 1997. Long short-term memory. Neural computation 9, 8 (1997), 1735–1780.
- Hoover (1975) A Hoover. 1975. STARE database. Available: http://www.ces.clemson.edu/ ahoover/stare (1975).
- Howard et al. (2017) Andrew G Howard, Menglong Zhu, Bo Chen, Dmitry Kalenichenko, Weijun Wang, Tobias Weyand, Marco Andreetto, and Hartwig Adam. 2017. Mobilenets: Efficient convolutional neural networks for mobile vision applications. arXiv:1704.04861 (2017).
- Huang et al. (2017) Gao Huang, Zhuang Liu, Laurens Van Der Maaten, and Kilian Q Weinberger. 2017. Densely connected convolutional networks. In Proc of the IEEE Conf. on Computer Vision and Pattern Recognition (CVPR). 4700–4708.
- Huang et al. (2019) Xin Huang, Fengqi Yan, Wei Xu, and Maozhen Li. 2019. Multi-Attention and Incorporating Background Information Model for Chest X-Ray Image Report Generation. IEEE Access 7 (2019), 154808–154817.
- Hwang et al. (2019) Eui Jin Hwang, Sunggyun Park, Kwang-Nam Jin, Jung Im Kim, So Young Choi, Jong Hyuk Lee, Jin Mo Goo, Jaehong Aum, Jae-Joon Yim, Julien G. Cohen, Gilbert R. Ferretti, Chang Min Park, for the DLAD Development, and Evaluation Group. 2019. Development and Validation of a Deep Learning–Based Automated Detection Algorithm for Major Thoracic Diseases on Chest Radiographs. JAMA Network Open 2, 3 (03 2019), e191095–e191095.
- Irvin et al. (2019) Jeremy Irvin, Pranav Rajpurkar, Michael Ko, Yifan Yu, Silviana Ciurea-Ilcus, Chris Chute, Henrik Marklund, Behzad Haghgoo, Robyn Ball, Katie Shpanskaya, et al. 2019. Chexpert: A large chest radiograph dataset with uncertainty labels and expert comparison. In Proc of the AAAI Conf. on Artificial Intelligence, Vol. 33. Association for the Advancement of Artificial Intelligence (AAAI), 590–597.
- Jackson (2018) EF Jackson. 2018. Quantitative Imaging: The Translation from Research Tool to Clinical Practice. Radiology 286, 2 (2018), 499.
- Jain et al. (2021) Saahil Jain, Ashwin Agrawal, Adriel Saporta, Steven Truong, Du Nguyen Duong, Tan Bui, Pierre Chambon, Yuhao Zhang, Matthew P. Lungren, Andrew Y. Ng, Curtis Langlotz, and Pranav Rajpurkar. 2021. RadGraph: Extracting Clinical Entities and Relations from Radiology Reports. In Thirty-fifth Conference on Neural Information Processing Systems Datasets and Benchmarks Track (Round 1). https://openreview.net/forum?id=pMWtc5NKd7V
- Jain and Wallace (2019) Sarthak Jain and Byron C. Wallace. 2019. Attention is not Explanation. In Proc of the 2019 Conf. of the North American Chapter of the ACL: Human Language Technologies, Volume 1 (Long and Short Papers). ACL, Minneapolis, Minnesota.
- Jing et al. (2019) Baoyu Jing, Zeya Wang, and Eric Xing. 2019. Show, Describe and Conclude: On Exploiting the Structure Information of Chest X-ray Reports. In Proc of the 57th Annual Meeting of the ACL. ACL, Florence, Italy, 6570–6580.
- Jing et al. (2018) Baoyu Jing, Pengtao Xie, and Eric Xing. 2018. On the Automatic Generation of Medical Imaging Reports. In Proc of the 56th Annual Meeting of the ACL (Volume 1: Long Papers). ACL, Melbourne, Australia, 2577–2586.
- Johnson et al. (2019b) Alistair EW Johnson, Tom J Pollard, Nathaniel R Greenbaum, Matthew P Lungren, Chih-ying Deng, Yifan Peng, Zhiyong Lu, Roger G Mark, Seth J Berkowitz, and Steven Horng. 2019b. MIMIC-CXR-JPG, a large publicly available database of labeled chest radiographs. arXiv:1901.07042 (2019). arXiv:1901.07042
- Johnson et al. (2019a) Alistair E. W. Johnson, Tom J. Pollard, Seth J. Berkowitz, Nathaniel R. Greenbaum, Matthew P. Lungren, Chih-ying Deng, Roger G. Mark, and Steven Horng. 2019a. MIMIC-CXR, a de-identified publicly available database of chest radiographs with free-text reports. Scientific Data 6, 1 (12 Dec 2019), 317.
- Kaelbling et al. (1996) Leslie Pack Kaelbling, Michael L Littman, and Andrew W Moore. 1996. Reinforcement learning: A survey. Journal of artificial intelligence research 4 (1996), 237–285.
- Kälviäinen and Uusitalo (2007) RVJPH Kälviäinen and H Uusitalo. 2007. DIARETDB1 diabetic retinopathy database and evaluation protocol. In Medical Image Understanding and Analysis, Vol. 2007. Citeseer, 61.
- Kauppi et al. (2006) Tomi Kauppi, Valentina Kalesnykiene, Joni-Kristian Kamarainen, Lasse Lensu, Iiris Sorri, Hannu Uusitalo, Heikki Kälviäinen, and Juhani Pietilä. 2006. DIARETDB0: Evaluation database and methodology for diabetic retinopathy algorithms. Machine Vision and Pattern Recognition Research Group, Lappeenranta University of Technology, Finland 73 (2006), 1–17.
- Khan et al. (2020) Asifullah Khan, Anabia Sohail, Umme Zahoora, and Aqsa Saeed Qureshi. 2020. A survey of the recent architectures of deep convolutional neural networks. Artificial Intelligence Review (21 Apr 2020), 1–62.
- Kim et al. (2018) Been Kim, Martin Wattenberg, Justin Gilmer, Carrie Cai, James Wexler, Fernanda Viegas, and Rory sayres. 2018. Interpretability Beyond Feature Attribution: Quantitative Testing with Concept Activation Vectors (TCAV) (Proc of Machine Learning Research), Vol. 80. PMLR, Stockholmsmässan, Stockholm Sweden, 2668–2677.
- Kisilev et al. (2016) Pavel Kisilev, Eli Sason, Ella Barkan, and Sharbell Hashoul. 2016. Medical Image Description Using Multi-task-loss CNN. In Deep Learning and Data Labeling for Medical Applications. Springer Intl. Publishing, Cham, 121–129.
- Komodakis and Zagoruyko (2017) Nikos Komodakis and Sergey Zagoruyko. 2017. Paying more attention to attention: improving the performance of convolutional neural networks via attention transfer. In ICLR. Paris, France.
- Kornblith et al. (2019) Simon Kornblith, Jonathon Shlens, and Quoc V Le. 2019. Do better imagenet models transfer better?. In 2019 IEEE/CVF Conf. on Computer Vision and Pattern Recognition (CVPR). IEEE Computer Society, Los Alamitos, CA, USA, 2656–2666.
- Krizhevsky et al. (2012) Alex Krizhevsky, Ilya Sutskever, and Geoffrey E Hinton. 2012. ImageNet Classification with Deep Convolutional Neural Networks. In Advances in Neural Information Processing Systems 25. Curran Associates, Inc., 1097–1105.
- Kumar et al. (2010) M. P. Kumar, Benjamin Packer, and Daphne Koller. 2010. Self-Paced Learning for Latent Variable Models. In Advances in Neural Information Processing Systems 23. Curran Associates, Inc., 1189–1197.
- Langlotz (2006) Curtis P Langlotz. 2006. RadLex: a new method for indexing online educational materials. Radiographics: a review publication of the Radiological Society of North America, Inc 26, 6 (2006), 1595.
- Lavie and Agarwal (2007) Alon Lavie and Abhaya Agarwal. 2007. Meteor: An Automatic Metric for MT Evaluation with High Levels of Correlation with Human Judgments. In Proc of the Second Workshop on Statistical Machine Translation (Prague, Czech Republic) (StatMT ’07). ACL, USA, 228–231.
- Le and Mikolov (2014) Quoc Le and Tomas Mikolov. 2014. Distributed representations of sentences and documents. In Intl. Conf. on machine learning. 1188–1196.
- Leaman et al. (2015) Robert Leaman, Ritu Khare, and Zhiyong Lu. 2015. Challenges in clinical natural language processing for automated disorder normalization. Journal of biomedical informatics 57 (2015), 28–37.
- Li et al. (2018) Christy Y. Li, Xiaodan Liang, Zhiting Hu, and Eric P. Xing. 2018. Hybrid Retrieval-Generation Reinforced Agent for Medical Image Report Generation. In Proc of the 32nd Intl. Conf. on Neural Information Processing Systems (Montréal, Canada) (NIPS’18). Curran Associates Inc., Red Hook, NY, USA, 1537–1547.
- Li et al. (2019b) Christy Y Li, Xiaodan Liang, Zhiting Hu, and Eric P Xing. 2019b. Knowledge-Driven Encode, Retrieve, Paraphrase for Medical Image Report Generation. In Proc of the AAAI Conf. on Artificial Intelligence, Vol. 33. 6666–6673.
- Li and Hong (2019) Jiyun Li and Yongliang Hong. 2019. Label Generation System Based on Generative Adversarial Network for Medical Image. In Proc of the 2nd Intl. Conf. on Artificial Intelligence and Pattern Recognition (Beijing, China) (AIPR ’19). ACM, 78–82.
- Li et al. (2015) Jiwei Li, Thang Luong, and Dan Jurafsky. 2015. A Hierarchical Neural Autoencoder for Paragraphs and Documents. In Proc of the 53rd Annual Meeting of the ACL and the 7th Intl. Joint Conf. on Natural Language Processing (Volume 1: Long Papers). ACL, Beijing, China, 1106–1115.
- Li et al. (2019a) Xin Li, Rui Cao, and Dongxiao Zhu. 2019a. Vispi: Automatic Visual Perception and Interpretation of Chest X-rays. arXiv:1906.05190 (2019).
- Lin (2004) Chin-Yew Lin. 2004. ROUGE: A Package for Automatic Evaluation of Summaries. In Text Summarization Branches Out. ACL, Barcelona, Spain, 74–81.
- Lipton (2018) Zachary C Lipton. 2018. The mythos of model interpretability. Commun. ACM 61, 10 (2018), 36–43.
- Liu et al. (2019) Guanxiong Liu, Tzu-Ming Harry Hsu, Matthew McDermott, Willie Boag, Wei-Hung Weng, Peter Szolovits, and Marzyeh Ghassemi. 2019. Clinically Accurate Chest X-Ray Report Generation. In Machine Learning for Healthcare Conference (Proc of Machine Learning Research), Vol. 106. PMLR, Ann Arbor, Michigan, 249–269.
- Loveymi et al. (2020) Samira Loveymi, Mir Hossein Dezfoulian, and Muharram Mansoorizadeh. 2020. Generate Structured Radiology Report from CT Images Using Image Annotation Techniques: Preliminary Results with Liver CT. Journal of Digital Imaging 33, 2 (01 Apr 2020), 375–390.
- Ma et al. (2018) Kai Ma, Kaijie Wu, Hao Cheng, Chaochen Gu, Rui Xu, and Xinping Guan. 2018. A Pathology Image Diagnosis Network with Visual Interpretability and Structured Diagnostic Report. In Neural Information Processing. Springer Intl. Publishing, Cham, 282–293.
- Maksoud et al. (2019) Sam Maksoud, Arnold Wiliem, Kun Zhao, Teng Zhang, Lin Wu, and Brian Lovell. 2019. CORAL8: Concurrent Object Regression for Area Localization in Medical Image Panels. In Medical Image Computing and Computer Assisted Intervention – MICCAI 2019. Springer Intl. Publishing, Cham, 432–441.
- Mathur et al. (2020) Nitika Mathur, Timothy Baldwin, and Trevor Cohn. 2020. Tangled up in BLEU: Reevaluating the Evaluation of Automatic Machine Translation Evaluation Metrics. In Proceedings of the 58th Annual Meeting of the Association for Computational Linguistics. Association for Computational Linguistics, Online, 4984–4997. https://doi.org/10.18653/v1/2020.acl-main.448
- Monshi et al. (2020) Maram Mahmoud A. Monshi, Josiah Poon, and Vera Chung. 2020. Deep learning in generating radiology reports: A survey. Artificial Intelligence in Medicine 106 (2020), 101878.
- Moradi et al. (2016) Mehdi Moradi, Yufan Guo, Yaniv Gur, Mohammadreza Negahdar, and Tanveer Syeda-Mahmood. 2016. A Cross-Modality Neural Network Transform for Semi-automatic Medical Image Annotation. In Medical Image Computing and Computer-Assisted Intervention – MICCAI 2016. Springer Intl. Publishing, Cham, 300–307.
- Moreira et al. (2012) Inês C Moreira, Igor Amaral, Inês Domingues, António Cardoso, Maria Joao Cardoso, and Jaime S Cardoso. 2012. Inbreast: toward a full-field digital mammographic database. Academic radiology 19, 2 (2012), 236–248.
- Mork et al. (2013) J. G. Mork, A. J. J. Yepes, and A. R. Aronson. 2013. The NLM medical text indexer system for indexing biomedical literature. In CEUR Workshop Proceedings, Vol. 1094.
- Otter et al. (2020) Daniel W Otter, Julian R Medina, and Jugal K Kalita. 2020. A Survey of the Usages of Deep Learning for Natural Language Processing. IEEE Transactions on Neural Networks and Learning Systems (2020), 1–21.
- Papineni et al. (2002) Kishore Papineni, Salim Roukos, Todd Ward, and Wei-Jing Zhu. 2002. Bleu: a Method for Automatic Evaluation of Machine Translation. In Proc of the 40th Annual Meeting of the ACL. ACL, ACL, Philadelphia, Pennsylvania, USA, 311–318.
- Pascanu et al. (2013) Razvan Pascanu, Tomas Mikolov, and Yoshua Bengio. 2013. On the Difficulty of Training Recurrent Neural Networks. In Proc of the 30th Intl. Conf. on Intl. Conf. on Machine Learning - Volume 28 (ICML’13). JMLR.org, Atlanta, GA, USA, III–1310–III–1318.
- Pavlopoulos et al. (2019) John Pavlopoulos, Vasiliki Kougia, and Ion Androutsopoulos. 2019. A Survey on Biomedical Image Captioning. In Proc of the Second Workshop on Shortcomings in Vision and Language. ACL, Minneapolis, Minnesota, 26–36.
- Pelka et al. (2018) Obioma Pelka, Sven Koitka, Johannes Rückert, Felix Nensa, and Christoph M. Friedrich. 2018. Radiology Objects in COntext (ROCO): A Multimodal Image Dataset. In Intravascular Imaging and Computer Assisted Stenting and Large-Scale Annotation of Biomedical Data and Expert Label Synthesis. Springer Intl. Publishing, Cham, 180–189.
- Peng et al. (2018) Yifan Peng, Xiaosong Wang, Le Lu, Mohammadhadi Bagheri, Ronald Summers, and Zhiyong Lu. 2018. Negbio: a high-performance tool for negation and uncertainty detection in radiology reports. AMIA Summits on Translational Science Proceedings 2018 (2018), 188.
- Pino et al. (2021) Pablo Pino, Denis Parra, Cecilia Besa, and Claudio Lagos. 2021. Clinically Correct Report Generation from Chest X-Rays Using Templates. In Machine Learning in Medical Imaging, Chunfeng Lian, Xiaohuan Cao, Islem Rekik, Xuanang Xu, and Pingkun Yan (Eds.). Springer International Publishing, Cham, 654–663. https://doi.org/10.1007/978-3-030-87589-3_67
- Pino et al. (2020) Pablo Pino, Denis Parra, Pablo Messina, Cecilia Besa, and Sergio Uribe. 2020. Inspecting state of the art performance and NLP metrics in image-based medical report generation. arXiv preprint arXiv:2011.09257 (2020). In LXAI at NeurIPS 2020.
- Raghu et al. (2019) Maithra Raghu, Chiyuan Zhang, Jon Kleinberg, and Samy Bengio. 2019. Transfusion: Understanding transfer learning for medical imaging. In Advances in Neural Information Processing Systems 32. Curran Associates, Inc., 3347–3357.
- Rajpurkar et al. (2017) Pranav Rajpurkar, Jeremy Irvin, Kaylie Zhu, Brandon Yang, Hershel Mehta, Tony Duan, Daisy Ding, Aarti Bagul, Curtis Langlotz, Katie Shpanskaya, et al. 2017. Chexnet: Radiologist-level pneumonia detection on chest x-rays with deep learning. arXiv:1711.05225 (2017).
- Reiter (2018) Ehud Reiter. 2018. A structured review of the validity of BLEU. Computational Linguistics 44, 3 (2018), 393–401. https://doi.org/10.1162/coli_a_00322
- Ren et al. (2015) Shaoqing Ren, Kaiming He, Ross Girshick, and Jian Sun. 2015. Faster R-CNN: Towards Real-Time Object Detection with Region Proposal Networks. In Advances in Neural Information Processing Systems 28. Curran Associates, Inc., 91–99.
- Reyes et al. (2020) Mauricio Reyes, Raphael Meier, Sérgio Pereira, Carlos A Silva, Fried-Michael Dahlweid, Hendrik von Tengg-Kobligk, Ronald M Summers, and Roland Wiest. 2020. On the Interpretability of Artificial Intelligence in Radiology: Challenges and Opportunities. Radiology: Artificial Intelligence 2, 3 (2020), e190043.
- Ribeiro et al. (2016) Marco Tulio Ribeiro, Sameer Singh, and Carlos Guestrin. 2016. “Why Should I Trust You?”: Explaining the Predictions of Any Classifier. In Proc of the 22nd ACM SIGKDD Intl. Conf. on Knowledge Discovery and Data Mining (San Francisco, California, USA) (KDD ’16). ACM, 1135–1144.
- Rogers (1963) Frank B Rogers. 1963. Medical subject headings. Bulletin of the Medical Library Association 51, 1 (1963), 114–116.
- Ronneberger et al. (2015) Olaf Ronneberger, Philipp Fischer, and Thomas Brox. 2015. U-Net: Convolutional Networks for Biomedical Image Segmentation. In Medical Image Computing and Computer-Assisted Intervention – MICCAI 2015. Springer Intl. Publishing, Cham, 234–241.
- Rosman et al. (2019) David A Rosman, Judith Bamporiki, Rebecca Stein-Wexler, and Robert D Harris. 2019. Developing diagnostic radiology training in low resource countries. Current Radiology Reports 7, 9 (2019), 27.
- Selvaraju et al. (2017) Ramprasaath R Selvaraju, Michael Cogswell, Abhishek Das, Ramakrishna Vedantam, Devi Parikh, and Dhruv Batra. 2017. Grad-cam: Visual explanations from deep networks via gradient-based localization. In Proc of the IEEE Intl. Conf. on Computer Vision (ICCV). 618–626.
- Shickel et al. (2017) Benjamin Shickel, Patrick James Tighe, Azra Bihorac, and Parisa Rashidi. 2017. Deep EHR: a survey of recent advances in deep learning techniques for electronic health record (EHR) analysis. IEEE journal of biomedical and health informatics 22, 5 (2017), 1589–1604.
- Shin et al. (2016) Hoo-Chang Shin, Kirk Roberts, Le Lu, Dina Demner-Fushman, Jianhua Yao, and Ronald M Summers. 2016. Learning to read chest x-rays: Recurrent neural cascade model for automated image annotation. In Proc of the IEEE Conf. on Computer Vision and Pattern Recognition (CVPR). 2497–2506.
- Shrikumar et al. (2017) Avanti Shrikumar, Peyton Greenside, and Anshul Kundaje. 2017. Learning Important Features through Propagating Activation Differences. In Proc of the 34th Intl. Conf. on Machine Learning - Volume 70 (ICML’17). JMLR.org, Sydney, NSW, Australia, 3145–3153.
- Simonyan and Zisserman (2014) Karen Simonyan and Andrew Zisserman. 2014. Very deep convolutional networks for large-scale image recognition. arXiv:1409.1556 (2014).
- Singh et al. (2019) Sonit Singh, Sarvnaz Karimi, Kevin Ho-Shon, and Len Hamey. 2019. From Chest X-Rays to Radiology Reports: A Multimodal Machine Learning Approach. In 2019 Digital Image Computing: Techniques and Applications (DICTA). IEEE, 1–8.
- Smilkov et al. (2017) Daniel Smilkov, Nikhil Thorat, Been Kim, Fernanda Viégas, and Martin Wattenberg. 2017. Smoothgrad: removing noise by adding noise. arXiv:1706.03825 (2017).
- Soldaini and Goharian (2016) Luca Soldaini and Nazli Goharian. 2016. Quickumls: a fast, unsupervised approach for medical concept extraction. In MedIR workshop, sigir. 1–4.
- Spinks and Moens (2019) Graham Spinks and Marie-Francine Moens. 2019. Justifying diagnosis decisions by deep neural networks. Journal of biomedical informatics 96 (2019), 103248.
- Springenberg et al. (2015) J Springenberg, Alexey Dosovitskiy, Thomas Brox, and M Riedmiller. 2015. Striving for Simplicity: The All Convolutional Net. In ICLR (workshop track).
- Sun et al. (2019) Li Sun, Weipeng Wang, Jiyun Li, and Jingsheng Lin. 2019. Study on Medical Image Report Generation Based on Improved Encoding-Decoding Method. In Intelligent Computing Theories and Application. Springer Intl. Publishing, Cham, 686–696.
- Szegedy et al. (2015) Christian Szegedy, Wei Liu, Yangqing Jia, Pierre Sermanet, Scott Reed, Dragomir Anguelov, Dumitru Erhan, Vincent Vanhoucke, and Andrew Rabinovich. 2015. Going deeper with convolutions. In Proc of the IEEE Conf. on Computer Vision and Pattern Recognition (CVPR). 1–9.
- Szegedy et al. (2016) Christian Szegedy, Vincent Vanhoucke, Sergey Ioffe, Jon Shlens, and Zbigniew Wojna. 2016. Rethinking the inception architecture for computer vision. In Proc of the IEEE Conf. on Computer Vision and Pattern Recognition (CVPR). 2818–2826.
- Tian et al. (2018) Jiang Tian, Cong Li, Zhongchao Shi, and Feiyu Xu. 2018. A Diagnostic Report Generator from CT Volumes on Liver Tumor with Semi-supervised Attention Mechanism. In Medical Image Computing and Computer Assisted Intervention – MICCAI 2018. Springer Intl. Publishing, Cham, 702–710.
- Tian et al. (2019) Jiang Tian, Cheng Zhong, Zhongchao Shi, and Feiyu Xu. 2019. Towards Automatic Diagnosis from Multi-modal Medical Data. In Interpretability of Machine Intelligence in Medical Image Computing and Multimodal Learning for Clinical Decision Support. Springer Intl. Publishing, Cham, 67–74.
- Tjoa and Guan (2019) Erico Tjoa and Cuntai Guan. 2019. A survey on explainable artificial intelligence (XAI): towards medical XAI. arXiv:1907.07374 (2019).
- Tonekaboni et al. (2019) Sana Tonekaboni, Shalmali Joshi, Melissa D. McCradden, and Anna Goldenberg. 2019. What Clinicians Want: Contextualizing Explainable Machine Learning for Clinical End Use. In Proc of the 4th Machine Learning for Healthcare Conference (Proc of Machine Learning Research), Vol. 106. PMLR, Ann Arbor, Michigan, 359–380.
- Topol (2019) Eric Topol. 2019. Deep Medicine: How Artificial Intelligence Can Make Healthcare Human Again (1st ed.). Basic Books, Inc., USA.
- Tsai and Tao (2019) Min-Jen Tsai and Yu-Han Tao. 2019. Machine Learning Based Common Radiologist-Level Pneumonia Detection on Chest X-rays. In 2019 13th Intl. Conf. on Signal Processing and Communication Systems (ICSPCS). IEEE, 1–7.
- van Miltenburg et al. (2021) Emiel van Miltenburg, Miruna Clinciu, Ondřej Dušek, Dimitra Gkatzia, Stephanie Inglis, Leo Leppänen, Saad Mahamood, Emma Manning, Stephanie Schoch, Craig Thomson, and Luou Wen. 2021. Underreporting of errors in NLG output, and what to do about it. In Proceedings of the 14th International Conference on Natural Language Generation. Association for Computational Linguistics, Aberdeen, Scotland, UK, 140–153. https://aclanthology.org/2021.inlg-1.14
- van Miltenburg et al. (2020) Emiel van Miltenburg, Wei-Ting Lu, Emiel Krahmer, Albert Gatt, Guanyi Chen, Lin Li, and Kees van Deemter. 2020. Gradations of Error Severity in Automatic Image Descriptions. In Proceedings of the 13th International Conference on Natural Language Generation. Association for Computational Linguistics, Dublin, Ireland, 398–411. https://aclanthology.org/2020.inlg-1.45
- Vaswani et al. (2017) Ashish Vaswani, Noam Shazeer, Niki Parmar, Jakob Uszkoreit, Llion Jones, Aidan N Gomez, Łukasz Kaiser, and Illia Polosukhin. 2017. Attention is All you Need. In Advances in Neural Information Processing Systems 30. Curran Associates, Inc., 5998–6008.
- Vedantam et al. (2015) Ramakrishna Vedantam, C Lawrence Zitnick, and Devi Parikh. 2015. Cider: Consensus-based image description evaluation. In Proc of the IEEE Conf. on Computer Vision and Pattern Recognition (CVPR). 4566–4575.
- Vinyals et al. (2015) Oriol Vinyals, Alexander Toshev, Samy Bengio, and Dumitru Erhan. 2015. Show and Tell: A Neural Image Caption Generator. In Proc of the IEEE Conf. on Computer Vision and Pattern Recognition (CVPR). 3156–3164.
- Wang et al. (2016) Jinhua Wang, Xi Yang, Hongmin Cai, Wanchang Tan, Cangzheng Jin, and Li Li. 2016. Discrimination of Breast Cancer with Microcalcifications on Mammography by Deep Learning. Scientific Reports (Nature Publisher Group) 6 (2016), 27327.
- Wang et al. (2017) Xiaosong Wang, Yifan Peng, Le Lu, Zhiyong Lu, Mohammadhadi Bagheri, and Ronald M. Summers. 2017. ChestX-ray8: Hospital-Scale Chest X-Ray Database and Benchmarks on Weakly-Supervised Classification and Localization of Common Thorax Diseases. In The IEEE Conf. on Computer Vision and Pattern Recognition (CVPR). 3462–3471.
- Wang et al. (2018) Xiaosong Wang, Yifan Peng, Le Lu, Zhiyong Lu, and Ronald M Summers. 2018. Tienet: Text-image embedding network for common thorax disease classification and reporting in chest x-rays. In Proc of the IEEE Conf. on Computer Vision and Pattern Recognition (CVPR). 9049–9058.
- Wang et al. (2019) Xuwen Wang, Yu Zhang, Zhen Guo, and Jiao Li. 2019. A Computational Framework Towards Medical Image Explanation. In Artificial Intelligence in Medicine: Knowledge Representation and Transparent and Explainable Systems. Springer Intl. Publishing, Cham, 120–131.
- Williams and Zipser (1989) Ronald J Williams and David Zipser. 1989. A learning algorithm for continually running fully recurrent neural networks. Neural computation 1, 2 (1989), 270–280.
- Wu et al. (2018) C. Wu, H. Chang, J. Liu, and J. R. Jang. 2018. Adaptive Generation of Structured Medical Report Using NER Regarding Deep Learning. In 2018 Conf. on Technologies and Applications of Artificial Intelligence (TAAI). 10–13.
- Wu et al. (2017) Luhui Wu, Cheng Wan, Yiquan Wu, and Jiang Liu. 2017. Generative caption for diabetic retinopathy images. In 2017 Intl. Conf. on Security, Pattern Analysis, and Cybernetics (SPAC). 515–519.
- Xie et al. (2020) Xiaozheng Xie, Jianwei Niu, Xuefeng Liu, Zhengsu Chen, and Shaojie Tang. 2020. A Survey on Domain Knowledge Powered Deep Learning for Medical Image Analysis. arXiv:2004.12150 (2020).
- Xie et al. (2019) Xiancheng Xie, Yun Xiong, Philip S. Yu, Kangan Li, Suhua Zhang, and Yangyong Zhu. 2019. Attention-Based Abnormal-Aware Fusion Network for Radiology Report Generation. In Database Systems for Advanced Applications. Springer Intl. Publishing, Cham, 448–452.
- Xiong et al. (2019) Yuxuan Xiong, Bo Du, and Pingkun Yan. 2019. Reinforced Transformer for Medical Image Captioning. In Machine Learning in Medical Imaging. Springer Intl. Publishing, Cham, 673–680.
- Xu et al. (2015) Kelvin Xu, Jimmy Lei Ba, Ryan Kiros, Kyunghyun Cho, Aaron Courville, Ruslan Salakhutdinov, Richard S. Zemel, and Yoshua Bengio. 2015. Show, Attend and Tell: Neural Image Caption Generation with Visual Attention. In Proc of the 32nd Intl. Conf. on Intl. Conf. on Machine Learning - Volume 37 (ICML’15). JMLR.org, Lille, France, 2048–2057.
- Xue and Huang (2019) Yuan Xue and Xiaolei Huang. 2019. Improved Disease Classification in Chest X-Rays with Transferred Features from Report Generation. In Information Processing in Medical Imaging. Springer Intl. Publishing, Cham, 125–138.
- Xue et al. (2018) Yuan Xue, Tao Xu, L Rodney Long, Zhiyun Xue, Sameer Antani, George R Thoma, and Xiaolei Huang. 2018. Multimodal recurrent model with attention for automated radiology report generation. In Intl. Conf. on Medical Image Computing and Computer-Assisted Intervention. Springer, 457–466.
- Yin et al. (2019) C. Yin, B. Qian, J. Wei, X. Li, X. Zhang, Y. Li, and Q. Zheng. 2019. Automatic Generation of Medical Imaging Diagnostic Report with Hierarchical Recurrent Neural Network. In 2019 IEEE Intl. Conf. on Data Mining (ICDM). 728–737.
- Yuan et al. (2019) Jianbo Yuan, Haofu Liao, Rui Luo, and Jiebo Luo. 2019. Automatic Radiology Report Generation Based on Multi-view Image Fusion and Medical Concept Enrichment. In Medical Image Computing and Computer Assisted Intervention – MICCAI 2019. Springer Intl. Publishing, Cham, 721–729.
- Zeng et al. (2020) Xianhua Zeng, Li Wen, Banggui Liu, and Xiaojun Qi. 2020. Deep learning for ultrasound image caption generation based on object detection. Neurocomputing 392 (2020), 132–141.
- Zeng et al. (2018) Xian-Hua Zeng, Bang-Gui Liu, and Meng Zhou. 2018. Understanding and Generating Ultrasound Image Description. Journal of Computer Science and Technology 33, 5 (2018), 1086–1100.
- Zhang et al. (2017b) Han Zhang, Tao Xu, Hongsheng Li, Shaoting Zhang, Xiaogang Wang, Xiaolei Huang, and Dimitris N Metaxas. 2017b. Stackgan: Text to photo-realistic image synthesis with stacked generative adversarial networks. In Proc of the IEEE Intl. Conf. on Computer Vision (ICCV). 5907–5915.
- Zhang et al. (2015) Xiang Zhang, Junbo Zhao, and Yann LeCun. 2015. Character-Level Convolutional Networks for Text Classification. In Proc of the 28th Intl. Conf. on Neural Information Processing Systems - Volume 1 (Montreal, Canada) (NIPS’15). MIT Press, Cambridge, MA, USA, 649–657.
- Zhang et al. (2020a) Yuhao Zhang, Derek Merck, Emily Tsai, Christopher D. Manning, and Curtis Langlotz. 2020a. Optimizing the Factual Correctness of a Summary: A Study of Summarizing Radiology Reports. In Proceedings of the 58th Annual Meeting of the Association for Computational Linguistics. Association for Computational Linguistics, Online, 5108–5120. https://doi.org/10.18653/v1/2020.acl-main.458
- Zhang et al. (2020b) Yixiao Zhang, Xiaosong Wang, Ziyue Xu, Qihang Yu, Alan Yuille, and Daguang Xu. 2020b. When Radiology Report Generation Meets Knowledge Graph. Proceedings of the AAAI Conference on Artificial Intelligence 34, 07 (Apr. 2020), 12910–12917. https://doi.org/10.1609/aaai.v34i07.6989
- Zhang et al. (2017a) Zizhao Zhang, Yuanpu Xie, Fuyong Xing, Mason McGough, and Lin Yang. 2017a. Mdnet: A semantically and visually interpretable medical image diagnosis network. In Proc of the IEEE Conf. on Computer Vision and Pattern Recognition (CVPR). 3549–3557.
- Zhao et al. (2017) Jake Zhao, Yoon Kim, Kelly Zhang, Alexander M. Rush, and Yann LeCun. 2017. Adversarially Regularized Autoencoders. arXiv:cs.LG/1706.04223
- Zhou et al. (2016) Bolei Zhou, Aditya Khosla, Agata Lapedriza, Aude Oliva, and Antonio Torralba. 2016. Learning deep features for discriminative localization. In Proc of the IEEE Conf. on Computer Vision and Pattern Recognition (CVPR). 2921–2929.
- Zhu et al. (2017a) Feng Zhu, Hongsheng Li, Wanli Ouyang, Nenghai Yu, and Xiaogang Wang. 2017a. Learning spatial regularization with image-level supervisions for multi-label image classification. In Proc of the IEEE Conf. on Computer Vision and Pattern Recognition (CVPR). 2027–2036.
- Zhu et al. (2017b) Jun-Yan Zhu, Taesung Park, Phillip Isola, and Alexei A Efros. 2017b. Unpaired image-to-image translation using cycle-consistent adversarial networks. In Proc of the IEEE Intl. Conf. on computer vision. 2223–2232.
9. Supplementary Material
9.1. Datasets
Next, we include Table 8 with the main highlights of all datasets, including both public and proprietary, and Table 9 with details of the additional information provided by each collection.
| Dataset | Year | Image Type | # images | # reports | # patients | Used by papers |
| Public report datasets | ||||||
| IU X-ray (Demner-Fushman et al., 2015) | 2015 | Chest X-Ray | 7,470 | 3,955 | 3,955 | (Jing et al., 2018; Liu et al., 2019; Huang et al., 2019; Yuan et al., 2019; Li et al., 2018, 2019b; Wang et al., 2018; Xue et al., 2018; Li et al., 2019a; Xiong et al., 2019; Singh et al., 2019; Yin et al., 2019; Tian et al., 2019; Gasimova, 2019; Gajbhiye et al., 2020; Harzig et al., 2019a; Biswal et al., 2020; Xie et al., 2019; Xue and Huang, 2019; Zhang et al., 2020b; Jing et al., 2019; Shin et al., 2016) |
| MIMIC-CXR (Johnson et al., 2019a, b) | 2019 | Chest X-Ray | 377,110 | 227,827 | 65,379 | (Liu et al., 2019) |
| PadChest(Bustos et al., 2019) | 2019 | Chest X-Ray | 160,868 | 109,931 | 67,625 | None |
| ImageCLEF Caption 2017 (Eickhoff et al., 2017) | 2017 | Biomedical | 184,614 | 184,614 | - | (Hasan et al., 2018b) |
| ImageCLEF Caption 2018 (García Seco de Herrera et al., 2018) | 2018 | Biomedical | 232,305 | 232,305 | - | None |
| ROCO (Pelka et al., 2018) | 2018 | Multiple radiology | 81,825 | 81,825 | - | None |
| PEIR Gross (Jing et al., 2018) | 2017 | Gross lesions | 7,442 | 7,442 | - | (Jing et al., 2018) |
| INBreast(Moreira et al., 2012) | 2012 | Mammography X-ray | 410 | 115 | 115 | (Sun et al., 2019; Li and Hong, 2019) |
| STARE (Hoover, 1975) | 1975 | Retinal fundus | 400 | 400 | - | None |
| RDIF(Maksoud et al., 2019) | 2019 | Kidney Biopsy | 1,152 | 144 | 144 | (Maksoud et al., 2019) |
| Private report datasets | ||||||
| CX-CHR(Li et al., 2018, 2019b; Jing et al., 2019) | 2018 | Chest X-Ray | 45,598 | 35,609 | 35,609 | (Li et al., 2018, 2019b; Jing et al., 2019) |
| TJU(Gu et al., 2019) | 2019 | Chest X-Ray | 19,985 | 19,985 | - | (Gu et al., 2019) |
| Hip fracture (Gale et al., 2017, 2019) | 2017 | Hip X-Ray | 53,279 | 4,010 | 26,639 | (Gale et al., 2019) |
| Ultrasound (Zeng et al., 2018, 2020) | 2018 | Gallbladder, kidney and liver ultrasound | 4,302 | 4,302 | - | (Zeng et al., 2018, 2020) |
| Fetal Ultrasound (Alsharid et al., 2019) | 2019 | Fetal ultrasound | 2,800 | 2,800 | - | (Alsharid et al., 2019) |
| CINDRAL (Ma et al., 2018) | 2018 | Cervical neoplasm WSI | 1,000 | 1,000 | 50 | (Ma et al., 2018) |
| BCIDR (Zhang et al., 2017a) | 2017 | Bladder biopsy | 1,000 | 1,000 | 32 | (Zhang et al., 2017a) |
| Continuous wave (Moradi et al., 2016) | 2016 | Continuous wave doppler echocardiography | 722 | 10,479 | - | (Moradi et al., 2016) |
| Public classification datasets | ||||||
| CheXpert (Irvin et al., 2019) | 2019 | Chest X-Ray | 224,316 | 0 | 65,240 | (Yuan et al., 2019; Zhang et al., 2020b) |
| ChestX-ray14 (Wang et al., 2017) | 2017 | Chest X-Ray | 112,120 | 0 | 30,805 | (Li et al., 2019b; Wang et al., 2018; Li et al., 2019a; Xiong et al., 2019; Biswal et al., 2020; Xue and Huang, 2019; Jing et al., 2019) |
| LiTS (Christ et al., 2017) | 2017 | Liver CT scans | 200 | 0 | - | (Tian et al., 2018) |
| ACM Biomedia 2019 (Hicks et al., 2019) | 2019 | Gastrointestinal tract | 14,033 | 0 | - | (Harzig et al., 2019b) |
| DIARETDB0 (Kauppi et al., 2006) | 2006 | Retinal fundus | 130 | 0 | - | (Wu et al., 2017) |
| DIARETDB1 (Kälviäinen and Uusitalo, 2007) | 2007 | Retinal fundus | 89 | 0 | - | (Wu et al., 2017) |
| Messidor (Decencière et al., 2014; Abràmoff et al., 2013) | 2013 | Retinal fundus | 1,748 | 0 | 874 | (Wu et al., 2017) |
| DDSM (Heath et al., 2001) | 2001 | Mammography X-ray | 10,480 | 0 | - | (Kisilev et al., 2016) |
| Private classification datasets | ||||||
| MRI Spine (Han et al., 2018) | 2018 | Spine MRI scans | 253 | 0 | 253 | (Han et al., 2018) |
| Dataset | Text | Tags | Tags annotation method | Localization |
| Public report datasets | ||||
| IU X-ray (Demner-Fushman et al., 2015) | Indication | (1) MeSH and RadLex concepts (2) MeSH concepts | (1) Manual (2) MTI and MetaMap | - |
| MIMIC-CXR (Johnson et al., 2019a, b) | Comparis, Indicat | 14 CheXpert labels | CheXpert labeler and NegBio | - |
| PadChest (Bustos et al., 2019) | - | 297 labels (findings, diagnoses and anatomic) | 27% manual, rest by RNN | - |
| ImageCLEF Caption 2017 (Eickhoff et al., 2017) | - | UMLS tags | Quick-UMLS | - |
| ImageCLEF Caption 2018 (García Seco de Herrera et al., 2018) | - | UMLS tags | Quick-UMLS | - |
| ROCO (Pelka et al., 2018) | - | UMLS tags | Quick-UMLS | - |
| PEIR Gross (Jing et al., 2018) | - | Top words | Top TF-IDF scores | - |
| INBreast (Moreira et al., 2012) | - | Abnormalities | Manual | Abnormality contours |
| STARE (Hoover, 1975) | - | Levels for 39 conditions and presence of 13 diagnostics | Manual | - |
| RDIF (Maksoud et al., 2019) | Indication | - | - | - |
| Private report datasets | ||||
| CX-CHR (Li et al., 2018, 2019b; Jing et al., 2019) | - | - | - | - |
| TJU (Gu et al., 2019) | - | Top abnormality words | 40 most frequent words | - |
| Hip fracture (Gale et al., 2017, 2019) | - | (1) Fracture presence, (2) fracture location and character | (1) CNN (Gale et al., 2017), (2) manual (Gale et al., 2019) | - |
| Ultrasound (Zeng et al., 2018, 2020) | - | Organ and disease | Manual | Organ bounding boxes |
| Fetal Ultrasound (Alsharid et al., 2019) | - | Body part | Manual | - |
| CINDRAL (Ma et al., 2018) | - | Severity level for 4 attributes and diagnosis label | Manual | - |
| BCIDR (Zhang et al., 2017a) | - | Disease status (4 possible) | Manual | - |
| Continuous wave (Moradi et al., 2016) | - | Valve types | Manual | - |
| Public classification datasets | ||||
| CheXpert (Irvin et al., 2019) | - | 14 CheXpert labels | CheXpert labeler | - |
| ChestX-ray14 (Wang et al., 2017) | - | 14 disease labels | DNorm and MetaMap | Disease bounding boxes for 880 images |
| LiTS (Christ et al., 2017) | - | - | - | Liver and tumor segmentation masks |
| Gastrointestinal challenge (Hicks et al., 2019) | - | 16 labels (e.g. anatomic, pathological or surgery findings) | Manual | - |
| DIARETDB0 (Kauppi et al., 2006) | - | DR severity level | Manual | Abnormality contours |
| DIARETDB1 (Kälviäinen and Uusitalo, 2007) | - | DR severity level | Manual | Abnormality contours |
| Messidor (Decencière et al., 2014; Abràmoff et al., 2013) | - | DR severity level | Manual | - |
| DDSM (Heath et al., 2001) | - | Density level | Manual | Abnormalities at pixel level |
| Private classification datasets | ||||
| MRI Spine (Han et al., 2018) | - | - | - | Diseases and body parts at pixel level |
9.2. Auxiliary Tasks
Table 10 presents the categories of auxiliary tasks identified in the literature and which papers implemented them.
| Auxiliary Task | Used by papers |
|---|---|
| Multi-label classification | (Jing et al., 2018; Yuan et al., 2019; Li et al., 2019b; Wang et al., 2018; Li et al., 2019a; Xiong et al., 2019; Gu et al., 2019; Yin et al., 2019; Tian et al., 2019; Harzig et al., 2019a; Biswal et al., 2020; Harzig et al., 2019b; Sun et al., 2019; Zhang et al., 2020b; Jing et al., 2019; Shin et al., 2016) |
| Single-label classification | (Zhang et al., 2017a; Gale et al., 2019; Ma et al., 2018; Alsharid et al., 2019; Gasimova, 2019; Zeng et al., 2018; Hasan et al., 2018b; Kisilev et al., 2016; Moradi et al., 2016; Spinks and Moens, 2019; Zeng et al., 2020) |
| Sentence classification (normal/abnormal/stop) | (Harzig et al., 2019a; Xie et al., 2019; Jing et al., 2019) |
| Segmentation | (Tian et al., 2018; Han et al., 2018) |
| Object detection | (Kisilev et al., 2016; Zeng et al., 2020) |
| Attention weights regularization | (Maksoud et al., 2019; Yin et al., 2019) |
| Embedding-to-embedding matching | (Yin et al., 2019; Moradi et al., 2016) |
| Doc2vec | (Moradi et al., 2016) |
| Text autoencoder | (Tian et al., 2019; Spinks and Moens, 2019) |
| GAN cycle-consistency | (Spinks and Moens, 2019) |
9.3. Optimization Strategies
Table 11 presents the categories of optimization strategies identified in the literature and which papers implemented them.
| Category | Optimization Strategy | Used by papers |
|---|---|---|
| Visual Component | Pretrain in ImageNet | (Huang et al., 2019; Li et al., 2018; Wang et al., 2018; Xue et al., 2018; Li et al., 2019a; Singh et al., 2019; Maksoud et al., 2019; Yin et al., 2019; Ma et al., 2018; Alsharid et al., 2019; Gasimova, 2019; Zeng et al., 2018; Xue and Huang, 2019; Jing et al., 2019; Hasan et al., 2018b; Moradi et al., 2016; Zeng et al., 2020) |
| Train in Auxiliary Medical Image Tasks | (Yuan et al., 2019; Li et al., 2019b; Zhang et al., 2017a; Li et al., 2019a; Xiong et al., 2019; Gale et al., 2019; Tian et al., 2018; Gu et al., 2019; Yin et al., 2019; Tian et al., 2019; Ma et al., 2018; Alsharid et al., 2019; Harzig et al., 2019a; Biswal et al., 2020; Zeng et al., 2018; Harzig et al., 2019b; Sun et al., 2019; Zhang et al., 2020b; Han et al., 2018; Jing et al., 2019; Shin et al., 2016; Hasan et al., 2018b; Kisilev et al., 2016; Zeng et al., 2020) | |
| Train in Report Generation (end-to-end) | (Jing et al., 2018; Liu et al., 2019; Wang et al., 2018; Zhang et al., 2017a; Tian et al., 2018; Yin et al., 2019; Gasimova, 2019; Harzig et al., 2019a; Xue and Huang, 2019; Li and Hong, 2019; Hasan et al., 2018b; Tian et al., 2019) | |
| Report Generation | Teacher-forcing | (Jing et al., 2018; Huang et al., 2019; Yuan et al., 2019; Li et al., 2019b; Wang et al., 2018; Xue et al., 2018; Zhang et al., 2017a; Li et al., 2019a; Singh et al., 2019; Maksoud et al., 2019; Gale et al., 2019; Tian et al., 2018; Gu et al., 2019; Yin et al., 2019; Tian et al., 2019; Alsharid et al., 2019; Gasimova, 2019; Gajbhiye et al., 2020; Harzig et al., 2019a; Biswal et al., 2020; Xie et al., 2019; Zeng et al., 2018; Xue and Huang, 2019; Sun et al., 2019; Zhang et al., 2020b; Li and Hong, 2019; Jing et al., 2019; Shin et al., 2016; Hasan et al., 2018b; Wu et al., 2017; Spinks and Moens, 2019; Zeng et al., 2020) |
| Reinforcement Learning | (Liu et al., 2019; Li et al., 2018; Xiong et al., 2019; Li and Hong, 2019; Jing et al., 2019) | |
| Other Losses or Training Strategies | Multitask learning | (Jing et al., 2018; Li et al., 2019b; Wang et al., 2018; Zhang et al., 2017a; Maksoud et al., 2019; Tian et al., 2018; Yin et al., 2019; Tian et al., 2019; Ma et al., 2018; Harzig et al., 2019a; Jing et al., 2019; Kisilev et al., 2016; Spinks and Moens, 2019; Zeng et al., 2020) |
| Attention weights regularization | (Maksoud et al., 2019; Yin et al., 2019) | |
| Contrastive loss | (Yin et al., 2019) | |
| Regression loss | (Kisilev et al., 2016; Moradi et al., 2016; Zeng et al., 2020) | |
| Autoencoder | (Tian et al., 2019; Spinks and Moens, 2019) | |
| GAN | (Han et al., 2018; Li and Hong, 2019; Spinks and Moens, 2019) |