FishNet: A Unified Embedding for Salmon Recognition
Abstract
Identifying individual salmon can be very beneficial for the aquaculture industry as it enables monitoring and analyzing fish behavior and welfare. For aquaculture researchers identifying individual salmon is imperative to their research. The current methods of individual salmon tagging and tracking rely on physical interaction with the fish. This process is inefficient and can cause physical harm and stress for the salmon. In this paper we propose FishNet, based on a deep learning technique that has been successfully used for identifying humans, to identify salmon.We create a dataset of labeled fish images and then test the performance of the FishNet architecture. Our experiments show that this architecture learns a useful representation based on images of salmon heads. Further, we show that good performance can be achieved with relatively small neural network models: FishNet achieves a false positive rate of 1%and a true positive rate of 96%.
1 Introduction
The Atlantic salmon farming industry in Norway has experienced a massive growth in the past four decades. The industry has gone from producing 4.300 tonnes of salmon in 1980, to almost 1.240.000 tonnes in 2017 [16]. In 2017, the total economical results from salmon production was calculated to be over 61 billion Norwegian kroner (NOK) [16]. This makes salmon farming one of the most profitable industries in Norway, and it is considered as one of the most important industries in a post oil Norway [14]. However, the industry is still largely driven by manual labor. For example, the total number of lice in a breeding cage is indicative of fish welfare and an important metric for deciding whether delousing measures should be initiated. Today’s method for lice counting relies on manually inspecting individual fish and then estimating the total number of lice in the cage from these numbers. Other measurements such as disease and weight measurements also use similar methods, based on a few individual fish measurements. These methods are highly reliant on the fish inspected to be representative for the total population within the cage. However, salmon is a schooling fish and organize themselves according to hierarchical structures [10, 5]. This means that different types of individuals will be present at different layers of the school. As the sampling methods used in the industry relies on small samples the methods are prone to selecting the same type of individuals for inspection every time. This could result in skewed estimations and lead to wrong operations being performed. As these operations are often both costly and harmful for the fish, large economic gains can be made from more precise estimates.
To improve measurement quality, a method of ensuring that different individuals are measured every time is needed. Previous attempts at solving this problem have included a variety of techniques. However, the techniques have almost exclusively relied on physical engagement with the salmon. The techniques include surgical implantation of tags and external mutilation, such as fin-clipping, freeze brands, tattoos, visible implant tags, and external tag identifiers attached by metal wire, plastic, or string [12]. This is a problem both from an animal welfare and product quality perspective. Bacterial growth and unpleasant sensory properties has shown to increase more quickly in salmon experiencing stress in their lifetime prior to being slaughtered. This results in reduced shelf life of the finished product [2]. A computer vision method for uniquely identifying individuals would solve this problem by minimizing the impacts from invasive techniques.
In this paper, we introduce an approach for accurately identifying individual salmon from images, using a deep neural network called FishNet. By accurately identifying individual salmon, we can ensure that no salmon is measured multiple times, thereby guaranteeing a more accurate estimation of the total population. Our approach is based on FaceNet [15] and DeepFace [18] which have been proven to work well in the field of face verification in humans. These networks are able to verify the identity of people in images with human levels of accuracy. They have also been shown to be robust to noise in terms of changing lighting conditions. By training a similar architecture on images of fish rather than humans, we enable accurate identity predictions without physical interaction.
Being able to track salmon at an individual level could enable tracking a single individual throughout its lifespan, from salmon spawn to finished product, linking salmon fillets to the life-story of the individual. Other opportunities include monitoring individual weight development, treating salmon only when the need arise and delousing only the individuals that suffer from lice, thereby preventing unnecessary harm to healthy salmon. Individual salmon tracking could also enable new research areas that require monitoring of individuals over time such as feeding behavior, detection of diseases and social behavior. FishNet can facilitate such research through offering a non-invasive and efficient approach to identifying salmon.
The rest of this paper is structured in the following way. In Section 2 we outline the current state of the art within the problem area of individual recognition of salmon. And as a results of the method chosen to solve the problem we also outline the current state of the art of using machine learning to identify individuals from pictures. Following this, we present our approach to the problem of individually recognizing salmon in Section 3. The dataset used for evaluation and the evaluation of our proposed solution are presented in 4. We present a discussion of our results in Section 5. Finally Section 6 presents our conclusions and thoughts on future directions of research for this work.
2 Related Work
Since the problem we address is inter-disciplinary, related work is two-fold: one area of research covers the detection and identification of fish and salmon in particular while the other one focuses on the classification of images. In this section we’ll discuss the relevant work representing the state-of-the-art.
There has only been very limited work conducted to identify unique fish/salmon without engaging directly with the fish. Earlier attempts of uniquely identifying salmons have relied on insertion of RF-ID chips or other physical marking systems [7]. This is approach is only feasible in research settings and should be minimized as it potentially injures the fish. In real-world deployments with hundreds of cages and millions of fish a more scalable approach is desirable. Throughout the recent years the field of automatically identifying salmon has grown as the fish-farming industry collaborate more and more with data-driven approaches. Especially in Norway, projects such as the Exposed Aquaculture Operations Center for research based innovation111https://exposedaquaculture.no/en/ or the Seafood Innovation Cluster222http://www.seafoodinnovation.no/ emphasize on applying Internet of Things, Big Data and Artificial Intelligence methods.

SINTEF SalmID [7] is a study that investigated the possibility of recognizing individual salmon based on the assumption that each individual has an unique pattern. They found that there was done little work on this area regarding Atlantic salmon, but point at other work using the melanophore pattern of different animals to uniquely identify them. The constellation of such melanin patterns on the head of the fish can be utilized for identification. In the SalmID approach the recognition part is based on manually selected features of the salmon rather than learned representations.
Additional work utilizing melanophore patterns has been presented by Hammerset [8] who apply deep neural networks to discover the location of salmon heads and eyes. In this work a simple blob detection algorithm is used to discover the melanophore spots. The locations of the spots and the eye are then translated into a polar representation which is saved in a database with the identity of the salmon. On the test set with images from 333 individuals the algorithm recognized 40.4% (5922 of 14652 images) of the images as belonging to an individual salmon, of these 40.4% the algorithm correctly identified the individual with an accuracy of 99.7% (5902 of 5922). Thus the total test accuracy was 40.2% (5902 of the total 14652 images classified as the correct individual)
Identifying individuals among humans has been an active research field for a long time. Earlier work has been based on eigen value analysis of data matrices such as EigenFaces [19] and its successors in FisherFaces [3] and Laplacianfaces [9].
More recent woork on individual recognition is based on deep learning approaches such as the model presented in the DeepFace paper [18] in which they are making the images of faces more uniform (frontalization). These frontalizations are fed into a convolutional layer followed by a max pooling layer and another convolutional layer. According to the authors, these three layers mainly extract low level features and make the network robust to local translations. The last convolutional layer is followed by three locally connected layers. This is done because the different regions of an aligned image have different characteristics, so the spatial invariance assumption of convolution does not hold. An example of this is that the eyes of a person will always be above the nose. The final two layers of the network they use are fully connected. These layers are able to identify relations between features in different locations in the feature maps. The first fully connected layer is used as the face representation vector, and the output of the second one is fed into a softmax which produces a class distribution for an input image. To verify whether two images are of the same person, the authors propose three approaches: (1) an unsupervised method in which the similarity of two images is simply defined as the inner product of the two representation vectors, (2) a weighted distance in which the weight parameters are learned using a linear support vector machine and (3) a siamese network, in which the network (except the top layer used for softmax classification) is duplicated. One image is fed into each part of the network and the absolute difference between the feature vectors is computed. A fully connected layer is added and the network is trained to predict a single logistic unit (whether the images are of the same person). Training is only enabled for the new layers, and they are trained using standard cross entropy loss. All three methods yielded good results compared to the state-of-the-art at the time. The siamese network approach required a lot more training data to avoid overfitting compared to the other approaches.
A related approach has been presented as FaceNet [15] which describes a system that learns and optimizes a vector representation directly, rather than extracting the representation from a bottleneck layer (like DeepFace). FaceNet learns a 128-dimensional feature vector (embedding) that represents a face. Unlike the DeepFace approach there is no 2D or 3D alignment done on the images. FaceNet is a variant of a Siamese Neural Network (SNN) originally proposed by Bromley [4]. In contrast with the original SNNs FaceNet uses triplet loss to train the network. The network is presented with three images (the anchor image, the positive image (same person, but different image and the negative image (image of any other person). According to the authors, it is important to select triplets that are hard for the model to correctly discriminate, to ensure that the network converges as quickly as possible during training. The triplets are chosen from within each mini-batch, and all anchor-positive pairs are used in combination with negative examples. The authors describe several different deep neural network architectures, where the major differences between them are the number of trainable parameters. The number of parameters in the networks range from about 4 million to 140 million. When evaluating the networks the -distance between two images is compared. If the distance is above a certain threshold they are classified as different. According to the authors they are able to reduce the error reported by the DeepFace paper by a factor of seven. The smaller inception networks perform nearly as good as the very deep networks.
3 The FishNet Approach
To recognize individual salmons we adapt the FaceNet [15] architecture and training method. FaceNet is a type of Siamese neural network[4, 11] which has two datapoints as input, and the output is the distance between them. This can also be extended to work on e.g. triplets of data points, outputting more than one distance. FaceNet is trained on a dataset consisting of triplets consisting of a anchor data point, a positive data point and a negative data point. The anchor data point with a given label, the positive data point is a different data point with the same label, in contrast the negative data point has a different label. Figure 2 illustrates this with three example images of salmon, two of which are from the same individual salmon, while the third image is of another individual salmon.
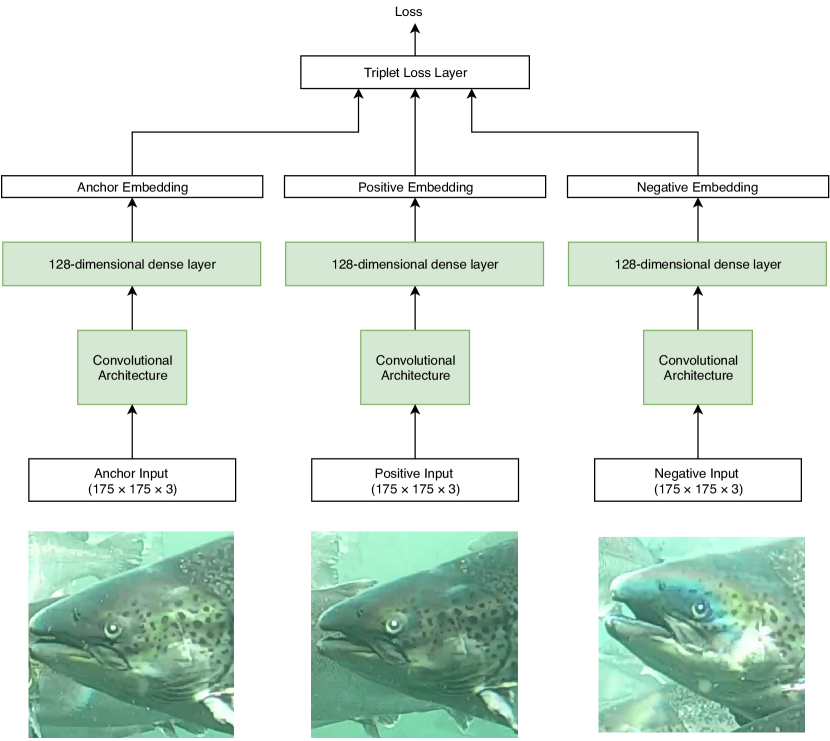
The goal of training FaceNet is to minimize the distance between the anchor and positive data point, while maximizing the distance to the negative data point. This training process is illustrated in Figure 3.

To compute the loss during the training, a custom triplet loss layer was used. Equation 1 defines how the loss is computed for a minibatch of size .
| (1) |
Here is the embedding of image , is the anchor data point, is the positive data point, is the negative datapoint and is a parameter that encourages better learning.
This is identical to how the triplet loss is defined in the FaceNet [15]. The loss computes the distance between the anchor and the positive, and the anchor and the negative. The goal is to have the positive distance be smaller than the negative distance. The difference between the positive and negative distance are summed. To encourage larger distances the margin is added to the loss function. To avoid negative loss, the loss is set to the maximum of the loss of the triplet and 0.
Careful triplet selection is important [15] for the training process of the network. The training goal of the algorithm is to ensure that the embeddings of two images (anchor and positive) of the same salmon are closer to each other than any images of other salmon (negatives) by a margin . In our experiments, the value for was set as , the same as used in the FaceNet paper.
To ensure effective training, it is important to select triplets that violate
this constraint. To do this, the method computes the embeddings for images
during training, and then select samples only among the triplet that violate
this training samples. For efficiency purposes, this is done within each batch.
First, a random set of salmon images are sampled from the training dataset. Then
the images are fed through the network to generate embeddings. Finally, the
embeddings are used to select triplets where the difference between the negative
and positive embeddings are within . Algorithm 1
describes this process.
Using Algorithm 1 to select the triplet used for training, we ensure that training is performed on triplets the network can learn from. Using triplets that already satisfy the constraint of would not contribute to further training, and only slow down the process. Calculating the hardest triplets for the entire dataset every epoch would be computationally very slow. Additionally, if we were to select the hardest triplets every time it could cause poor training. This is because selection of hardest triplets would be dominated by for example mislabeled or low quality images.
3.1 Neural Network Architectures
During our experiments, we trained different neural network architectures to produce embeddings. All the networks shared a general architecture of a convolutional neural network where the top layer (classification layer) was replaced by a 128-dimensional dense layer to represent the embedding of the input image. Figure 2 shows an illustration of this architecture, which is used to compute the embedding for one image. Table 1 we show the different types of architectures we evaluated as part of this work. This was done to investigate the effect of using different convolutional architectures and model sizes to produce embeddings. The corresponding results to the architectures listed in this table is listed in Table 2.
| Network Architecture | # Parameters | Pretrained with |
|---|---|---|
| FishNet1 (Inception ResNet v2) | 55M | ImageNet |
| FishNet2 (MobileNet v2) | 2.4M | ImageNet |
| FishNet3 (VGG-16) | 15M | ImageNet |
To train the network using triplet loss, the network needs to use more than one image at once. To achieve this, the convolutional and embedding parts need to be replicated once for each image. Note that the weights are shared between the instances. The output from the embedding layers is fed into a custom layer that computes the triplet loss, which in turn is used to train the model. Figure 2 illustrates the model used for training. Table 1 shows the neural network architectures used in the experiments.
All models were initialized with the convolutional weights pretrained on the ImageNet dataset [6]. The assumption being that features learned for image classification may be a useful starting point for learning how to distinguish salmon from each other, thereby reducing the amount of training data needed to train the models.
4 Dataset and Evaluation
As far as we know, there is currently no data set of labeled fish to use for training and evaluating methods for identity recognition. Thus, to evaluate the FishNet method we needed to create a dataset of labeled pictures of salmon heads. To do this we aquired a video clip of salmon swimming from SeaLab333https://www.sealab.no/.
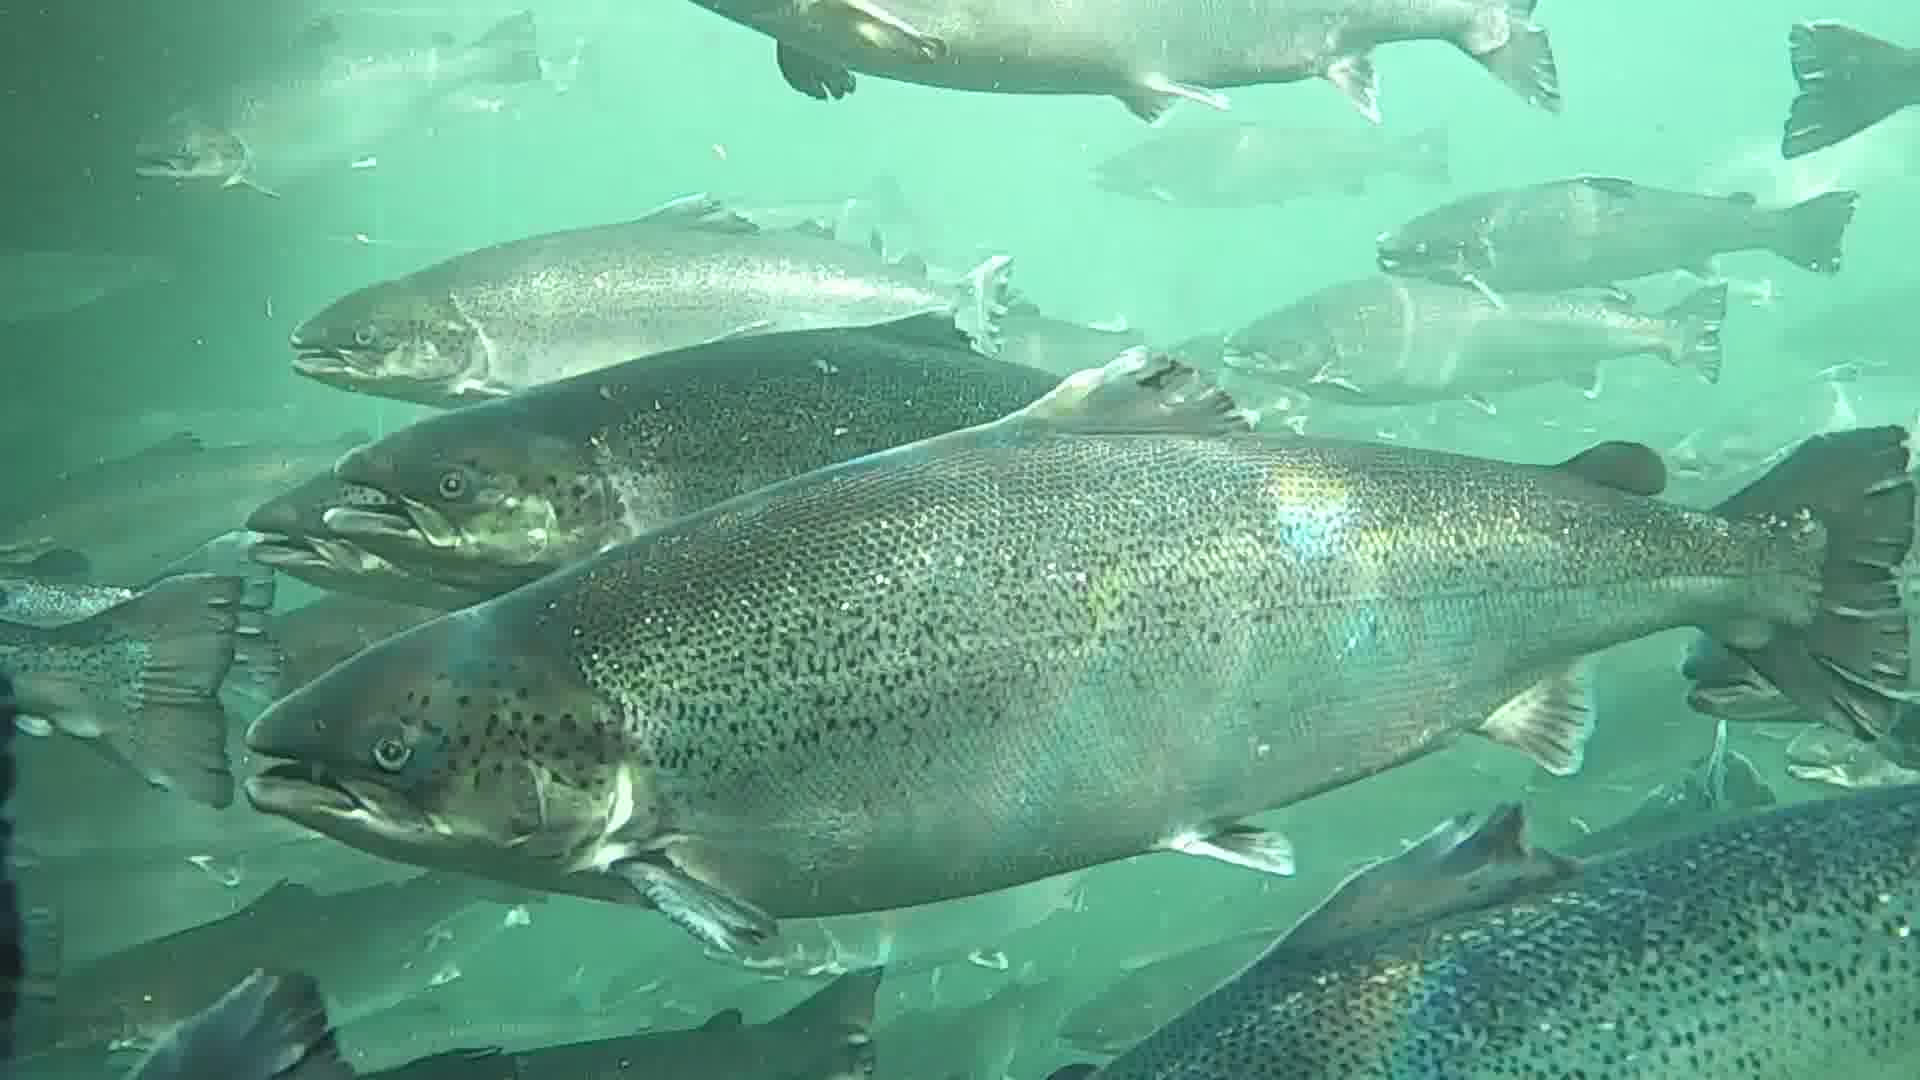
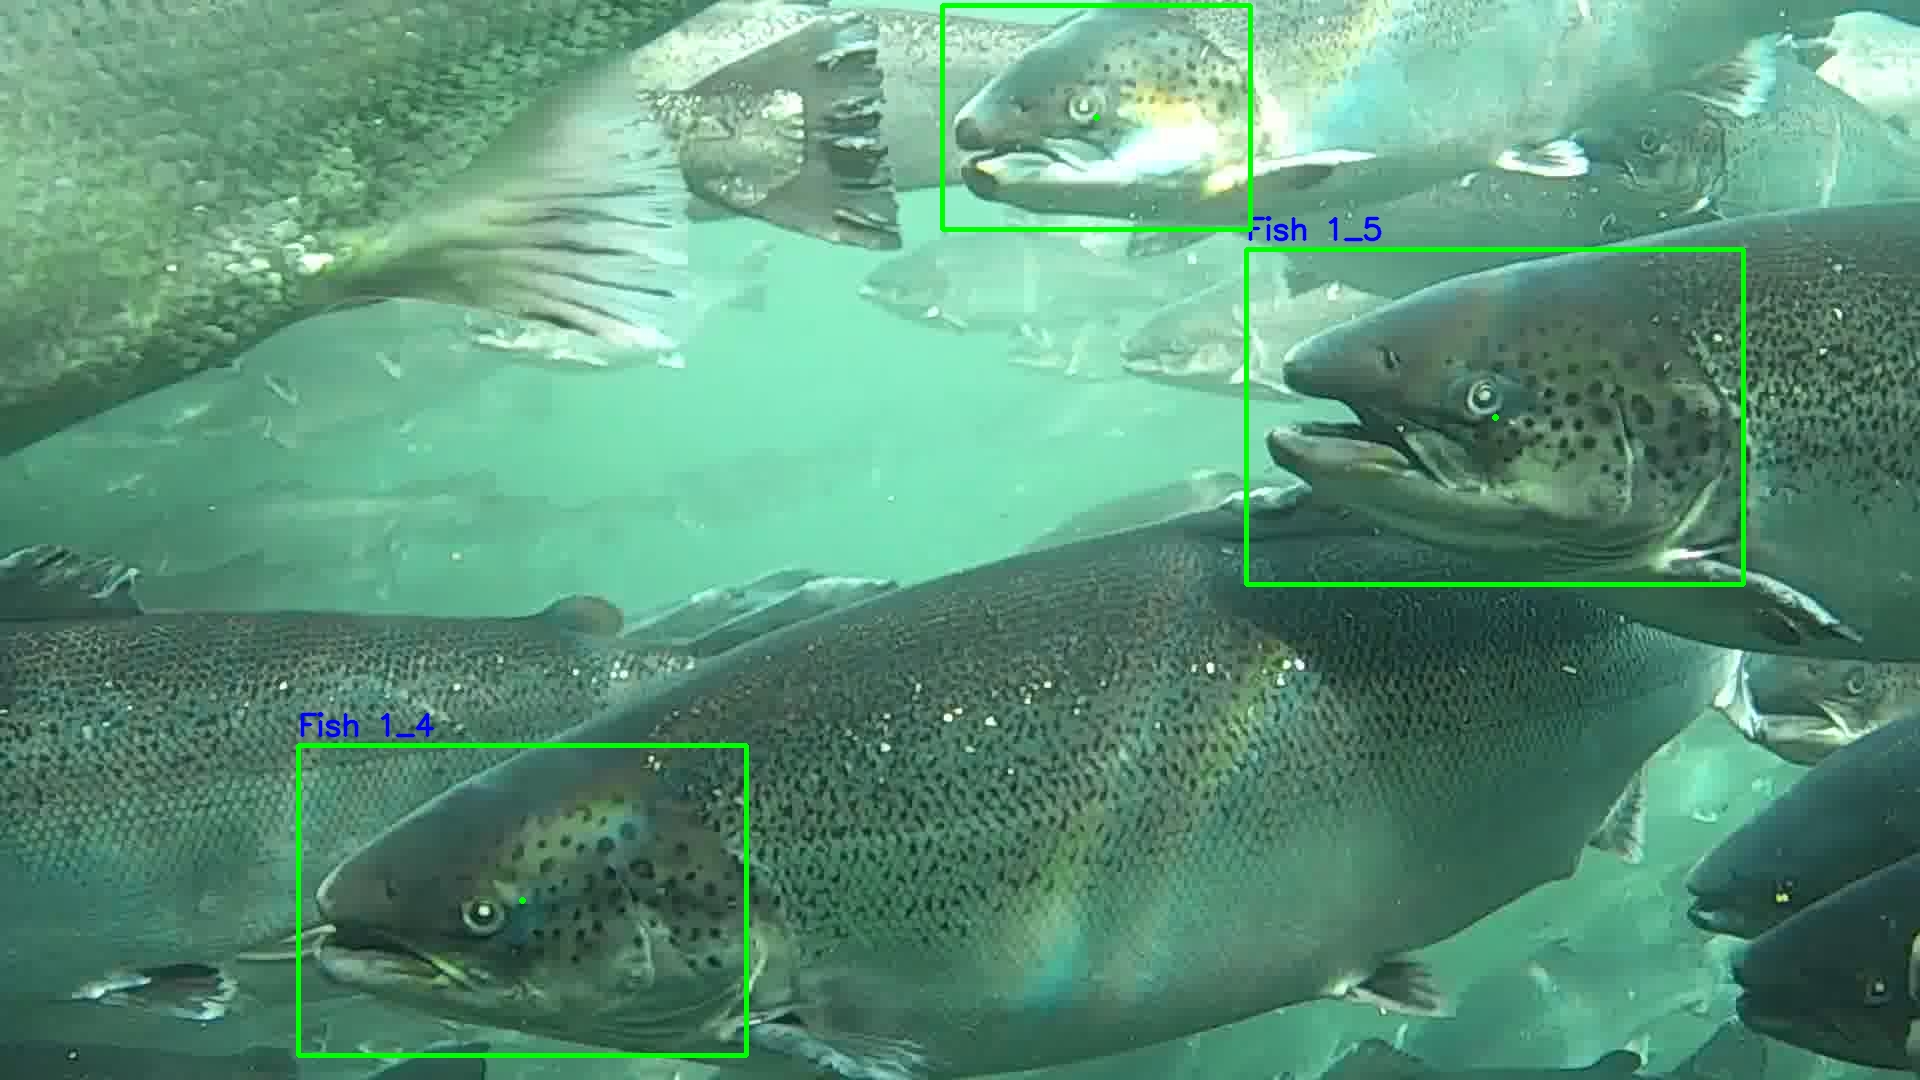
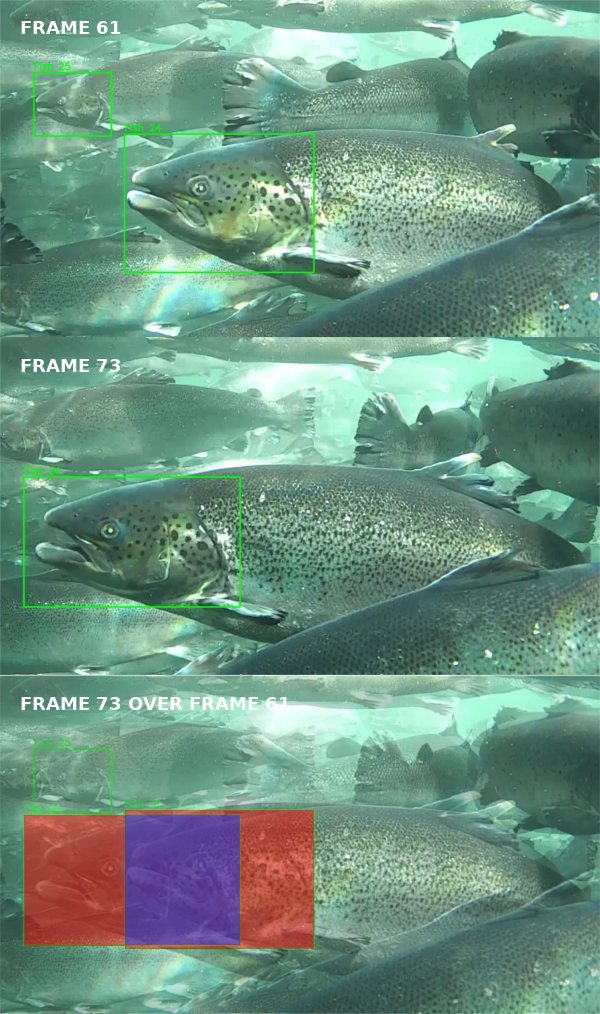
The original data was a video stream of salmon swimming across the view of the camera. The video was filmed at 30 FPS (frames per second) meaning we had 30 images per second of video. Figure 4(a) shows a frame captured from this video. Salmon heads in the images were marked manually with a bounding-box tool. After manually labeling approximately 500 bounding-boxes as salmon heads the bounding-boxes were used to train a YOLOv3 ([13]) network to recognize salmon heads. This YOLOv3 model was then used to create bounding-boxes on every salmon head in all video frames, as seen in Figure 4(b). Figure 2 and Figure 14 shows examples of the resulting cropped bounding-boxes of two salmon heads. These bounding boxes is then extracted as a image. These images are then clustered to achieve clusters of images for each individual salmon. Equation 2 describes the distance function used in the clustering algorithm. If two bounding-boxes are in the same frame, the distance is set to an arbitrarily high value. If the bounding-boxes are not in the same frame, the intersection over union is measured to check how closely the bounding-boxes overlap. Then a temporal distance is added by computing a weighted distance of the frame numbers. This is done to ensure that overlapping bounding-boxes in frames next to each other receive a low distance value. These distance metrics are combined into one single distance (Equation 2) metric which is used by DBSCAN[20] to cluster the images. This process produces clusters of images of the same individual salmon. This approach works fairly well except in cases where a salmon disappears behind a different salmon and then reappears again. In those cases it is frequently misidentified as a new salmon. This problem was solved by manually reviewing the labels, and replacing the labels for misidentified salmon.
| (2) |
Here and
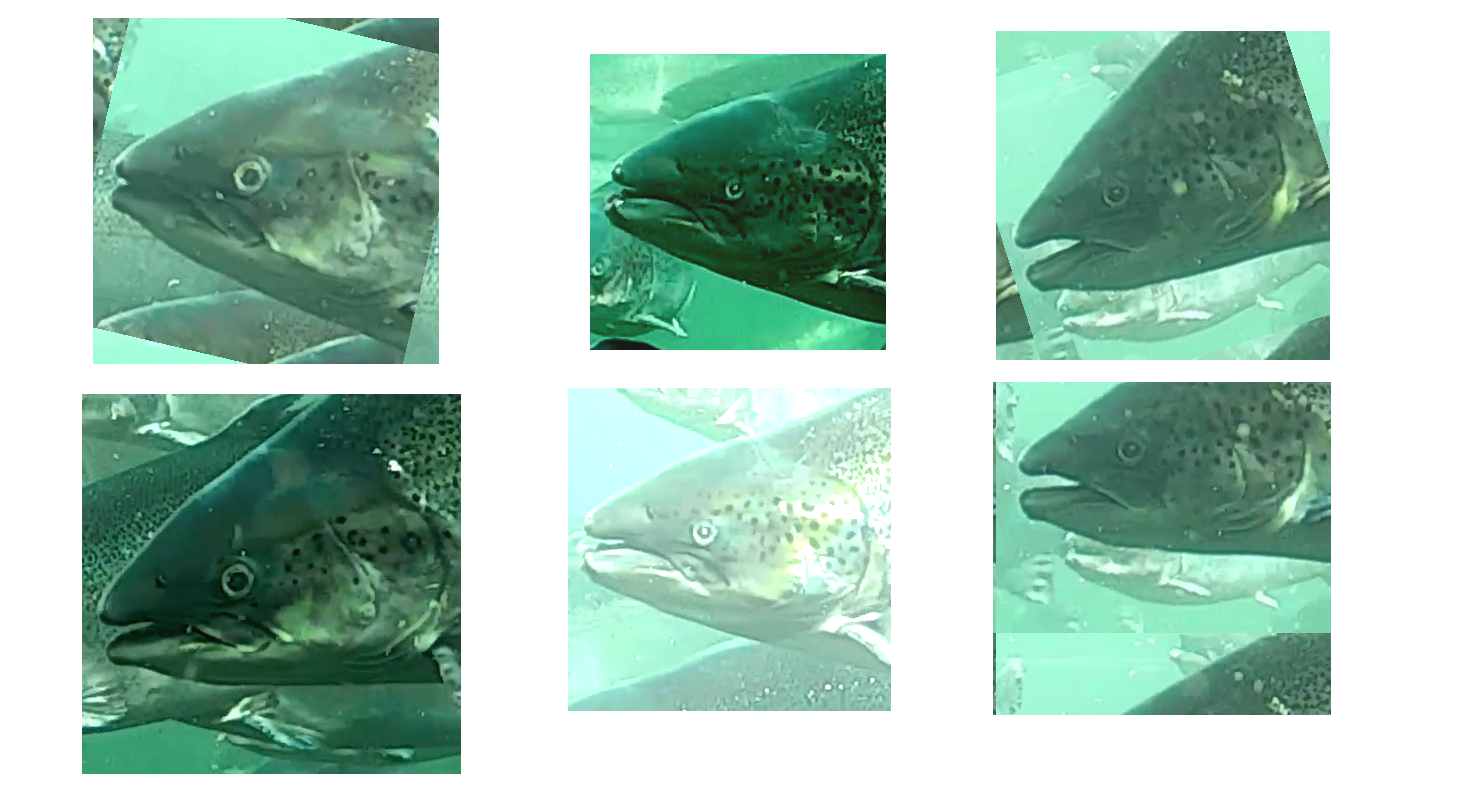
After the salmon heads are extracted they were clustered and finally labeled. This resulted in a dataset of 15000 images of 715 individual salmon. The images were then augmented by tilting the image, moving the image vertically and shifting the brightness of the image. Examples of these augmentations can be seen in Figure 5. Five augmented images were created for each original image, resulting in a data set containing a total of 225 000 images divided over 715 individuals. The data set was then divided into test and training sets, with 90% of the images being used for training and the remaining 10% being used for testing.
4.1 Evaluation
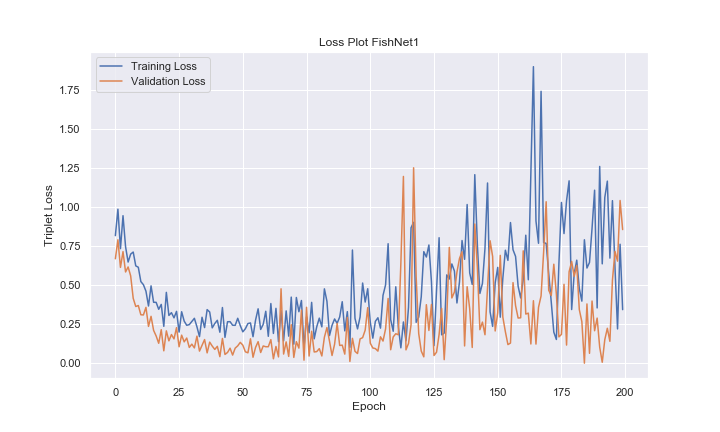
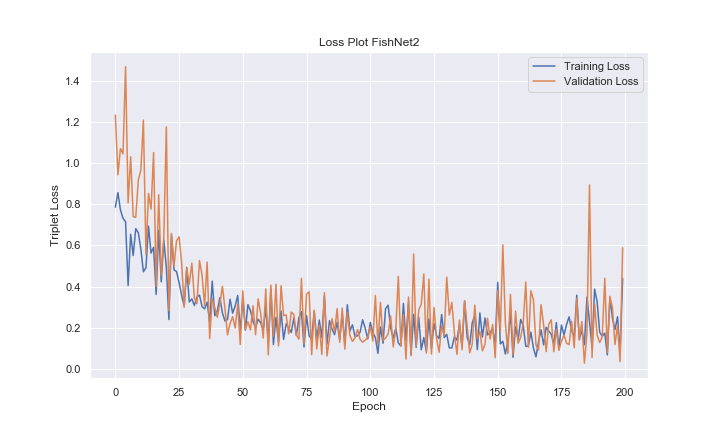
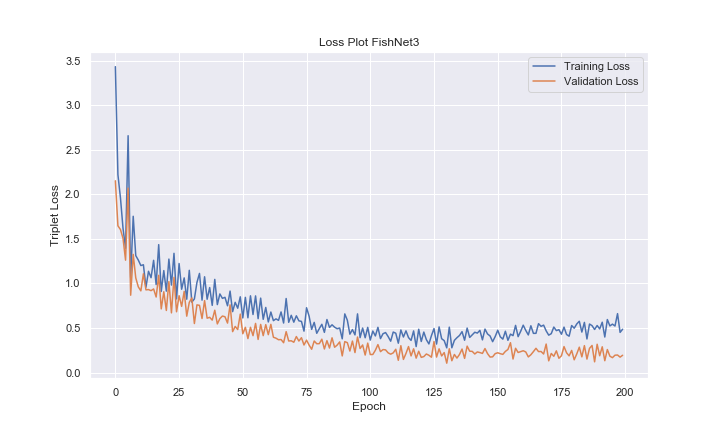
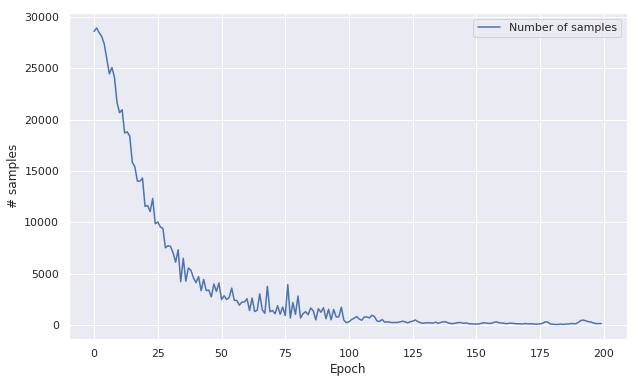
The experimental setup consisted of a single computer containing an AMD Ryzen Threadripper 2920x 12-core CPU, two GeForce RTX 2080Ti GPUs and 128 GB of RAM. The models were implemented using Tensorflow [1]. Figures 7, 8, and 9 show the loss curves during the training of the three models presented in section 3.1. One notable observation in the loss curves for FishNet1 is that both the training and validation loss start to fluctuate and increase greatly towards the middle and end of training. This occurs due to the nature of the triplet selection algorithm used during the training phase. The algorithms only uses triplets that fail the triplet constraint test described in section 3. This means that if the model learns to separate salmon well, there are fewer triplets available for training as the training progresses. By examining the training logs we can see that this in fact happens. Figure 10 shows show many of the sampled triplets the network was able to use for training.
As seen in Figure 7, when the models become increasingly good at recognizing individuals the loss starts to fluctuate. This is most likely due to the fact that the training process is down to a very small set of triplets that is very hard to discriminate. When the training process seeks for a model that can discriminate these last triplets, the loss value of the rest of the dataset increases.
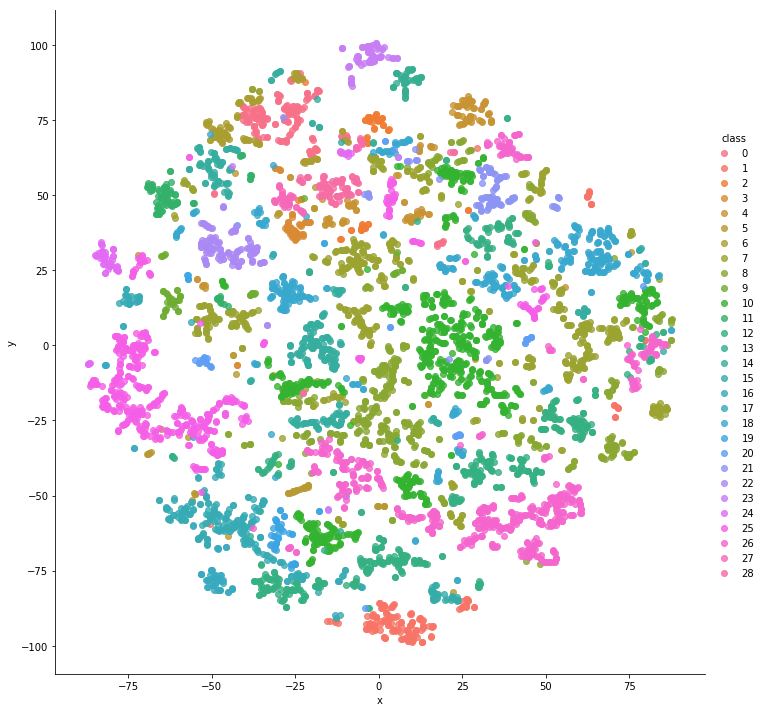
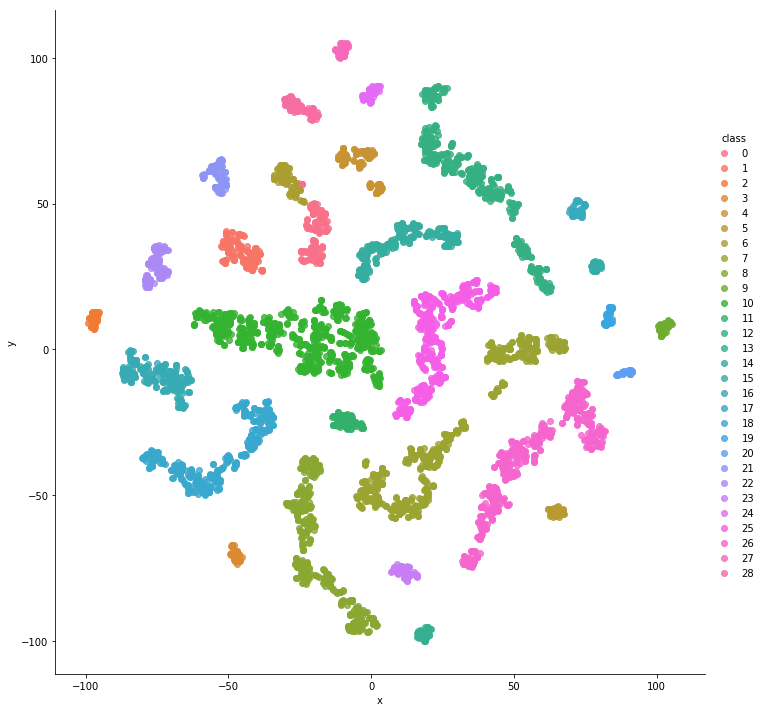
The goal of the face verification task is to easily be able to separate the embeddings generated by different identities in the euclidean space. Figure 11 and Figure 12 illustrates how the embeddings are distributed in the space before and after training. The points in the plots are of images from different salmon from the test set. The models used are FishNet1 before and after epochs of training. As we can see from the t-SNE-reduced plots the grouping of embeddings from salmon of the same identity is far better after training. This indicates that the model is able to learn some mapping from the images to embeddings.
To compute metrics such as true positive rate, false positive rate, accuracy etc., a similarity threshold needs to be set. To compare the models we can examine what the true positive rate (the sensitivity) of the system is at a set false positive rate. We have compared the models where the false positive rate is 0.01, that is, where 1% of the negative samples are misclassified as positive. As we can see in Table 2 FishNet1 and FishNet2 perform approximately equally with a true positive rate of about 96%. FishNet3 performs significantly worse with a true positive rate of 87%.
| Network Architecture | AUC | TPR @ FPR = 10e-3 |
|---|---|---|
| FishNet1 (Inception ResNet v2) | 0.9977 | 0.964 |
| FishNet2 (MobileNet v2) | 0.9974 | 0.961 |
| FishNet3 (VGG-16) | 0.9919 | 0.870 |
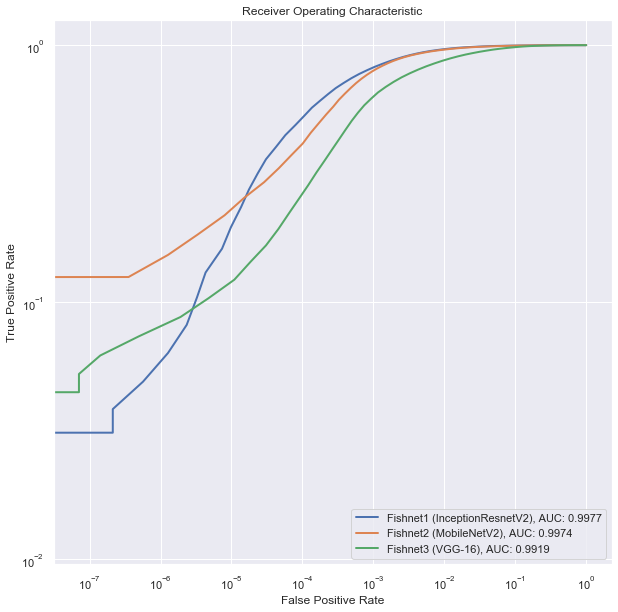
Figure 13 shows the ROC curve for the three models we tested. By comparing the area under the curve we can compare the performance of the models across all thresholds. As we can see FishNet1 and FishNet2 perform better than FishNet3, with FishNet1 being the best of the models tested in our experiments. It is interesting to note that the improved results of FishNet1 come at quite a high computational cost compared with FishNet2, a network designed to be able to run on mobile devices.
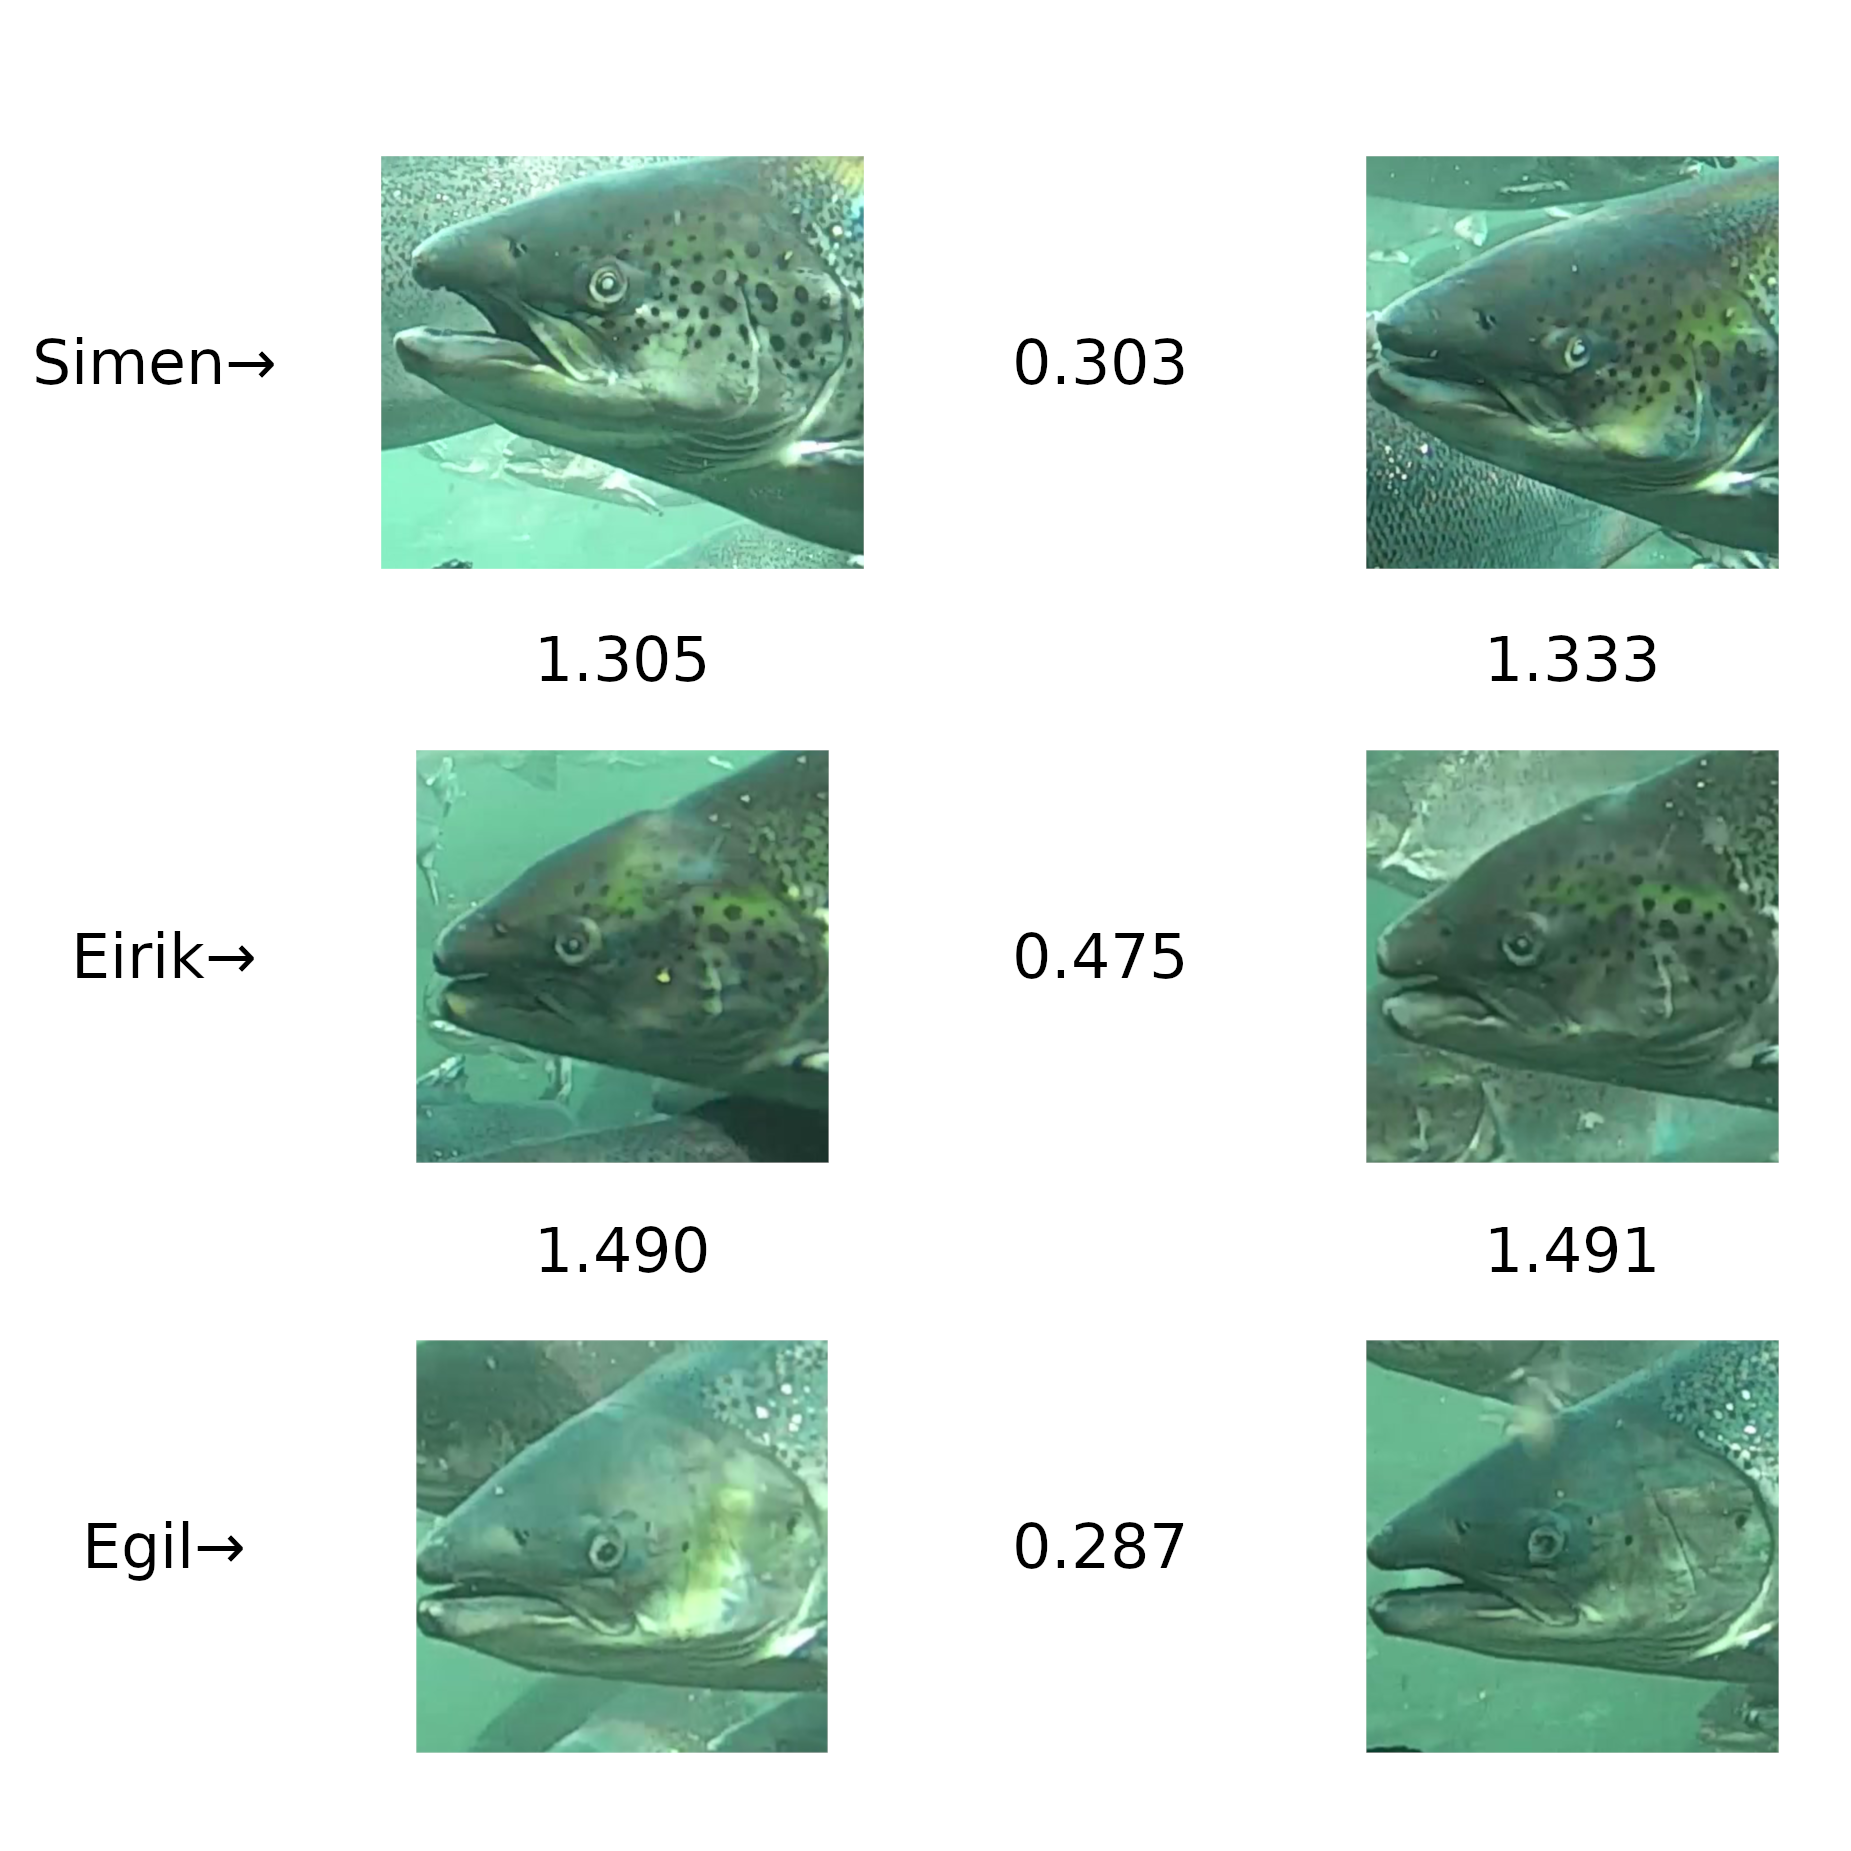
Lastly Figure 14 shows an example of a visual evaluation of 2 images of 3 different salmon individuals (“Simen”, “Eirik” and “Egil”). This shows us that the calculated distances between different individuals are at least three (on average ) times bigger than the distances between two images of the same individual in this example.
5 Discussion
The results shown in the Section 4 demonstrate that machine learning methods successfully applied for identifying humans from pictures can also be used to identify individual salmon. However it should be noted that this was done with frames extracted from a single video captured over a short period of time. Thus the different frames representing the same individuals in the data set created for this work are very similar. This is somewhat amended by the augmentation done to the frames as described in Section 4. However, the results from evaluating the method on a data set with these augmentations does not enable us to conclude that the method works under all conditions, or over longer periods of time. The video used in this work is a video with very favorable conditions, both in terms of light and water clarity. Training FishNet in more challenging conditions might reduce the performance of the architecture. Thus adversarial regularization using both artificial noise and adversarial examples could be beneficial or even necessary for the architecture to handle such conditions, as this has been shown to increase robustness of deep architectures [17]. The fish may also be damaged mechanically or contract diseases which changes the way individual fish looks over time. This could drastically affect the performance of FishNet on such individuals.
6 Conclusion
In this paper we presented FishNet, a novel approach for individual fish recognition using a convolutional deep neural network as part of a Siamese neural network architecture based on FaceNet [15]. We trained this model using images of salmon to make the model identify individual salmon. FishNet achieves a false positive rate of 1% and a true positive rate of 96%.
As future work we would like to investigate the model’s ability to recognize individuals from spawn to grown fish. We would also like to test if we can increase performance by employing other variants of Siamese neural networks such as eSNN[11]. Finally, we would like to investigate what the architecture is actually looking at when recognizing individuals.
7 Acknowledgements
This work is an extension of the MSc Thesis “FishNet: A Unified Embedding for Salmon Recognition”444http://hdl.handle.net/11250/2628800 by Espen Meidell and Edvard Schreiner Sjøblom. This research has been funded by the Research Council Norway, EXPOSED Aquaculture Research Center (grant number 237790) and the Norwegian Open AI Lab. In addition the data that formed the basis for the data set was provided by Sealab AS555https://www.sealab.no
References
- [1] Martín Abadi et al. TensorFlow: Large-scale machine learning on heterogeneous systems, 2015. Software available from tensorflow.org.
- [2] Anlaug Ådland Hansen, Marit Rødbotten, Thomas Eie, Per Lea, Knut Rudi, and Turid Mørkøre, ‘The effect of crowding stress on bacterial growth and sensory properties of chilled atlantic salmon fillets’, Journal of food science, 77(1), S84–S90, (2012).
- [3] Peter N. Belhumeur, João P Hespanha, and David J. Kriegman, ‘Eigenfaces vs. fisherfaces: Recognition using class specific linear projection’, IEEE Transactions on pattern analysis and machine intelligence, 19(7), 711–720, (1997).
- [4] Jane Bromley, Isabelle Guyon, Yann LeCun, Eduard Säckinger, and Roopak Shah, ‘Signature verification using a” siamese” time delay neural network’, in Advances in neural information processing systems, pp. 737–744, (1994).
- [5] K. Fiona Cubitt, Svante Winberg, Felicity A. Huntingford, Sunil Kadri, Vivian O. Crampton, and Øyvind Øverli, ‘Social hierarchies, growth and brain serotonin metabolism in atlantic salmon (salmo salar) kept under commercial rearing conditions’, Physiology & Behavior, 94(4), 529 – 535, (2008).
- [6] J. Deng, W. Dong, R. Socher, L.-J. Li, K. Li, and L. Fei-Fei, ‘ImageNet: A Large-Scale Hierarchical Image Database’, in CVPR09, (2009).
- [7] Aleksander Børresen Eilertsen, ‘Identifikasjon av lakseindivider — biometri fase 1 (salmid)’, Publikasjoner fra CRIStin - SINTEF Ocean, (2017).
- [8] Ivar Hammerset, Biometric recognition and individual tracking of salmon in large-scale sea cages., Master’s thesis, Norwegian University of Science and Technology, Norway, 2018.
- [9] Xiaofei He, Shuicheng Yan, Yuxiao Hu, Partha Niyogi, and Hong-Jiang Zhang, ‘Face recognition using laplacianfaces’, IEEE Transactions on Pattern Analysis & Machine Intelligence, (3), 328–340, (2005).
- [10] Malthe Hvas, Ole Folkedal, David Solstorm, Tone Vågseth, Jan Fosse, Lars Gansel, and Frode Oppedal, ‘Assessing swimming capacity and schooling behaviour in farmed atlantic salmon salmo salar with experimental push-cages’, Aquaculture, 473, (03 2017).
- [11] Bjørn Magnus Mathisen, Agnar Aamodt, Kerstin Bach, and Helge Langseth, ‘Learning similarity measures from data’, Progress in Artificial Intelligence, (Oct 2019).
- [12] Joseph E. Merz, Paul Skvorc, Susan M. Sogard, Clark Watry, Scott M. Blankenship, and Erwin E. Van Nieuwenhuyse, ‘Onset of melanophore patterns in the head region of chinook salmon: A natural marker for the reidentification of individual fish’, North American Journal of Fisheries Management, 32(4), 806–816, (2012).
- [13] Joseph Redmon and Ali Farhadi, ‘Yolov3: An incremental improvement’, arXiv preprint arXiv:1804.02767, (2018).
- [14] Roger Richardsen, Magnus Stoud Myhre, Heidi Bull-Berg, and Inger Lise T. Grindvoll, ‘Nasjonal betydning av sjømatnæringen’, Publikasjoner fra CRIStin - SINTEF Ocean, (2018).
- [15] Florian Schroff, Dmitry Kalenichenko, and James Philbin, ‘Facenet: A unified embedding for face recognition and clustering’, in Proceedings of the IEEE conference on computer vision and pattern recognition, pp. 815–823, (2015).
- [16] SSB. Akvakultur - årlig, endelige tall - ssb, retrived from https://www.ssb.no/fiskeoppdrett 23.05.2019, 2018.
- [17] S. Sun, P. Guo, L. Xie, and M. Hwang, ‘Adversarial regularization for attention based end-to-end robust speech recognition’, IEEE/ACM Transactions on Audio, Speech, and Language Processing, 27(11), 1826–1838, (Nov 2019).
- [18] Yaniv Taigman, Ming Yang, Marc’Aurelio Ranzato, and Lior Wolf, ‘Deepface: Closing the gap to human-level performance in face verification’, in Proceedings of the IEEE conference on computer vision and pattern recognition, pp. 1701–1708, (2014).
- [19] Matthew A Turk and Alex P Pentland, ‘Face recognition using eigenfaces’, in Proceedings. 1991 IEEE Computer Society Conference on Computer Vision and Pattern Recognition, pp. 586–591. IEEE, (1991).
- [20] Xiaowei Xu, M. Ester, H. . Kriegel, and J. Sander, ‘A distribution-based clustering algorithm for mining in large spatial databases’, in Proceedings 14th International Conference on Data Engineering, pp. 324–331, (Feb 1998).