Improving the Q factor of an optical atomic clock using quantum non-demolition measurement
Abstract
Quantum non-demolition (QND) measurement is a remarkable tool for the manipulation of quantum systems. It allows specific information to be extracted while still preserving fragile quantum observables of the system. Here we apply cavity-based QND measurement to an optical lattice clock—a type of atomic clock with unrivalled frequency precision—preserving the quantum coherence of the atoms after readout with 80% fidelity. We apply this technique to stabilise the phase of an ultrastable laser to a coherent atomic state via a series of repeated QND measurements. We exploit the improved phase-coherence of the ultrastable laser to interrogate a separate optical lattice clock, using a Ramsey spectroscopy time extended from 300 ms to 2 s. With this technique we maintain 95% contrast and observe a seven-fold increase in the clock’s Q factor to .
I Introduction
In quantum non-demolition (QND) measurement, an observable of a quantum system is coupled to an observable of a ‘meter’ system, so that direct measurement of yields indirect information about . While the measurement of may perturb the state of the meter, the inferred value of the observable is conserved by the QND measurement [1]. QND measurements have given us a window on a wide range of quantum systems, including circuit quantum electrodynamics[2, 3, 4], solid-state spin qubits [5, 6, 7], mechanical oscillators [8, 9], photons [10, 11, 12, 13], nitrogen-vacancy centres [14], and trapped ions [15, 16].
In this work we use QND measurement to observe cold Sr atoms in an optical lattice clock (OLC), in pursuit of metrological enhancements already demonstrated in Rb- and Cs-based magnetometers [17, 18] and microwave atomic clocks [19, 20, 21, 22, 23]. Our work builds on recent demonstrations with Yb [24] and Sr [25, 26] by applying QND measurement to a fully operational Sr OLC—an exceptionally stable and accurate type of clock [27, 28, 29, 30] which is a prime candidate to underpin a future redefinition of the SI second [31] as well as being a sensitive probe for geodesy [32, 33] and physics beyond the Standard Model [34, 35, 36, 37].
The OLC works by steering the frequency of an ultrastable laser, or ‘local oscillator’ (LO), to match the frequency of the optical 1S0 - 3P0 clock transition in atomic Sr. The LO frequency is initialised close to resonance with the atomic clock transition, then a spectroscopy pulse is carried out on Sr atoms confined in an optical lattice in the 1S0 ground state. At the end of the spectroscopy pulse, the frequency detuning between the LO and the atomic resonance is inferred by measuring the fraction of atoms excited into the 3P0 state. In earlier realisations of the OLC [27, 28, 29, 30] the excitation fraction is measured using fluorescence detection, which destroys the atomic sample. Stabilisation of the LO therefore requires new atomic samples to be prepared, interrogated, and measured in a repeated cycle. By contrast, in this work the excitation fraction is measured using QND methods, allowing the atoms to be recycled for another spectroscopy pulse immediately after measurement.
We carry out QND measurement in an OLC by surrounding the Sr atoms with a high-finesse optical cavity at , the wavelength of the strong 1S0 - 1P1 transition. The same optical cavity also supports a magic-wavelength optical lattice trap [38]. The intra-cavity photons serve as a QND meter of the number of ground state atoms, experiencing a measurable phase shift due to dispersion from the 1S0 - 1P1 transition. In this work we demonstrate that, for short probe times, the QND measurement is weak and therefore preserves with high fidelity the coherence of atoms prepared in a superposition of 1S0 and 3P0. This non-destructive detection enables operation of the OLC in new, more stable configurations, such as the ‘atom phase lock’ (APL), in which the phase of the LO is stabilised to the phase evolution of the atoms. Here we show that the APL significantly improves the coherence time of the LO laser. Deploying the phase-locked LO in a second, co-interrogated OLC enables us to extend the Ramsey dark time , thereby reducing the Fourier-limited linewidth of the atomic signal . This leads to an increased factor—i.e. an increased ratio between the clock transition frequency and the spectroscopic linewidth—enhancing a key figure of merit impacting the measurement precision of the clock.
II Quantum non-demolition measurement in an optical lattice clock
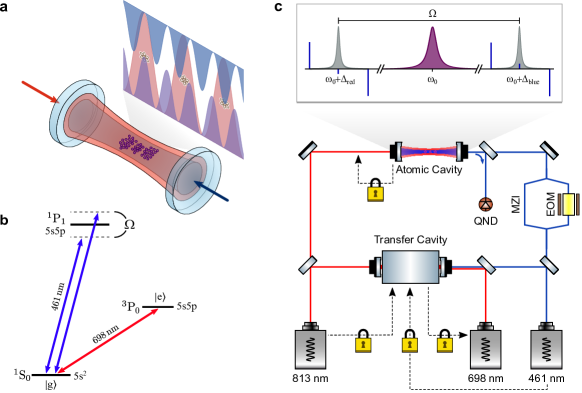
To operate the OLC, fermionic strontium (87Sr) is laser cooled and loaded into a magic-wavelength, one-dimensional optical lattice at . A Ramsey spectroscopy sequence then maps phase or frequency errors of the LO, in this case an ultra-stable laser at (see Supplemental Material), onto a population imbalance between the electronic ground state (5s2 1S0, ) and the long-lived excited state (5s5p 3P0, ). Adopting a pseudospin formulation, this population imbalance is encoded in the observable , the -component of the collective spin of the system . The collective spin components can be defined as:
| (1) | |||
| (2) | |||
| (3) |
where the operators are summed over all atoms in the sample.
For a typical OLC, is measured destructively in a two-step process [27, 28, 29, 30]. First a strong transition at from the ground state to an auxiliary state (5s5p 1P1) is used to measure via fluorescence detection. The fluorescence pulse heats the ground state atoms, causing them to escape from the lattice. Next, excited state atoms are optically pumped into the ground state and the fluorescence detection is repeated, giving a measurement of . From these two measurements, is calculated and the result is used to correct the LO frequency.
For the OLC in this work, we instead implement a QND measurement of the ground state population using the same optical cavity used to create the one-dimensional lattice trap. The cavity is coated to support optical modes surrounding the transition from the ground to the auxiliary state. In the dispersive limit, where the detuning of the cavity mode from the atomic transition is much larger than the cavity decay rate ( ), the atomic decay rate ( ), and the vacuum Rabi frequency , the auxiliary state can be adiabatically eliminated. What remains is an effective coupling between the ground state population and the photon number in the cavity mode , described by the Hamiltonian [39, 40]:
| (4) |
This gives rise to an atom-induced frequency-shift of the cavity resonance . The basic principle of the QND measurement is to drive the cavity with a weak input field at , so that the reflected output field carries information about , and therefore acts as a meter for the number of atoms. The phase of the reflected field is measured destructively as a beat signal on a photodetector, giving a signal proportional to . To obtain , which is needed to estimate the LO frequency error, the ground and excited state populations are swapped via a -pulse T at and a second QND measurement of is performed.
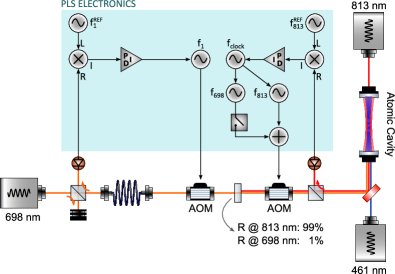
Further technical details of the QND measurement scheme [41] are outlined in Fig. 1. In order to provide first-order immunity to cavity length fluctuations [42, 43, 25], we probe the difference in the atomic-induced frequency shift between two adjacent longitudinal cavity modes centered in frequency around the atomic transition. The optical field used to probe the two cavity modes is generated by sending the laser through a Mach-Zehnder interferometer (MZI) amplitude modulator biased to zero throughput and driven at a frequency matching the free spectral range of the cavity. Additional sidebands at are applied using the MZI modulator, generating strong frequency components which are directly reflected from the cavity input mirror. The strong directly-reflected sidebands interfere with the cavity-coupled probe sidebands at , generating a Pound-Drever-Hall [44] beat signal at proportional to the phase shift induced on the probe sidebands due to the atom-induced cavity shift .
III Weak QND measurement and atom coherence preservation
To a good approximation the value of is conserved after the QND measurement, but other properties of the atomic system can be significantly altered. For example, a fundamental measurement back-action is exerted by photon shot noise in the probe beam, which generates an increase in the uncertainty of as we extract information about , in compliance with the uncertainty principle . In practice, however, two other technical effects are much larger for the QND scheme in this work: (1) the photon scatter into free space, and (2) the inhomogenous ac Stark shift . Here, we discuss how these two forms of measurement back-action cause decay in the atom coherence . We develop a model for the decoherence, and we present experimental data demonstrating weak QND readout of while preserving with 80% fidelity.
The scatter and the ac Stark shift depend on the radial position and the position along the cavity axis, according to:
| (5) | ||||
| (6) |
where indicates a spatial average along , is the waist of the cavity mode, is the average magnitude of the cavity mode detuning, is the asymmetry of the cavity mode detuning, is the transition linewidth, and is the wavenumber of the probe. In both equations we have explicitly written separate terms proportional to and , created by the red- and blue-detuned probe sidebands respectively close to the centre of the optical cavity. Ideally we would simplify the equations by choosing , but in practice a small offset is enforced by the technical constraint that the cavity length must be tuned to support a magic-wavelength lattice to carry out high- spectroscopy on the optical clock transition. Nonetheless we still operate with , such that equation 5 yields an approximately uniform photon scatter rate along while equation 6 yields an inhomogenous ac Stark shift varying as .
In order to model the effect of and on the collective atomic spin components , we simulate a sample of a few thousand individual spins at different positions and propagate each spin using optical Bloch equations. The position of each atom is selected from a Gaussian distribution with standard deviation corresponding to a radial temperature of , which has been determined experimentally through sideband spectroscopy [45]. Since the radial trap frequency is only , we treat as fixed throughout the QND measurement pulse, which has duration . The position of each atom along is randomly selected from one of 2000 sites of the lattice trap, matching the experimentally measured width of the cloud. Along , the trap frequency is comparable to or faster than , so we make the approximation that the mean -position of each atom is fixed to the center of the lattice site, but we average the scatter rate and ac Stark shift over a thermal waist corresponding to the measured axial temperature.
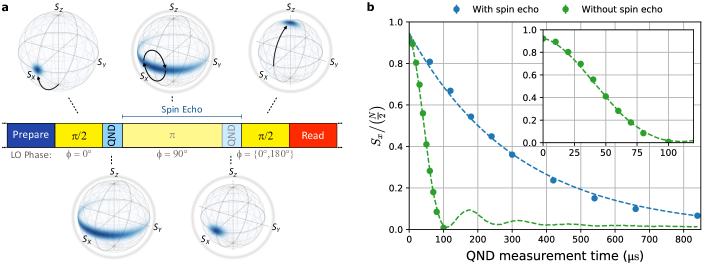
We investigate the QND probe back-action experimentally using the sequence depicted in Fig. 2a. A sample of atoms is first prepared in a coherent state with using a resonant -pulse from the clock laser. The QND probe is then applied for a variable amount of time . After this, a second -pulse is applied from the clock laser, the phase of which is stepped by or 180∘ with respect to the first pulse in order to map to . Finally, a destructive measurement is carried out of , from which the value of just before the second -pulse can be inferred. To provide insensitivity to small systematic offsets in the measurement, the estimate of is based on the difference in measured between the two phases of the final clock pulse. As observed in the data ‘without spin echo’ in Fig. 2b, the inhomogenous ac Stark shift results in near-total loss of coherence at QND probe time . However, the rapid decoherence can be largely reversed using a spin echo protocol. In the ‘with spin echo’ sequence, an additional -pulse is inserted with phase after the first QND probe, followed by a second QND probe. We observe that the decoherence from the ac Stark shift is strongly suppressed by the spin echo, with residual exponential decay of with a time constant when using of cavity-coupled QND probe light. Since the -pulse inverts the ground and excited population, the difference between the two QND probe signals in the spin-echo sequence provides a value for . Therefore, a spin-echo QND probe sequence with a total probe time can act as a weak measurement of , creating a signal to stabilise the clock LO while maintaining coherence with 80 fidelity.
IV Increasing the Q factor via an atom phase lock
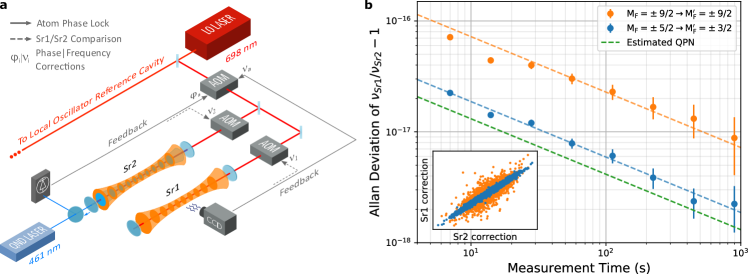
QND measurement in an OLC enables several novel applications that are otherwise impossible using conventional fluorescence readout techniques. Here we pursue one such application—the atom phase lock (APL)—in which the phase noise of the LO is tracked and corrected for via repeated weak measurement of the collective atomic spin. We characterise the performance of the APL to one OLC (NPL Sr2 [46]) using synchronous interrogation of a second OLC (NPL Sr1 [47, 48]) which has highly correlated sensitivity to fluctuations in the LO frequency and phase (see Fig. 3 and Supplemental Materials).
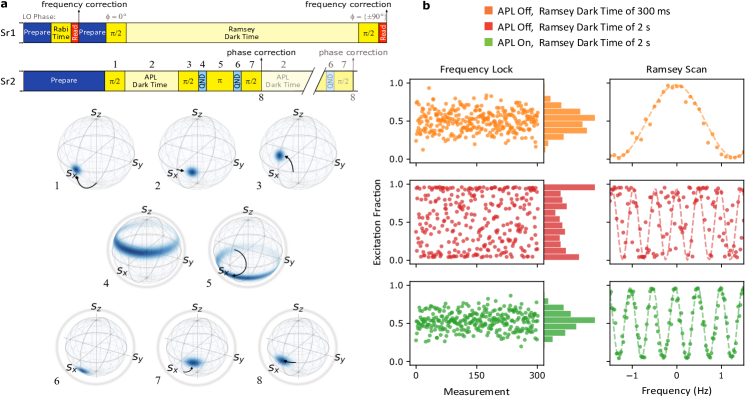
After loading approximately atoms into the optical lattice, the APL is implemented in Sr2 following the scheme depicted in Fig. 4a, which was originally proposed [49] and demonstrated [50] for microwave atomic clocks. An initial -pulse drives the atomic ensemble into a coherent state on the equator of the Bloch sphere with . As in a normal Ramsey sequence, the atomic state is left to freely evolve during which time it accumulates a phase shift relative to the LO. In the small angle approximation the accumulated LO phase is proportional to , which is read out in the following procedure: a -pulse is driven by the LO, the phase of which is stepped by with respect to the initial pulse in order to map to . The ground-state atom number is then read out via a QND measurement pulse with duration . To read out the excited-state atom number , a -pulse is driven with LO phase relative to the initial pulse, before a second QND measurement is applied for . Finally, the LO phase is stepped again to and a final -pulse is applied to return the collective atomic spin to the equator of the Bloch sphere. Based on the results of the two QND measurements, the LO phase is stepped to align the atomic spin to point along the -axis of the Bloch sphere. Repeating the free-evolution time and the QND measurement procedure several times in succession, a phase lock of the LO to the atomic transition can be maintained for several seconds—well beyond the coherence time of the free running LO.
To characterise the improvement in LO phase noise, the Sr2-phase-stabilised light is used to interrogate Sr1, with results shown in Fig. 4b. Atomic samples are prepared in parallel in both systems and probed synchronously using the same local oscillator. Sr2 is used to implement the APL while Sr1 performs standard Ramsey spectroscopy. To get a baseline measurement of the free-running laser phase noise, the Sr2 APL is first disengaged and Sr1 is operated as a clock with Ramsey spectroscopy dark time . When we lock the frequency of the LO to the central Sr1 fringe, we observe noise in the in-lock excitation fraction corresponding to a standard deviation for the accumulated LO phase error of . Increasing Ramsey dark time to , but with the APL still disengaged, shows that the accumulated phase error is too large to operate the clock reliably. This is clear from the U-shaped histogram of the excitation noise in Fig. 4, indicating the phase error is well outside -range that is needed to determine unambiguously the average frequency offset during the dark time. A final dataset is taken with the APL engaged on Sr2 during the Ramsey dark time in Sr1. Specifically, the APL consists of five repetitions of a dark time followed by QND phase measurement and correction. The phase corrections are applied onto an AOM which corrects the LO light prior to it being split and sent to both clocks. Therefore, the average residual phase error accumulated during the APL can be characterised based on the excitation noise in Sr1 when locked to the clock transition, and was determined to be . Finally, a scan of the full Ramsey fringe in Sr1 shows no degradation of the 95% contrast and a Fourier limited linewidth of 254(1) mHz, corresponding to a oscillator factor of . This is within a factor of three of the finest scan resolution achieved using state-of-the-art LOs, but unlike earlier high-resolution scans [51, 28, 52] we observe no significant loss of contrast on the Ramsey fringes. To our knowledge this matches the narrowest spectroscopic feature to which any oscillator has yet been stabilised [53]. Extending the APL time further, either through longer free evolution time or increased number of QND measurements, resulted in increased phase noise in Sr1.
V Conclusion
We have demonstrated that the QND-based APL is an effective approach to improve the phase-coherence of an ultrastable laser, making it a competitive alternative to other strategies for minimising the technical noise of the LO [54]. Increasing the LO phase coherence directly impacts the frequency stability performance of the OLC, as it enables longer Ramsey dark time , resulting in an increased factor and a steeper discriminant of the atomic excitation fraction against the LO frequency. The clearest impact of this is on the quantum projection noise (QPN)-induced fractional frequency instability, which for spectroscopy of atoms with a signal contrast and a cycle time of is given by:
| (7) |
where denotes the Allan deviation for averaging time in seconds. Specifically for Sr1, which operates with atoms, the seven-fold increase in the factor achieved by extending the Ramsey probe time from to , with corresponding cycle times and respectively, reduces the QPN instability from to .
Another important source of instability in OLCs is the Dick effect, caused by short-term LO frequency noise which is sampled by dead time (primarily cooling time) in the clock sequence. For Ramsey spectroscopy, in the limit of instantaneous -pulses, the Dick-effect instability is given by [55]:
| (8) |
Increasing the ratio of the Ramsey dark time to the cycle time helps to suppress this effect. Estimating the precise reduction in Dick-effect instability is complex, as it depends on the power spectral density of the fractional frequency fluctuations of the LO at harmonics of the cycle frequency. Under the assumption that LO flicker noise, which we have directly measured to be , is the dominant noise process, the estimated Dick-effect induced instability for a Ramsey dark time is —a factor of 1.6 below what is expected for a Ramsey dark time, leading to a reduction in measurement time by a factor of 2.5 to reach the same precision. In the future, an optical frequency comb could transfer the enhanced phased stability of the LO to other wavelengths in order to improve the performance of optical clocks based on different atomic species [56, 57]. In particular, applying this technique to Yb+ or highly charged ion clocks which are limited by QPN, but exhibit a large sensitivity to changes in the fine structure constant could facilitate improved tests of fundamental physics [58, 59, 60].
It is instructive to compare our QND-based method against alternative approaches to extend the coherence time of the LO laser. In one demonstration, the LO was pre-stabilised to an OLC with 50% duty cycle, and then used to interrogate a second OLC [28]. However, with this approach the attainable extension of probe time is limited—there is still considerable dead time of several hundred milliseconds needed to cool atoms in the pre-stabilization OLC, during which the phase of the LO is going unmeasured. Another promising alternative would be to make use of recent advances combining strontium atoms and tweezer arrays [61, 52]. Such platforms allow for repeated probing of the clock transition and detection, in some cases up to 15 times, without needing to reload the atoms. However, since these experiments rely on fluorescence detection, the phase coherence between the LO and the atoms is lost during detection. If repeated fluorescence readout in a tweezer array were used to implement a destructive form of the atom phase lock, the phase measurement errors (e.g. from quantum projection noise) would accumulate with each interrogation pulse. In contrast, the QND measurement-based approach preserves coherence after each measurement, resulting in phase noise in earlier measurements being corrected for in subsequent ones.
Considering alternative applications of the APL scheme, we speculate that it could help to enable high-Q spectroscopy in environments where the ultimate performance of cavity stabilised lasers can not be reached, for instance in field deployed systems. At the same time, the QND measurement scheme underpinning the APL also opens the door to other configurations of quantum-enhanced optical atomic clocks. Going forward, it will be instructive to characterise the QND measurement scheme in more detail, for example by using colder atomic samples in a better-controlled motional state. Relative to the data presented in Fig. 2, we observe that the QND contrast decay rate can be reduced by a factor of approximately two by adjusting the MZI setup in Fig. 1 so that the two EOMs generating the stronger probe sidebands at are placed on different arms of the MZI—this eliminates spurious 2nd-order frequency components near atomic resonance created at the difference frequency between those EOMs, thereby mitigating a source of excess scattered photons. If the QND readout noise and measurement back-action can be controlled close to their shot noise limits, our quantum non-demolition measurement apparatus could be used to generate squeezed states with reduced QPN, offering a route towards OLC comparison with unprecedented frequency precision. Finally, the ability to engineer squeezing in Sr could also have implications beyond precision timekeeping, for example by improving the performance of Sr atom-interferometers [62] toward the sensitivity necessary to observe gravitational waves [63].
Acknowledgments
This work was financially supported by the UK Department for Business, Energy and Industrial Strategy as part of the National Measurement System Programme; and by the European Metrology Programme for Innovation and Research (EMPIR) project 17FUN03-USOQS. This project has received funding from the EMPIR programme co-financed by the Participating States and from the European Union’s Horizon 2020 research and innovation programme. A.V. acknowledges funding from the Engineering and Physical Sciences Research Council (EPSRC UK) through the Controlled Quantum Dynamics Centre for Doctoral Training (EP/L016524/1) for the core duration of this work. We thank Helen Margolis, Alissa Silva and Jake Paterson for operating the optical frequency comb, and Rachel Godun and Rich Hendricks for careful reading of the manuscript.
References
- Braginsky et al. [1980] V. B. Braginsky, Y. I. Vorontsov, and K. S. Thorne, Quantum non-demolition measurements, Science 209, 547 (1980).
- Ofek et al. [2016] N. Ofek, A. Petrenko, R. Heeres, P. Reinhold, Z. Leghtas, B. Vlastakis, Y. Liu, L. Frunzio, S. M. Girvin, L. Jiang, M. Mirrahimi, M. H. Devoret, and R. J. Schoelkopf, Extending the lifetime of a quantum bit with error correction in superconducting circuits, Nature 536, 441 (2016).
- Vool et al. [2016] U. Vool, S. Shankar, S. Mundhada, N. Ofek, A. Narla, K. Sliwa, E. Zalys-Geller, Y. Liu, L. Frunzio, R. Schoelkopf, S. Girvin, and M. Devoret, Continuous quantum non-demolition measurement of the transverse component of a qubit, Physical Review Letters 117, 133601 (2016).
- Hacohen-Gourgy et al. [2016] S. Hacohen-Gourgy, L. S. Martin, E. Flurin, V. V. Ramasesh, K. B. Whaley, and I. Siddiqi, Quantum dynamics of simultaneously measured non-commuting observables, Nature 538, 491 (2016).
- Raha et al. [2020] M. Raha, S. Chen, C. M. Phenicie, S. Ourari, A. M. Dibos, and J. D. Thompson, Optical quantum non-demolition measurement of a single rare earth ion qubit, Nature Communications 11, 1605 (2020).
- Nakajima et al. [2019] T. Nakajima, A. Noiri, J. Yoneda, M. R. Delbecq, P. Stano, T. Otsuka, K. Takeda, S. Amaha, G. Allison, K. Kawasaki, et al., Quantum non-demolition measurement of an electron spin qubit, Nature Nanotechnology 14, 555 (2019).
- Xue et al. [2020] X. Xue, B. D’Anjou, T. F. Watson, D. R. Ward, D. E. Savage, M. G. Lagally, M. Friesen, S. N. Coppersmith, M. A. Eriksson, W. A. Coish, and L. M. K. Vandersypen, Repetitive quantum non-demolition measurement and soft decoding of a silicon spin qubit, Phys. Rev. X 10, 021006 (2020).
- Lecocq et al. [2015] F. Lecocq, J. Clark, R. Simmonds, J. Aumentado, and J. Teufel, Quantum non-demolition measurement of a nonclassical state of a massive object, Physical Review X 5, 041037 (2015).
- Rossi et al. [2018] M. Rossi, D. Mason, J. Chen, Y. Tsaturyan, and A. Schliesser, Measurement-based quantum control of mechanical motion, Nature 563, 53 (2018).
- Kono et al. [2018] S. Kono, K. Koshino, Y. Tabuchi, A. Noguchi, and Y. Nakamura, Quantum non-demolition detection of an itinerant microwave photon, Nature Physics 14, 546 (2018).
- Reiserer et al. [2013] A. Reiserer, S. Ritter, and G. Rempe, Non-destructive detection of an optical photon, Science 342, 1349 (2013).
- Besse et al. [2018] J.-C. Besse, S. Gasparinetti, M. C. Collodo, T. Walter, P. Kurpiers, M. Pechal, C. Eichler, and A. Wallraff, Single-shot quantum non-demolition detection of individual itinerant microwave photons, Phys. Rev. X 8, 021003 (2018).
- Brune et al. [1996] M. Brune, E. Hagley, J. Dreyer, X. Maître, A. Maali, C. Wunderlich, J. M. Raimond, and S. Haroche, Observing the Progressive Decoherence of the “Meter” in a Quantum Measurement, Physical Review Letters 77, 4887 (1996).
- Cramer et al. [2016] J. Cramer, N. Kalb, M. A. Rol, B. Hensen, M. S. Blok, M. Markham, D. J. Twitchen, R. Hanson, and T. H. Taminiau, Repeated quantum error correction on a continuously encoded qubit by real-time feedback, Nature Communications 7, 11526 (2016).
- Hume et al. [2007] D. B. Hume, T. Rosenband, and D. J. Wineland, High-fidelity adaptive qubit detection through repetitive quantum non-demolition measurements, Physical Review Letters 99, 120502 (2007).
- Wolf et al. [2016] F. Wolf, Y. Wan, J. C. Heip, F. Gebert, C. Shi, and P. O. Schmidt, Non-destructive state detection for quantum logic spectroscopy of molecular ions, Nature 530, 457 (2016).
- Shah et al. [2010] V. Shah, G. Vasilakis, and M. V. Romalis, High bandwidth atomic magnetometery with continuous quantum non-demolition measurements, Phys. Rev. Lett. 104, 013601 (2010).
- Colangelo et al. [2017] G. Colangelo, F. M. Ciurana, L. C. Bianchet, R. J. Sewell, and M. W. Mitchell, Simultaneous tracking of spin angle and amplitude beyond classical limits, Nature 543, 525 (2017).
- Hosten et al. [2016] O. Hosten, N. J. Engelsen, R. Krishnakumar, and M. A. Kasevich, Measurement noise 100 times lower than the quantum-projection limit using entangled atoms, Nature 529, 505 (2016).
- Louchet-Chauvet et al. [2010] A. Louchet-Chauvet, J. Appel, J. J. Renema, D. Oblak, N. Kjaergaard, and E. S. Polzik, Entanglement-assisted atomic clock beyond the projection noise limit, New Journal of Physics 12, 065032 (2010).
- Kuzmich et al. [2000] A. Kuzmich, L. Mandel, and N. P. Bigelow, Generation of spin squeezing via continuous quantum non-demolition measurement, Phys. Rev. Lett. 85, 1594 (2000).
- Cox et al. [2016] K. C. Cox, G. P. Greve, J. M. Weiner, and J. K. Thompson, Deterministic squeezed states with collective measurements and feedback, Phys. Rev. Lett. 116, 093602 (2016).
- Schleier-Smith et al. [2010] M. H. Schleier-Smith, I. D. Leroux, and V. Vuletić, States of an ensemble of two-level atom with reduced quantum uncertainty, Phys. Rev. Lett. 104, 073604 (2010).
- Braverman et al. [2019] B. Braverman, A. Kawasaki, E. Pedrozo-Peñafiel, S. Colombo, C. Shu, Z. Li, E. Mendez, M. Yamoah, L. Salvi, D. Akamatsu, Y. Xiao, and V. Vuletić, Near-Unitary Spin Squeezing in 171Yb, Phys. Rev. Lett. 122, 223203 (2019).
- Vallet et al. [2017] G. Vallet, E. Bookjans, U. Eismann, S. Bilicki, R. L. Targat, and J. Lodewyck, A noise-immune cavity-assisted non-destructive detection for an optical lattice clock in the quantum regime, New Journal of Physics 19, 083002 (2017).
- Norcia and Thompson [2016] M. A. Norcia and J. K. Thompson, Strong coupling on a forbidden transition in strontium and non-destructive atom counting, Phys. Rev. A 93, 023804 (2016).
- Oelker et al. [2019] E. Oelker, R. B. Hutson, C. J. Kennedy, L. Sonderhouse, T. Bothwell, A. Goban, D. Kedar, C. Sanner, J. M. Robinson, G. E. Marti, D. G. Matei, T. Legero, M. Giunta, R. Holzwarth, F. Riehle, U. Sterr, and J. Ye, Demonstration of stability at 1 s for two independent optical clocks, Nature Photonics 13, 714 (2019).
- Schioppo et al. [2017] M. Schioppo, R. C. Brown, W. F. McGrew, N. Hinkley, R. J. Fasano, K. Beloy, T. H. Yoon, G. Milani, D. Nicolodi, J. A. Sherman, N. B. Phillips, C. W. Oates, and A. D. Ludlow, Ultrastable optical clock with two cold-atom ensembles, Nature Photonics 11, 48 (2017).
- Ushijima et al. [2015] I. Ushijima, M. Takamoto, M. Das, T. Ohkubo, and H. Katori, Cryogenic optical lattice clocks, Nature Photonics 9, 185 (2015).
- McGrew et al. [2018] W. F. McGrew, X. Zhang, R. J. Fasano, S. A. Schäffer, K. Beloy, D. Nicolodi, R. C. Brown, N. Hinkley, G. Milani, M. Schioppo, T. H. Yoon, and A. D. Ludlow, Atomic clock performance enabling geodesy below the centimetre level, Nature 564, 87 (2018).
- Lodewyck [2019] J. Lodewyck, On a definition of the SI second with a set of optical clock transitions, Metrologia 56, 055009 (2019).
- Grotti et al. [2018] J. Grotti, S. Koller, S. Vogt, S. Häfner, U. Sterr, C. Lisdat, H. Denker, C. Voigt, L. Timmen, A. Rolland, F. N. Baynes, H. S. Margolis, M. Zampaolo, P. Thoumany, M. Pizzocaro, B. Rauf, F. Bregolin, A. Tampellini, P. Barbieri, M. Zucco, G. A. Costanzo, C. Clivati, F. Levi, and D. Calonico, Geodesy and metrology with a transportable optical clock, Nature Physics 14, 437 (2018).
- Takano et al. [2016] T. Takano, M. Takamoto, I. Ushijima, N. Ohmae, T. Akatsuka, A. Yamaguchi, Y. Kuroishi, H. Munekane, B. Miyahara, and H. Katori, Geopotential measurements with synchronously linked optical lattice clocks, Nature Photonics 10, 662 (2016).
- Wcisło et al. [2018] P. Wcisło, P. Ablewski, K. Beloy, S. Bilicki, M. Bober, R. Brown, R. Fasano, R. Ciuryło, H. Hachisu, T. Ido, J. Lodewyck, A. Ludlow, W. McGrew, P. Morzyński, D. Nicolodi, M. Schioppo, M. Sekido, R. L. Targat, P. Wolf, X. Zhang, B. Zjawin, and M. Zawada, New bounds on dark matter coupling from a global network of optical atomic clocks, Science Advances 4, eaau4869 (2018).
- Delva et al. [2017] P. Delva, J. Lodewyck, S. Bilicki, E. Bookjans, G. Vallet, R. Le Targat, P.-E. Pottie, C. Guerlin, F. Meynadier, C. Le Poncin-Lafitte, O. Lopez, A. Amy-Klein, W.-K. Lee, N. Quintin, C. Lisdat, A. Al-Masoudi, S. Dörscher, C. Grebing, G. Grosche, A. Kuhl, S. Raupach, U. Sterr, I. R. Hill, R. Hobson, W. Bowden, J. Kronjäger, G. Marra, A. Rolland, F. N. Baynes, H. S. Margolis, and P. Gill, Test of special relativity using a fiber network of optical clocks, Phys. Rev. Lett. 118, 221102 (2017).
- Takamoto et al. [2020] M. Takamoto, I. Ushijima, N. Ohmae, T. Yahagi, K. Kokado, H. Shinkai, and H. Katori, Test of general relativity by a pair of transportable optical lattice clocks, Nature Photonics 10.1038/s41566-020-0619-8 (2020).
- Roberts et al. [2020] B. M. Roberts, P. Delva, A. Al-Masoudi, A. Amy-Klein, C. Bærentsen, C. F. A. Baynham, E. Benkler, S. Bilicki, S. Bize, W. Bowden, J. Calvert, V. Cambier, E. Cantin, E. A. Curtis, S. Dörscher, M. Favier, F. Frank, P. Gill, R. M. Godun, G. Grosche, C. Guo, A. Hees, I. R. Hill, R. Hobson, N. Huntemann, J. Kronjäger, S. Koke, A. Kuhl, R. Lange, T. Legero, B. Lipphardt, C. Lisdat, J. Lodewyck, O. Lopez, H. S. Margolis, H. Álvarez-Martínez, F. Meynadier, F. Ozimek, E. Peik, P.-E. Pottie, N. Quintin, C. Sanner, L. D. Sarlo, M. Schioppo, R. Schwarz, A. Silva, U. Sterr, C. Tamm, R. L. Targat, P. Tuckey, G. Vallet, T. Waterholter, D. Xu, and P. Wolf, Search for transient variations of the fine structure constant and dark matter using fiber-linked optical atomic clocks, New Journal of Physics 22, 093010 (2020).
- Ye et al. [2008] J. Ye, H. Kimble, and H. Katori, Quantum state engineering and precision metrology using state-insensitive light traps, Science 320, 1734 (2008).
- Blais et al. [2004] A. Blais, R.-S. Huang, A. Wallraff, S. M. Girvin, and R. J. Schoelkopf, Cavity quantum electrodynamics for superconducting electrical circuits: An architecture for quantum computation, Phys. Rev. A 69, 062320 (2004).
- Zueco et al. [2009] D. Zueco, G. M. Reuther, S. Kohler, and P. Hänggi, Qubit-oscillator dynamics in the dispersive regime: Analytical theory beyond the rotating-wave approximation, Phys. Rev. A 80, 033846 (2009).
- Hobson et al. [2019] R. Hobson, W. Bowden, A. Vianello, I. R. Hill, and P. Gill, Cavity-enhanced non-destructive detection of atoms for an optical lattice clock, Opt. Express 27, 37099 (2019).
- Long et al. [2007] R. Long, A. Tuchman, and M. Kasevich, Multiple frequency modulation for low-light atom measurements in an optical cavity, Optics letters 32, 2502 (2007).
- Ye et al. [1998] J. Ye, L.-S. Ma, and J. L. Hall, Ultrasensitive detections in atomic and molecular physics: demonstration in molecular overtone spectroscopy, J. Opt. Soc. Am. B 15, 6 (1998).
- Drever et al. [1983] R. W. P. Drever, J. L. Hall, F. V. Kowalski, J. Hough, G. M. Ford, A. J. Munley, and H. Ward, Laser phase and frequency stabilization using an optical resonator, Applied Physics B 31, 97 (1983).
- Blatt et al. [2009] S. Blatt, J. W. Thomsen, G. K. Campbell, A. D. Ludlow, M. D. Swallows, M. J. Martin, M. M. Boyd, and J. Ye, Rabi spectroscopy and excitation inhomogeneity in a one-dimensional optical lattice clock, Phys. Rev. A 80, 052703 (2009).
- Bowden et al. [2019a] W. Bowden, R. Hobson, I. R. Hill, A. Vianello, M. Schioppo, A. Silva, H. S. Margolis, P. E. G. Baird, and P. Gill, A pyramid MOT with integrated optical cavities as a cold atom platform for an optical lattice clock, Scientific Reports 9, 1 (2019a).
- Hill et al. [2016] I. R. Hill, R. Hobson, W. Bowden, E. M. Bridge, S. Donnellan, E. A. Curtis, and P. Gill, A low maintenance Sr optical lattice clock, Journal of Physics: Conference Series 723, 012019 (2016).
- Hobson et al. [2020a] R. Hobson, W. Bowden, A. Vianello, A. Silva, C. Baynham, H. S. Margolis, P. E. G. Baird, P. Gill, and I. R. Hill, A strontium optical lattice clock with 1x10-17 uncertainty and measurement of its absolute frequency, Metrologia (2020a).
- Shiga and Takeuchi [2012] N. Shiga and M. Takeuchi, Locking the local oscillator phase to the atomic phase via weak measurement, New Journal of Physics 14, 023034 (2012), publisher: IOP Publishing.
- Kohlhaas et al. [2015] R. Kohlhaas, A. Bertoldi, E. Cantin, A. Aspect, A. Landragin, and P. Bouyer, Phase Locking a Clock Oscillator to a Coherent Atomic Ensemble, Phys. Rev. X 5, 021011 (2015).
- Campbell et al. [2017] S. L. Campbell, R. B. Hutson, G. E. Marti, A. Goban, N. Darkwah Oppong, R. L. McNally, L. Sonderhouse, J. M. Robinson, W. Zhang, B. J. Bloom, and J. Ye, A Fermi-degenerate three-dimensional optical lattice clock, Science 358, 90 (2017).
- Norcia et al. [2019] M. A. Norcia, A. W. Young, W. J. Eckner, E. Oelker, J. Ye, and A. M. Kaufman, Seconds-scale coherence on an optical clock transition in a tweezer array, Science 366, 93 (2019).
- Origlia et al. [2018] S. Origlia, M. S. Pramod, S. Schiller, Y. Singh, K. Bongs, R. Schwarz, A. Al-Masoudi, S. Dörscher, S. Herbers, S. Häfner, U. Sterr, and C. Lisdat, Towards an optical clock for space: Compact, high-performance optical lattice clock based on bosonic atoms, Phys. Rev. A 98, 053443 (2018).
- Matei et al. [2017] D. Matei, T. Legero, S. Häfner, C. Grebing, R. Weyrich, W. Zhang, L. Sonderhouse, J. Robinson, J. Ye, F. Riehle, and U. Sterr, Lasers with Sub-10 mHz Linewidth, Physical Review Letters 118, 263202 (2017).
- Santarelli et al. [1998] G. Santarelli, C. Audoin, A. Makdissi, P. Laurent, G. J. Dick, and A. Clairon, Frequency stability degradation of an oscillator slaved to a periodically interrogated atomic resonator, IEEE Transactions on Ultrasonics, Ferroelectrics, and Frequency Control 45, 887 (1998).
- Giunta et al. [2020] M. Giunta, W. Hänsel, M. Fischer, M. Lezius, T. Udem, and R. Holzwarth, Real-time phase tracking for wide-band optical frequency measurements at the 20th decimal place, Nature Photonics 14, 44 (2020).
- Benkler et al. [2019] E. Benkler, B. Lipphardt, T. Puppe, R. Wilk, F. Rohde, and U. Sterr, End-to-end topology for fiber comb based optical frequency transfer at the level, Optics Express 27, 36886 (2019).
- Godun et al. [2014] R. M. Godun, P. B. R. Nisbet-Jones, J. M. Jones, S. A. King, L. A. M. Johnson, H. S. Margolis, K. Szymaniec, S. N. Lea, K. Bongs, and P. Gill, Frequency ratio of two optical clock transitions in 171Yb+ and constraints on the time variation of fundamental constants, Phys. Rev. Lett. 113, 210801 (2014).
- Huntemann et al. [2014] N. Huntemann, B. Lipphardt, C. Tamm, V. Gerginov, S. Weyers, and E. Peik, Improved limit on a temporal variation of from comparisons of Yb+ and Cs atomic clocks, Phys. Rev. Lett. 113, 210802 (2014).
- Kozlov et al. [2018] M. G. Kozlov, M. S. Safronova, J. R. Crespo López-Urrutia, and P. O. Schmidt, Highly charged ions: Optical clocks and applications in fundamental physics, Rev. Mod. Phys. 90, 045005 (2018).
- Madjarov et al. [2019] I. S. Madjarov, A. Cooper, A. L. Shaw, J. P. Covey, V. Schkolnik, T. H. Yoon, J. R. Williams, and M. Endres, An atomic-array optical clock with single-atom readout, Phys. Rev. X 9, 041052 (2019).
- Hu et al. [2017] L. Hu, N. Poli, L. Salvi, and G. M. Tino, Atom interferometry with the sr optical clock transition, Phys. Rev. Lett. 119, 263601 (2017).
- Graham et al. [2013] P. W. Graham, J. M. Hogan, M. A. Kasevich, and S. Rajendran, New method for gravitational wave detection with atomic sensors, Physical Review Letters 110, 171102 (2013).
- Hobson et al. [2020b] R. Hobson, W. Bowden, A. Vianello, I. R. Hill, and P. Gill, Mid-infrared magneto-optical trap of metastable strontium for an optical lattice clock, Physical Review A 101, 013420 (2020b).
- Dovale Álvarez [2019] M. Dovale Álvarez, Optical cavities for optical atomic clocks, atom interferometry and gravitational-wave detection, Springer Theses (2019).
- Schioppo et al. [2020] M. Schioppo, J. Kronjäger, A. Silva, J. Paterson, C. F. A. Baynham, W. Bowden, I. R. Hill, R. Hobson, A. Vianello, M. Dovale-Álvarez, R. A. Williams, G. Marra, R. M. Godun, H. S. Margolis, A. Amy-Klein, O. Lopez, E. Cantin, H. Álvarez-Martínez, R. Le Targat, P.-E. Pottie, N. Quintin, T. Legero, S. Häfner, U. Sterr, R. Schwarz, S. Dörscher, C. Lisdat, S. Koke, A. Kuhl, T. Waterholter, E. Benkler, and G. Grosche, Comparison of ultrastable lasers at fractional frequency instability through a 2,220 km long optical fibre link network, In preparation (2020).
- Telle et al. [2002] H. Telle, B. Lipphardt, and J. Stenger, Kerr-lens, mode-locked lasers as transfer oscillators for optical frequency measurements, Applied Physics B 74, 1 (2002).
- Ma et al. [1994] L.-S. Ma, P. Jungner, J. Ye, and J. L. Hall, Delivering the same optical frequency at two places: accurate cancellation of phase noise introduced by an optical fiber or other time-varying path, Optics letters 19, 1777 (1994).
- Bowden et al. [2019b] W. Bowden, A. Vianello, and R. Hobson, A low-noise resonant input transimpedance amplified photodetector, Review of Scientific Instruments 90, 106106 (2019b).
- Quessada et al. [2003] A. Quessada, R. P. Kovacich, I. n. Courtillot, A. Clairon, G. Santarelli, and P. Lemonde, The Dick effect for an optical frequency standard, Journal of Optics B: Quantum and Semiclassical Optics 5, S150 (2003).
Supplementary Materials
Science packages, local oscillator and stability transfer
The two OLCs have been described in detail in earlier work (Sr1 [47, 48] and Sr2 [46]). Both clocks run a two-stage cooling sequence, starting with a magneto-optical trap (MOT) operating on the 5s2 - 5s5p transition. In Sr2, the second-stage MOT is operated on the 5s5p - 5s4d transition at , reaching a temperature of [64]. From the second-stage MOT, atoms load into the optical lattice trap with waist and depth , and after a state preparation and filtering stage atoms are trapped in the lattice at and respectively in the axial and radial directions, prepared into the 5s5p , state with greater than 99% purity. In Sr1 the second-stage MOT uses the 5s2 - 5s5p transition at , reaching a temperature of . From this MOT the atoms load into a vertical, out-of-vacuum cavity-enhanced optical lattice (not yet implemented in [47]) with waist and depth . After state preparation and filtering, Sr1 has atoms in the 5s5p , state trapped in the lattice at and respectively in the axial and radial directions.
The local oscillator is based on a Nd:YAG laser, frequency stabilised to a reference optical cavity with a length of 485 mm and operated at room temperature [65]. The fractional frequency flicker floor is measured to be below at integration time in comparison with a cryogenic laser at Physikalisch-Technische Bundesanstalt (PTB) in Germany through an international optical fibre network [66]. This level of instability is in good agreement with the estimated Brownian thermal noise floor. The stability of the light at is transferred to the Sr lattice clock transition wavelength at through a multi-branch frequency comb operated in the transfer oscillator scheme [67]. Path-length stabilization is implemented to remove phase noise of the optical fibres used to deliver the and light to the frequency comb [68].
Weak measurement system
The setup for the QND measurement has previously been presented in detail [41] and shares several features with work by another group [25]. Since our first demonstration, three major upgrades were made to improve the signal-to-noise ratio as needed to enter the weak measurement regime.
First, a filter cavity was added to remove the amplified spontaneous emission present on the probe beam, arising from the tapered amplifier which is frequency doubled using a single-pass periodically poled LiNbO3 waveguide. The filter cavity has a finesse of 500, leading to a linewidth of . The second upgrade was to replace the fused fibre-optic splitter and the waveguide electro-optic modulator (EOM), originally used in the MZI to generate sidebands at and , with a free-space beamsplitter and three dedicated resonant-drive free-space EOMs. This greatly reduced optical losses, since the the waveguide EOM exhibited an unstable insertion loss between 10 and 13 dB. It also eliminated parasitic etalons which had previously compromised the long term stability of the QND signal. Finally, the photodetector used to measure the cavity reflection and create the QND signal, which had an input noise at , was replaced with a resonantly-amplified photodetector with input noise at [69], allowing for shot-noise operation at for incident power above . Together, these improvements enable a detection noise floor within a factor of two of the expected photon shot noise limit in the band - (excluding harmonics of ) for total power in the beam incident on the QND photodetector, where previously a factor six excess noise was observed [41].
Minimizing differential phase noise between Sr1 and Sr2
In order for Sr1 to benefit from the improved LO coherence enabled by the Sr2 APL, differential phase noise between the two systems must be controlled to a negligible level. Here we describe two causes of phase noise, and our approach to suppress them.
The largest source of differential phase noise is due to fluctuations in the optical path length traversed by the LO light as it is delivered from the laser to the two atomic systems. Both Sr1 and Sr2 use the same architecture to suppress the path length instability, depicted in Fig. 5. The LO laser light is delivered by optical fibre to each science chamber before passing through an acousto-optic modulator (AOM). The light is then partially retro-reflected back to the LO laser through the AOM and fibre, and is phase locked to a common reference beam via optical heterodyne detection feeding back to the frequency of the AOM drive [68]. In order to stabilise the final free-space path from the partial retro-reflector to the lattice mirror, we implement another active stabilization loop. In this case, the AOM deflecting the LO beam must be switched on and off to implement the Ramsey spectroscopy, thereby interrupting any beat signal at which might otherwise have been used for path length stabilization. To solve this problem, we continuously drive the switching AOM with a second RF frequency to diffract the lattice light transmitted through the cavity. The lattice light is then reflected by the partial retro-reflector, diffracted by the switching AOM a second time, before returning to the cavity where its phase is compared to the field directly exiting the cavity via a heterodyne measurement. The beat is stabilised via feedback to the clock reference used to synthesise both RF drive frequencies deflecting and . By choosing the ratio of the and RF drive frequencies to match the ratio of their optical frequencies, both beams are deflected by the same angle and the path length corrections acting on are fed forward with the correct amplitude onto the light.
A second source of differential phase noise between the Sr atoms in Sr1 and Sr2 arises from temporal fluctuations in environmental parameters perturbing the clock transition. In order to detect this noise, we carry out synchronous interrogation of the clock transition in both Sr1 and Sr2 using Rabi spectroscopy from the same LO. In the case of zero differential phase noise, the LO frequency noise-induced fluctuations in excitation fraction in the two systems should be perfectly correlated. Therefore, once we lock the frequency of the LO to Sr1 and Sr2 using independent AOMs with matched servo gains, the frequency instability of the Sr1/Sr2 ratio should be limited only by detection and QPN noise [28]. However, if differential phase noise is present then the excitation fractions will be less correlated and a residual Dick-effect instability [70] will arise in the synchronous Sr1/Sr2 ratio. In our system, an important source of differential noise was eventually found to be magnetic field noise in the vicinity of Sr2, which initially limited the Sr1/Sr2 ratio stability to a level a factor of five above the expected QPN limit. In these initial measurements we used the 5s to 5s5p transition with linear Zeeman sensitivity , due to the relative ease of optically pumping a large fraction of the atoms into the stretched states . However, a factor of four improved instability was observed by instead operating Sr2 on the 5s to 5s5p transition, which has much lower sensitivity of . The atoms are prepared in this state by first optically pumping to a stretched state, before coherently transferring the atoms using multiple clock pulses to drive . After the coherent transfer, residual atoms remaining in the ground state are cleared out of the lattice using a pulse of light. Using the less sensitive Zeeman transition, and keeping all path-length stabilisation loops engaged, we observe a correlation of between the excitation fractions and an instability in the Sr1/Sr2 frequency ratio of , marginally above the estimated instability arising from the combined QPN of both systems of .