Detection of a universal core-halo transition in dwarf galaxies as predicted by Bose-Einstein dark matter
Abstract
Recent discoveries of large halos of stars and dark matter around some of the lowest mass galaxies defy expectations that dwarf galaxies should be small and dense. Here we find large halos are a general feature of the well known dwarfs orbiting the Milky Way and also for the isolated dwarfs in the Local Group. Furthermore, these halos are seen to surround a dense core within each dwarf, with a clear density transition visible between the core and the halo at a radius of . This common core-halo structure is hard to understand for standard heavy particle dark matter where featureless, concentrated profiles are predicted, whereas dark matter as a Bose-Einstein condensate, DM, naturally accounts for the observed profiles, predicting a dense soliton core in every galaxy surrounded by a tenuous halo of interfering waves. We show that the stellar profiles are accurately fitted by the core-halo structure of DM, with only one free parameter, the boson mass. We also find independent consistency with the stellar velocity dispersions measured in these dwarf galaxies, which peak at the core radius and fall in the halo, at a level implying a boson mass of eV. Hence, dark matter comprised of light bosons, such as the axions generic in String Theory, provides a compelling solution for the structure of dwarf galaxies with stars that simply trace the dark matter profile of a Bose-Einstein condensate.
Galaxies with low velocity dispersions , indicating small masses, are classed as “dwarfs” with half of the stars detected typically within only kpc. So it is surprising that several low mass dwarfs are now known to posses large halos of stars and dark matter extending to over several kpc, defying the dwarf definition. This includes two spectroscopically detected halos that are dynamically dominated by dark matter around the Tucana II and AndXXI dwarf spheroidal galaxies [1, 2]. This adds to the case of Crater II, a dwarf that extends to over 3 kpc despite its very low velocity dispersion of 3 km/s and also the “ghostly” Antlia II of extremely low surface brightness extending over 4 kpc with a dispersion of 6 km/s, discovered serendipitously using GAIA satellite proper motions[3, 2]. Such “large dwarfs” are at odds with the compact, high concentration profiles predicted for low mass galaxies in N-body simulations of standard heavy particle dark matter of cold Dark Matter (CDM), where dwarfs are predicted to have the highest internal density of dark matter of any galaxy, reflecting the relatively high Universal mean density at earlier times when dwarf galaxies were first formed. In this CDM context, the extended halos of dwarfs have been qualitatively attributed to tidal effects induced by the Milky Way, or Andromeda[4, 2, 1], based on simulations that show stars may be periodically stripped or shocked near pericenter to beyond the tidal radius, generating halo-like extensions of enhanced velocity dispersion, whereas the outer velocity dispersions observed in most dwarf halos appear to be significantly lower than in their cores [5, 6, 2]. Strong tidal effects are expected for only a minority of orbiting dwarfs on eccentric orbits with small pericenters and so it is important to examine the generality of stellar halos to determine whether such halos are atypical or perhaps a common structural component of dwarf galaxies. Two such cases of the Milky Way dwarfs are definitively established to be in the process of being tidally stripped, namely the Sagittarius and Tucana III dwarfs which show opposing pairs of tidal arms[7, 8], representing only of the dwarfs orbiting the Milky Way and both of these dwarfs have relatively small orbits.
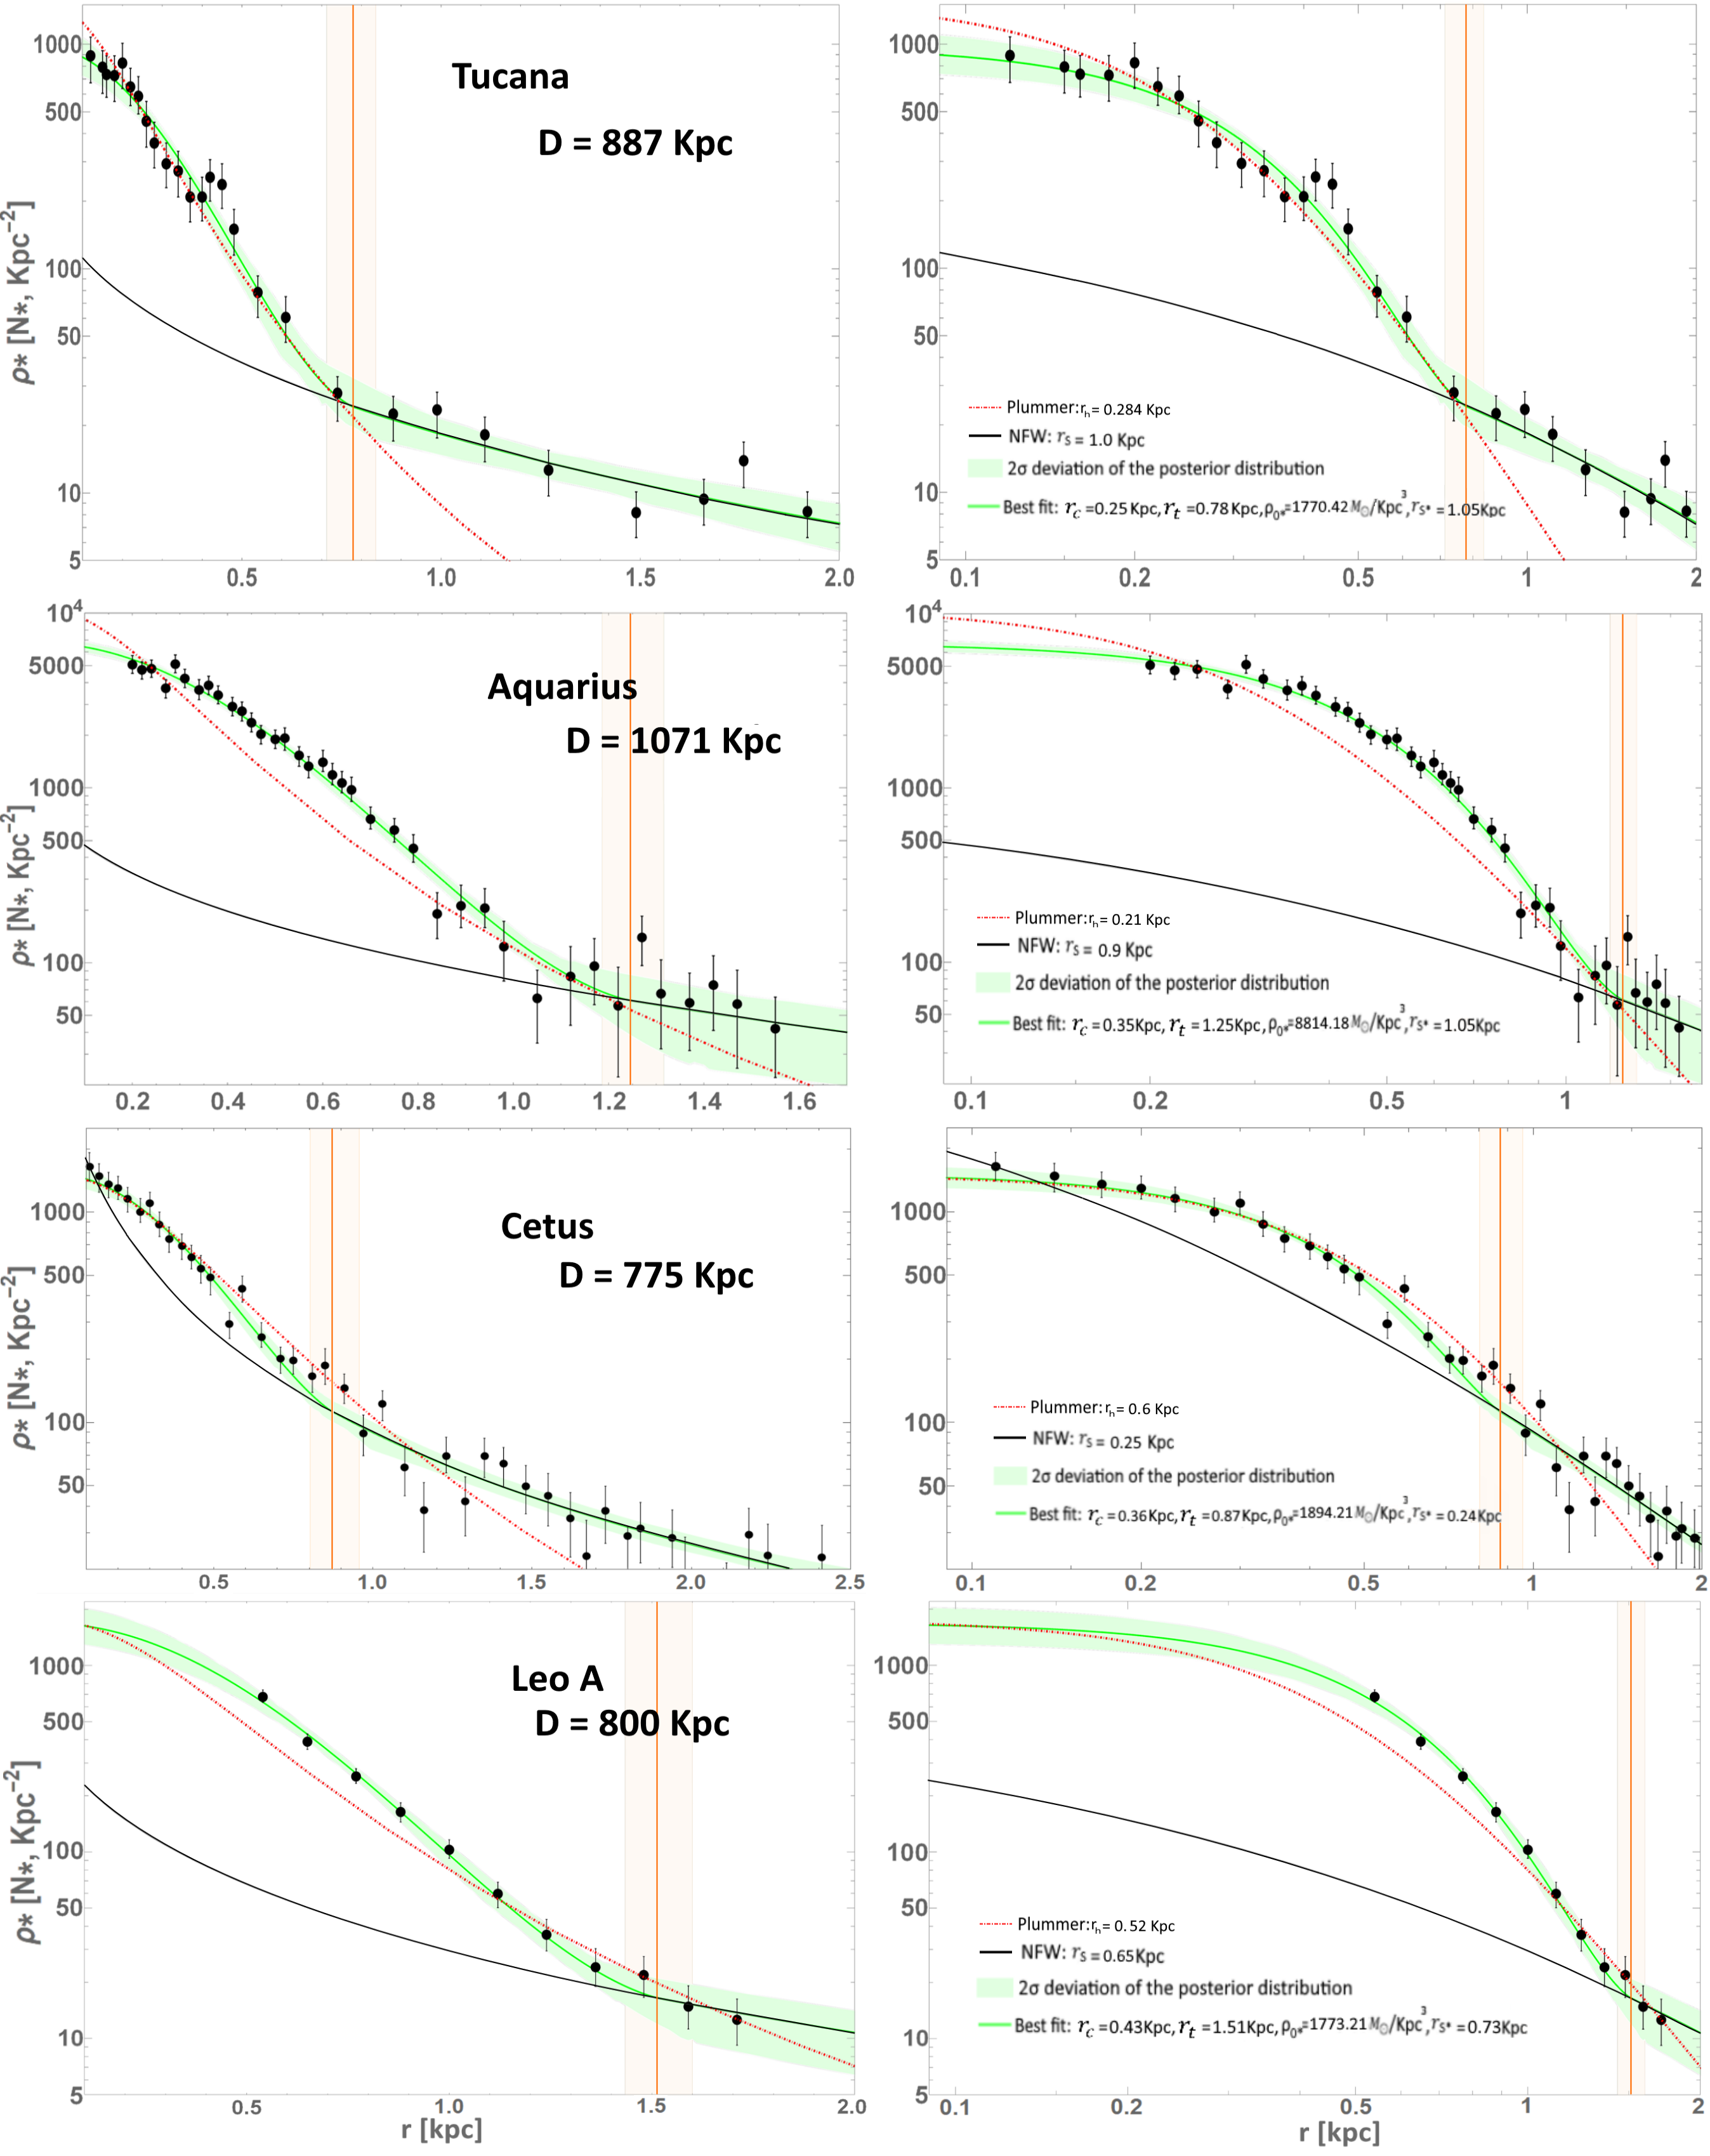
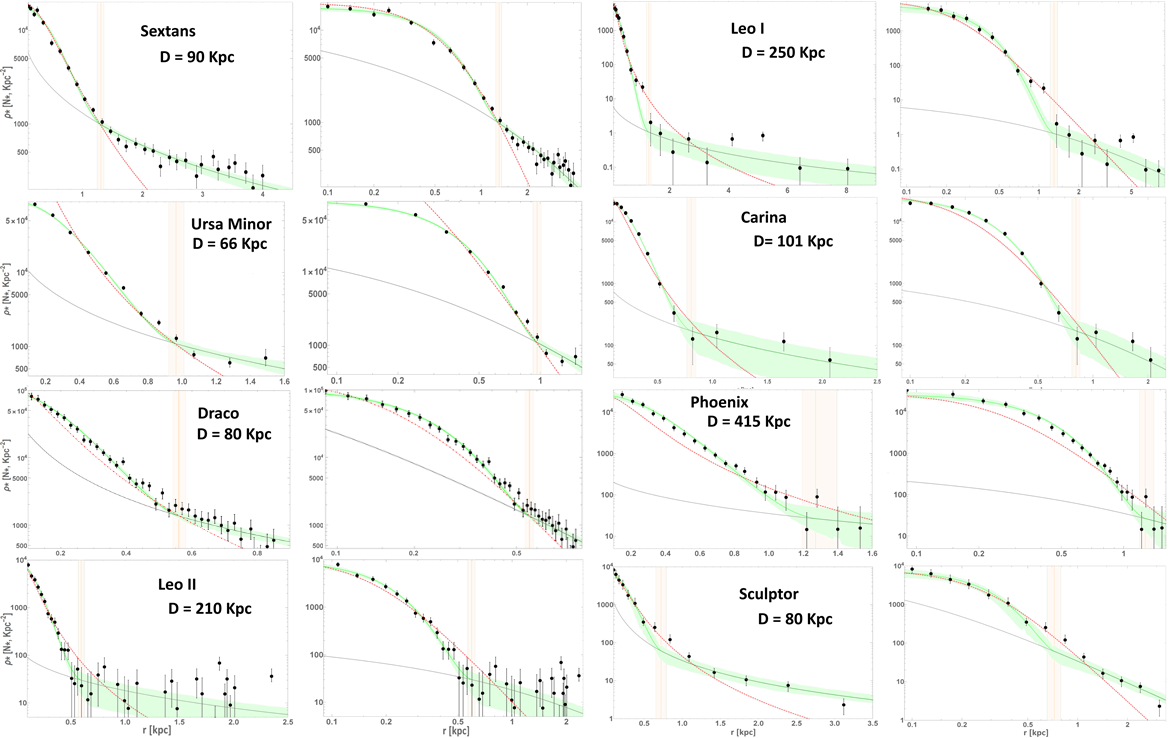
Here we examine the outer profiles of all known classical dwarf spheroidal galaxies (dSph) in the local neighbourhood, where stars can be individually counted to large radius, so the entire stellar profile can be traced free of surface brightness limitations. We start with the best studied “isolated” dwarfs lying beyond the virial radius of the Milky Way, and understood not to have interacted tidally with the major members of the Local group [9, 10, 11, 12]. These isolated dwarfs include Cetus, Tucana, Aquarius and Leo A, which have small velocity dispersions and old spheroidal stellar populations. Their stellar profiles are shown in Figure 1, where their large radial extents are visible to over kpc [9, 13, 14]. It is also apparent from Figure 1 that the stellar halos of these dwarfs extend radially from a well defined core, with a clear transition in density between the core and the halo. The core is reasonably well fitted by the standard Plummer profile in each dwarf (red curve in Figure 1), but falls well short in the halo region beyond a transition radius indicated in Figure 1 (vertical orange band).
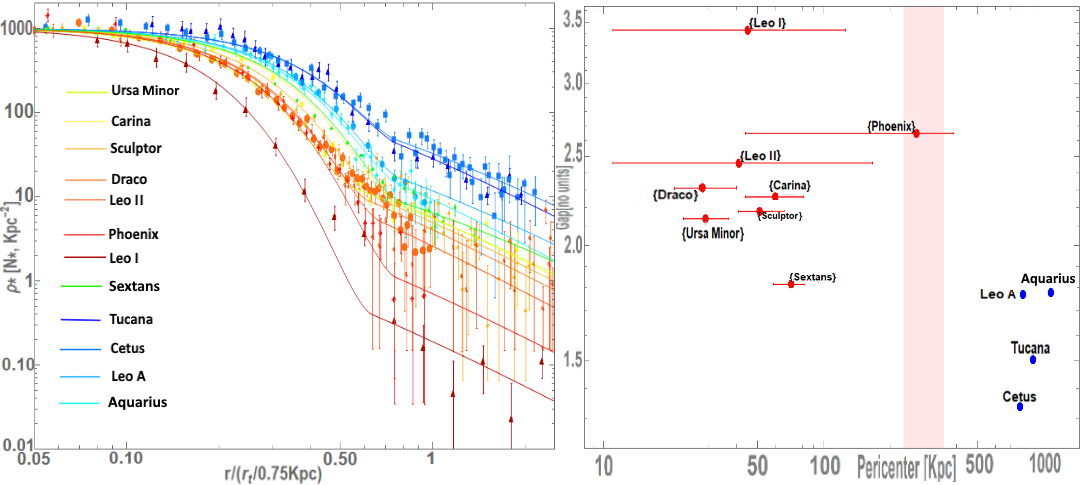
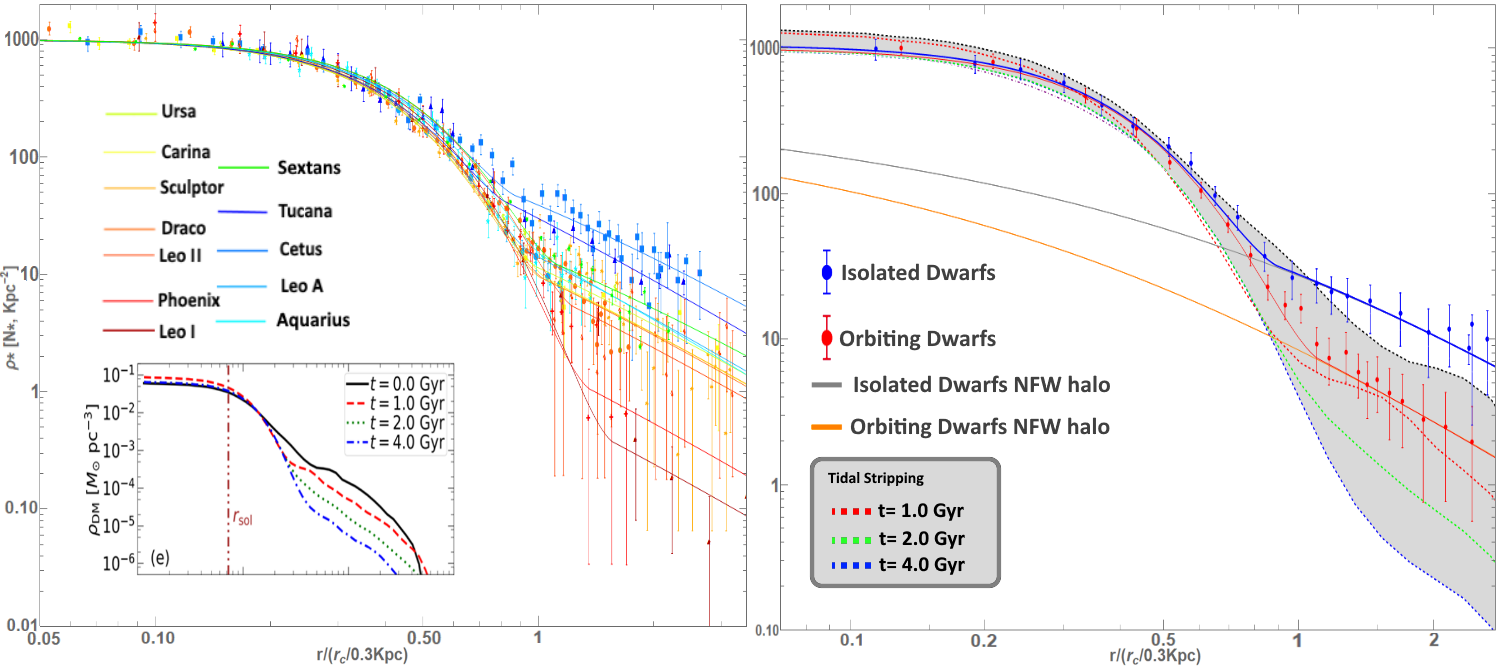
We now turn to the well studied classical dwarf galaxies orbiting the Milky Way. For these, detections of stars at surprisingly large radius beyond the estimated tidal radius[16] and originally termed “..‘extra tidal stars’ - for convenience…” [16]. Subsequently, such stars have been assumed to be tidally stripped, motivated by simulations where temporary extensions can be generated for dwarfs on rather radial orbits. However, the predicted enhancement of the velocity dispersion for stripped in the simulations may conflict with the observations, as reduced velocity dispersion are found at large radius [5]. In Figure 2 we compare the deepest, wide-field profiles for the classical dwarfs, for which a general core-halo structure is seen extending beyond kpc, with very similar outer profile gradients that are relatively shallow and extend well beyond the standard Plummer profile. Distinct cores are also evident, with a clear density transition between the core to the halo visible in most cases, (individual fits shown in the Methods section, and fitted parameters listed in Table 1). In Figure 3a we scale the stellar profiles by their individually fitted core radius, which reveals more clearly the distinctive core-halo profile, with relatively larger density transitions seen for these orbiting dwarfs (red data, Figure 3b) than the mean isolated dwarf profile (blue data, Figure 3b). The observed profiles are seen to be very similar within the core region, below the mean transition radius of 0.75kpc, whereas at larger radius the profile vary by two orders of magnitude, but with similar gradients.
We define a transition gap to quantify the change in density between the core and the halo; , where is the asymptotic central core stellar density, and shown in Figure 2b. The value of the gap is generally larger for the orbiting dwarfs than the isolated dwarfs, with , see Figure 2b. The largest core-halo transition is found for Leo I, with (Figure 2b) and so it is interesting that although Leo I is relatively distant now at 250 kpc, its orbital pericenter is now established by the GAIA satellite to be only 50 kpc, moving on an eccentric orbit (see table 1) where tidal stripping is enhanced during close approaches [17]. Tidal effects are also claimed for Ursa Minor [18], Sculptor [19, 20] and Carina dwarfs[21].
The core-halo structure we have uncovered here is a general feature of these classical dwarfs and far from expected for standard CDM, where low mass galaxies should be concentrated and core-less, with no inherent density transition. A fair fit to the inner region is provided by the Plummer profile, standard in Jeans analysis, but clearly does not extend into the halos. Expectations of small sizes and high concentrations for low mass galaxies are conditioned by CDM simulations, however a physically very different explanation for dark matter as light bosons is now understood to naturally form wide cores and extended diffuse halos. This is seen in the first simulations of dark matter (DM) as a Bose-Einstein condensate[22, 23, 24] revealing unanticipated, rich wave-like structure on the de Broglie scale, described simply by a coupled Schrodinger-Poisson equation for the mean field behaviour under self-gravity, hence the term DM. Condensates are inherently non-relativistic and hence DM behaves as ”cold” dark matter on large scales, exceeding the de Broglie wavelength, where it is statistically indistinguishable from CDM, as demonstrated in the first simulations [22]. Several unique predictions are now established for DM, including a dark core within each galaxy that follows the soliton solution of the Schrodinger-Poisson equation (see methods) with a radius, , set by the de Broglie wavelength and also that this core radius should be largest in lower mass galaxies, , of lower momentum, scaling as: as predicted by Schive et al. (2014b)[23] and verified in independent simulations, [24, 25, 26, 27, 28].
The predicted soliton profile has been shown to match well the Fornax dwarf, for which the dynamical data extends beyond the core radius allowing a determination of the boson mass of [22] and this supported by Jeans analyses of other classical dwarfs [29].
Here we examine the unique prediction that the density of DM should transition sharply between the soliton core and the surrounding halo, as the soliton forms a prominent core that contrasts by over an order of magnitude in density above the halo. This transition is predicted to be distinct even though observations are made in projection, because the soliton core is close to a Gaussian and hence its sharp 3D boundary is preserved in 2D at the core radius. It is important to appreciate this prominent core is quite unlike the behaviour of smooth cores employed, where the core is continuous in density with the halo. In contrast, the DM core is a stable standing wave that is a gravitationally self-reinforcing [23] with a pronounced overdensity predicted to be about times denser than the surrounding halo in the case of low mass galaxies relevant here, of (see Figures 1 & 2 of Schive et al. 2014b [23]). It is also clear that the soliton core is relatively stable to tidal stripping compared to the halo, as shown in recent simulations of dwarf galaxies orbiting the Milky Way [15] as the soliton by nature is self reinforcing. The halo comprises excited de Broglie scale waves that fully modulate the density but is seen in the simulations to average azimuthally to an approximately Navarro-Frenk-White (NFW), reflecting the cold, non-relativistic nature of the condensate on scales exceeding the de Broglie wavelength [30].
We first perform MCMC based DM profile fits to the isolated dwarfs, shown in Figure 1. The shape of the soliton core profile is fully characterised by the core radius, . For the halo we fit an NFW profile with scale radius and normalization . The only other free parameter we require is the transition radius, , defining the radius of the density transition between the soliton and NFW profile which we vary within a prior range indicated by the DM simulations, of (see Methods section), with the best parameters and uncertainties listed in Table 1 and in Figures 6-9 in the Supplement.
We now compare with the DM model with the orbiting dwarfs, with new DM simulations that quantify the effect of tidal stripping of a dwarf galaxy orbiting within a Milky Way sized halo, shown in Figure 3b. The main effect of tidal stripping is to strip the relatively tenuous halo, thereby enhancing the density transition at the core-halo radius, providing a natural explanation for the generally larger ”mass gap” of the orbiting dwarfs compared to the isolated dwarfs, plotted in Figure 2b. In detail, the family of profiles for the orbiting dwarfs in seen in Figure 3b to span the predicted range when tidal stripping is included, spanning several Gyrs, as can be seen in figure 3a. The Sextans dwarf galaxy has a core-halo transition that is intermediate between orbiting and isolated dwarfs, with an extensive core-halo structure and a transition gap of (Figure 2b), suggesting that Sextans is less tidally stripped than the other orbiting dwarfs, a conclusion supported by the undisturbed morphology and simple internal dynamics noted for Sextans [31, 32], indicating Sextans may have become bound to the Milky Way relatively recently.
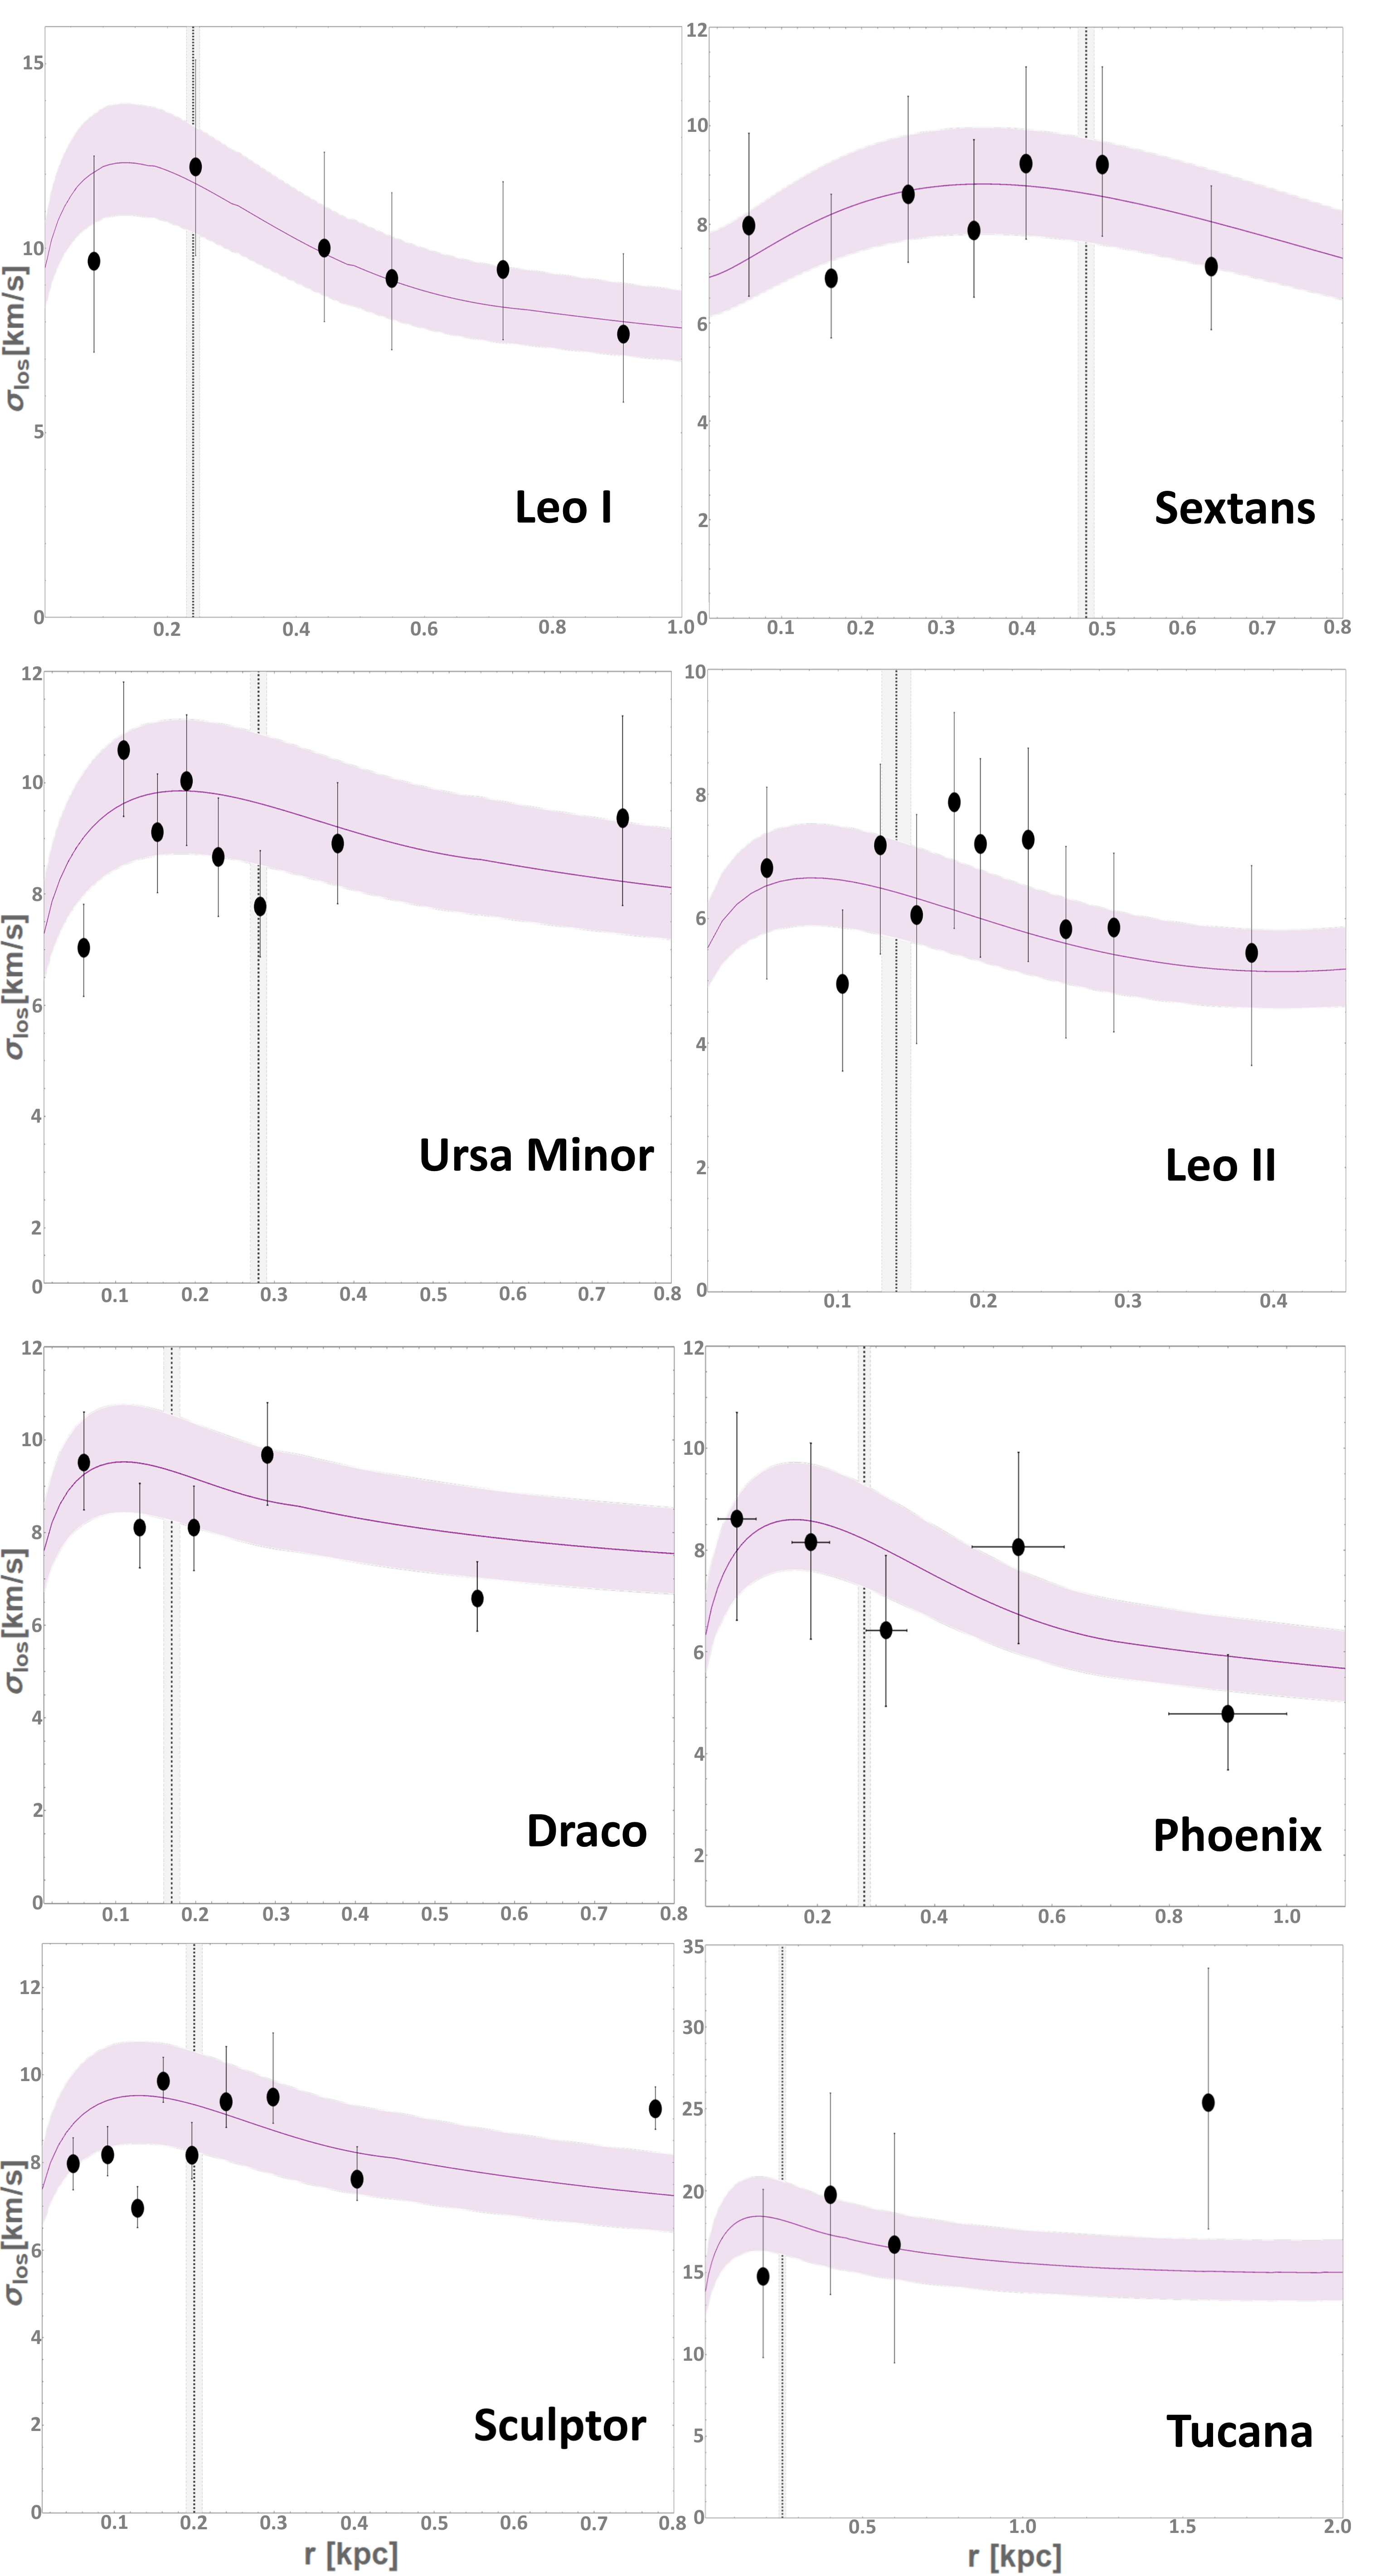
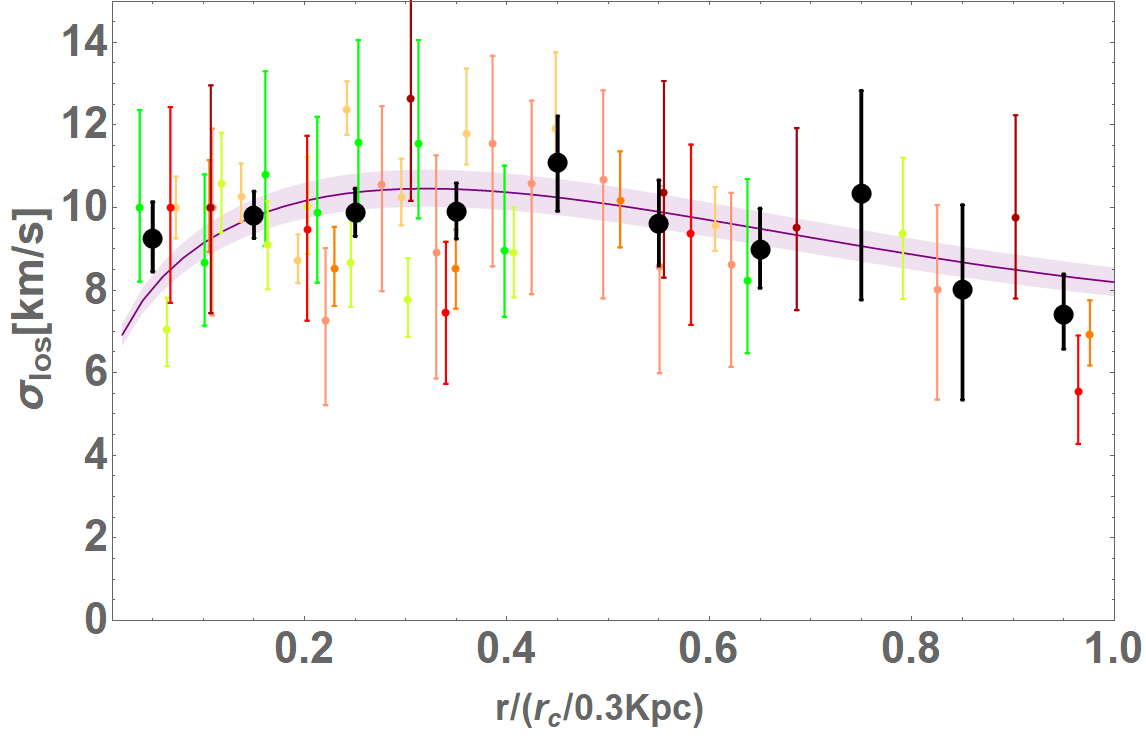
We now make an independent, dynamical consistency check of our DM fitted stellar profile fits above, using the well resolved velocity dispersion profiles available for most of the classical dwarfs, by inputting our bestfit DM density profile for each dwarfs into the Jeans equation (see methods section) to predict the corresponding velocity dispersion profile for comparison with the data for each dwarf. The form of these predicted velocity dispersion profiles should peak just beyond the core radius and then decline into the lower density halo, as shown in Figure 4, where consistency is evident in each case, both in terms of the form of the profile and in terms of the stellar core radius (vertical lines in Figure 4). The amplitude of the dispersion profiles peaks at a mean level of and together with the mean core radius of provides an estimate of the boson mass of eV (see Supplement) as indicated by the spread in the model curves in Figure 4. This is similar to the boson mass from other dynamical studies for these classical dwarfs for DM [22, 33, 34], and for the intermediate mass galaxy DF44 [35] and also consistent with the boson mass estimate for the claimed soliton core within the Milky Way of pc, which is smaller than for dwarf galaxies estimated here, reflecting the inverse momentum dependence of the de Broglie scale[23].
The case we have made here for common core-halo structure, with consistency found between the stellar profiles and dynamics in the context of DM, implying stars trace well the dark matter in dwarf spheroidal galaxies. it is now understood that the equilibrium structure of DM halos slowly relaxes with wave interference in the halo continously scattering stars incorporated as test particles in the latest DM simulations [15, 36]. This may be estimated with a ”quasi particle” approximation on the de Broglie scale and may account for the ”thick disk” of the Milky Way, indicating a light boson of eV[37] that is similar to our estimate above. These dynamically based preferences for a small boson may conflict with indirect limits based of the amplitude of the Lyman- power spectrum, hydrodynamical simulations have not been achieved for a self consistent estimate in the context of DM. In anycase forest modelling does not a significant AGN role in early reionization as argued by [38, 39] and reinforced by detections of double peaked Ly emitters [40, 41, 42] and by wide “gaps” in the forest at [43] that may imply sparsely distributed AGNs[44] significantly boost the forest variance in the power spectrum above standard predictions. We can look forward to direct lensing tests of DM that are are predicted to be sensitive to the pervasive de Broglie scale perturbations within lensing galaxy halos, measurably affecting image magnifications and locations around the Einstein ring[33, 28]. It is also possible that oscillation modes of the soliton, generated by the unceasing wave motion in the halo, may result in a random walk of centrally formed star clusters out to the boundary of the soliton, thereby revealing the soliton radius directly with tidal streams[15, 36].
Acknowledgements.
We thank Justin Schive for useful comments and for providing the simulation profiles.Methods:
Appendix A The Wave Dark Matter Halo
Ultralight bosons, such as Axions, explored in relation dark matter [45, 46] in their simplest version, without self-interaction, the boson mass is the only free parameter, which if sufficiently light means the de-Broglie wavelength exceeds the mean free path set by the density of dark matter, so these bosons can satisfy the ground state condition for a Bose-Einstein condensate described by the coupled Schroedinger-Poisson equation, that in comoving coordinates reads:
| (1) | |||
| (2) |
Here is the wave function, is the gravitation potential and is the cosmological scale factor. The system is normalized to the time scale , and to the scale length , where where is the current density parameter [45].
Recently, it has proved possible with advanced GPU computing to make reliable, high dynamic range cosmological simulations that solve the above equations, [22, 24, 26, 47] that evolve to produce large scale structure indistinguishable from CDM, but with virialized halos characterized by a solitonic core in the ground state that naturally explains the dark matter dominated cores of dwarf spheroidal galaxies [23]. Another, important feature arising from simulations is that the central soliton is surrounded by an extended halo with a “granular” texture on the de-Broglie scale, due to interference of excited states, but which when azimuthally averaged follows closely the Navarro-Frank-White (NFW) density profile [48, 49, 22, 23].
The fitting formula for the density profile of the solitonic core in a DM halo is obtained from cosmological simulations [22, 23]:
| (3) |
where the values of the constants are: , , ; is the boson mass and is the solitonic core radius. The latter scales with the product of the galaxy mass and boson mass, obeying the following the scaling relation which has been derived from our simulations [23]:
| (4) |
Where . Beyond the soliton, at radii larger than a transition scale (), the simulations also reveal the halo is approximately NFW in form, presumably reflecting the non-relativistic nature of condensates beyond the de Broglie scale, and therefore the total density profile can be written as:
| (5) |
and:
In detail, the scale radius of the solitonic solution, which represents the ground state of the Schrodinger-Poisson equation, is related to size to the halo through the uncertainty principle. From cosmological simulations, the latter is found to hold non-locally, relating a local property with a global one (for more details we refer to [23]).
Appendix B Dynamical Model of Galaxies in Wave Dark Matter Halo
The classical dwarf galaxies are known to be dominated by DM, and so the stars are treated as tracer particles [9, 13, 14, 50] moving in the gravitational potential generated by DM halo density distribution.
In this context, the corresponding velocity dispersion profile can be predicted by solving the spherically symmetric Jeans equation:
| (6) |
where is the mass DM halo obtained by integrating the spherically symmetric density profile in Eq. (5), is the anisotropy parameter (see Binney & Tremaine 2008[51], Equation (4.61)), and is the stellar density distribution defined by the solitons wave dark matter imprint:
| (7) |
where
| (8) |
Here, is the 3D scale radius of the stellar halo corresponding to the central stellar density, is the normalization of at the transition radius and the transition radius, , is the point where the soliton structure ends and the halo begins at the juncture of the core and halo profiles.
Finally, the predicted velocity dispersion profile can be projected along the line of sight to compared with the observations, as presented in Figure 4:
| (9) |
where
| (10) |
Appendix C Data Analysis and Results
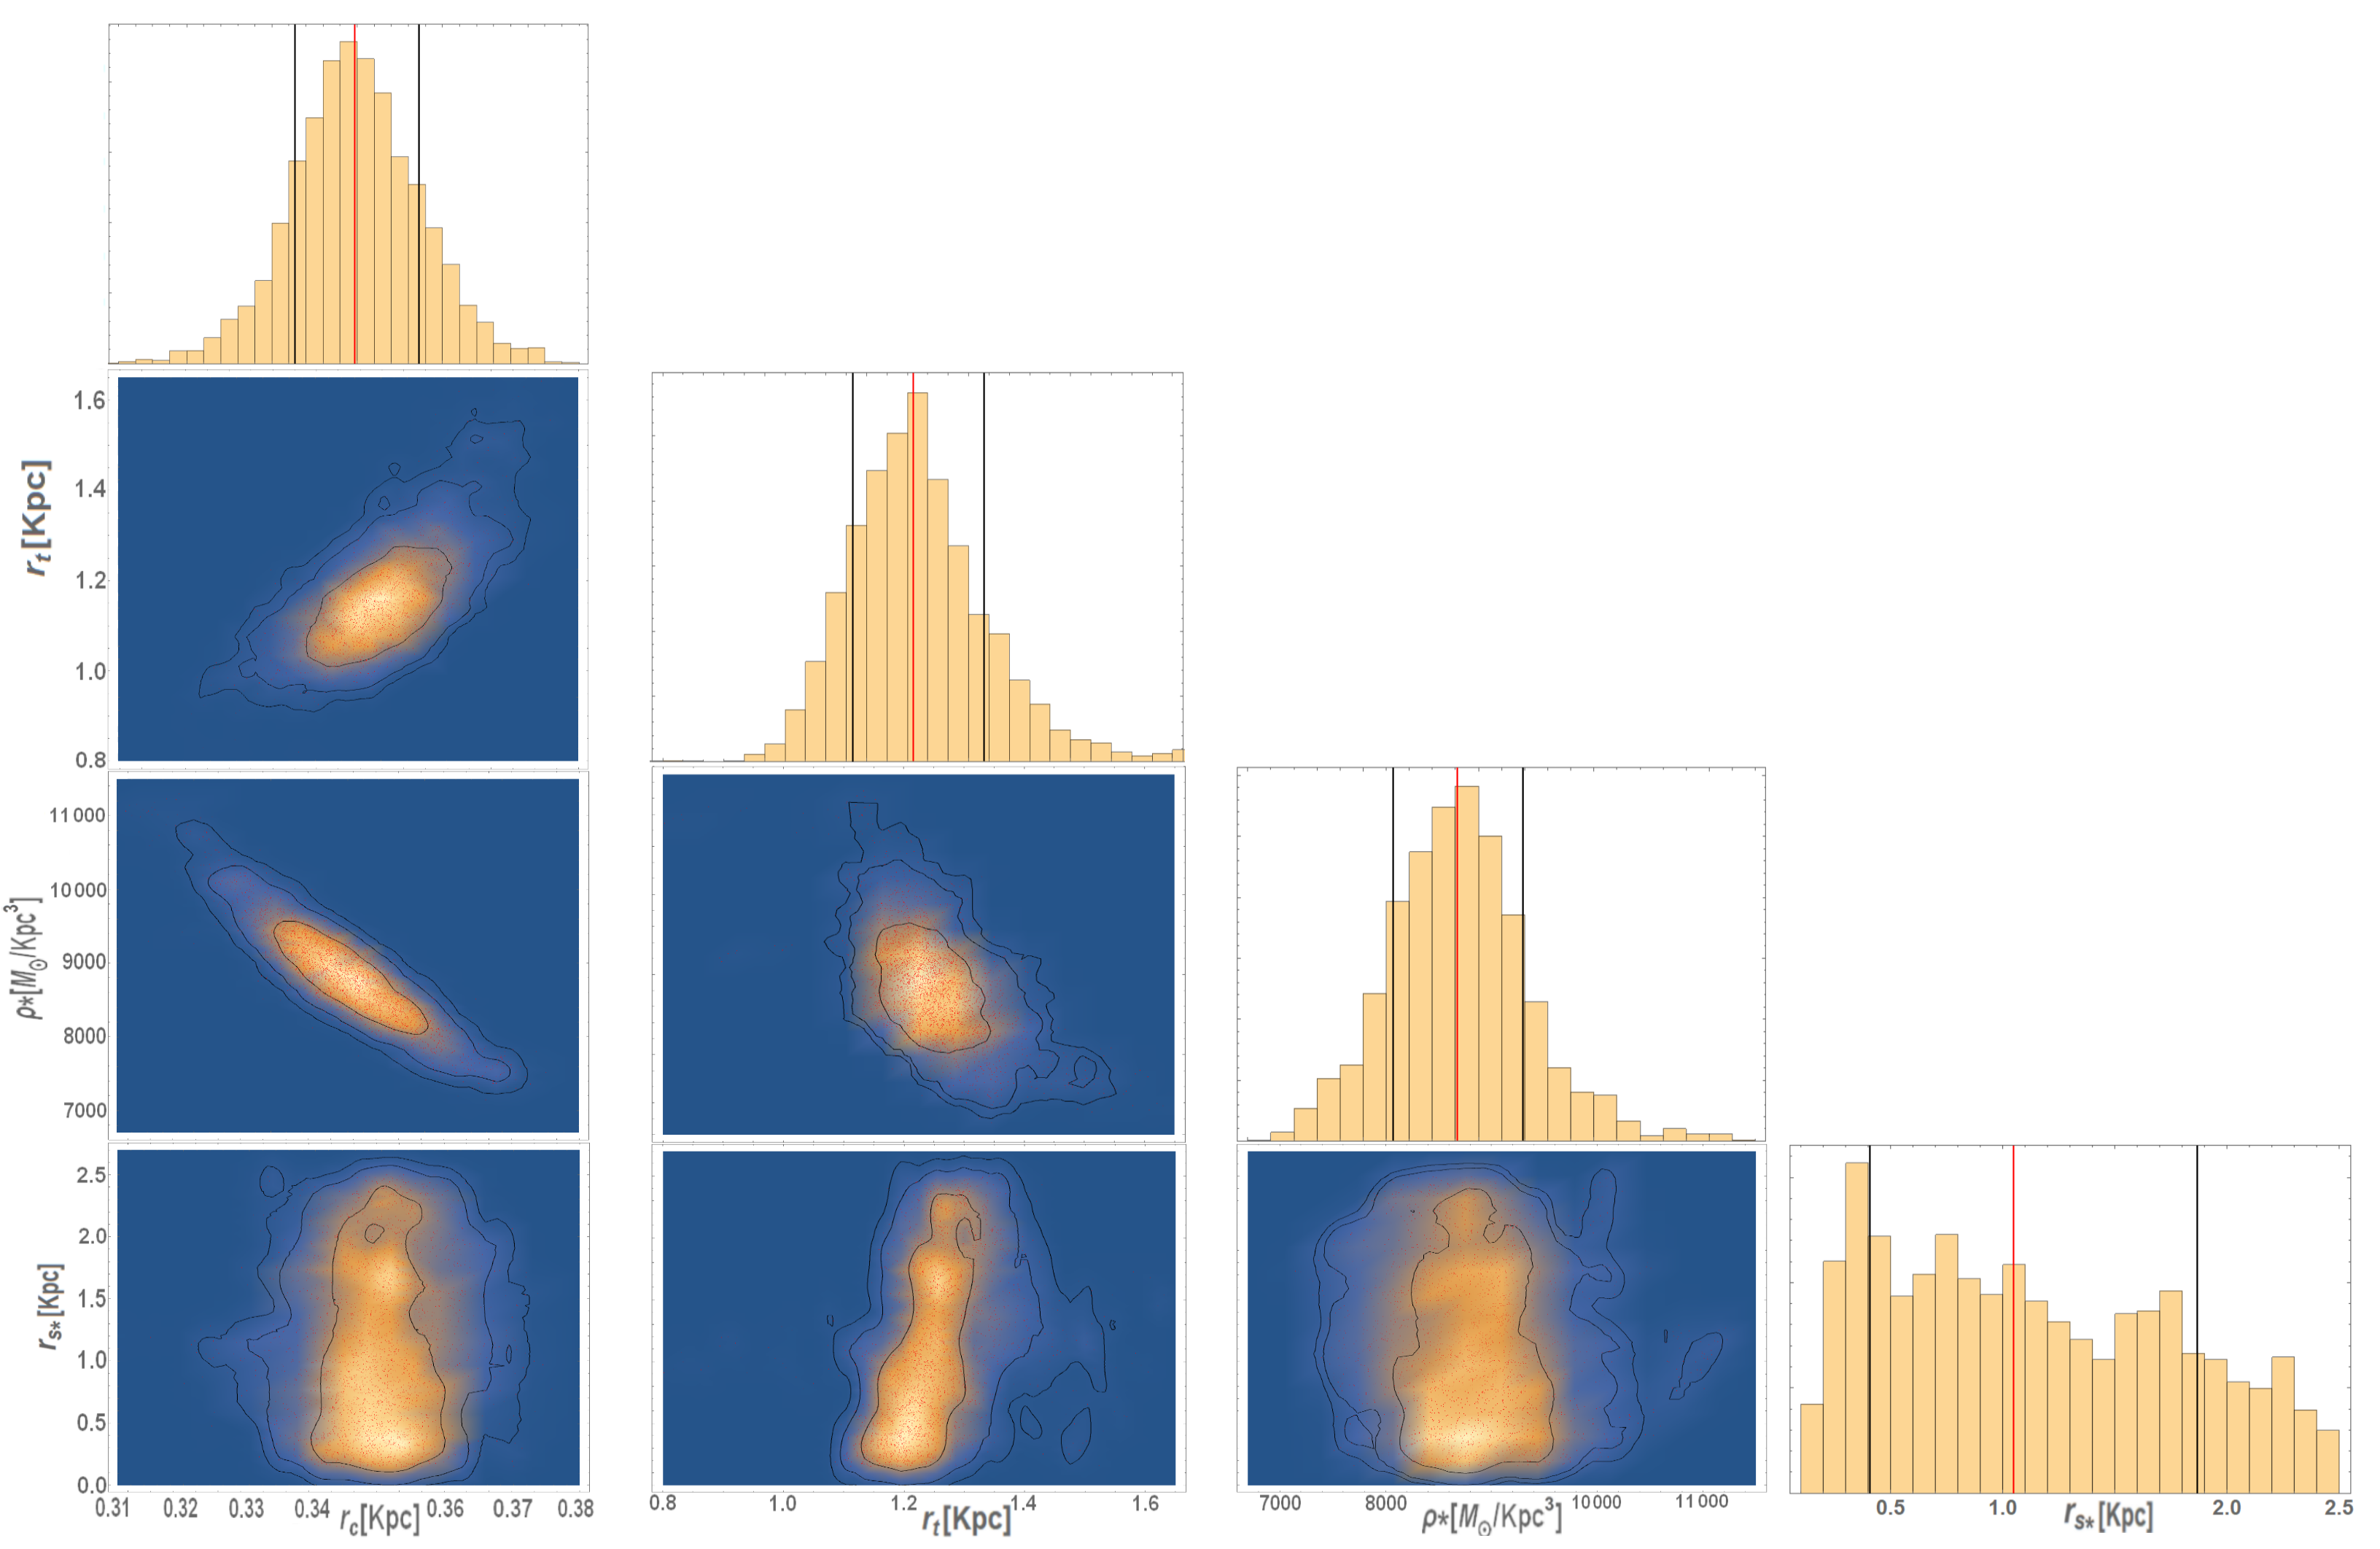
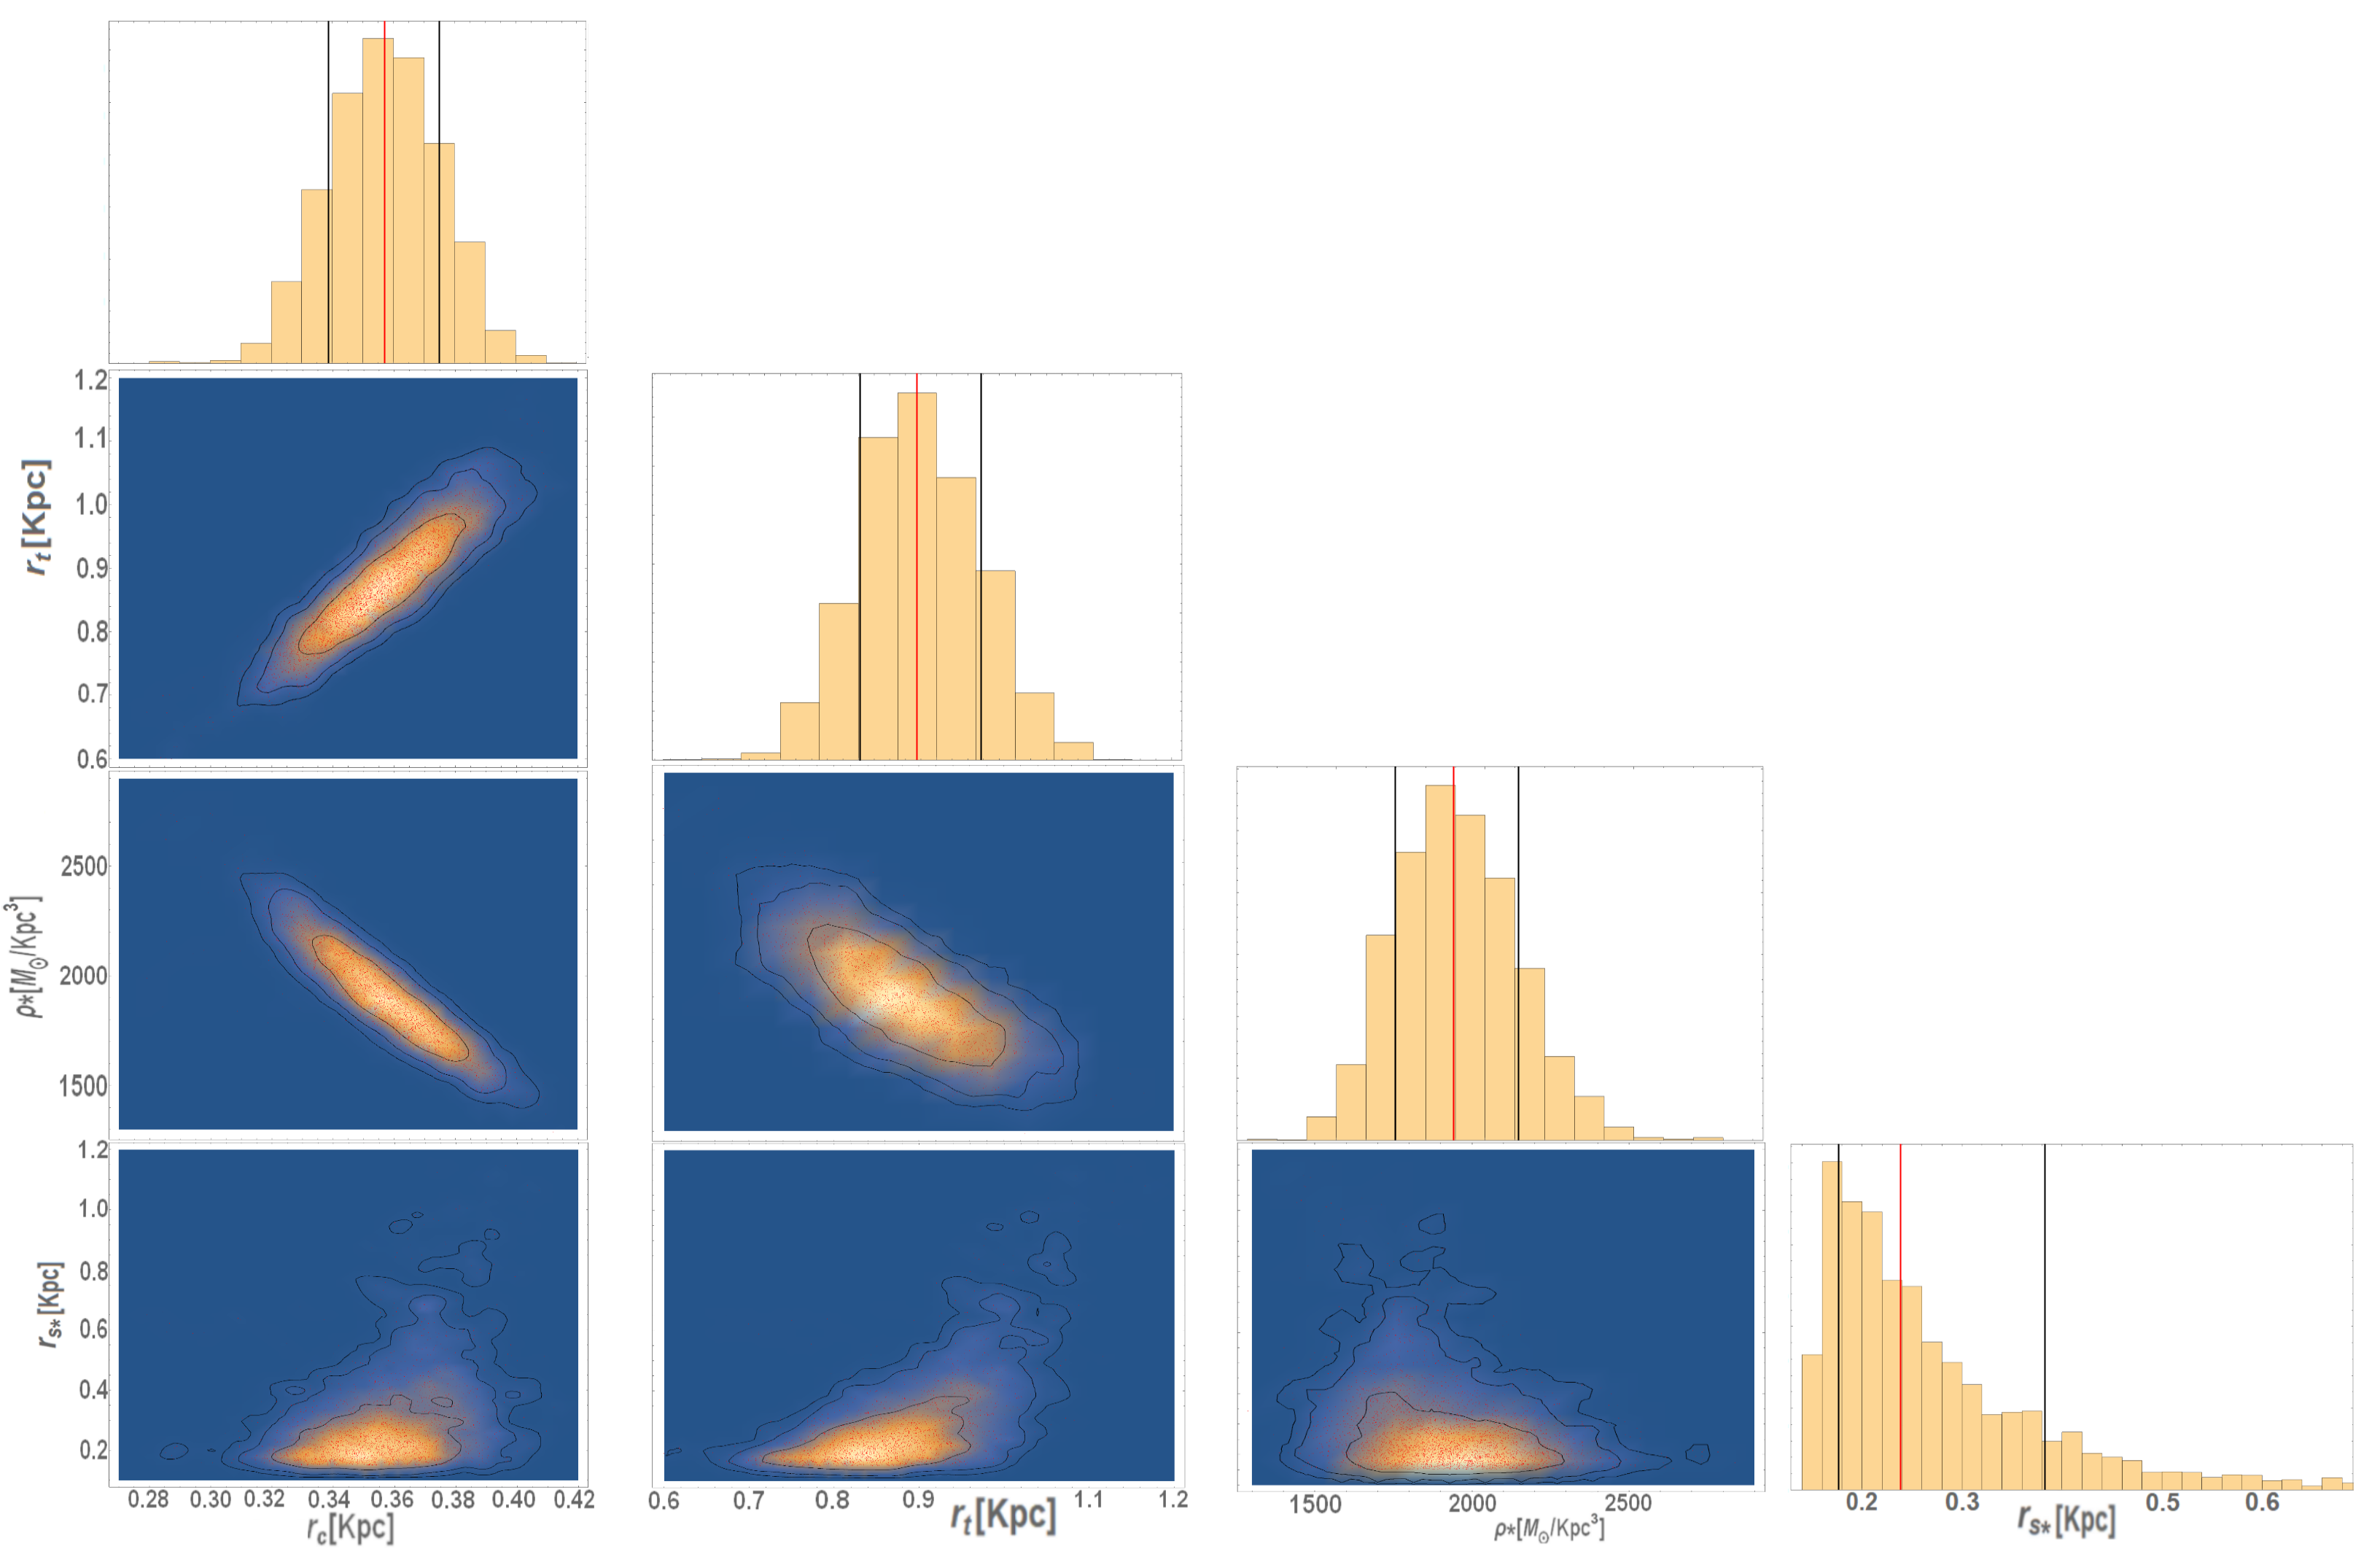
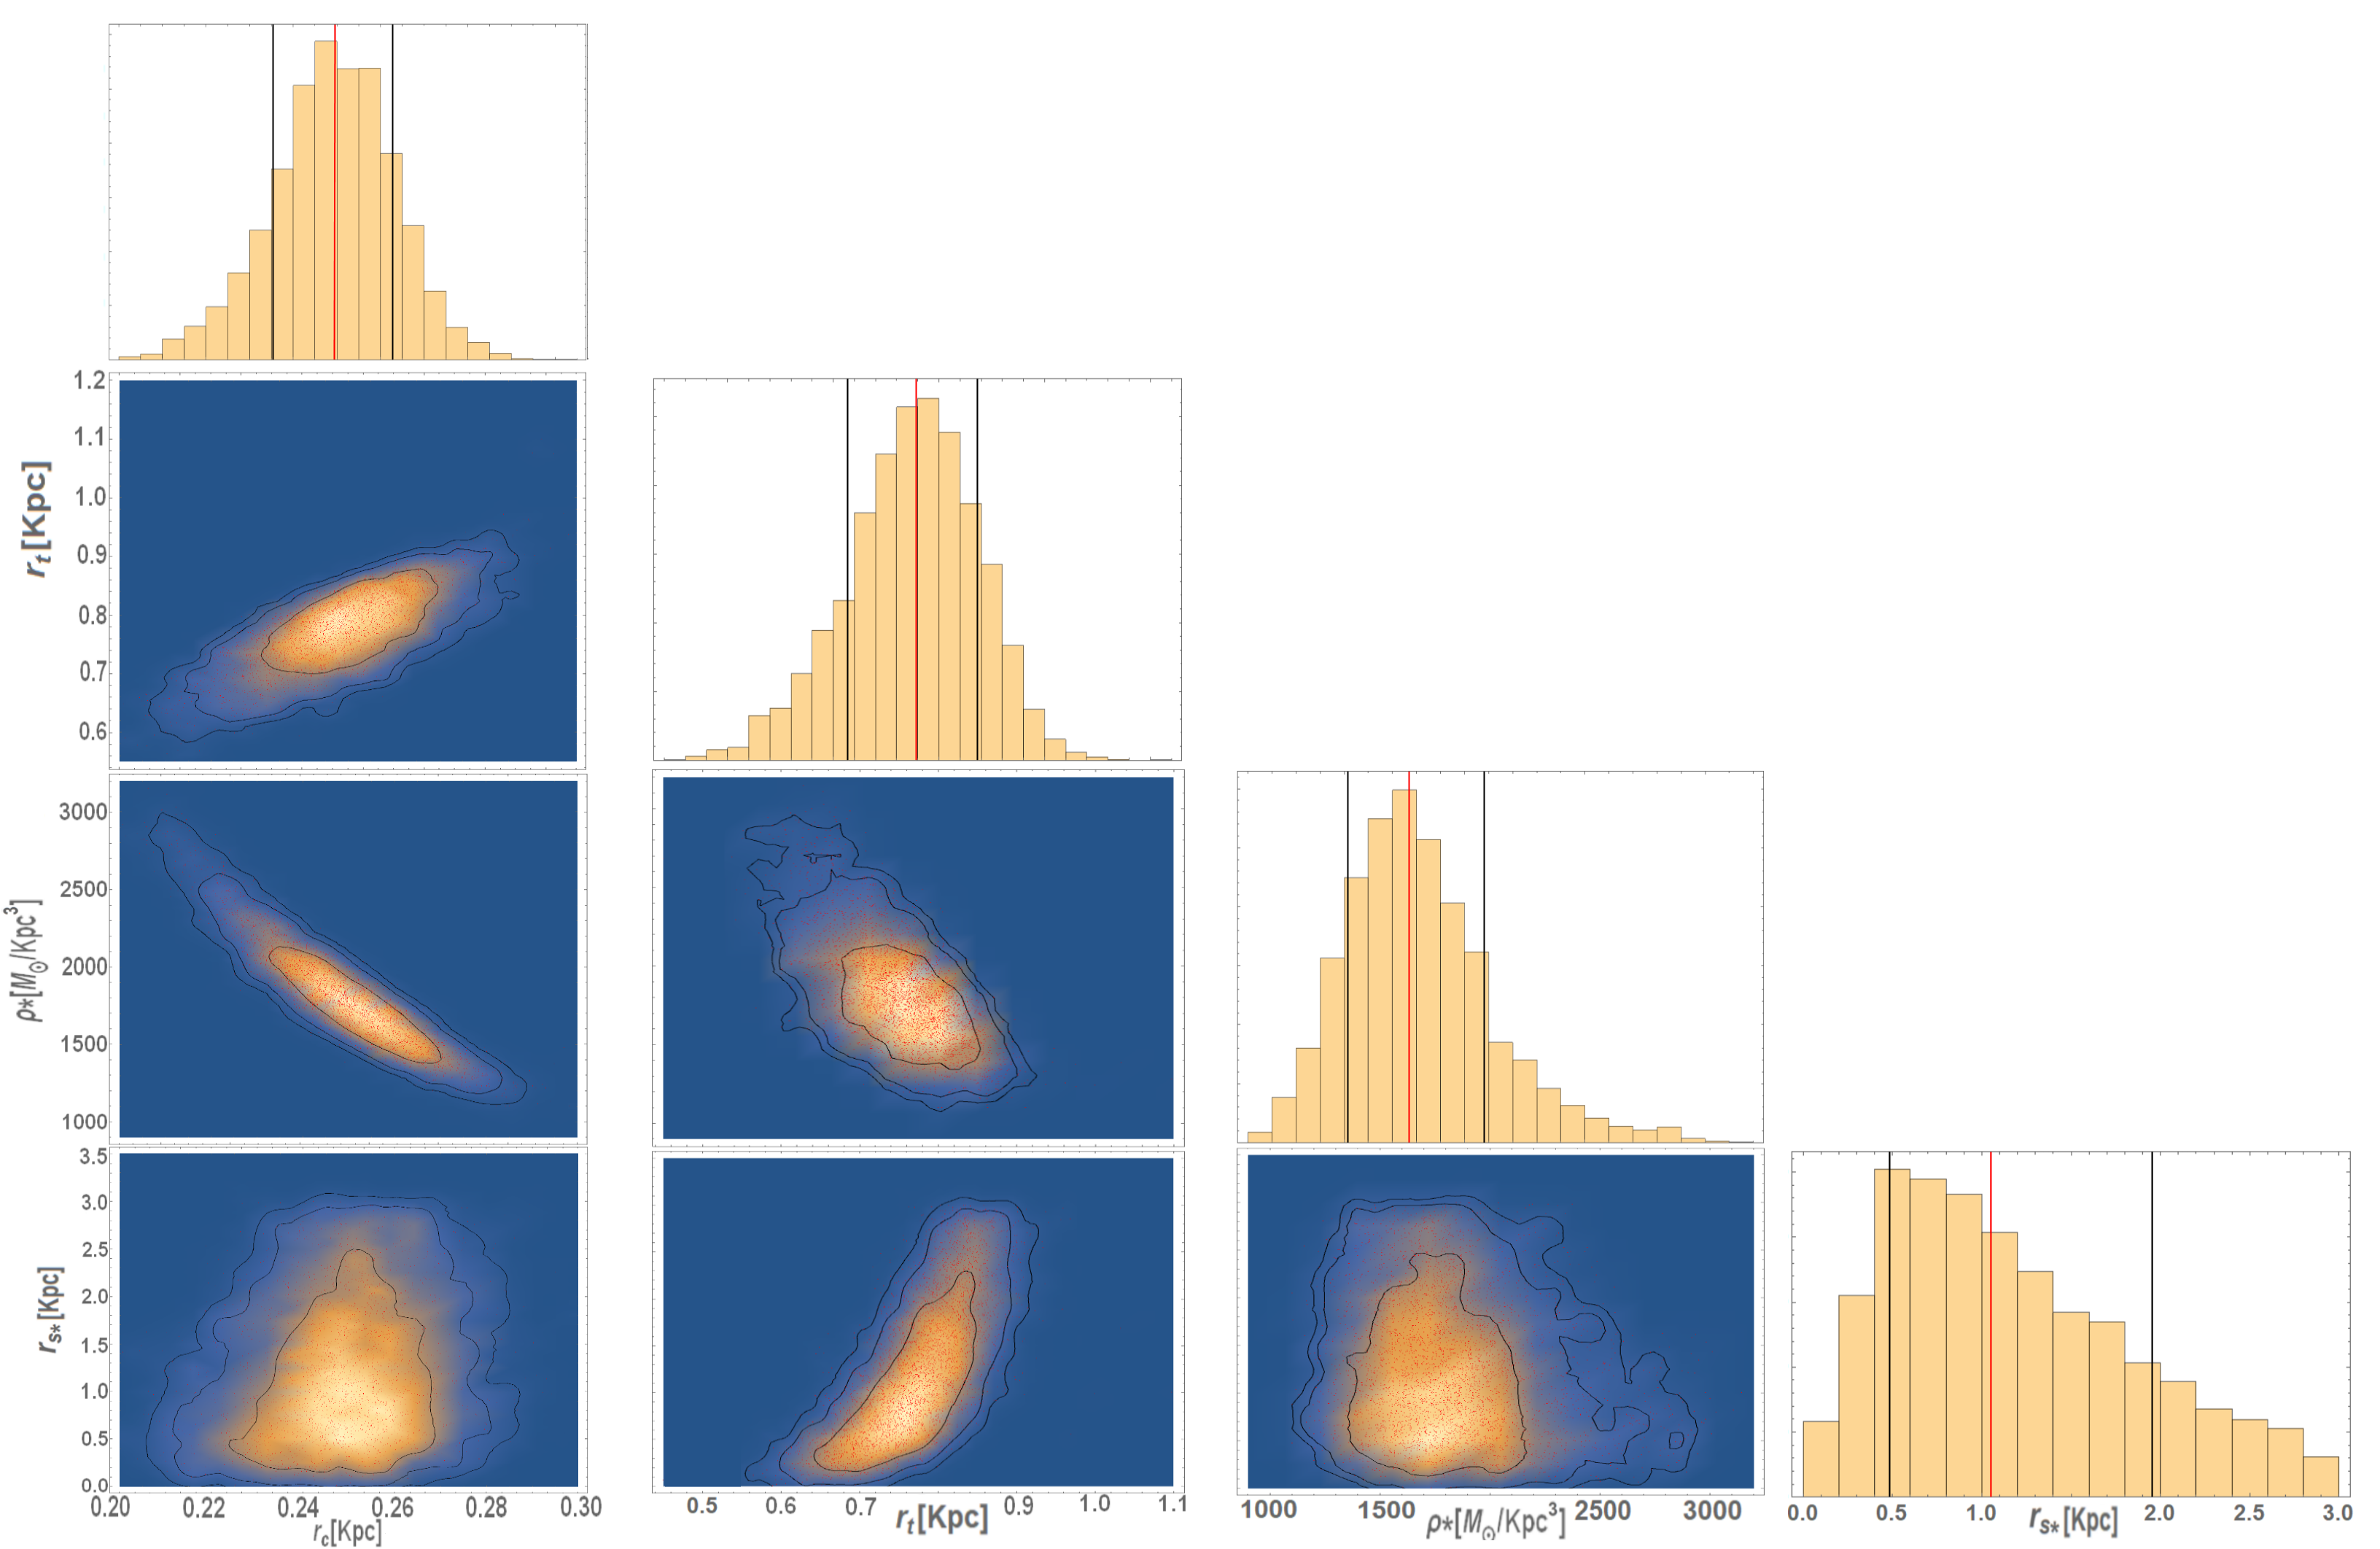
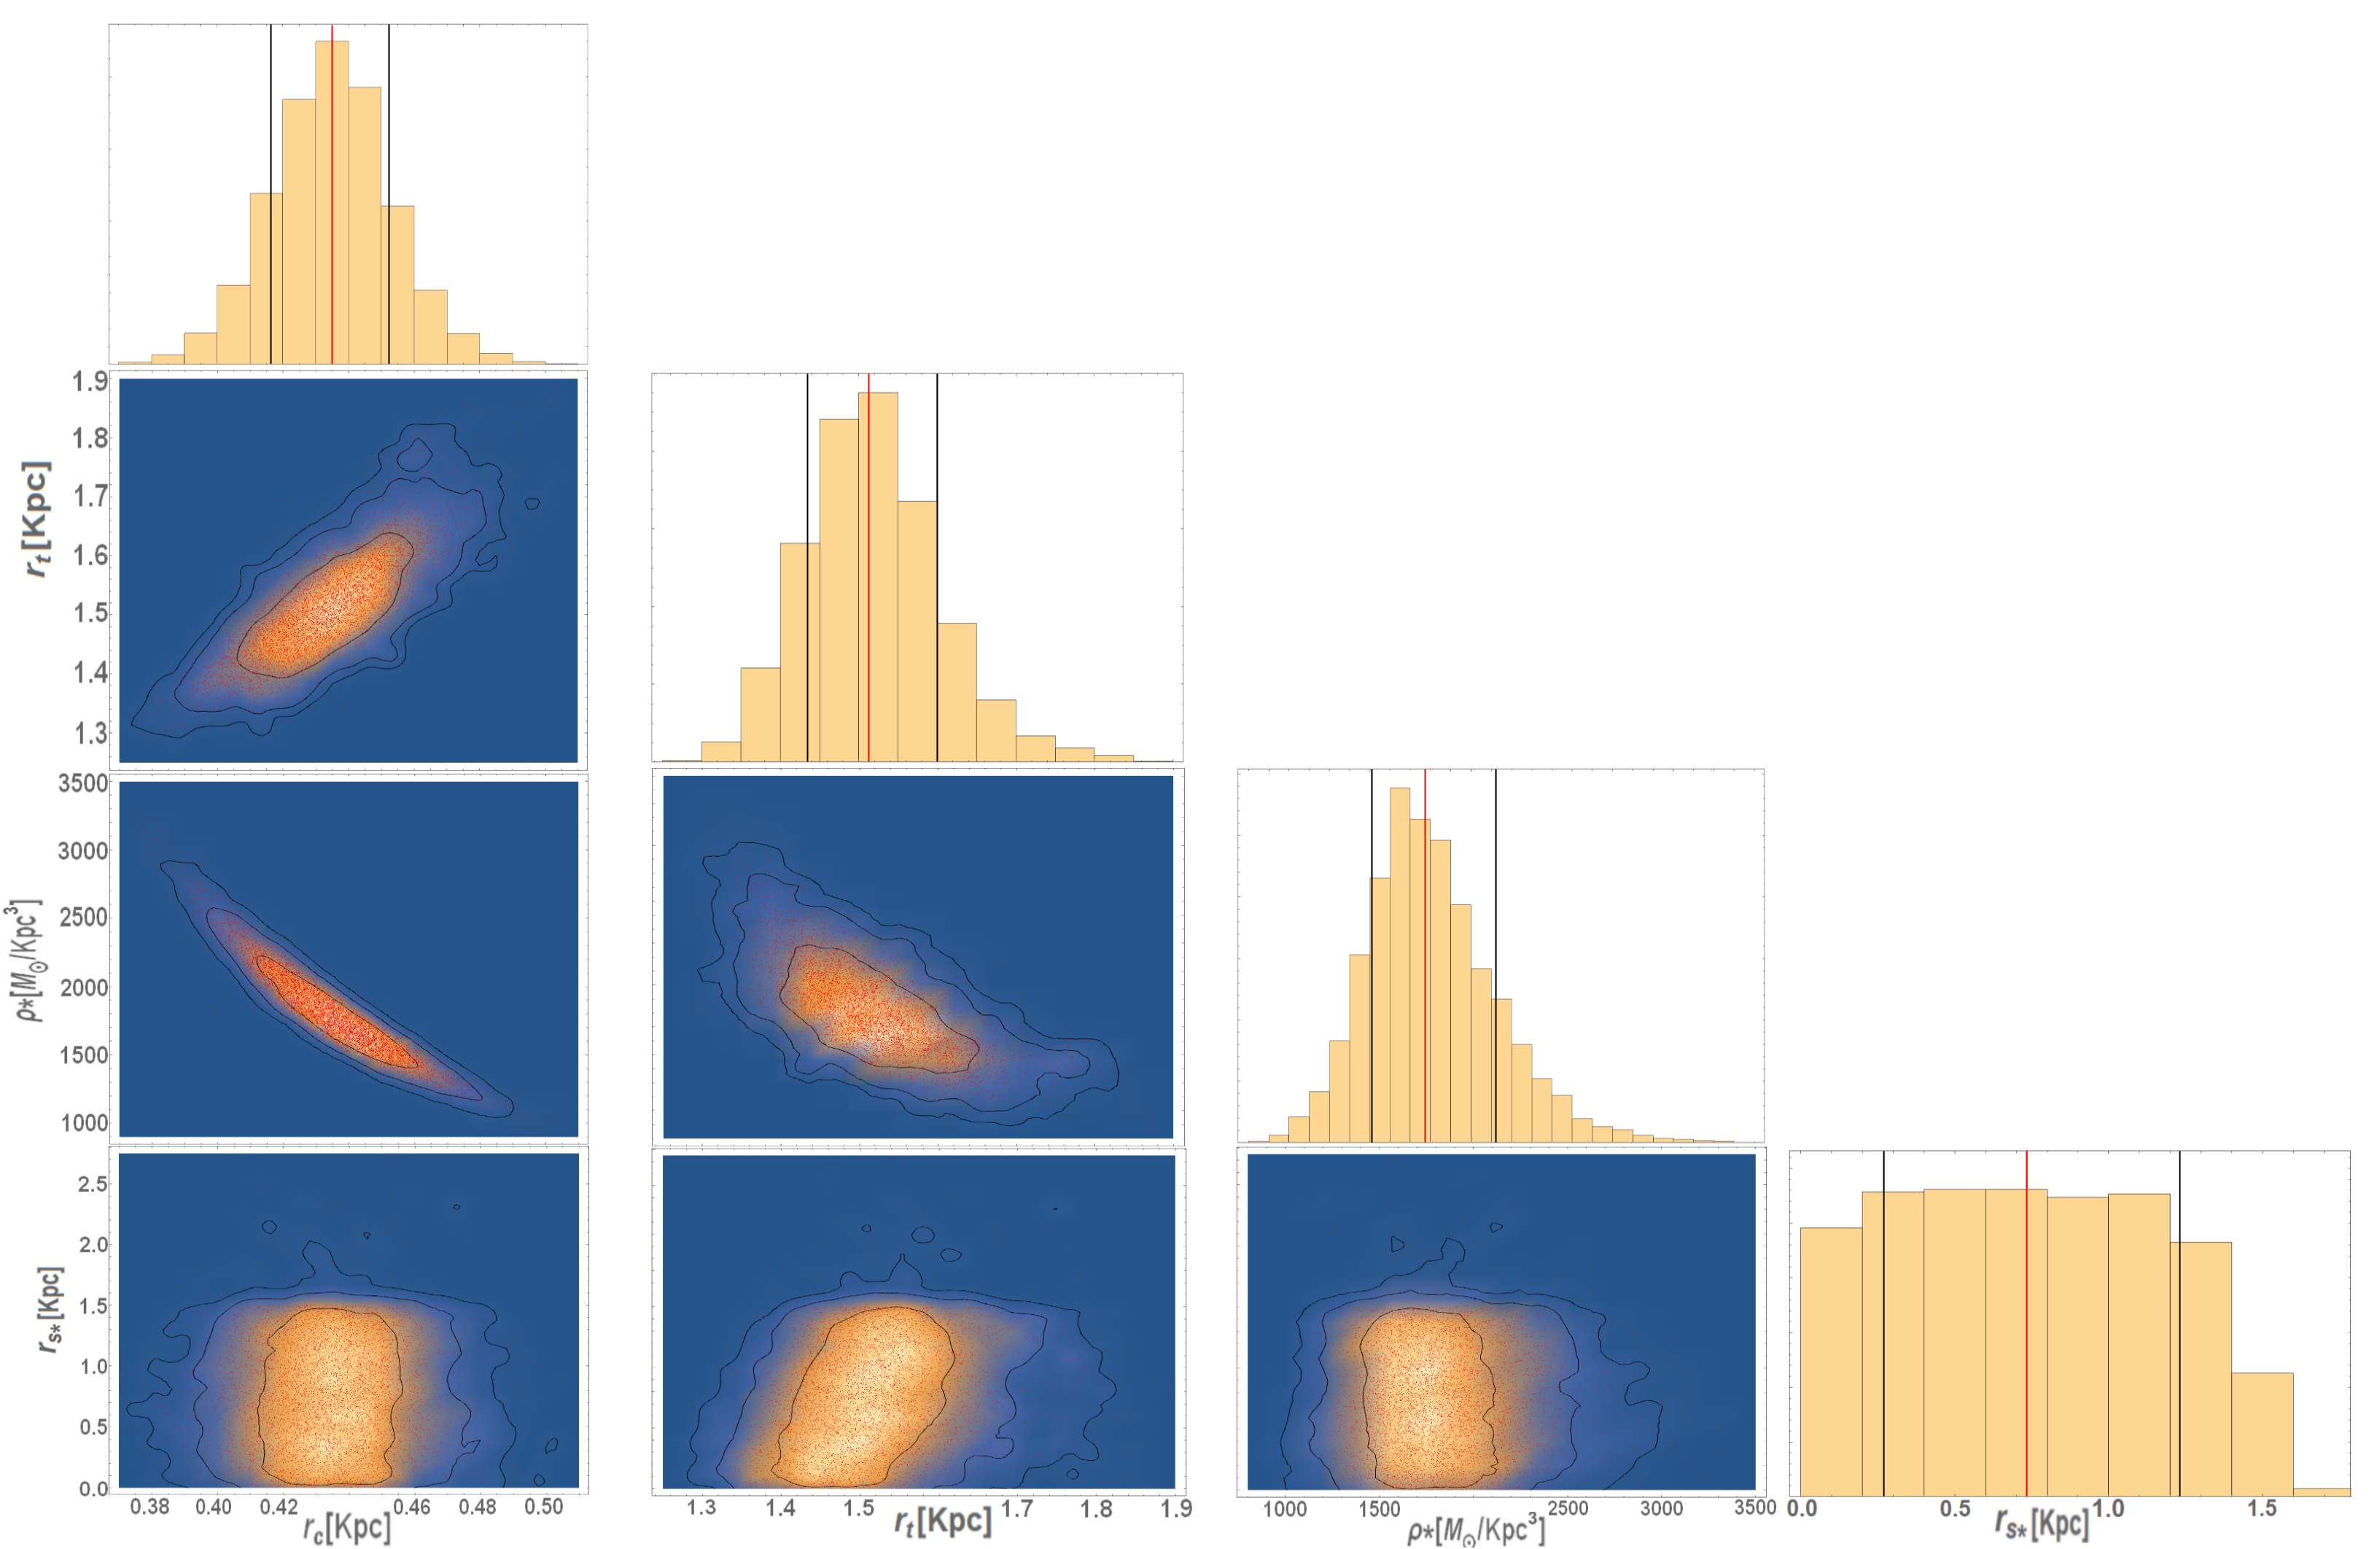
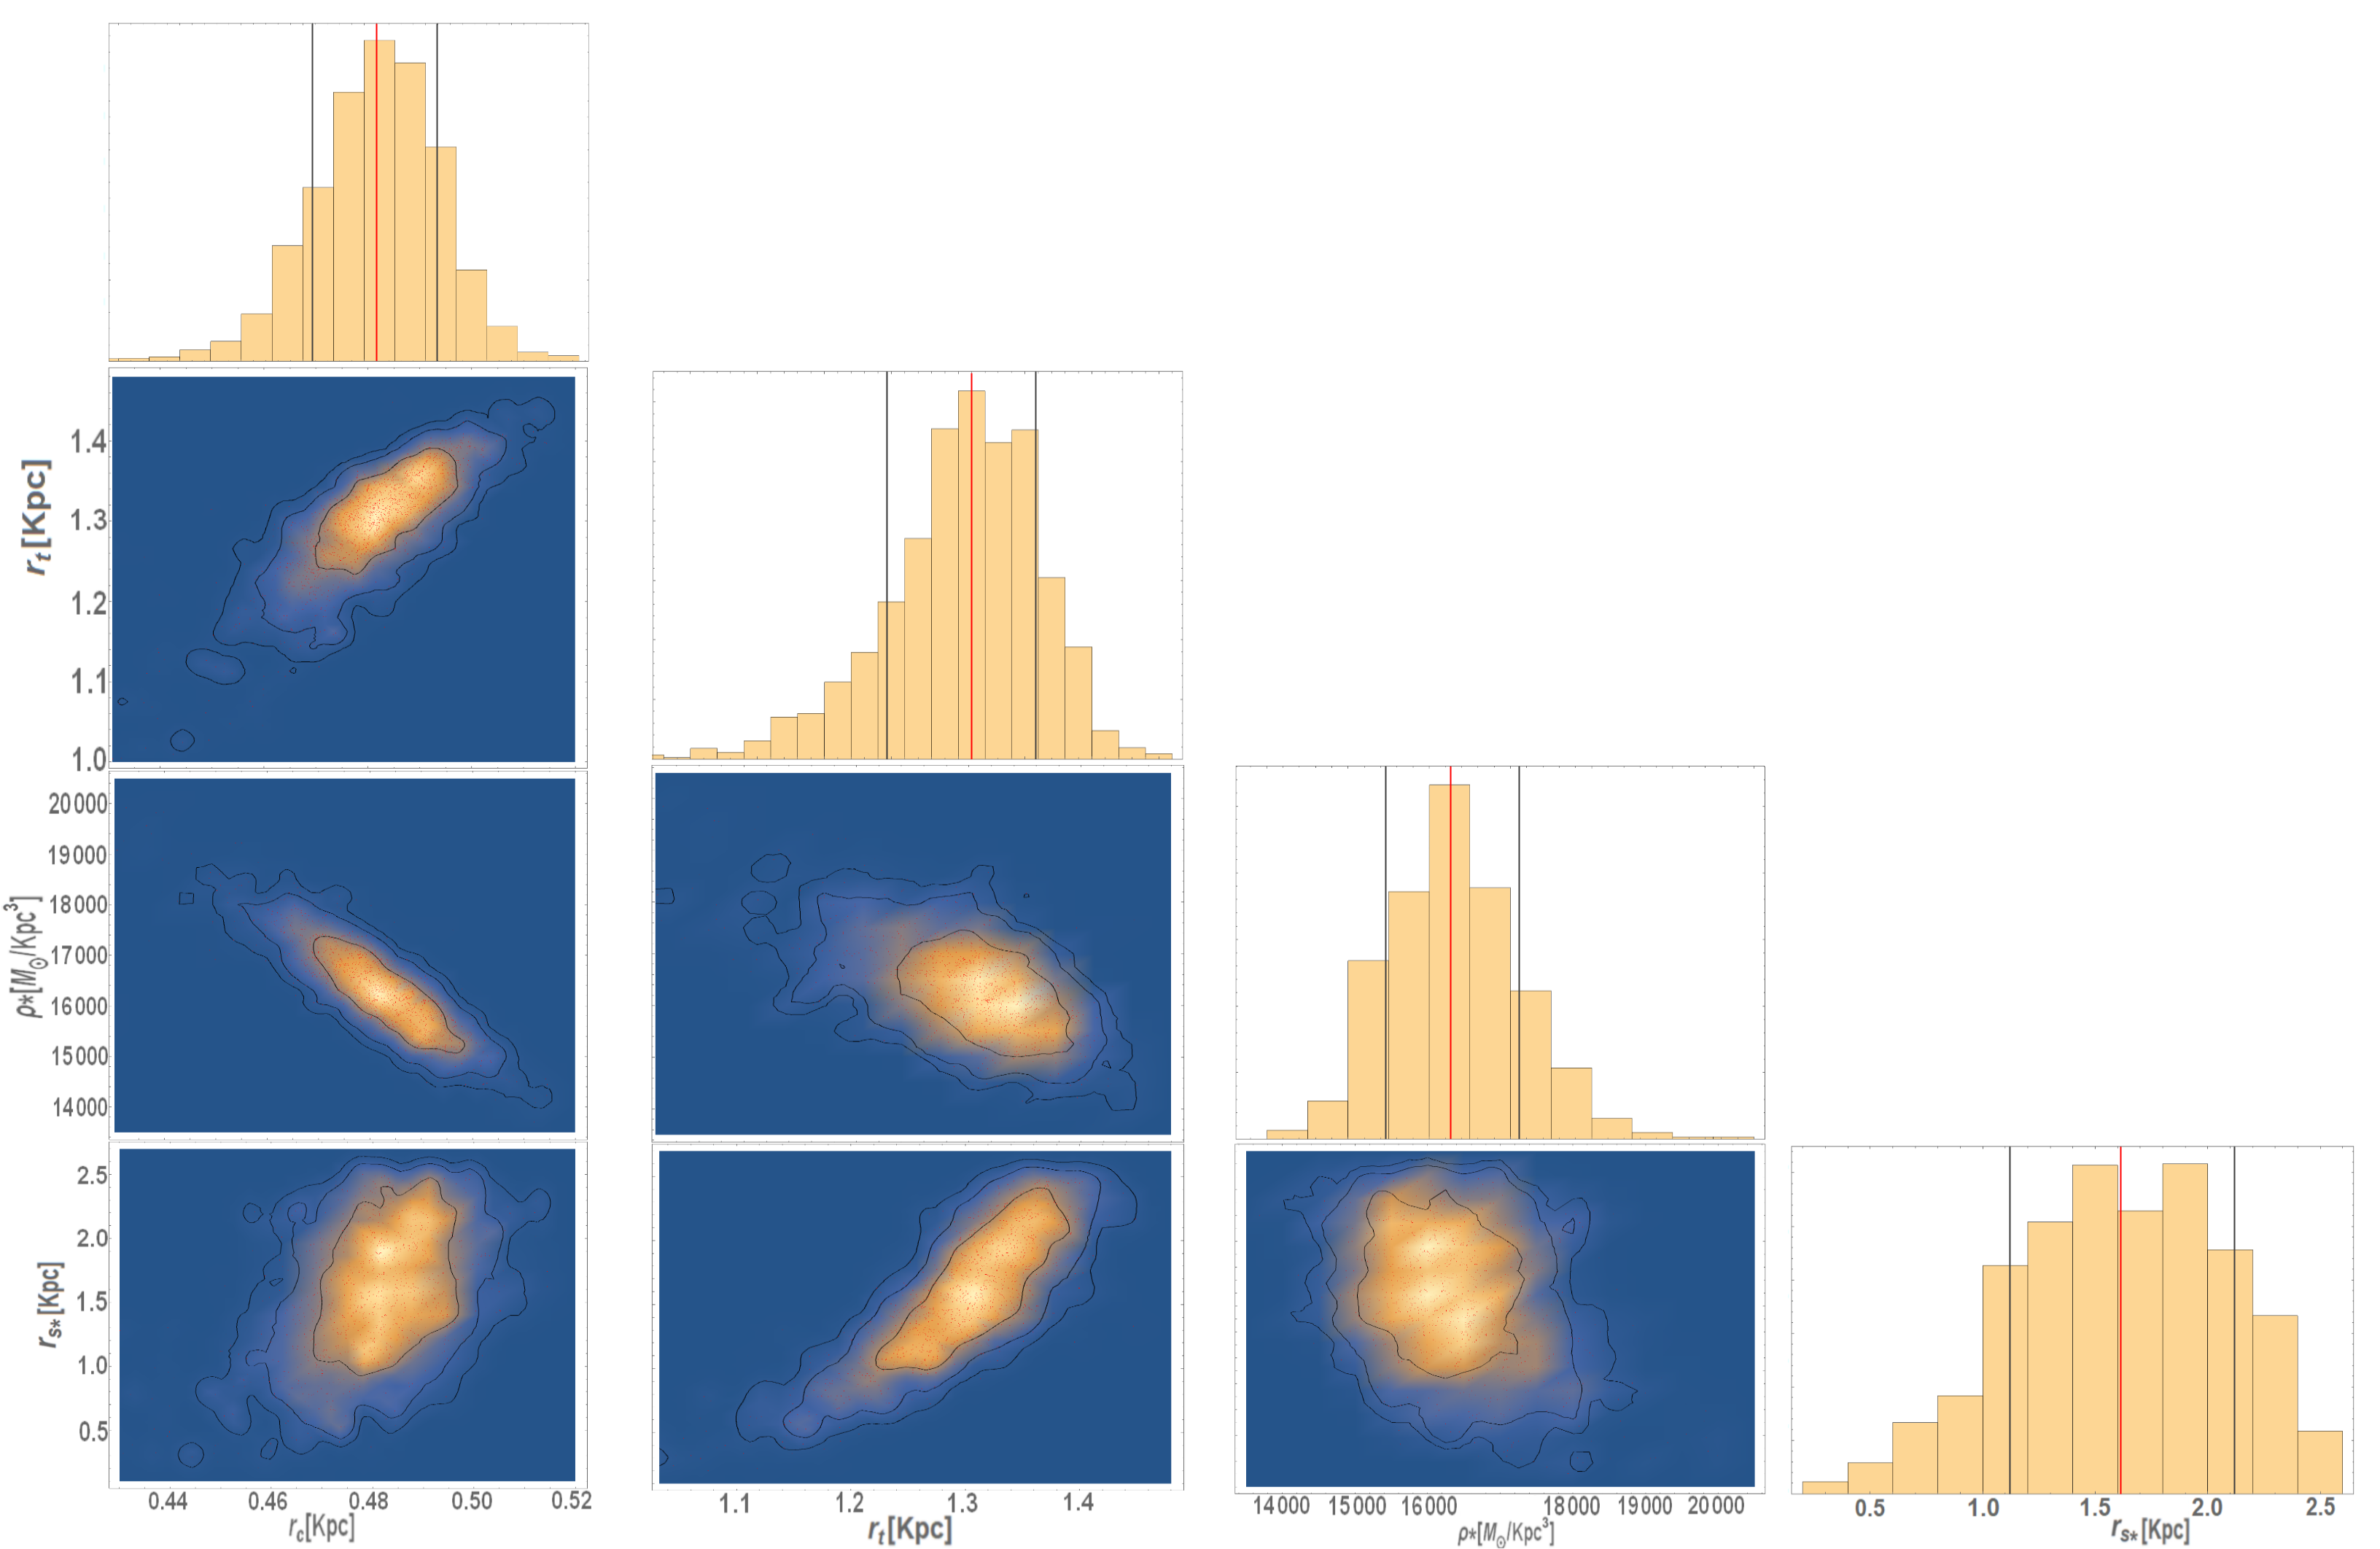
We have explored the full range of relevant parameter space with the Monte Carlo Markov Chain (MCMC) technique based on the Metropolis-Hastings sampling algorithm, to obtain the core radius that characterises fully the soliton profile, , and the scale radius and the normalization of the stellar density profile, and , and the also the transition radius between the core and halo profiles. We allow for an adaptive step size in order to reach an acceptance rate between 20% and 50%, and we ensure the convergence relying on the Gelman-Rubin criteria. Once the convergence criteria are satisfied the chains are combined to compute the total likelihood, together with the 1D marginalized likelihood distribution with the corresponding the expectation value and variance. The results are shown in Table 1 for the above free parameters and their uncertainties. We also show the covariances between the free parameters in Figures 6-10 for the isolated galaxies and for sextans, as the profiles of these galaxies may be regarded as unaffected by tidal interaction, as described in the text, reflecting intrinsic properties
in the context of DM. We set Gaussian priors for all the galaxies MCMC calculations, with the following normal distribution for the two main parameters: and to span a wide range of DM simulation expectations [22, 30]. All the calculations have been done with a boson mass of eV.
| Galaxy | Gap(Log) | Distance | Pericenter | Ref | ||||
| (kpc) | (kpc) | (kpc) | (kpc) | (kpc) | (km/s) | - | ||
| Aquarius | 1.78 | 1071 | - | - | - | |||
| Cetus | 1.34 | 775 | - | - | - | |||
| Tucana | 1.5 | 887 | - | [9] | ||||
| Leo A | 1.76 | 800 | - | - | - | |||
| Sextans | 1.82 | 90 | [52] | |||||
| Phoenix | 3.44 | 415 | [53] | |||||
| Leo I | 3.43 | 250 | [54] | |||||
| Draco | 2.32 | 80 | [55] | |||||
| Carina | 2.26 | 101 | - | - | ||||
| Sculptor | 2.18 | 80 | [56] | |||||
| Ursa Minor | 2.14 | 66 | [56] | |||||
| Leo II | 2.45 | 210 | [56] |
References
- Chiti et al. [2021] A. Chiti, A. Frebel, J. D. Simon, D. Erkal, L. J. Chang, L. Necib, A. P. Ji, H. Jerjen, D. Kim, and J. E. Norris, An extended halo around an ancient dwarf galaxy., Nat. Astro. https://doi.org/10.1038/s41550-020-01285-w (2021).
- Collins et al. [2021] M. L. M. Collins, J. I. Read, R. A. Ibata, R. M. Rich, N. F. Martin, J. Peñarrubia, S. C. Chapman, E. J. Tollerud, and D. R. Weisz, Andromeda xxi – a dwarf galaxy in a low density dark matter halo, ArXiv https://arxiv.org/pdf/2102.11890.pdf (2021).
- Torrealba et al. [2016] G. Torrealba, S. E. Koposov, V. Belokurov, and M. Irwin, The feeble giant. discovery of a large and diffuse milky way dwarf galaxy in the constellation of crater, Mon. Not. R. Astron. Soc. 459, 2370 (2016).
- Torrealba et al. [2019] G. Torrealba, V. Belokurov, S. E. Koposov, T. S. Li, M. G. Walker, J. L. Sanders, A. Geringer-Sameth, D. B. Zucker, K. Kuehn, N. W. Evans, and W. Dehnen, The hidden giant: discovery of an enormous galactic dwarf satellite in gaia dr2., Mon. Not. R. Astron. Soc. 488, 2743 (2019).
- Wilkinson et al. [2004] M. I. Wilkinson, J. T. Kleyna, N. W. Evans, G. F. Gilmore, M. J. Irwin, and E. K. Grebel, Kinematically cold populations at large radii in the draco and ursa minor dwarf spheroidal galaxies., Astrophys. J. 611, L21 (2004).
- Fabrizio et al. [2016] M. Fabrizio, G. Bono, M. Nonino, E. L. Łokas, I. Ferraro, G. Iannicola, R. Buonanno, S. Cassisi, G. Coppola, M. Dall’Ora, R. Gilmozzi, M. Marconi, M. Monelli, M. Romaniello, P. B. Stetson, F. Thévenin, and A. R. Walker, The carina project. x. on the kinematics of old and intermediate-age stellar populations1,2., Astrophys. J. 830, 17 (2016).
- Li et al. [2018] T. S. Li et al., The first tidally disrupted ultra-faint dwarf galaxy?: A spectroscopic analysis of the tucana iii stream., Astrophys. J. 866, 23 (2018).
- Newby et al. [2013] M. Newby, N. Cole, H. J. Newberg, T. Desell, M. Magdon-Ismail, B. Szymanski, C. Varela, B. Willett, and B. Yanny, A spatial characterization of the sagittarius dwarf galaxy tidal tails., Astronomical. J. 145, 19 (2013).
- Gregory et al. [2019] A. L. Gregory, M. L. M. Collins, J. I. Read, M. J. Irwin, R. A. Ibata, N. F. Martin, A. W. McConnachie, and D. R. Weisz, Kinematics of the tucana dwarf galaxy: an unusually dense dwarf in the local group., Mon. Not. R. Astron. Soc. 485, 2010 (2019).
- Fraternali et al. [2009] F. Fraternali, E. Tolstoy, M. J. Irwin, and A. A. Cole, Life at the periphery of the local group: the kinematics of the tucana dwarf galaxy., Astron. Astrophys. 499, 121 (2009).
- Taibi et al. [2018] S. Taibi, G. Battaglia, N. Kacharov, M. Rejkuba, M. Irwin, R. Leaman, M. Zoccali, E. Tolstoy, and P. Jablonka, Stellar chemo-kinematics of the cetus dwarf spheroidal galaxy., Astron. Astrophys. 618, 22 (2018).
- Kirby et al. [2017] E. N. Kirby, L. Rizzi, E. V. Held, J. G. Cohen, A. A. Cole, E. M. Manning, E. D. Skillman, and D. R. Weisz, A chemistry and kinematics of the late-forming dwarf irregular galaxies leo a, aquarius, and sagittarius dig, Astrophys. J. 834, 19 (2017).
- McConnachie and Irwin [2006] A. W. McConnachie and M. J. Irwin, Structural properties of the m31 dwarf spheroidal galaxies., Mon. Not. R. Astron. Soc. 365, 1263 (2006).
- McConnachie et al. [2006] A. W. McConnachie, N. Arimoto, M. Irwin, and E. Tolstoy, The stellar content of the isolated transition dwarf galaxy ddo210., Mon. Not. R. Astron. Soc. 373, 715 (2006).
- Schive et al. [2020] H.-Y. Schive, T. Chiueh, and T. Broadhurst, Soliton random walk and the cluster-stripping problem in ultralight dark matter., Phys. Rev. Lett. 124, https://doi.org/10.1103/PhysRevLett.124.201301 (2020).
- Irwin and Hatzidimitriou [1995] M. Irwin and D. Hatzidimitriou, Structural parameters for the galactic dwarf spheroidals., Mon. Not. R. Astron. Soc. 277, 1354 (1995).
- Sohn et al. [2007] S. T. Sohn, S. R. Majewski, R. R. Muñoz, W. E. Kunkel, K. V. Johnston, J. C. Ostheimer, P. Guhathakurta, R. J. Patterson, M. H. Siegel, and M. C. Cooper, Exploring halo substructure with giant stars. x. extended dark matter or tidal disruption?: The case for the leo i dwarf spheroidal galaxy., Astrophys. J. 663, 960 (2007).
- Martínez-Delgado et al. [2001] D. Martínez-Delgado, J. Alonso-García, A. Aparicio, and M. A. Gómez-Flechoso, A tidal extension in the ursa minor dwarf spheroidal galaxy., Astrophys. J. 549, L63 (2001).
- Walker and Peñarrubia [2011] M. G. Walker and J. Peñarrubia, A method for measuring (slopes of) the mass profiles of dwarf spheroidal galaxies., Astrophys. J. 742, 19 (2011).
- Amorisco and Evans [2012] N. C. Amorisco and N. W. Evans, Dark matter cores and cusps: the case of multiple stellar populations in dwarf spheroidals., Mon. Not. R. Astron. Soc. 419, 184 (2012).
- Battaglia et al. [2012a] G. Battaglia, M. Rejkuba, E. Tolstoy, M. J. Irwin, and G. A. Beccari, The extensive age gradient of the carina dwarf galaxy., Astrophys. J. 761, 6 (2012a).
- Schive et al. [2014a] H.-Y. Schive, T. Chiueh, and T. Broadhurst, Cosmic structure as the quantum interference of a coherent dark wave., Nature Phys 10, 496 (2014a).
- Schive et al. [2014b] H.-Y. Schive, M.-H. Liao, T.-P. Woo, S.-K. Wong, T. Chiueh, T. Broadhurst, and W. Y. P. Hwang, Understanding the core-halo relation of quantum wave dark matter from 3d simulations., Phys. Rev. Lett. 113, https://doi.org/10.1103/PhysRevLett.113.261302 (2014b).
- Schwabe et al. [2016] B. Schwabe, J. C. Niemeyer, and J. F. Engels, Simulations of solitonic core mergers in ultralight axion dark matter cosmologies., Phys. Rev. D. 94, https://doi.org/ 10.1103/PhysRevD.94.043513 (2016).
- Niemeyer [2020] J. C. Niemeyer, Small-scale structure of fuzzy and axion-like dark matter., P. in Particle & Nuclear Phys. 113, https://doi.org/10.1016/j.ppnp.2020.103787 (2020).
- Mocz et al. [2017] P. Mocz, M. Vogelsberger, V. H. Robles, J. Zavala, M. Boylan-Kolchin, A. Fialkov, and L. Hernquist, Galaxy formation with becdm - i. turbulence and relaxation of idealized haloes., Mon. Not. R. Astron. Soc. 471, 4559 (2017).
- Veltmaat et al. [2020] J. Veltmaat, B. Schwabe, and J. C. Niemeyer, Baryon-driven growth of solitonic cores in fuzzy dark matter halos., Phys. Rev. Lett. 101, https://doi.org/ 10.1103/PhysRevD.101.083518 (2020).
- Hui et al. [2021] L. Hui, A. Joyce, and X. Landry, M. J.and Li, Vortices and waves in light dark matter, Journal of Cosmology and Astroparticle Physics 011.
- Chen et al. [2017] S.-R. Chen, H.-Y. Schive, and T. Chiueh, Jeans analysis for dwarf spheroidal galaxies in wave dark matter., Mon. Not. R. Astron. Soc. 468, 1338 (2017).
- Schive et al. [2016] H.-Y. Schive, T. Chiueh, T. Broadhurst, and K.-W. Huang, Contrasting galaxy formation from quantum wave dark matter., Astrophys. J. 818, 14 (2016).
- Roderick et al. [2016] T. A. Roderick, H. Jerjen, G. S. Da Costa, and A. D. Mackey, Structural analysis of the sextans dwarf spheroidal galaxy., Mon. Not. R. Astron. Soc. 460, 30 (2016).
- Okamoto et al. [2017] S. Okamoto, N. Arimoto, E. Tolstoy, P. Jablonka, M. J. Irwin, Y. Komiyama, Y. Yamada, and M. Onodera, Population gradient in the sextans dsph: comprehensive mapping of a dwarf galaxy by suprime-cam., Mon. Not. R. Astron. Soc. 467, 208 (2017).
- Chan et al. [2020] J. H. H. Chan, H.-Y. Schive, S.-K. Wong, T. Chiueh, and T. Broadhurst, Multiple images and flux ratio anomaly of fuzzy gravitational lenses., ArXiv https://doi.org/10.1093/mnras/stv624 (2020).
- Broadhurst et al. [2020] T. Broadhurst, I. de Martino, H. N. Luu, G. F. Smoot, and S. H. H. Tye, Ghostly galaxies as solitons of bose-einstein dark matter., Phys. Rev. D. 101, https://doi.org/10.1103/PhysRevD.101.083012 (2020).
- Pozo et al. [2020] A. Pozo, T. Broadhurst, I. de Martino, H. N. Luu, G. F. Smoot, J. Lim, and M. Neyrinck, Wave dark matter and ultra diffuse galaxies., Mon. Not. R. Astron. Soc. 504, 2868 (2020).
- Dutta Chowdhury et al. [2021] D. Dutta Chowdhury, F. C. van den Bosch, V. H. Robles, H.-Y. van Dokkum, P. and; Schive, T. Chiueh, and T. Broadhurst, On the random motion of nuclear objects in a fuzzy dark matter halo, Astrophys. J. 916, 16 (2021).
- Church et al. [2019] B. V. Church, P. Mocz, and J. P. Ostriker, Heating of milky way disc stars by dark matter fluctuations in cold dark matter and fuzzy dark matter paradigms., Mon. Not. R. Astron. Soc. 485, 2861 (2019).
- Madau and Haardt [2015] P. Madau and F. Haardt, Cosmic reionization after planck: Could quasars do it all?, Astronomical. J. Lett. 813, 6 (2015).
- Padmanabhan and Loeb [2021] H. Padmanabhan and A. Loeb, Distinguishing agn from starbursts as the origin of double-peaked lyman-alpha emitters in the reionization era., Astron. Astrophys. 646, 4 (2021).
- Hu et al. [2016] E. M. Hu, L. L. Cowie, A. Songaila, A. J. Barger, B. Rosenwasser, and I. G. B. Wold, An ultraluminous ly emitter with a blue wing at z = 6.6., Astronomical. J. Lett. 825, 5 (2016).
- Bosman et al. [2020] S. E. I. Bosman, K. Kakiichi, R. A. Meyer, M. Gronke, N. Laporte, and R. S. Ellis, Three ly emitting galaxies within a quasar proximity zone at z 5.8., Astronomical. J. 896, 17 (2020).
- Gronke et al. [2020] M. Gronke, P. Ocvirk, C. Mason, J. Matthee, S. I. Bosman, J. G. Sorce, J. Lewis, K. Ahn, D. Aubert, T. Dawoodbhoy, I. T. Iliev, P. R. Shapiro, and G. Yepes, Lyman-alpha transmission properties of the intergalactic medium in the codaii simulation., Arxiv https://arxiv.org/pdf/2004.14496.pdf (2020).
- Becker et al. [2015] G. D. Becker, J. S. Bolton, P. Madau, M. Pettini, E. V. Ryan-Weber, and B. P. Venemans, Evidence of patchy hydrogen reionization from an extreme ly trough below redshift six, Mon. Not. R. Astron. Soc. 447, 3402 (2015).
- Gangolli et al. [2021] N. Gangolli, A. D’Aloisio, F. Nasir, and Z. Zheng, Constraining reionization in progress at z = 5.7 with lyman- emitters: voids, peaks, and cosmic variance., Mon. Not. R. Astron. Soc. 501, 5294 (2021).
- Widrow and Kaiser [1993] L. M. Widrow and N. Kaiser, Using the schroedinger equation to simulate collisionless matter., Astrophys. J. 416, L71 (1993).
- Hu et al. [2000] W. Hu, R. Barkana, and A. Gruzinov, Fuzzy cold dark matter: The wave properties of ultralight particles., Phys. Rev. Lett. 85, 1158 (2000).
- May and Springel [2021] S. May and V. Springel, Structure formation in large-volume cosmological simulations of fuzzy dark matter: Impact of the non-linear dynamics., Mon. Not. R. Astron. Soc. Advanced access, https://doi.org/10.1093/mnras/stab1764 (2021).
- Navarro and Frenk [1996] J. Navarro and C. S. Frenk, The structure of cold dark matter halos., Astrophys. J. 462, 563 (1996).
- Woo and Chiueh [2009] T. P. Woo and T. Chiueh, High-resolution simulation on structure formation with extremely light bosonic dark matter., Astrophys. J. 697, 850 (2009).
- Kang and Ricotti [2019] H. D. Kang and M. Ricotti, Ghostly haloes in dwarf galaxies: constraints on the star formation efficiency before reionization., Mon. Not. R. Astron. Soc. 488, 2673 (2019).
- Binney and Tremaine [2008] J. Binney and S. Tremaine, Galactic dynamics: Second edition, Princeton Univ. (2008).
- Cicuéndez and Battaglia [2018] L. Cicuéndez and G. Battaglia, Appearances can be deceiving: clear signs of accretion in the seemingly ordinary sextans dsph, Mon. Not. R. Astron. Soc. 480, 251 (2018).
- Zaggia et al. [2011] S. Zaggia, E. V. Held, V. Sommariva, Y. Momany, I. Saviane, and L. Rizzi, Phoenix dwarf galaxy stellar kinematics, EAS Publications Series 48, 215 (2011).
- Koch et al. [2007] A. Koch, M. I. Wilkinson, J. T. Kleyna, G. F. Gilmore, E. K. Grebel, A. D. Mackey, N. W. Evans, and R. F. G. Wyse, Stellar kinematics and metallicities in the leo i dwarf spheroidal galaxy-wide-field implications for galactic evolution, Astrophys. J. 657, 241 (2007).
- Łokas and Mamon [2005] E. L. Łokas and F. Mamon, Gary A. search by orcid ; Prada, Dark matter distribution in the draco dwarf from velocity moments, Mon. Not. R. Astron. Soc. 363, 918 (2005).
- Walker et al. [2009] M. G. Walker, M. Mateo, E. W. Olszewski, J. Peñarrubia, N. W. Evans, and G. Gilmore, A universal mass profile for dwarf spheroidal galaxies?, Astrophys. J. 704, 1274 (2009).
- Fritz et al. [2018] G. Fritz, T. K.and Battaglia, M. S. Pawlowski, N. Kallivayalil, R. van der Marel, S. T. Sohn, C. Brook, and G. Besla, Gaia dr2 proper motions of dwarf galaxies within 420 kpc. orbits, milky way mass, tidal influences, planar alignments, and group infall., Astron. Astrophys. 619, 18 (2018).
- McConnachie and Venn [2020] A. W. McConnachie and K. A. Venn, Revised and new proper motions for confirmed and candidate milky way dwarf galaxies., Astronomical. J. 160, https://doi.org/10.3847/1538-3881/aba4ab (2020).
- Frinchaboy et al. [2012] P. M. Frinchaboy, S. R. Majewski, R. R. Muñoz, D. R. Law, E. L. Łokas, W. E. Kunkel, R. Patterson, and K. V. Johnston, A 2mass all-sky view of the sagittarius dwarf galaxy. vii. kinematics of the main body of the sagittarius, Astrophys. J. 756, 19 (2012).
- Coleman et al. [2007] K. Coleman, M. G.and Jordi, H.-W. Rix, E. K. Grebel, and A. Koch, A wide-field view of leo ii: A structural analysis using the sloan digital sky survey., Astronomical. J. 134, 1938 (2007).
- Battaglia et al. [2012b] G. Battaglia, M. Rejkuba, E. Tolstoy, M. J. Irwin, and G. A. Beccari, A wide-area view of the phoenix dwarf galaxy from very large telescope/fors imaging., Mon. Not. R. Astron. Soc. 424, 1113 (2012b).