11email: hoeft@tls-tautenburg.de 22institutetext: Mbarara University of Science & Technology, PO Box 1410 Mbarara, Uganda 33institutetext: Dipartimento di Fisica e Astronomia, Universitá di Bologna, via P. Gobetti 93/2, 40129, Bologna, Italy 44institutetext: INAF-Istituto di Radio Astronomia, Via Gobetti 101, 40129, Bologna, Italy 55institutetext: IASF-Milano, INAF, via A. Corti 12, 20133 Milano, Italy 66institutetext: Instituto de Astronomía y Física del Espacio (IAFE, CONICET-UBA), CC 67, Suc. 28, 1428 Buenos Aires, Argentina 77institutetext: Facultad de Ciencias Exactas y Naturales (FCEyN), Universidad de Buenos Aires (UBA), Buenos Aires, Argentina 88institutetext: Leiden Observatory, Leiden University, PO Box 9513, NL-2300 RA Leiden, The Netherlands 99institutetext: ASTRON, the Netherlands Institute for Radio Astronomy, Postbus 2, 7990 AA, Dwingeloo, The Netherlands 1010institutetext: University of Hamburg, Hamburger Sternwarte, Gojenbergsweg 112, 21029 Hamburg, Germany 1111institutetext: INAF - Osservatorio di Astrofisica e Scienza dello Spazio di Bologna, via Piero Gobetti 93/3, I-40129 Bologna, Italia 1212institutetext: Center for Astrophysics Harvard Smithsonian, 60 Garden Street, Cambridge, MA 02138, USA 1313institutetext: Departamento de Física Teórica and CIAFF, Módulo 8, Facultad de Ciencias, Universidad Autónoma de Madrid, E-28049 Cantoblanco, Madrid, Spain 1414institutetext: Department of Astronomy, University of Geneva, ch. d’Ecogia 16, 1290 Versoix, Switzerland
Abell 1430: A merging cluster
with exceptional diffuse radio emission
Abstract
Context. Diffuse radio emission has been found in many galaxy clusters, predominantly in massive systems which are in the state of merging. The radio emission can usually be classified as relic or halo emission, which are believed to be related to merger shocks or volume-filling turbulence, respectively. Recent observations have revealed radio bridges for some pairs of very close galaxy clusters. The mechanisms that may allow to explain the high specific density of relativistic electrons, necessary to explain the radio luminosity of these bridge regions, are poorly explored until now.
Aims. When inspecting the first data release of the LOFAR Two-Metre Sky Survey (LoTSS), we discovered diffuse radio emission in the galaxy cluster Abell 1430. Here, we aim at determining the dynamical state of the cluster and characterising the diffuse radio emission.
Methods. We analyse the LoTSS data in detail and complement it with recent Karl G. Jansky Very Large Array observations in the L-band. To study the dynamical state of the cluster, we analyse XMM-Newton data, Chandra data, and Sloan Digital Sky Survey data. Moreover, we compare our results to clusters extracted from the The Three Hundred Project cosmological simulation.
Results. We find that Abell 1430 consists of two components, namely A1430-A and A1430-B, with a mass ratio of about 2:1. The massive component shows diffuse radio emission which can be classified as radio halo which shows a low radio power at 1.4 GHz with respect to the mass of the cluster. Most interestingly, there is extended diffuse radio emission, in the following dubbed as the ‘Pillow’ according to its morphology, which is apparently related to A1430-B and which is neither typical halo nor typical relic emission. The origin of this emission is puzzling. We speculate that the two components of Abell 1430 undergo an off-axis merger. In this scenario, A1430-B is moving towards the main cluster component and may have compressed and stirred the medium in the filament between the two cluster components.
Conclusions. We have discovered evidence for diffuse radio emission related to the low-density intracluster or intergalactic medium in Abell 1430. To date, only few examples of emission originating from such regions are known. These discoveries are crucial to constrain possible acceleration mechanisms which may allow us to explain the presence of relativistic electrons in these regions. In particular, our results indicate a spectral index of for the Pillow. If upcoming observations confirm a slope as flat as or even flatter, this would pose a challenge for the electron acceleration scenarios.
Key Words.:
galaxy clusters: individual: Abell 1430 – radiation mechanisms: non-thermal – radiation mechanisms: thermal – techniques: interferometric – radio continuum: general – X-ray: galaxies: clusters1 Introduction
Galaxy clusters have been studied extensively thanks to the rigorous surveys that have observed the entire sky to search for overdense regions (Abell, 1958; Böhringer et al., 2000; Ebeling et al., 2000; Zhang et al., 2011; Planck Collaboration et al., 2011; Böhringer et al., 2017) and many follow-up deep studies of individual clusters. The analysis of the thermal gas, filling the volume between the cluster galaxies, permits to conclude on the dynamical state of the clusters and the effects that occur in the course of merging (see, e.g., Markevitch et al., 2002; Golovich et al., 2019).
For many merging clusters diffuse radio emission has been found. The emission features can generally be divided into radio relics and radio halos, which are attributed to merger shock fronts in the cluster periphery and to volume-filling turbulence in the intracluster medium (ICM), respectively (see, e.g., Feretti et al., 2012; van Weeren et al., 2019, for recent reviews). Both relics and halos show spectral properties which indicate that synchrotron emission is the origin, hence, they manifest the presence of magnetic fields and relativistic electrons in the ICM.
For several radio relics, a connection to a shock front in the ICM is evident from the X-ray surface brightness or temperature discontinuities at the location of the relic (e.g., Finoguenov et al., 2010; Bourdin et al., 2013; Akamatsu & Kawahara, 2013; Botteon et al., 2016). The typically very elongated morphology of relics is hence naturally explained by relating the relic to a spherical shock observed in projection. A radio emitting shock seen face-on is expected to have such a low surface brightness that is difficult to detect. Radio relics show in general power-law spectra with a slope of about to (van Weeren et al., 2019). A very prominent feature of radio relics is that often the emission has found to be polarised in the GHz-regime, for some relics locally even with a fractional polarisation above 50 % (Bonafede et al., 2009; van Weeren et al., 2010, 2012a; Kierdorf et al., 2017; Hoang et al., 2018). In several cases, the polarisation angle orientation is remarkably homogeneous across the entire relic (e.g. van Weeren et al., 2010).
In contrast, radio halos are believed to trace the turbulence generated by cluster mergers. A direct observational proof is still to be provided. However, radio halos have almost exclusively been found in merger systems (Buote, 2001; Cassano et al., 2010), suggesting that the halo emission is related to the kinetic energy dissipated during the merger and transferred into non-thermal components through complex mechanisms involving shocks and turbulence (see Brunetti & Jones, 2014, for a review). This scenario can explain the observational properties of halos, e.g., the often found close correlation between X-ray and radio surface brightness and the absence of polarised halo emission at the current detection levels. Moreover, it has been found that the luminosity of radio halos correlates with the X-ray luminosity and the mass of the clusters (Cassano et al., 2013).
Recently, LOw Frequency ARray (LOFAR) observations also discovered diffuse emission which connects pairs of massive clusters in the form of radio bridges (Botteon et al., 2018a; Govoni et al., 2019; Botteon et al., 2020). These observations suggest that compression and turbulence generated by substructures in the low-density cosmic filaments activate magnetic field amplification and mechanisms of stochastic acceleration of particles, too (Brunetti & Vazza, 2020). To date, it is unclear how often such early stages of cluster mergers lead to observable radio emission that originates from turbulence driven by the motion of the substructures. Since this emission is expected to possess a steep spectrum (Brunetti & Vazza, 2020), LOFAR observations are excellently suited to search for new examples.
In this paper, we present the discovery of a radio halo in the merging galaxy cluster Abell 1430. Central for this study are observations being part of the LOFAR Two-Metre Sky Survey (LoTSS). We complemented our analysis with data from Karl G. Jansky Very Large Array (VLA) observations in L-band. Chandra and XMM-Newton X-ray data was also used, allowing us to examine the relationship between the thermal properties of the cluster components with the relativistic electron population.
Throughout this paper, we assume a cosmology with , , and . With these values, corresponds to a physical scale of 5 kpc at a redshift of 0.35 (Wright, 2006). We apply the usual convention for the spectral index of a power-law spectrum, namely . All images shown in this paper are in the J2000 coordinate system. Radio images are corrected for primary beam attenuation.
2 Abell 1430
Abell 1430, hereafter A1430, was first reported in the catalogue of 2712 rich clusters of galaxies found in the National Geographic Society Palomar Observatory Sky Survey (Abell, 1958). The catalogue lists 31 cluster galaxies making A1430 have a richness class of 0, i.e., the number of galaxies is actually below the minimum population of 50 galaxies to be considered as a rich cluster. The ROSAT space telescope has detected X-ray emission from the cluster; in the Northern ROSAT All-Sky galaxy cluster survey (NORAS), it is listed as an extended X-ray source, namely RXC J1159.2+494 (Böhringer et al., 2000).
The cluster has been also reported in the First and Second Planck Catalogue of Sunyaev-Zel’dovich effect (SZ) sources, PSZ1 and PSZ2, respectively (Planck Collaboration et al., 2015, 2016). In the second catalogue, it is listed as PSZ2 G143.26+65.24 with a redshift of and a mass of .
In earlier analyses, a lower redshift was derived. Struble & Rood (1991) compiled redshifts and velocity dispersions of Abell clusters. They stated a redshift of for A1430, derived from the photometric redshift of two galaxies, which later turned out to be located in the foreground of A1430. Rozo et al. (2015) compared clusters from the PSZ1 catalogue with their Sloan Digital Sky Survey (SDSS) redMaPPer catalogue. For twelve clusters, they found a discrepancy between the redshift given in PSZ1 and their results; A1430 was among these clusters. Based on the spectroscopic redshift of galaxies, the redshift of A1430 was recalculated as .
Rossetti et al. (2016) investigated the projected distance between the positions of the brightest cluster galaxy (BCG) and the peak of the X-ray surface brightness for 132 galaxy clusters. For A1430 they found a distance of , which is significantly larger than the median of all clusters in their sample and larger than the threshold of given by Sanderson et al. (2009) for separating relaxed and disturbed clusters.
The shift between the BCG and the X-ray emission peak indicates that the cluster is dynamically disturbed, however, it does not allow us to conclude on details of the merger state. We present in Sect. 3.4 and Sect. 4.4, a detailed study of the X-ray emission and of the redshift distribution to determine the actual dynamical state of A1430.
A1430 was observed as part of the LOFAR Two-metre Sky Survey (LoTSS). The cluster lies in the area which has been covered by the first LoTSS data release (Shimwell et al., 2019).
3 Observations, data reduction and resulting images
3.1 LOFAR High Band Antenna (HBA) observations
LoTSS is mapping the entire northern sky with unprecedented sensitivity and resolution. At optimal declinations, it provides images with root mean square (rms) noise levels below 100 µJy at a resolution of 6 and 20 at a central frequency of 144 MHz (Shimwell et al., 2019). In order to cover the entire northern sky, 3,168 pointings of eight hours each have to be observed. Every LoTSS pointing is bookended with calibrator observations of 10 minutes each. LoTSS data for 2 % of the northern sky, covering about 424 square degrees in the region of the Hobby-Eberly Telescope Dark Energy Experiment (HETDEX) Spring Field has been published as LoTSS Data Release 1 (DR1, Shimwell et al., 2019).
The field of A1430 was covered by two LoTSS pointings located in the HETDEX field, namely P18Hetdex03, and P22Hetdex04. Those observations were conducted on 28th of May 2014 and 25th of May 2014, respectively.
Data reduction and calibration was performed with the LoTSS DR2 reduction pipeline, which contains significant improvements in calibration and imaging reconstruction fidelity (Tasse et al., 2021) as compared to the LoTSS DR1 (see Sec. 2.2, 2.3, and 5 in Shimwell et al., 2019). The calibration comprises a direction-independent calibration using PREFACTOR111https://github.com/lofar-astron/prefactor/ v2.0 (for a description of the procedure, see van Weeren et al., 2016; Williams et al., 2016) and the DDF-pipeline222https://github.com/mhardcastle/ddf-pipeline/ v2.2, developed by the LOFAR Surveys Key Science Project, which performs several iterations of direction-dependent self-calibration, and imaging using KillMS (Tasse, 2014a, b; Smirnov & Tasse, 2015) and DDFacet (Tasse et al., 2018).
The two directional-dependent calibrated data sets were combined and an additionally common calibration (see Section 2 in van Weeren et al., 2020, for a detailed description of the “extraction” method) was performed to further improve the image fidelity in the target region. As part of this pipeline, a source model of the whole field of view, as derived from the DDF-pipeline, and excluding an area of 0.5 deg2 centred on the location of A1430, is subtracted from the visibilities for each of the two sets. Afterwards, the visibilities of all pointings are phase-shifted and averaged towards the target direction. Subsequently, several rounds of imaging and self-calibration with respect to amplitude and phase were performed using the combined data of both pointings. Final imaging was performed with WSClean v2.6 (Offringa et al., 2014) using different Briggs weightings (Briggs, 1995) for high-resolution and low-resolution imaging. As described below in more detail, we carefully modelled the tailed radio galaxies and compact sources and subtracted them from the visibilities with DPPP333https://github.com/lofar-astron/DP3 (van Diepen et al., 2018) before imaging at low resolution.
van Weeren et al. (2020) have characterised the diffuse radio emission revealed in the LoTSS observations for all known galaxy clusters in the HETDEX region, evidently including A1430. In that work, the procedures for extracting the information for the region of interest from the LoTSS data and applying self-calibration in addition to the standard LoTSS pipeline are described in detail. For the analysis of the radio emission in A1430, i.e., the focus of this work, we start with the extracted and self-calibrated data.
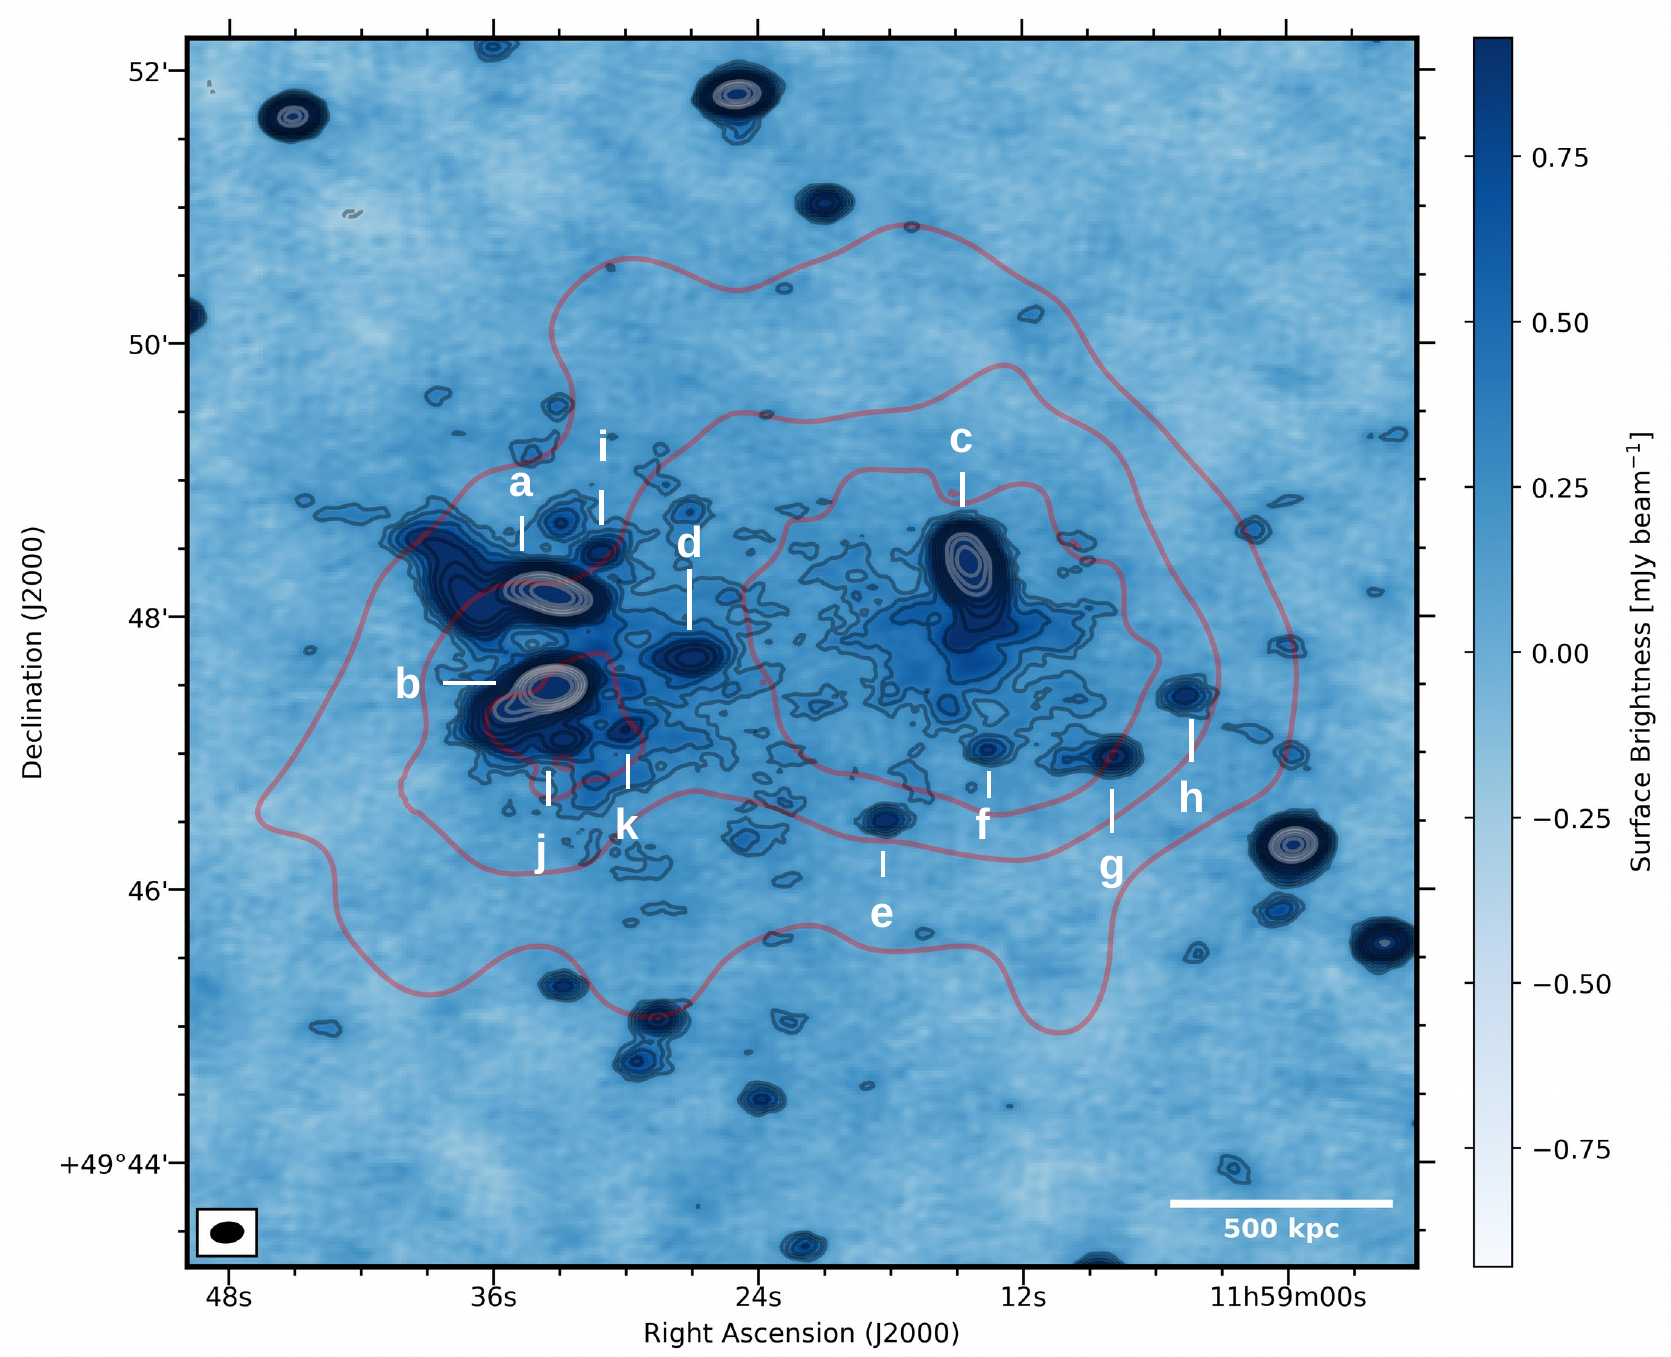
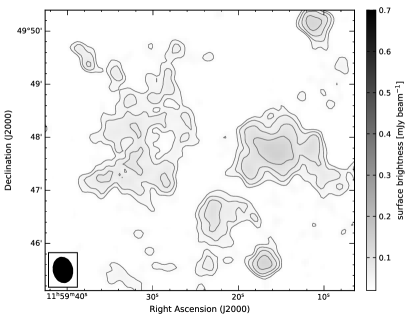
The radio emission at 144 MHz in the A1430 region -without the subtraction of compact sources- is shown in Fig. 1. Most prominently, three bright radio sources are located in the cluster region, denoted as a, b, and c. All three sources are evidently extended and appear to be tailed radio galaxies. The low surface brightness, extended features may indicate diffuse emission in the cluster region not related to the bright radio galaxies. A cautious modelling, in particular of the tails of the radio galaxies, is crucial since the bright radio galaxies overlap with the diffuse emission. The low surface brightness diffuse emission can be recovered in maps made at lower resolution only if the bright radio galaxies and other compact sources in the cluster region can be reasonably well subtracted from the visibilities.
In Tab. 1 we list the compact and extended sources in the cluster region identified from the LoTSS image and subtracted from the visibilities. The flux density uncertainties are estimated as follows:
| (1) |
where denotes the flux density of the source, the flux density scale uncertainty, the noise in the image, the number of beams necessary to cover the source, the subtraction uncertainty if applicable, and the subtracted flux density if applicable. For the flux densities derived from the LOFAR data, we assume a flux density scale uncertainty of as done by LoTSS (Shimwell et al., 2019) and a subtraction uncertainty of .
| name | ||
|---|---|---|
| [mJy] | [mJy] | |
| a | ||
| b | ||
| c | ||
| d | ||
| e | ||
| f | ||
| g | ||
| h | ||
| i | ||
| j | ||
| k |
3.2 Uncovering the diffuse emission
The radio surface brightness distribution shown in Fig. 1 tentatively indicates the presence of extended, diffuse emission in the cluster. However, it is challenging to distinguish diffuse emission in the cluster from extended lobes of the galaxies. To achieve this, we (i) carefully model the sources, (ii) compare our subtraction to the -cut based subtraction applied in van Weeren et al. (2020), and (iii) discuss the plausibility that the detected extended emission could actually originate from the lobes of the radio galaxies.
A common procedure to distinguish emission of radio galaxies from extended, diffuse emission is to apply an inner cut in -space, i.e., all visibilities on -distances larger than the cut value are used to generate the surface brightness distribution of the radio galaxies while all visibilities on shorter distances are used to reconstruct the extended, diffuse emission. In van Weeren et al. (2020) we adopted a -cut corresponding to 250 kpc at the cluster redshift. For instance, we identified for the radio galaxy c a flux density of 32.6 mJy based on this method. Using a larger -cut of 500 kpc leads to a similar flux density for source c. However, the -cut method may underestimate the flux density related to source c, because part of the flux density at the location of source c is attributing to an ‘extension’ of the diffuse emission. Due to emission of source c not subtracted with the model the diffuse emission may seem to be more extended than it actually is.
It is impossible to decide from the radio map if the radio galaxy is superimposed with the halo or not. We adopted a rigorous approach to subtract the radio galaxies by basically model all flux in the galaxy region, identified from the -cut, as part of the radio galaxies, see Fig. 2. With this approach we obtained the flux densities listed in Tab. 1. Apparently, we subtracted for source c about 6 mJy more than obtained with the -cut method.
The difference between the two methods is even more severe for the sources a and b. With the two -cuts we obtained a flux density of 130 mJy and 137 mJy for both sources together, using an -cut of 250 kpc and 500 kpc, respectively. With our more conservative approach, we subtracted 155.8 mJy. As mentioned above, it is impossible to unambiguously determine how much of the flux density in the region of the galaxies actually originates from the diffuse emission. We therefore decided to conservatively attribute all flux density in the region of the galaxies to the galaxies.
Evidently, the question remains if the diffuse emission might also be partially -or even fully- related to the radio galaxies, e.g., being an old extended lobe. We will discuss below the plausibility of such a scenario.
3.3 VLA observations
We observed the cluster with the VLA in the L-band covering the frequency range of 1-2 GHz. These observations (project code: 18A-172) were carried out with C and D configurations on September 2018 and January 2019, respectively, with in total 2.6 h observing time on target. All four correlation products, namely RR, RL, LR, and LL, were recorded. The data were recorded with 16 spectral windows, each divided into 64 channels. For each configuration, 3C147 was observed as the primary calibrator. 3C286 and J1219+4829 were included as secondary calibrators.
The VLA data were reduced with version 5.1.0. The data from C- and D-configurations were calibrated independently but in the same way. We first determined and applied elevation-dependent gain tables and antenna offsets positions. The data were then inspected for radio frequency interference (RFI) removal. The software (Offringa et al., 2010) was used for accurately detecting and flagging of RFI. We used the L-band 3C147 model provided by the software package and set the flux density scale according to Perley & Butler (2013). We calibrated the initial phase, parallel-hand delays and bandpass using 3C147. Gain calibration was obtained for 3C147 and secondary calibrators. For polarisation calibration, the leakage response was determined using the unpolarised calibrator 3C147. The cross-hand delays and the absolute position angle were corrected using 3C286. The calibrated solutions were then transferred to the target field.
Following initial imaging, we performed two rounds of phase-only self-calibration and two of amplitude and phase self-calibration on the individual data sets. The imaging was performed using the weighting with , , and , see Fig. 3 for the resulting image. To recover the diffuse emission, we combined the C and D-configurations data and imaged in using (similar to the LOFAR image). We assume a flux density scale uncertainty of for the VLA L-band (Perley & Butler, 2013).
3.4 XMM-Newton and Chandra observations
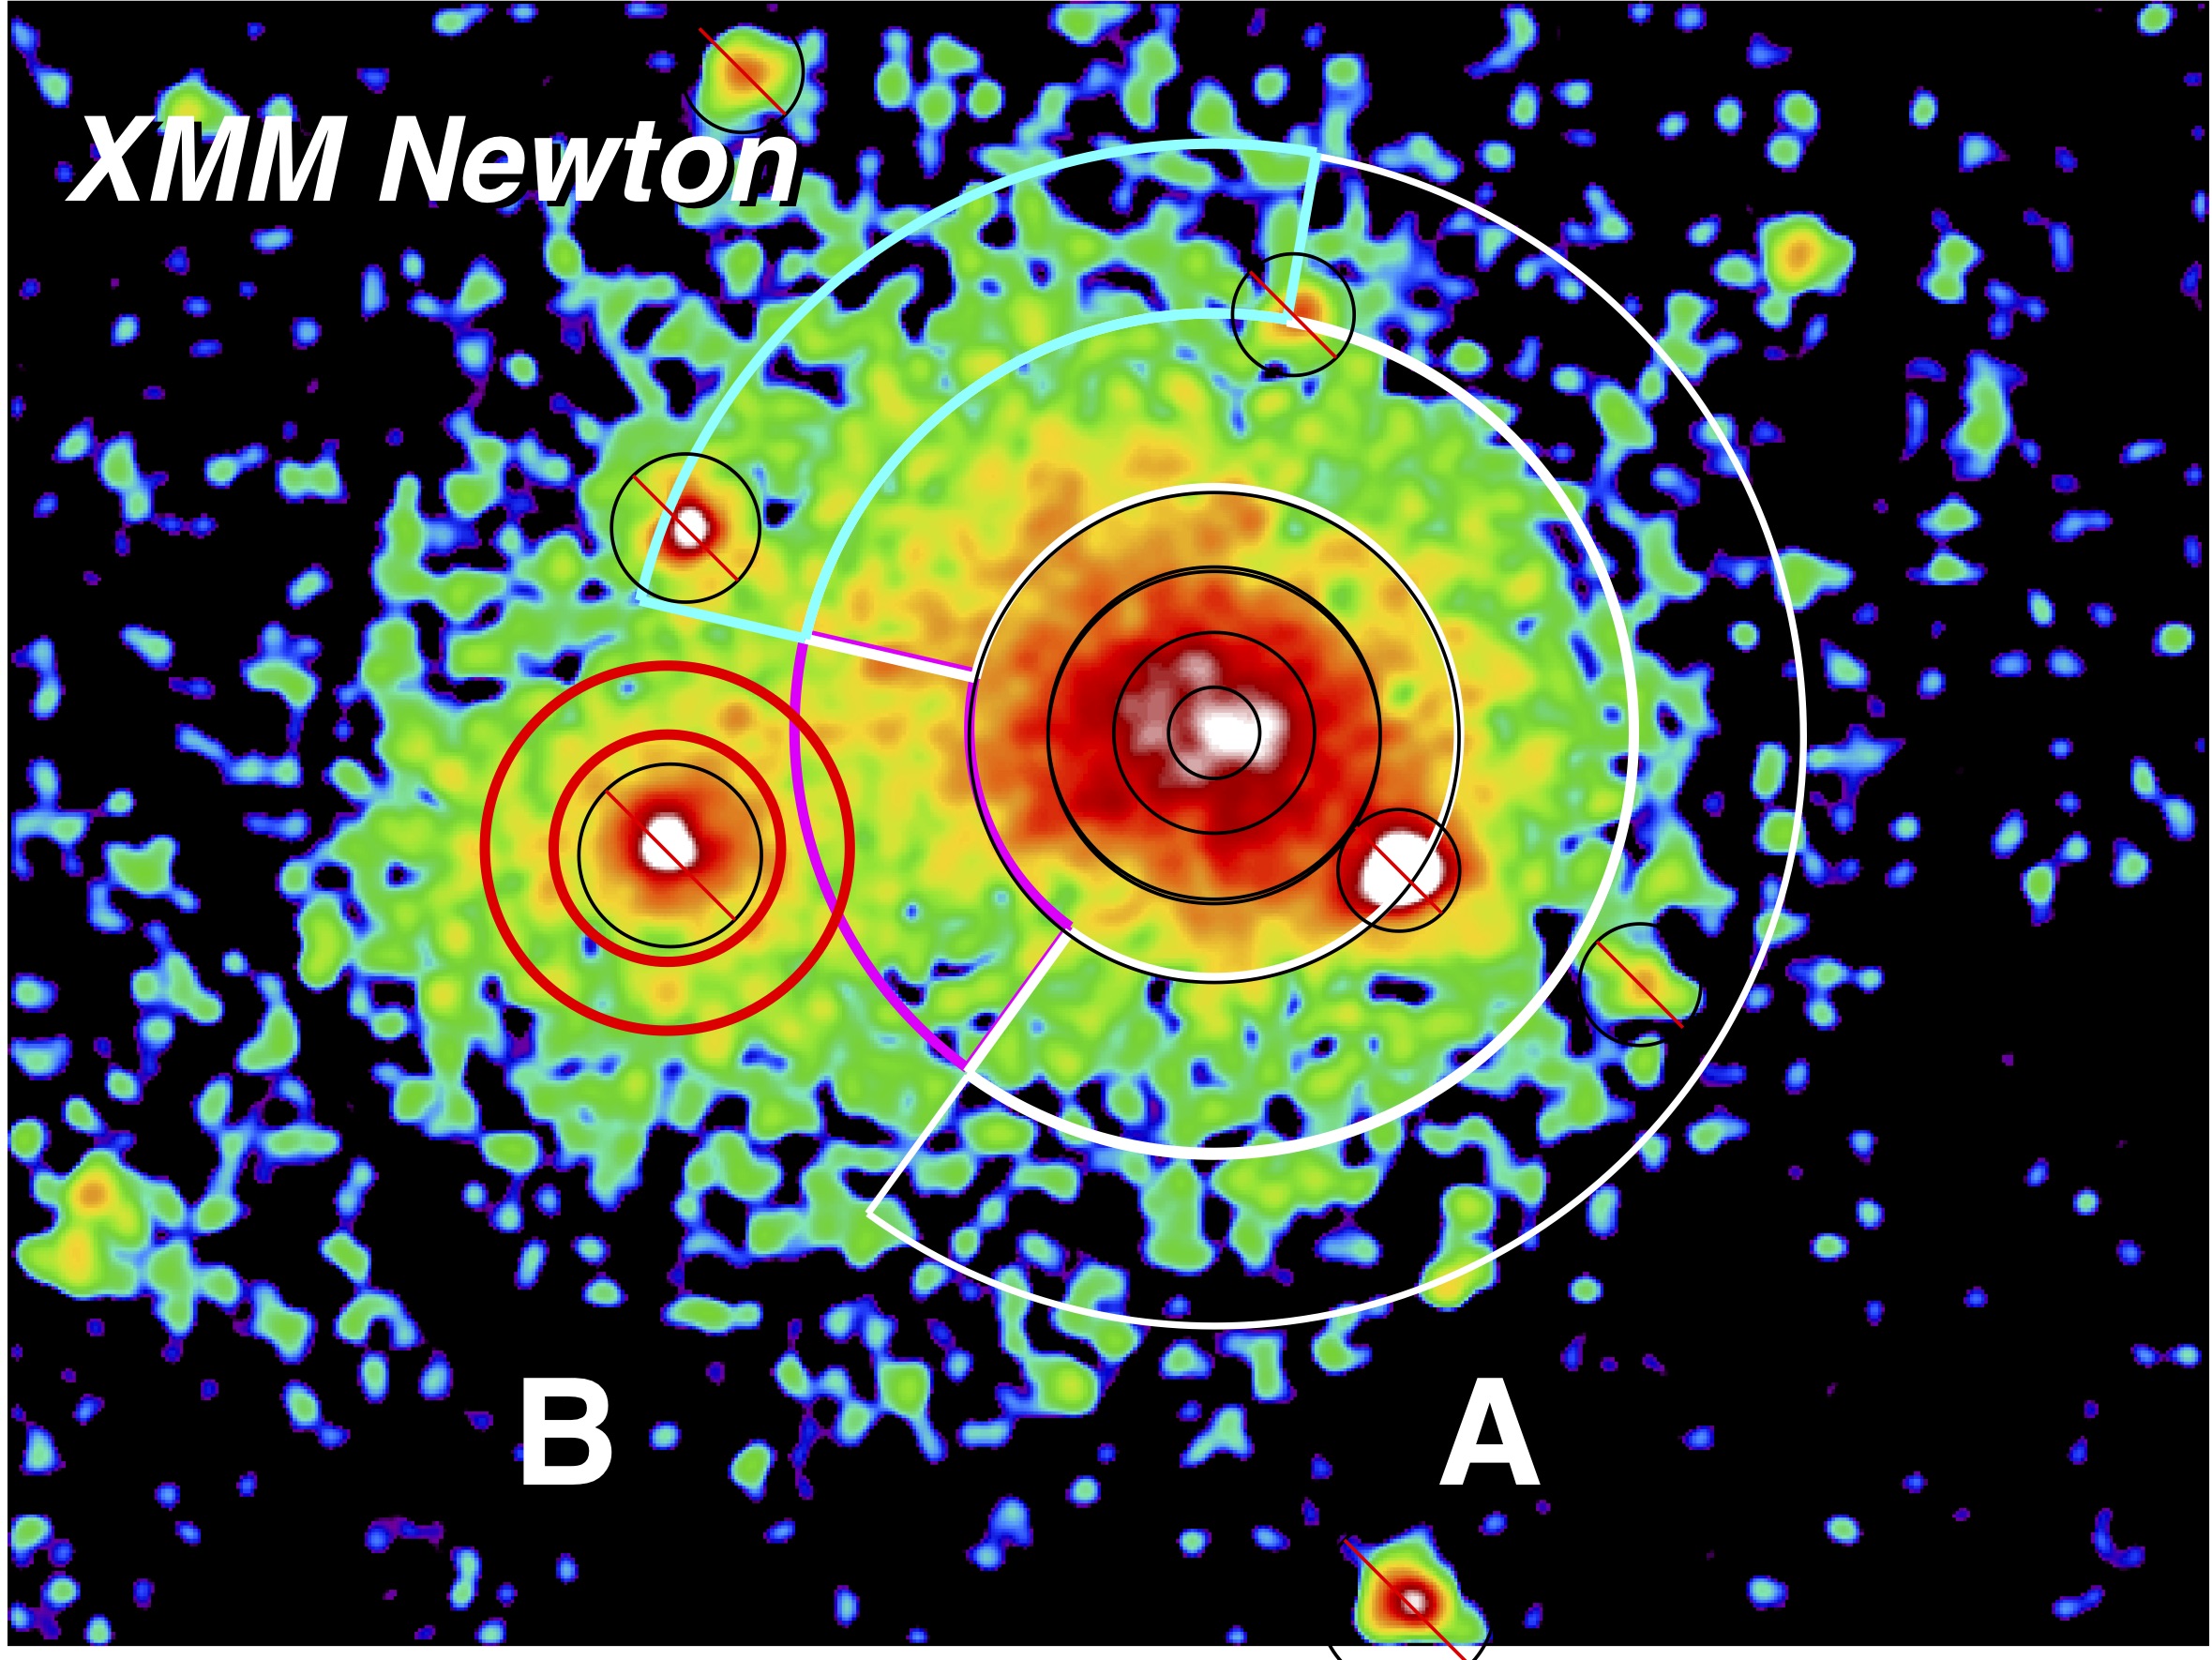
A1430 has been observed as part of the XMM Heritage Cluster Project444http://xmm-heritage.oas.inaf.it, a large and unbiased sample of 118 clusters, detected with a high signal-to-noise ratio in the Second Planck SZ Catalogue. The observation was split into two OBSIDs ( and ), with a total clean exposure time of with MOS1, with MOS2 and with pn555The pn and MOS1 camera were switched off for technical reasons for part of the observations. We analysed the data with Science Analysis System (SAS) version , following the procedures in Ghirardini et al. (2019) for data reduction, image production, and spectral extraction and fitting. These procedures were designed for the mosaic observations of the XMM Cluster Outskirts Project (X-COP) project (Eckert et al., 2017): they combine the spectra for different observations by jointly fitting them and produce mosaic images.
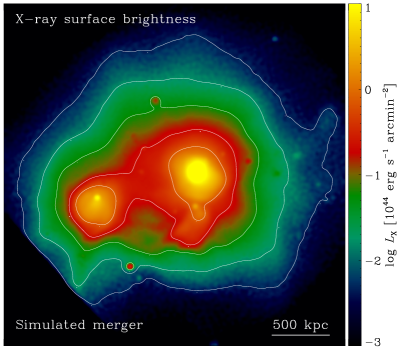
In the left panel of Fig. 4, we show the mosaic image in the X-COP band , which maximises the source-to-background ratio (Ghirardini et al., 2019). We run the source detection algorithm on this image with the SAS tool ewavelet finding a few candidate sources embedded in the ICM. Given the moderate spatial resolution of XMM, it is hard to assess if they are bona fide point sources or rather extended features, possibly part of the ICM of A1430. We thus checked all of them with the higher resolution Chandra image, see below, and masked all sources flagged in the left panel of Fig. 4 in the subsequent analysis.
A1430 was observed with the Chandra X-ray Observatory in January 2014 (Obs-ID 15119) for 22 ks. The data reduction has been performed as described in Vikhlinin et al. (2005). We applied the calibration files of CALDB 4.7.2. The data reduction included corrections for the time dependence of the charge transfer inefficiency and gain, and also a check for periods of high background, which were then removed (only were discarded). Standard blank sky background files and read-out artifacts were subtracted. Fig. 5 shows the resulting, adaptively smoothed X-ray surface brightness distribution after the subtraction of point sources, using dmimgadapt.
3.5 SDSS
A1430 has been observed as part of the Sloan Digital Sky Survey (SDSS), see data release 16 (DR16) (Aguado et al., 2019), revealing many galaxies with a redshift close to that of the A1430. The galaxy at (RA: 11h59m14.9s, DEC: 49d47m48.1s) with a magnitude 17.0 in -band in the most recent data release (DR16) is the BCG, as already classified by Hao et al. (2010). The second ranked galaxy in the cluster region has a magnitude of 17.7 in -band and is located at (RA: 11h59m30.4s, DEC: 49d47m47.2s), i.e., this galaxy is the brightest galaxy of the subcluster.
The SDSS DR16 lists 27 galaxies with a spectroscopic redshift in the range from 0.3 to 0.4 and with a distance of less than 6.75 arcmin to the BCG, corresponding to less than 2 Mpc at the redshift of the cluster. Fig. 6 shows the spatial distribution of the galaxies located close to the X-ray emission and in the redshift range from 0.334 (blue) to 0.360 (red), i.e., close to the cluster redshift.
4 Galaxy cluster merger and diffuse emission
4.1 A1430: a two-component system
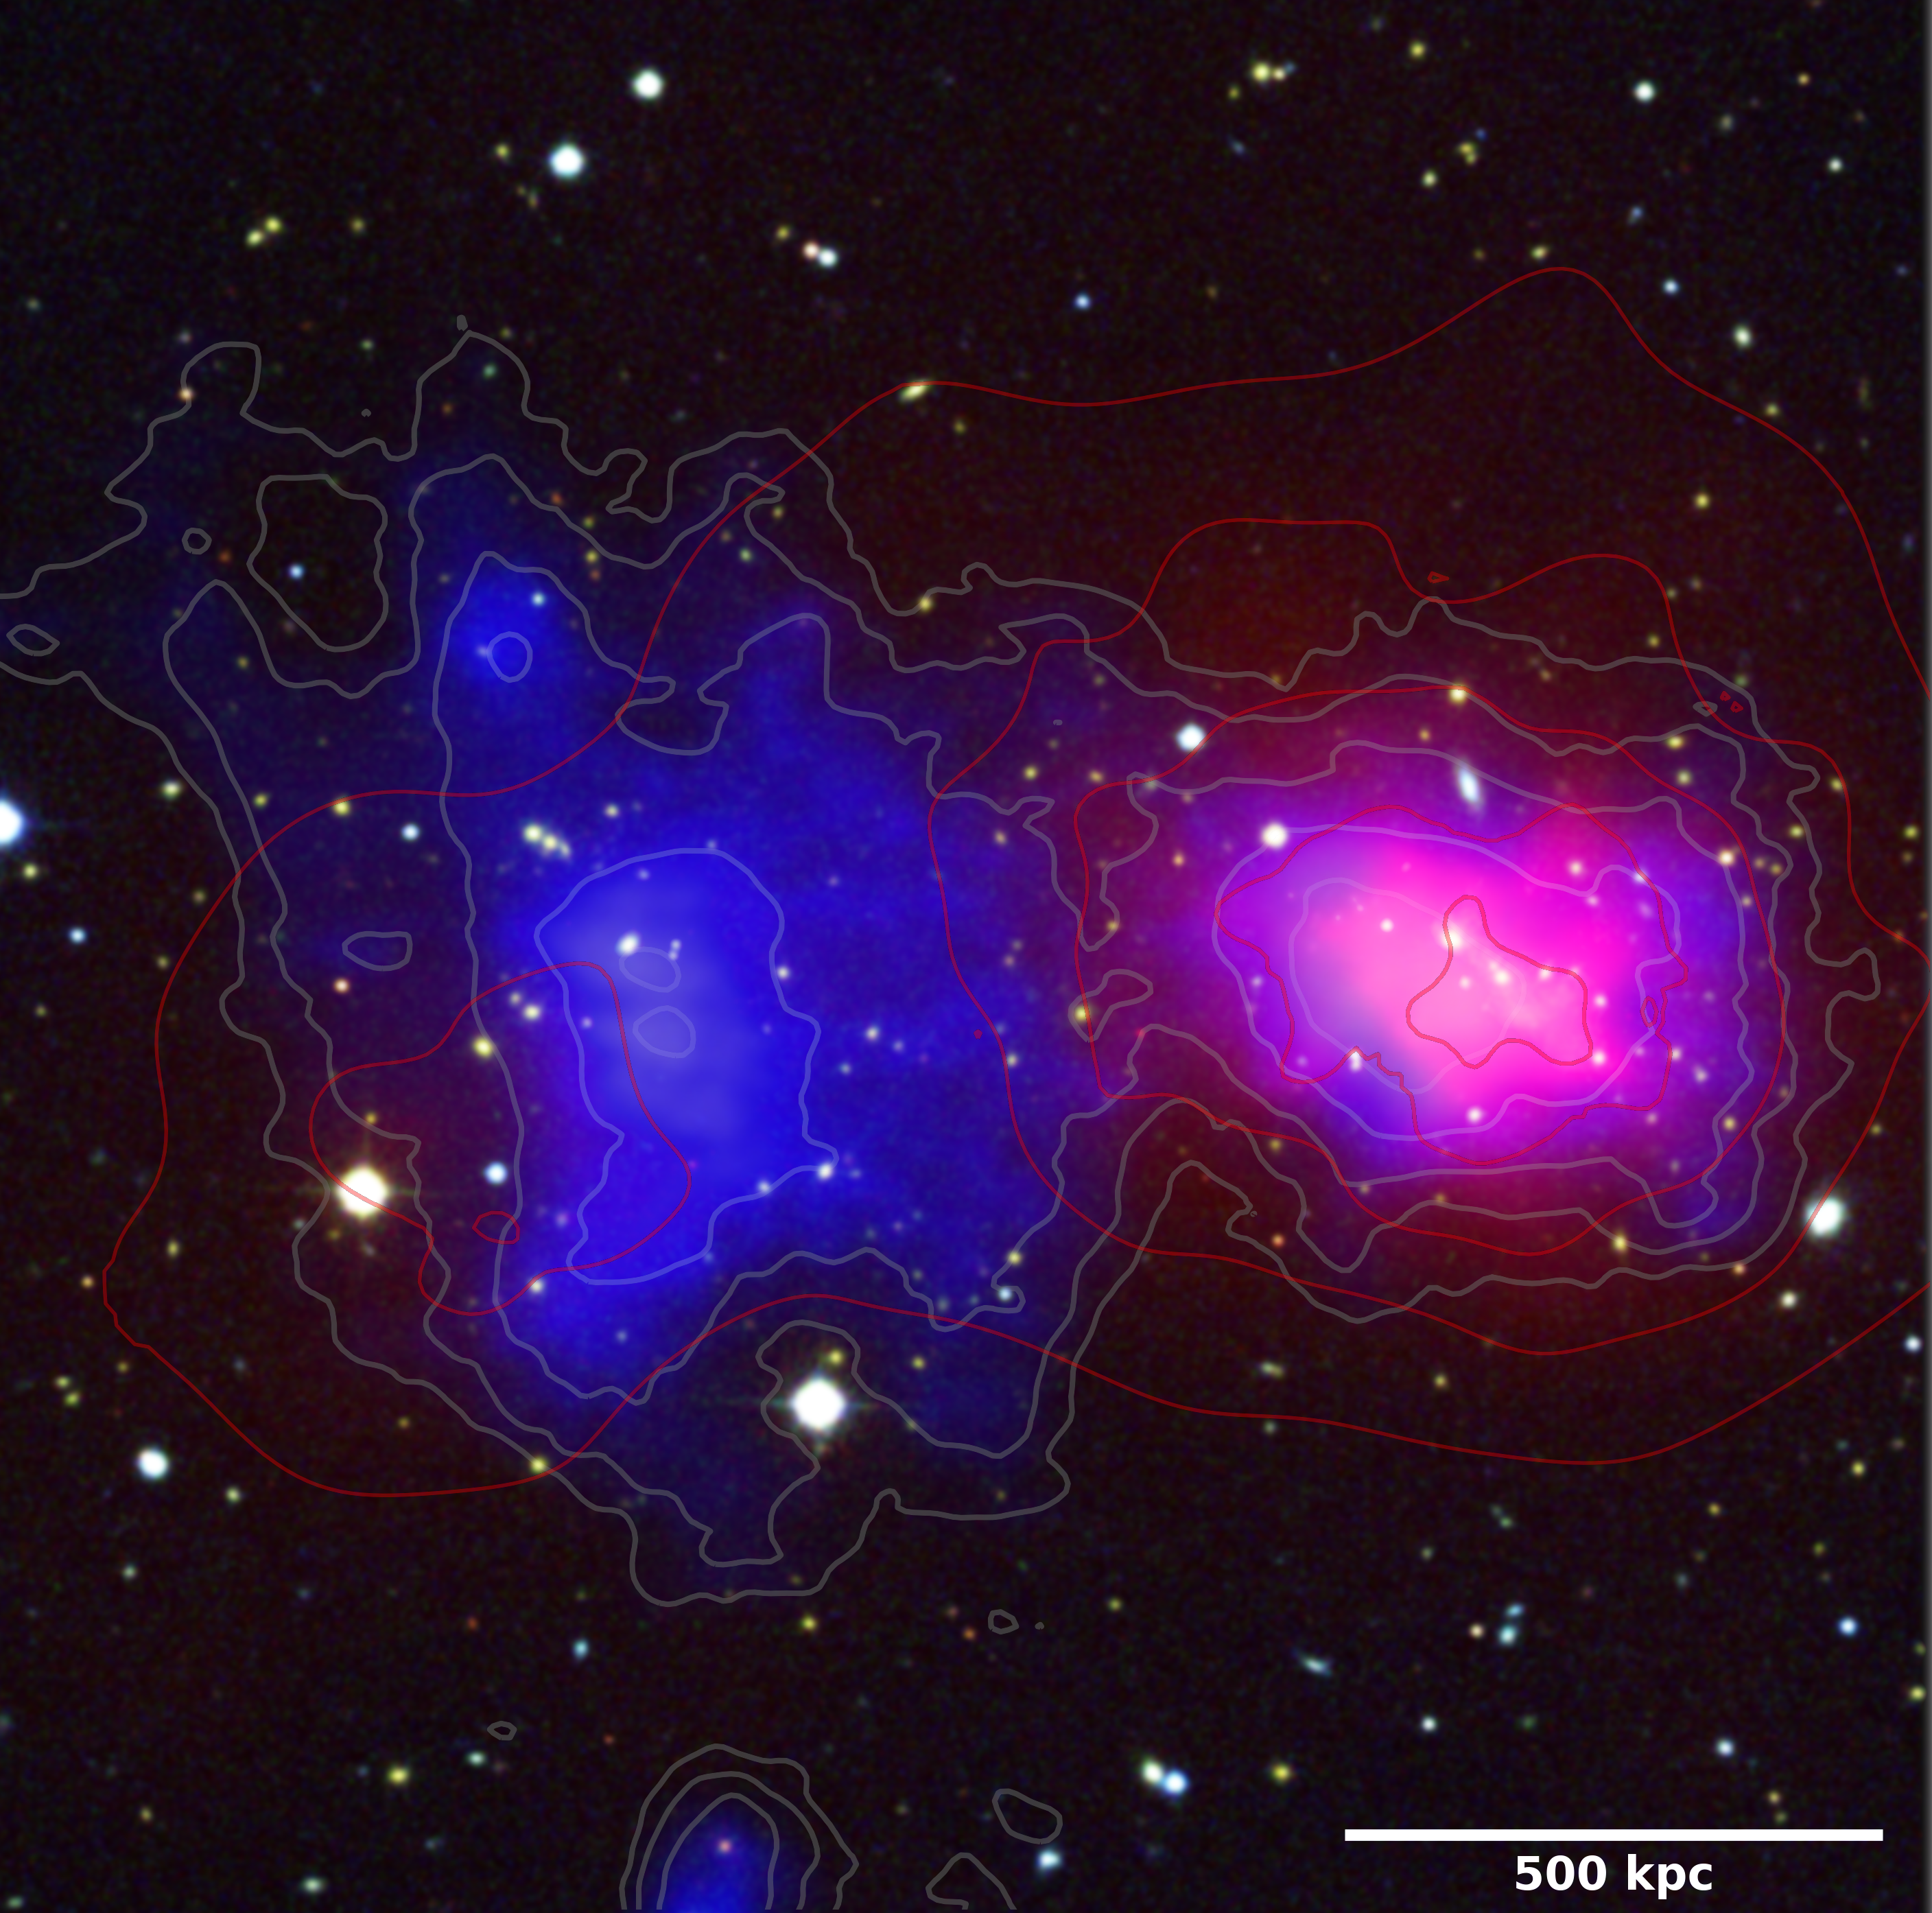
The X-ray surface brightness distribution, as obtained from the XMM-Netwon observations, see Fig. 4, clearly reveals that A1430 consists of two components, namely the main cluster A and the smaller subcluster B. The distribution of galaxies listed in SDSS with a spectroscopic redshift corroborates that the cluster has two components, see Fig. 6, even if the number of galaxies is small. The separation of the two components in the plane of the sky is about , i.e., about 930 kpc at the redshift of the cluster. If both components are at the same distance then they are clearly undergoing a merger. However, it is also possible that the two components are separated in the radial direction and are not undergoing a merger.
As a first step of our analysis, we wish to estimate the X-ray luminosity of each component separately. To this end, we measured the surface brightness in regions which are dominated by one of the components and exclude the interaction –or overlapping– region. Moreover, the regions affected by point sources have been excluded. The profile of both components has been approximated with a -profile. This allows us to extrapolate the enclosed luminosity to regions where the surface brightness is too low to be measured in the XMM-Newton observations. Commonly, the X-ray luminosity is given in the radius , i.e., the average mass density enclosed is 500 times the critical density in the universe. As a proxy for modelling the mass distribution in each component, we estimate by utilising the luminosity-radius relation given by Böhringer et al. (2013):
| (2) |
where is in units of Mpc and measured in the keV band in units of . By demanding that the luminosity of both cluster components A and B should follow the luminosity-radius relation, we can provide for each component. We find that components A and B have radii and , respectively. The corresponding X-ray luminosities are and for the keV band. To estimate the uncertainties, we assumed that the radius determination is uncertain by 20 %, which is mainly caused by the typical uncertainties in the scaling relations and the uncertainty of the cumulative X-ray surface brightness measurement.
Using a luminosity-mass scaling relation, we can estimate the mass of the two components. From Böhringer et al. (2013) we find and . Uncertainty estimates comprise the X-ray luminosity uncertainty and a 20 % scatter in the luminosity-mass scaling relation. We note that Pratt et al. (2009) found a larger scatter for the scaling relations, however, a large deviation was in particular found for cool-core clusters, apparently not the case for A1430. The sum of the two estimated masses is somewhat larger than the total mass derived from the SZ signal, which is , however, it is within uncertainty margins. Moreover, it is not surprising that the two results differ a bit, since for the SZ-based mass estimate of the combined system spherical symmetry is assumed, while we find that the cluster shows a double-peaked morphology. The mass ratio of A1430-A to A1430-B is about 2:1.
As discussed in Sec. 2, the offset between the position of the BCG and the peak of the X-ray surface brightness suggests that the main component A itself is dynamically disturbed. Following Cassano et al. (2010), we used the morphological indicators within , extracted from the point-source subtracted Chandra image, to assess the dynamical state of the main cluster A. They found that clusters with and without radio halos are best separated adopting the thresholds for the concentration parameter of and for the centroid shift of . For A1430-A, we measure and using the X-ray surface brightness distribution obtained with Chandra. Therefore, A1430-A belongs, irrespective of the presence of A1430-B, to the class of clusters that typically hosts radio halos.
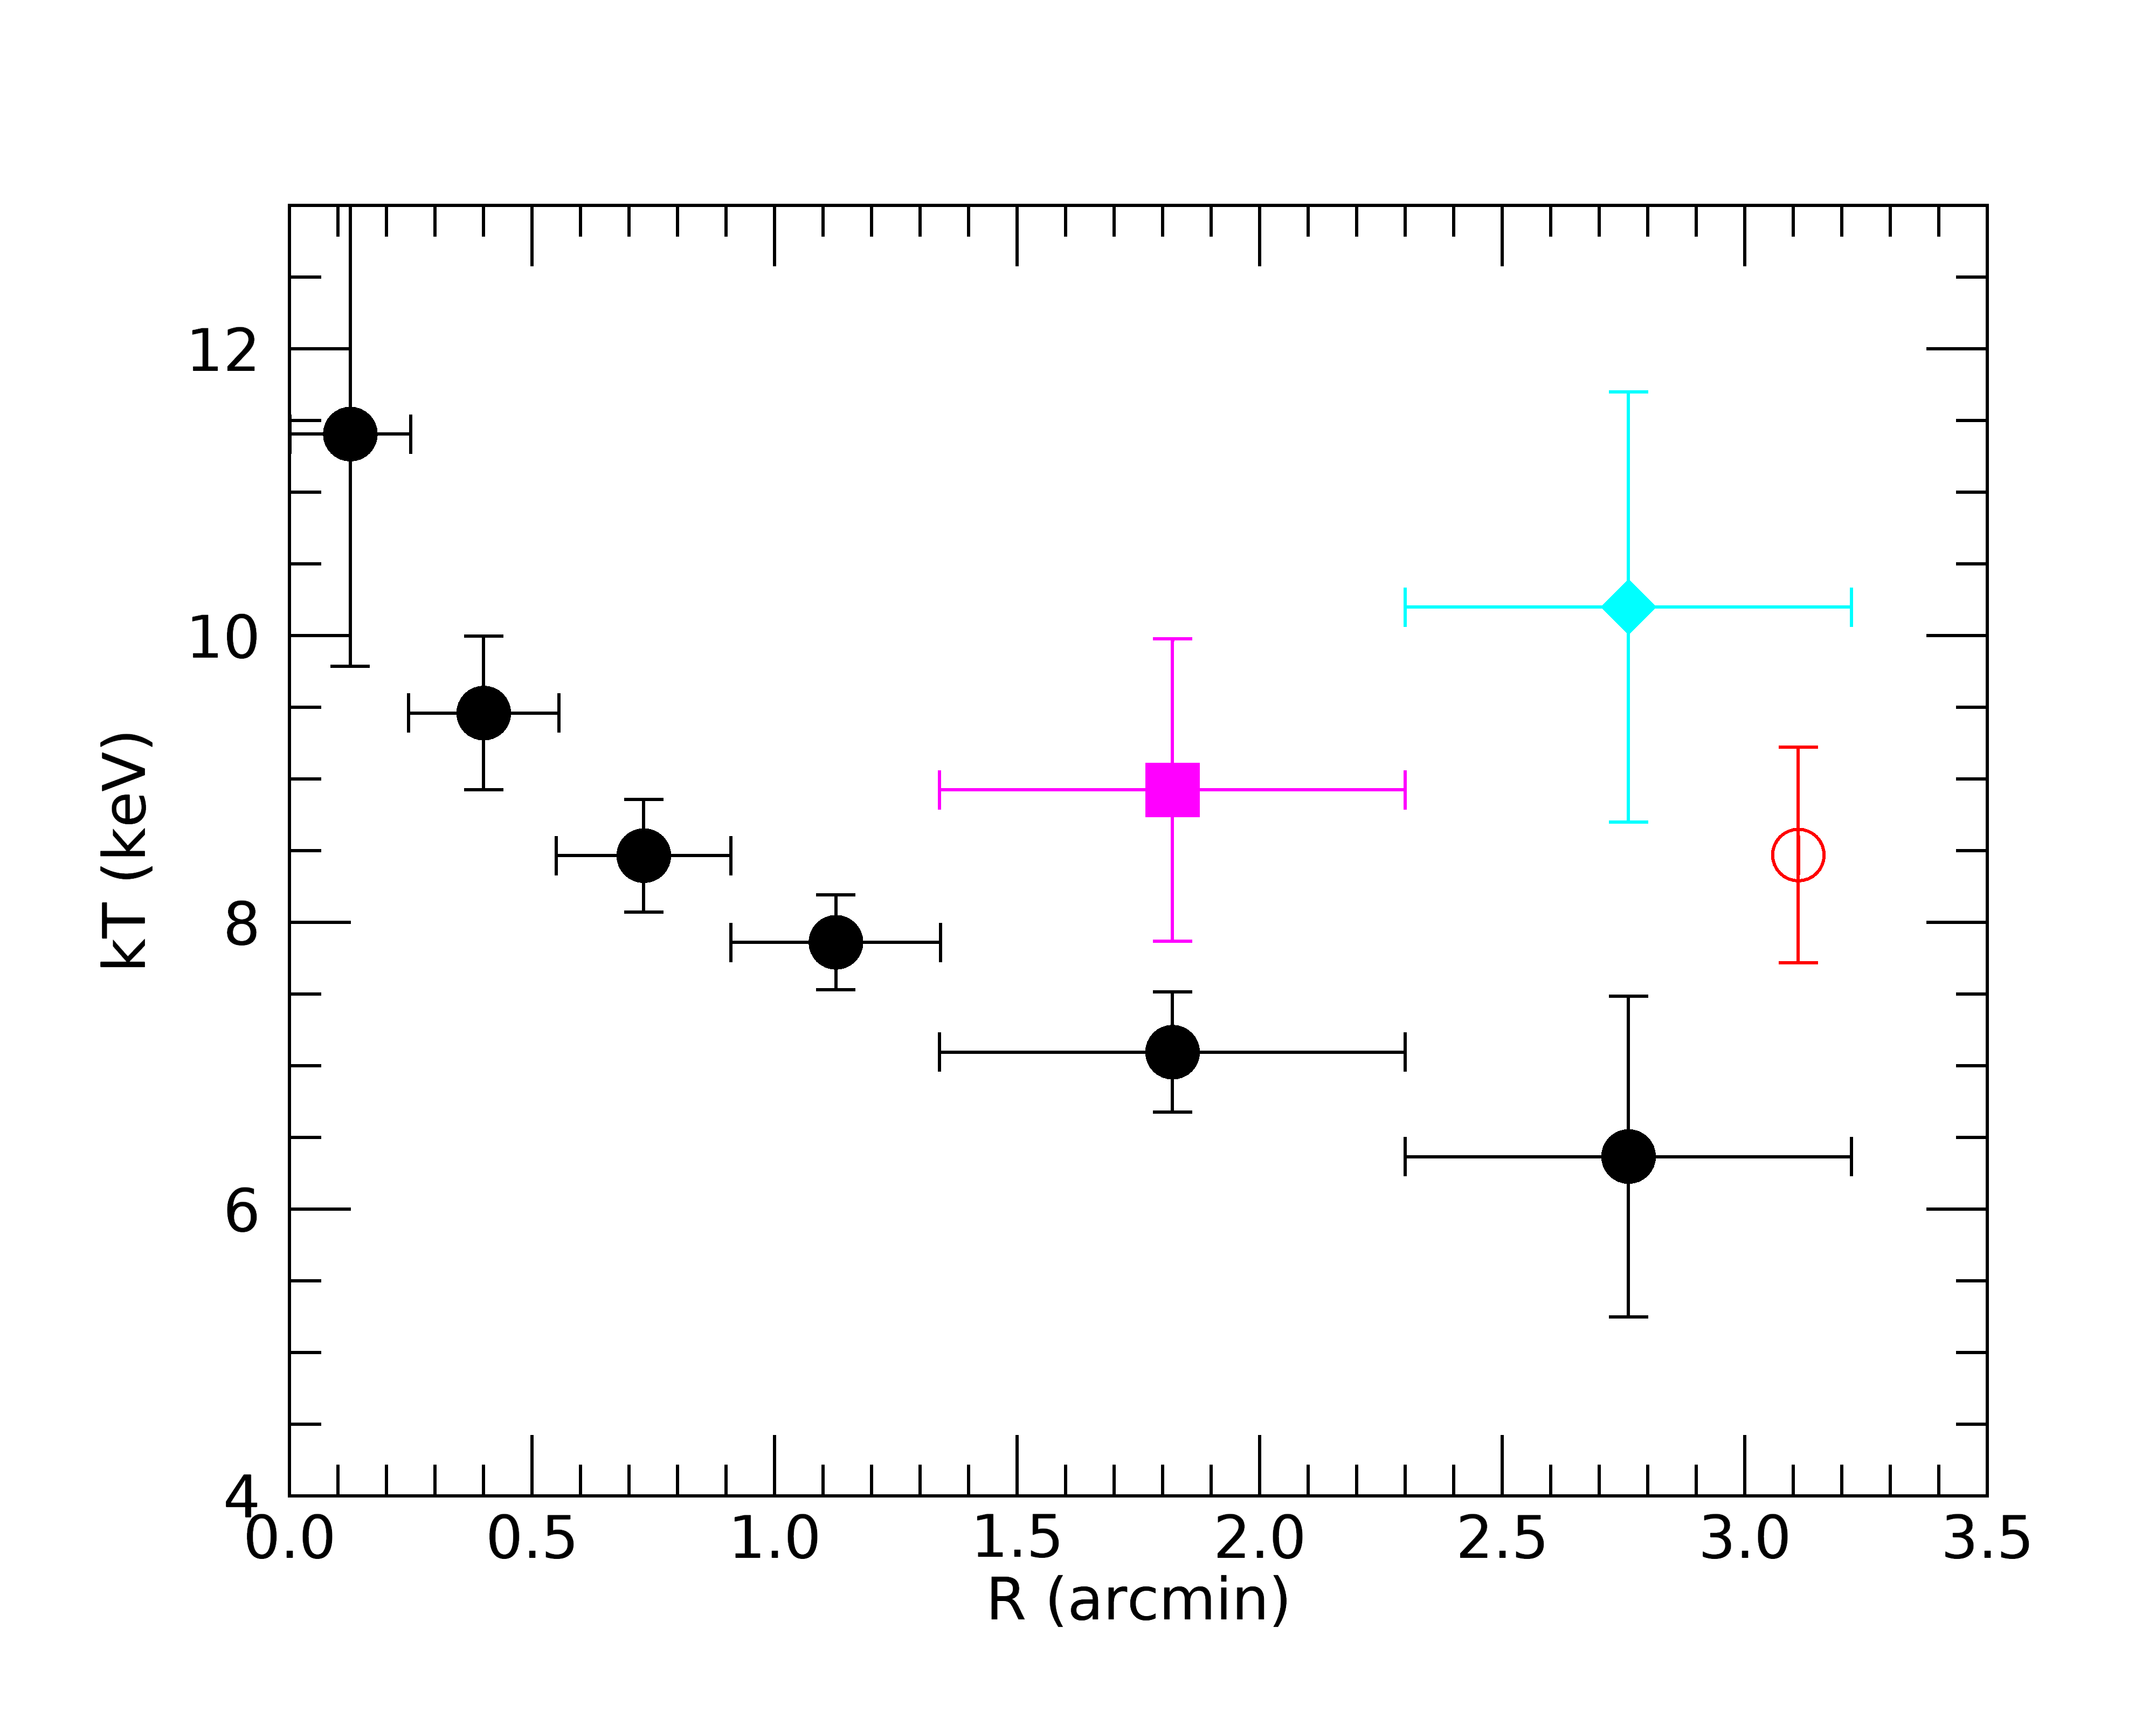
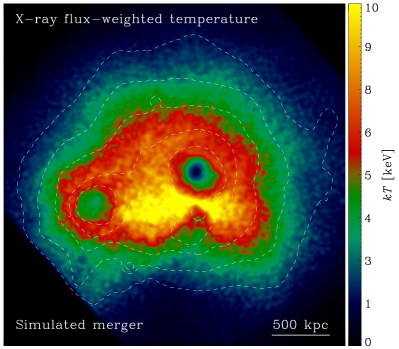
To recover the temperature profile of the main cluster component, we extracted spectra in 4 annuli around the centroid of the X-ray emission, ranging from to (black in Fig. 4). At larger radii, we extract spectra in sectors to separate the regions that could be affected by the subcluster (shown in cyan and magenta). We also extract a spectrum in the red annulus to estimate the mean temperature of the subcluster B. We note that the bright emission which may look like the core of the subcluster is clearly associated with a point source in the Chandra image and is thus excluded from our analysis. The resulting temperature profile is shown in the right panel of Fig. 4. The main component A shows a decreasing temperature profile from the centre to the outskirts, with no indication of a cool core, corroborating that the cluster is not relaxed. The mean cluster temperature, measured in a sector excluding the interaction region, amounts to . This value is rather high compared to the X-ray temperature expected from the temperature vs. X-ray luminosity correlation, namely as computed from the correlation given in Böhringer et al. (2013). Moreover, we noticed significant temperature variations at the same radii with the eastern sectors likely affected by the interaction with the subcluster and featuring a larger temperature than the corresponding regions in other directions. Interestingly, the subcluster B also shows a high temperature of .
4.2 A radio halo in A1430-A
| Object | Property | Value |
|---|---|---|
| halo | ||
| (A1430-A) | ||
| Pillow | ||
| (A1430-B) | ||
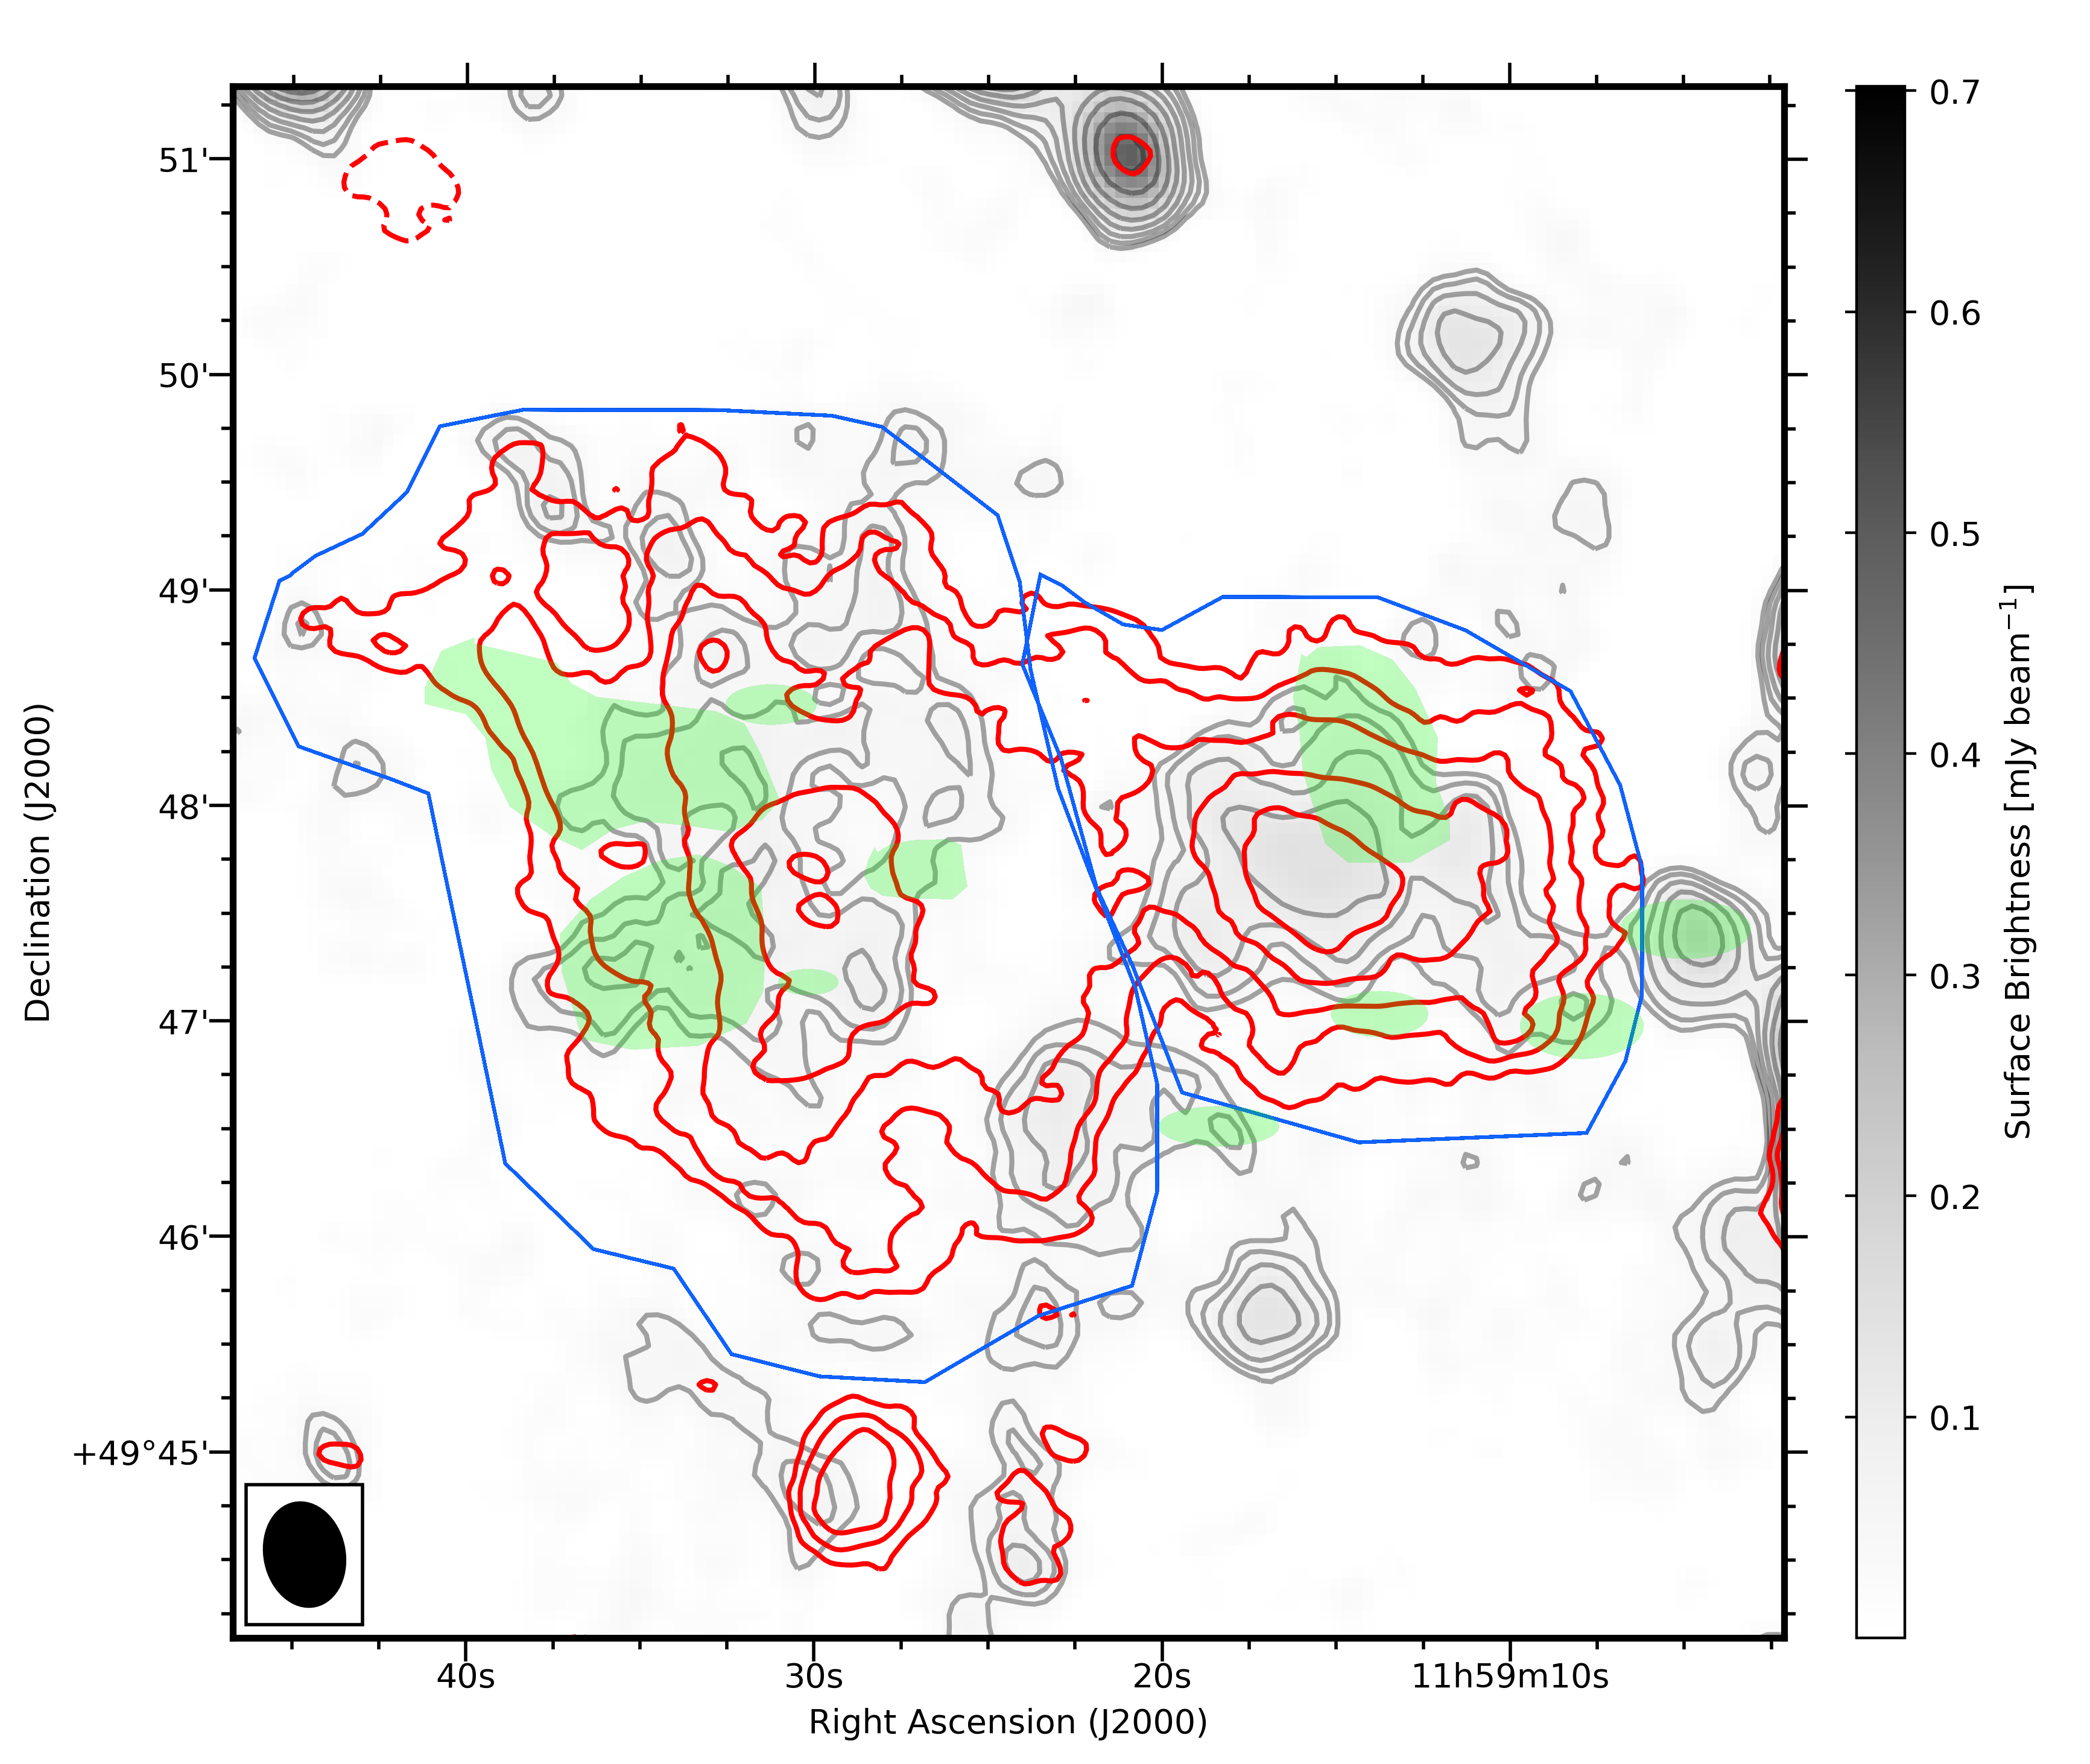
In the field of A1430, no diffuse emission has been previously reported. For the first time, the LoTSS observations showed evidence for extended, diffuse radio emission in this cluster. As discussed in Sec. 3.2, the bright, tailed radio galaxies and other compact sources in the field have to be subtracted before the diffuse emission can be imaged at a low resolution allowing to determine the flux density and morphology of the diffuse emission.
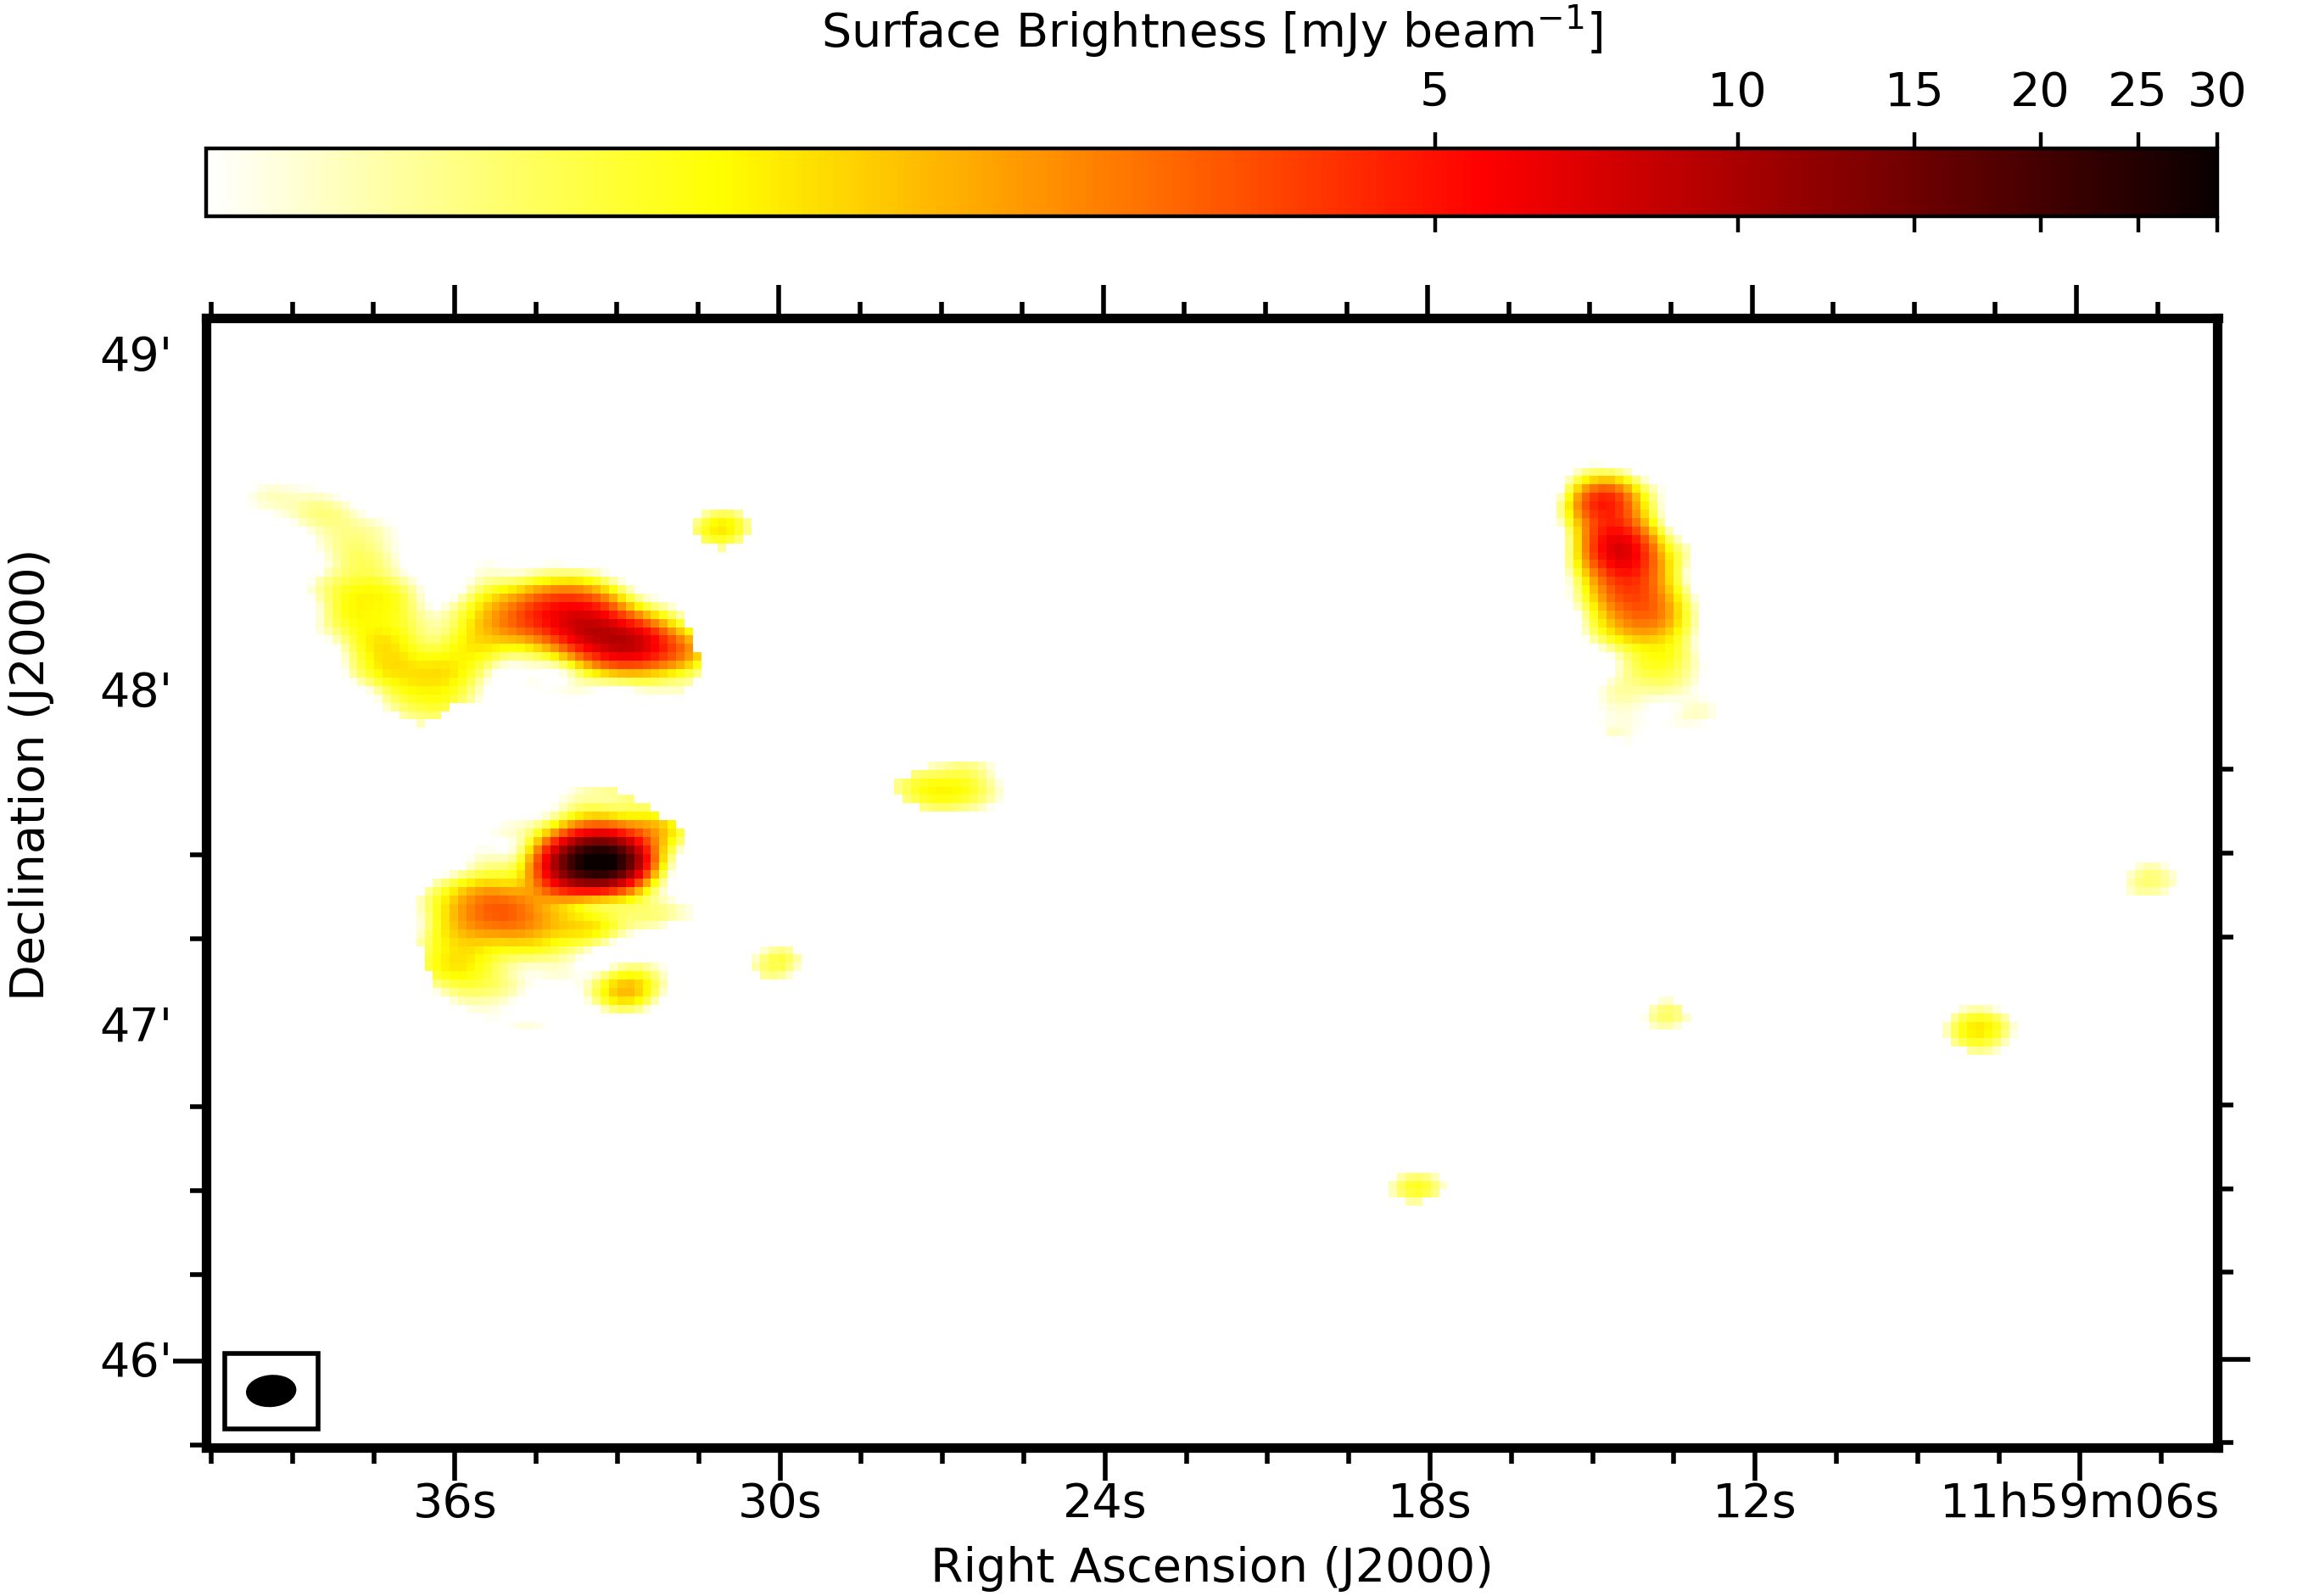
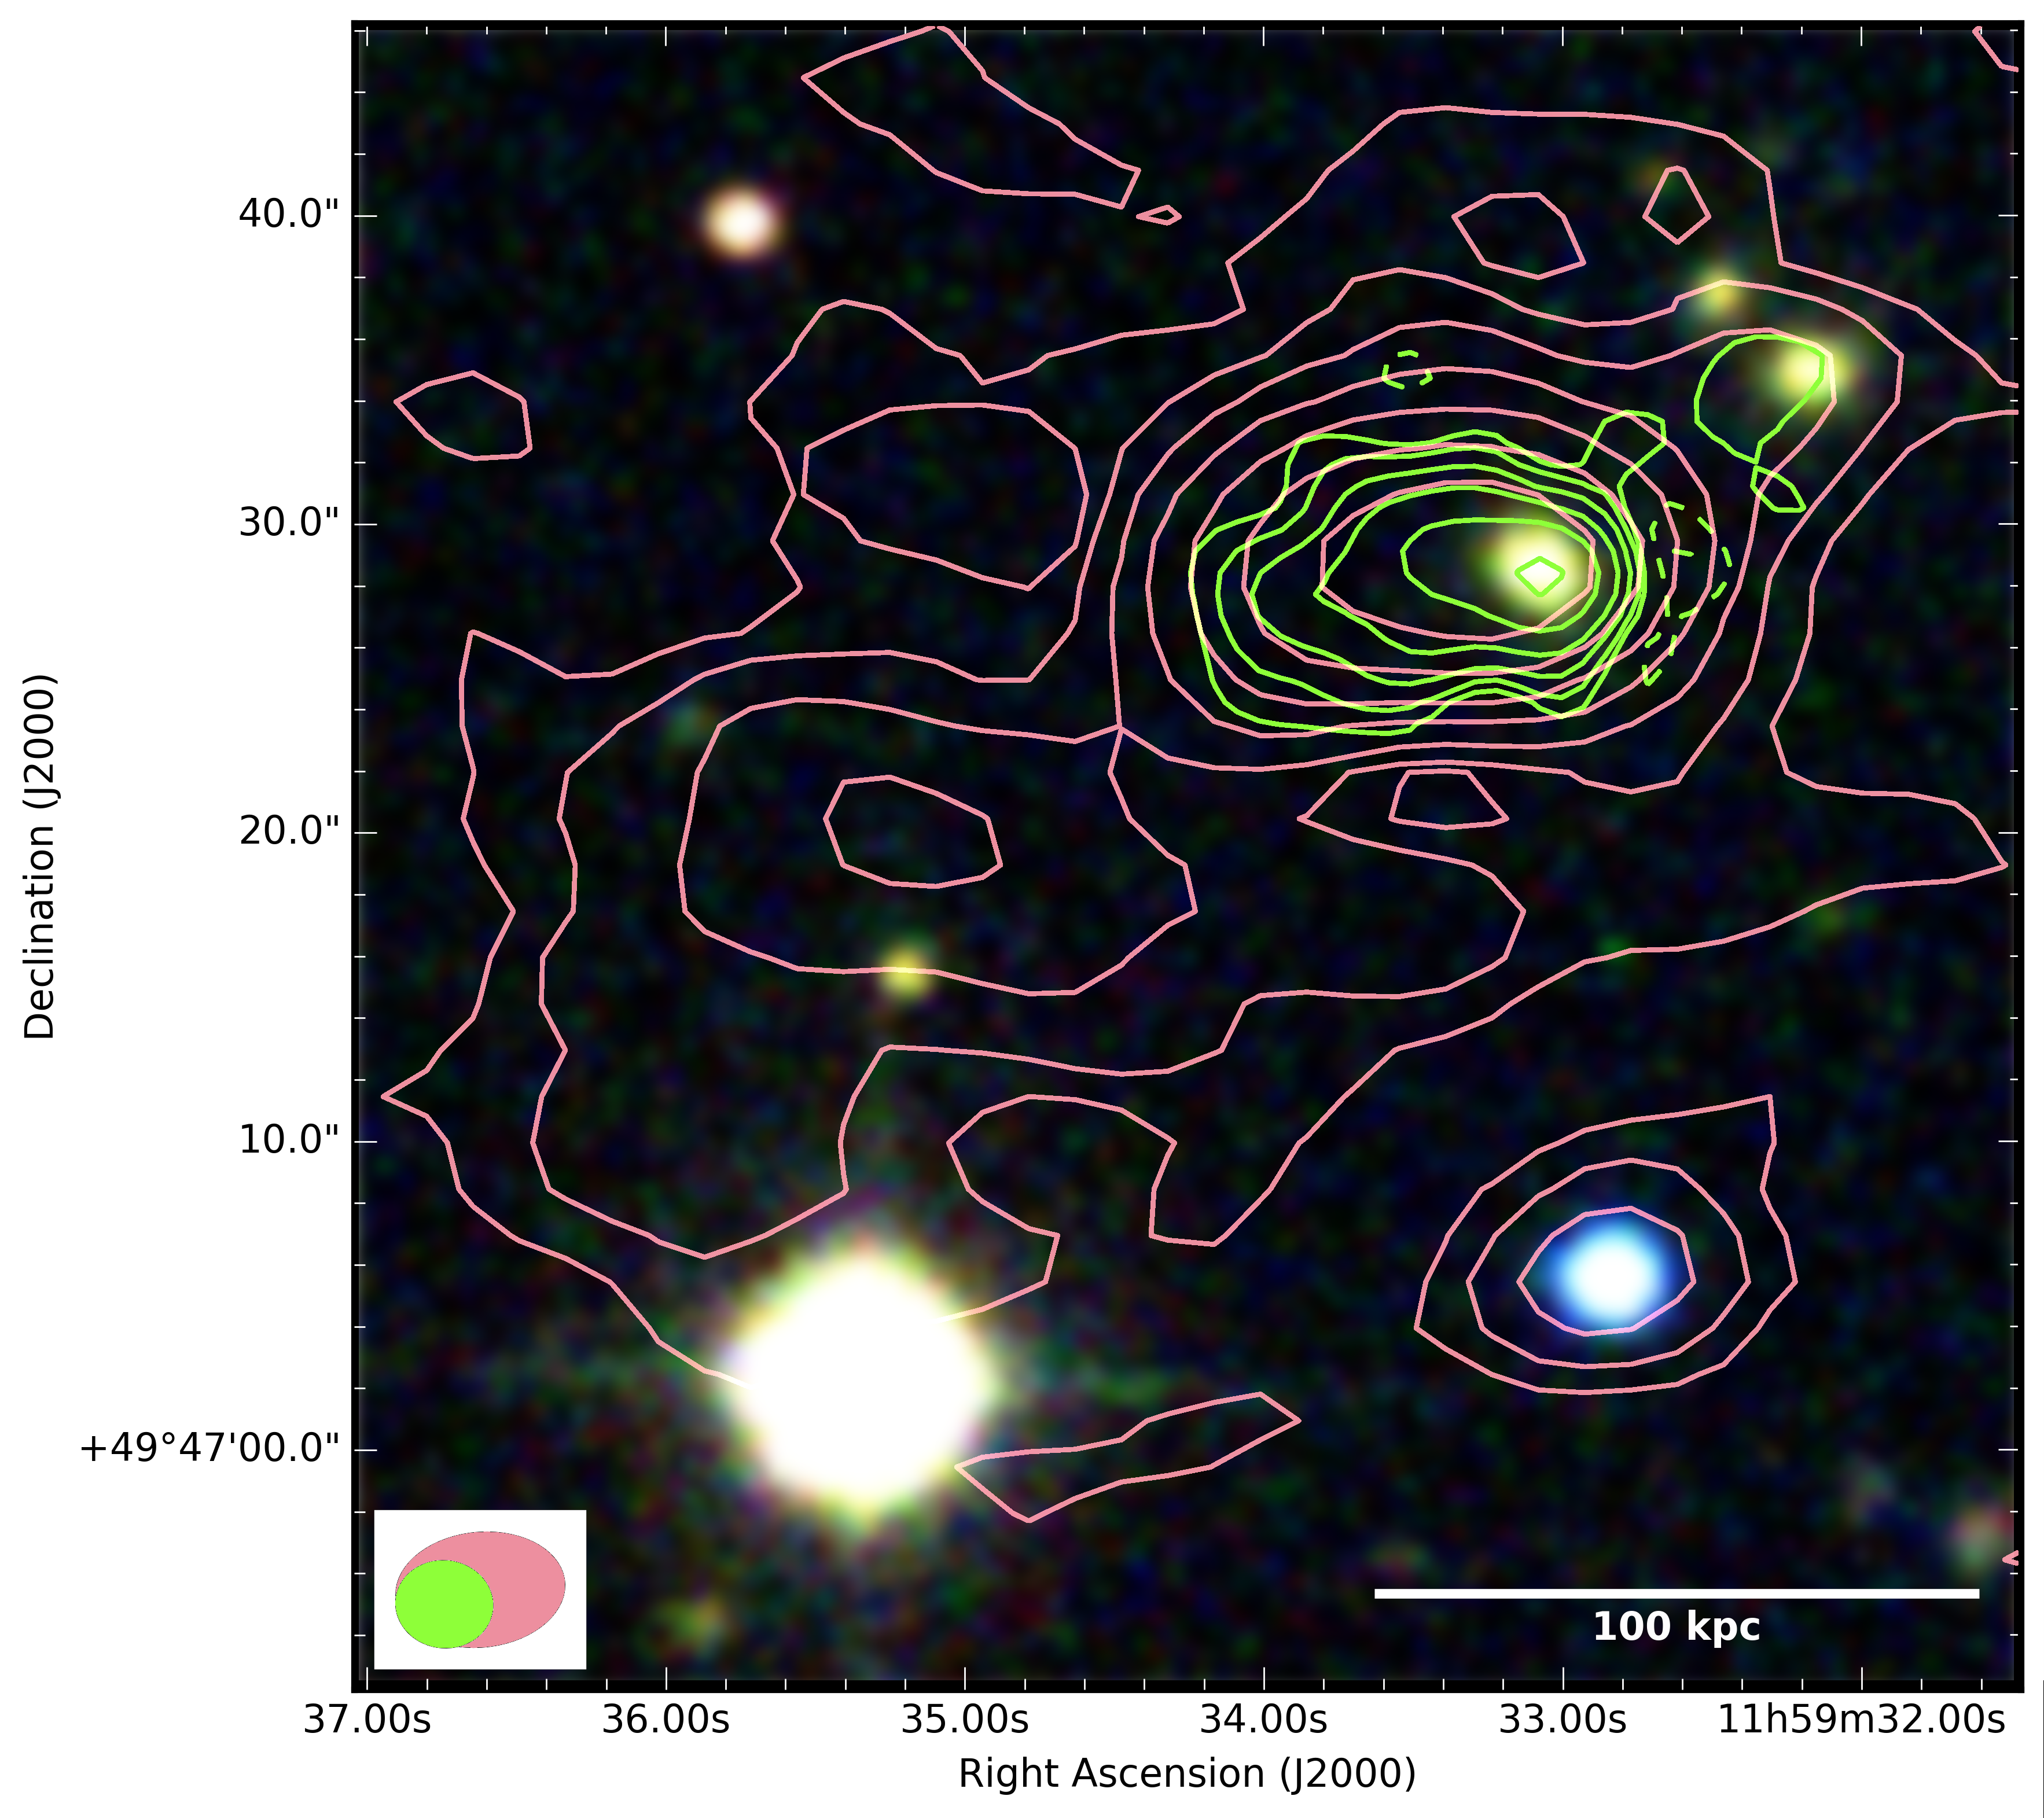
After subtracting the radio galaxies we re-imaged with a resolution of about 25 arcsec, see Fig. 8. The main cluster component A clearly shows diffuse emission with a largest linear size of about 700 kpc and a morphology very similar to the X-ray morphology. Based on these morphological properties, we classify the diffuse radio emission in A1430-A as a radio halo.
For the halo, we measure a flux density of ; see Fig. 9 for the area of the measurement. The flux density corresponds to a rest-frame luminosity .
van Weeren et al. (2020) reported a higher flux density for the halo, namely . There are two reasons for this difference: van Weeren et al. (2020) are using the integrated flux densities obtained from fitting exponential profiles. This increases the flux density since the halo is extrapolated to the very low surface brightness regime. Moreover, with the method applied here we subtract for the radio galaxy c 6 mJy more than with the -cut method, see Sec. 3.2 for a discussion.
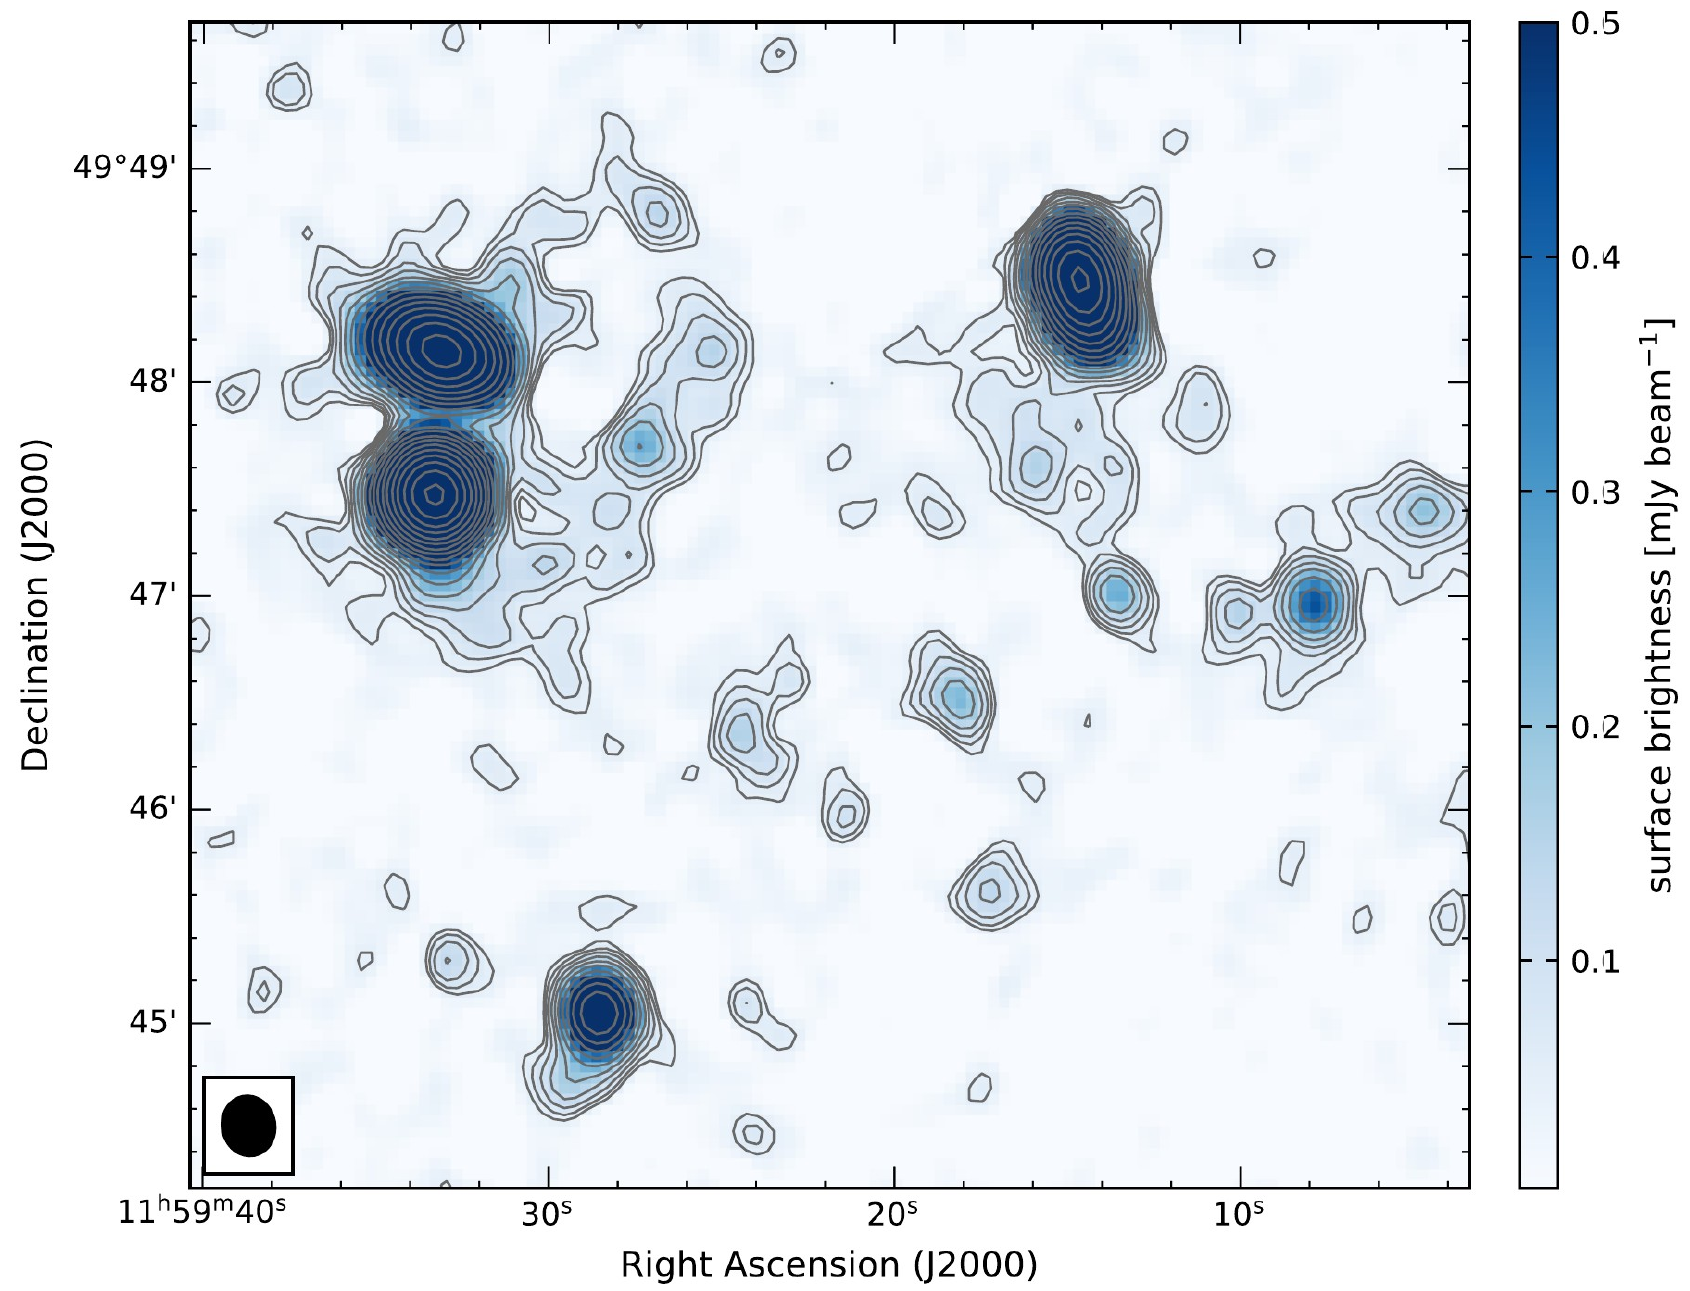
There is also evidence for diffuse emission in the galaxy cluster in the VLA L-band image for both the main cluster component A and the subcomponent B, see Fig.3. Similar to the LOFAR image, the bright radio galaxies, see Fig. 7, and fainter compact sources need to be properly subtracted at 1.5 GHz before imaging the low surface brightness diffuse emission at a low resolution. The medium-resolution compact source subtracted image is shown in Fig. 11. The image is produced at resolution using C- and D-configurations data and using robust=0.6. The halo is clearly detected and its morphology basically agrees with the one recovered with the LOFAR at 144 MHz, see Fig. 9. The halo is less extended than in LOFAR, likely due to a lower signal-to-noise ratio in the VLA image. At 1.5 GHz, we measure a flux density of for the halo in A1430-A. The flux density uncertainty is estimated according to Eq. 1. The low signal-to-noise ratio, which determines to which extent the surface brightness distribution can be recovered, and the remaining compacted sources, which are too faint to be subtracted, might affect the halo flux density measurement beyond the given uncertainty.
The corresponding rest-frame radio power is . The flux densities, determined from the VLA and LOFAR low resolution images, correspond to a spectral index , a value which is typical for radio halos (Feretti et al., 2012).
With the LOFAR and VLA results at hand, we reconsider the scenario that the diffuse emission found in the main cluster might actually originate from an extended lobe of the radio galaxy c. As found above, the halo morphology is at both frequencies, LOFAR and VLA, very similar to the X-ray morphology and the extended emission shows a rather uniform spectral index of . This disfavours that this emission is an old lobe of the radio galaxy, instead it corroborates the classification as radio halo.
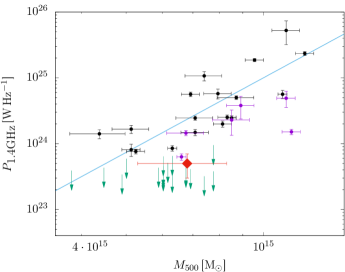
Halos in galaxy clusters with an X-ray luminosity similar to the one in A1430 show a significant variety of rest-frame radio luminosities, see, e.g., the clusters compiled by Cassano et al. (2013). For instance, the halo in Abell 1995 has a radio power at 1.4 GHz of (Giovannini et al., 2009), the one in Abell 545 has (Bacchi et al., 2003), the one in Abell 773 has (Govoni et al., 2001) and the one in Abell 2256 has (Clarke & Ensslin, 2006). Compared to the rest-frame radio power of these halos, the one in A1430-A is less luminous, see Fig. 10. Recently, Cuciti et al. (2018) reported in the clusters Abell 1451 and ZwCl 0634+47, which show an X-ray luminosity similar to the one of A1430-A, two radio halos with a radio power of and , respectively. These halos are underluminous with respect to the luminosities of radio halos in samples compiled before. According to the nomenclature introduced by Brown et al. (2011) and used by Cuciti et al. (2018), the halo in A1430-A as observed at 1.5 GHz belongs to the class of underluminous halos.
There is no clear understanding yet why halos, such as the one in A1430-A, are underluminous. There could be a selection bias, since recovering halos with a total flux density of the order of 1 mJy is still challenging, hence, many faint halos are possibly still undetected. As a consequence, samples compiled so far may tend to comprise only brighter halos at least for less massive galaxy clusters. Irrespectively of such a selection bias, it becomes evident that halos in clusters with similar X-ray luminosity show a variety of radio powers. We can only speculate about the reason for this variety. Clearly, there must be some transition phase in the evolution of a cluster from showing no halo, presumably when the cluster is relaxed, to showing a ‘fully powered’ halo, presumably as a result of a major merger. Therefore, we expect to observe some clusters with halos showing an intermediate radio power. Moreover, Cuciti et al. (2018) speculate that underluminous halos are caused by minor mergers, where only part of the ICM becomes turbulent, hence the halo would be restricted to a subvolume of the cluster. For A1430-A the radio and X-ray surface brightnesses correlate nicely, therefore we consider the scenario of a minor merger as unlikely. Finally, Cuciti et al. (2018) speculate that underluminous halos might reflect the off-state of halos, where the hadronic halo becomes visible. Since there are already upper limits at lower flux densities, it is not likely that the halo in A1430-A is a hadronic one. Since we consider neither the off-state or the minor merger scenario likely for A1430, we speculate that A1430 is actually in the transition phase between the off-state and a ‘fully powered’ halo. The absence of a cool core, see Fig. 4, may indicate that we actually witness the late state of a merger, in which the ICM has been mixed and had no time to form a cool core yet.
4.3 Diffuse emission related to subcluster A1430-B
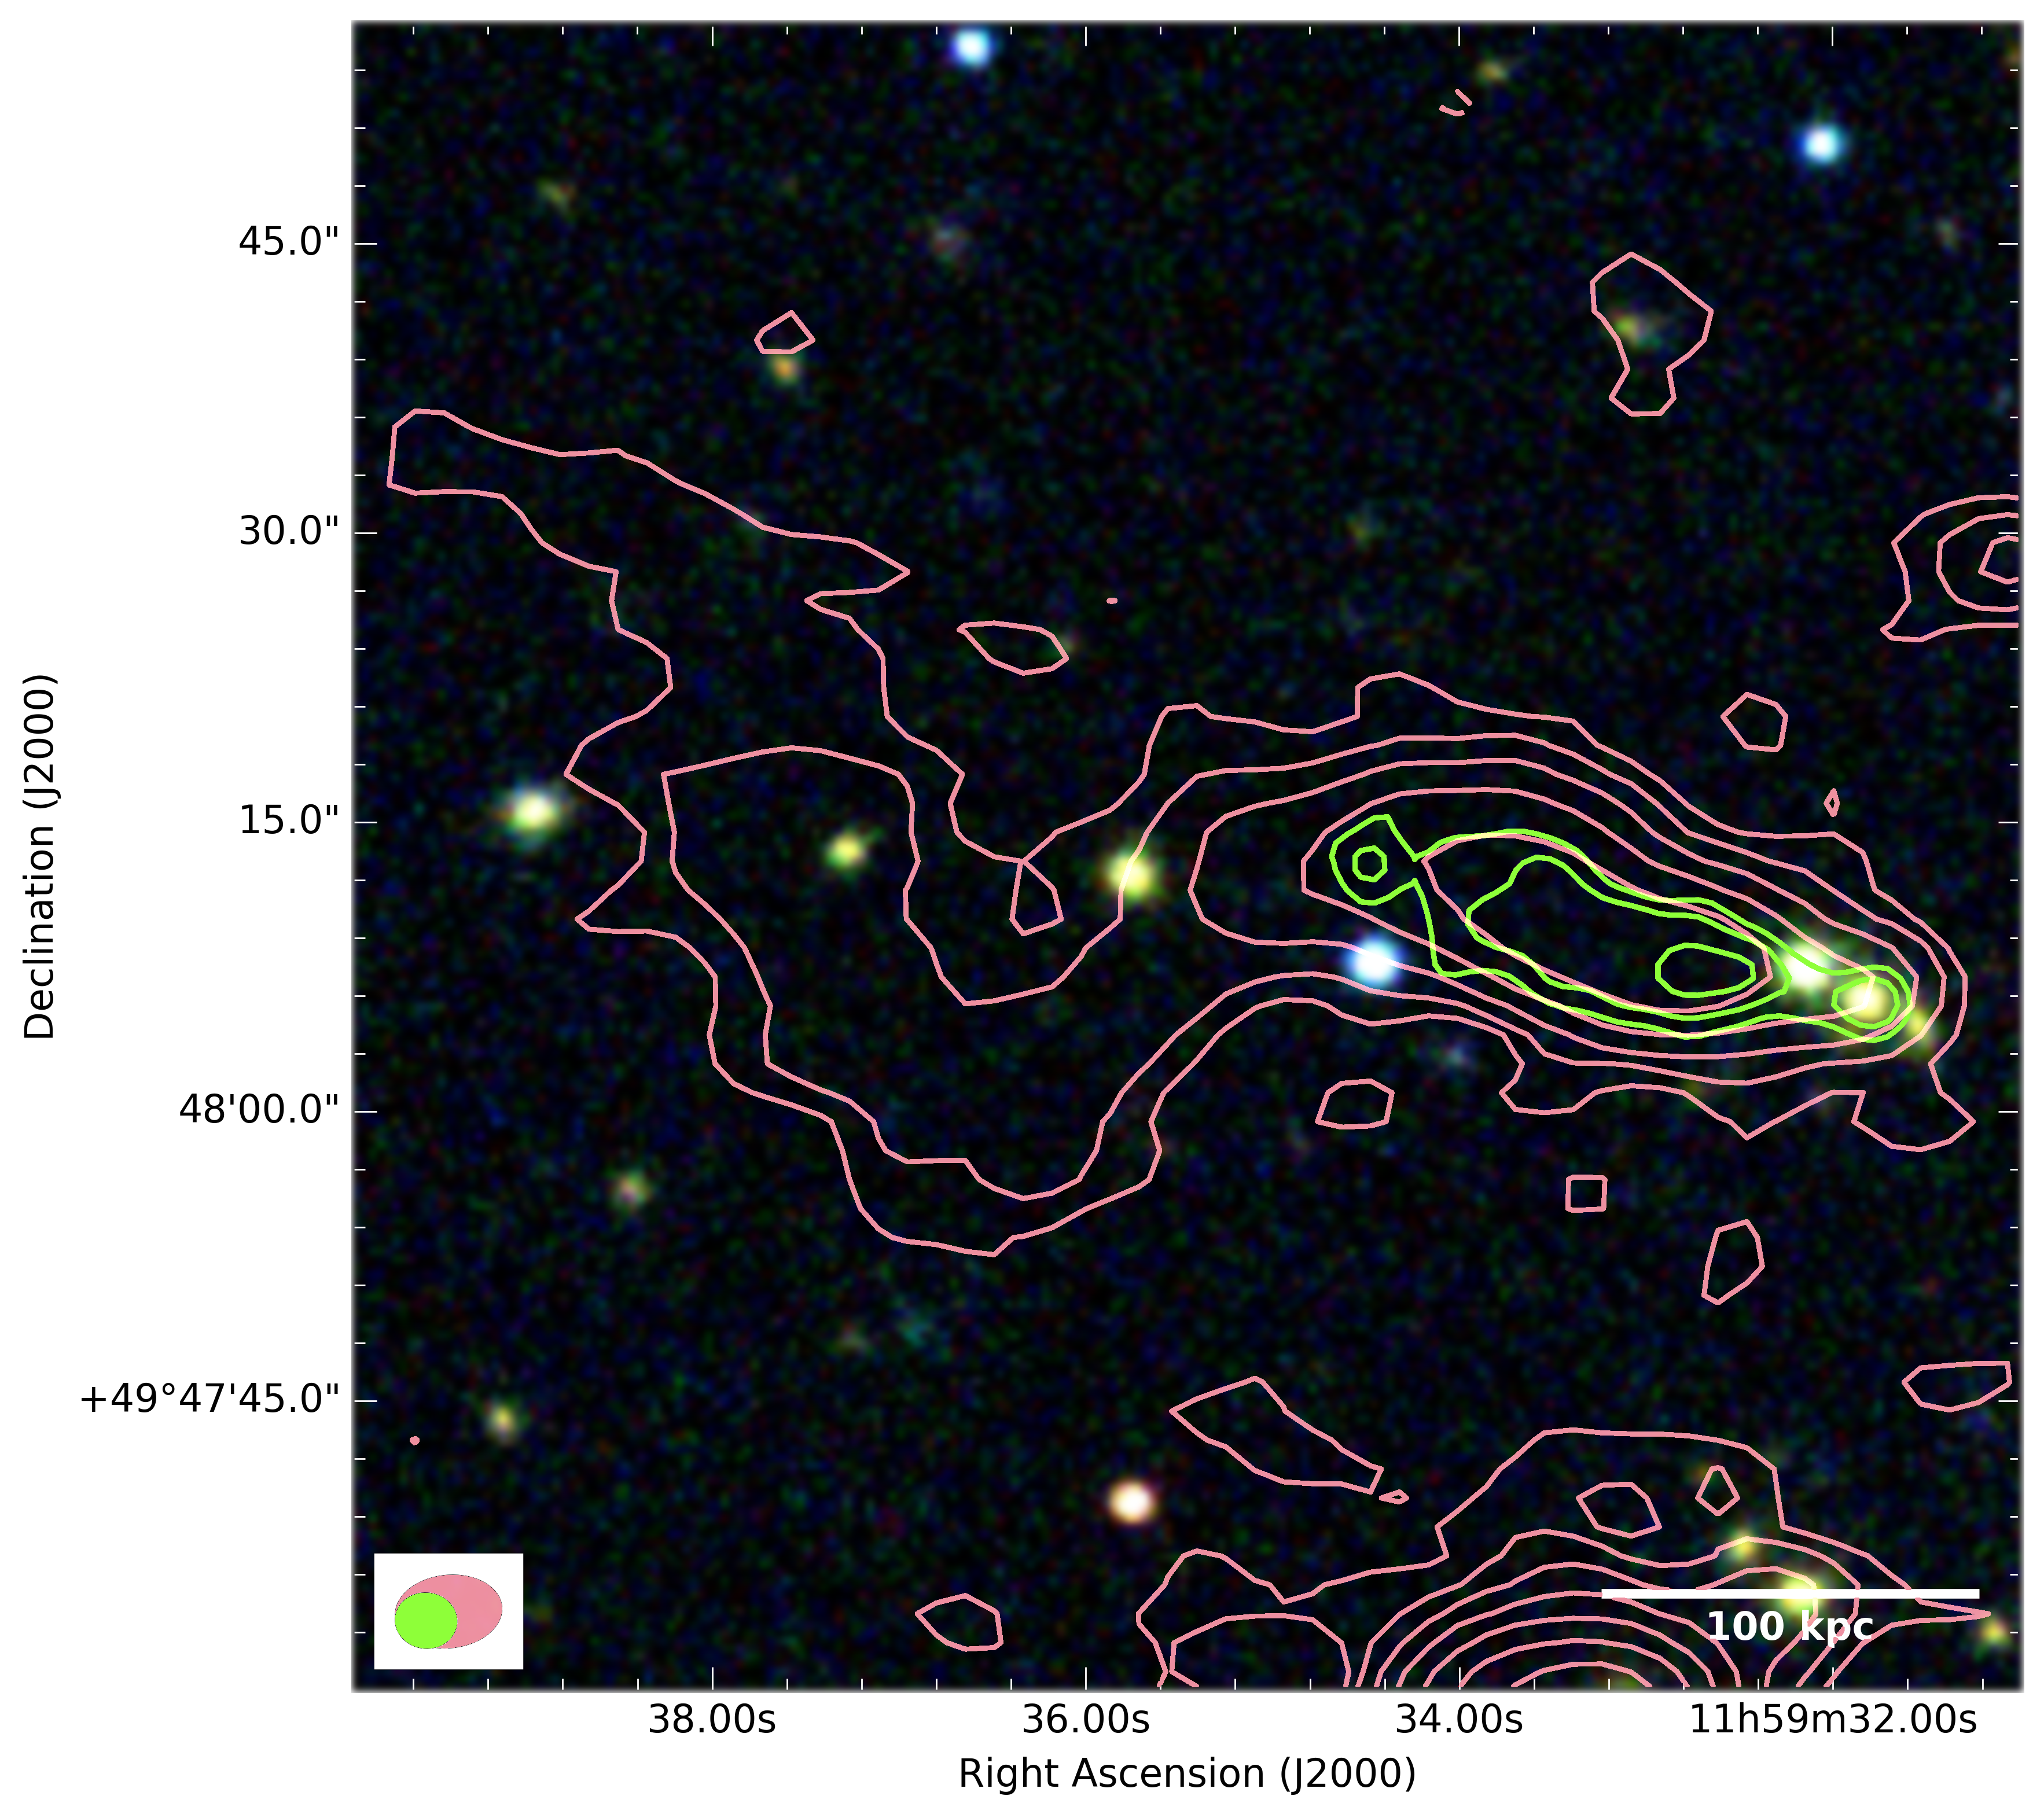
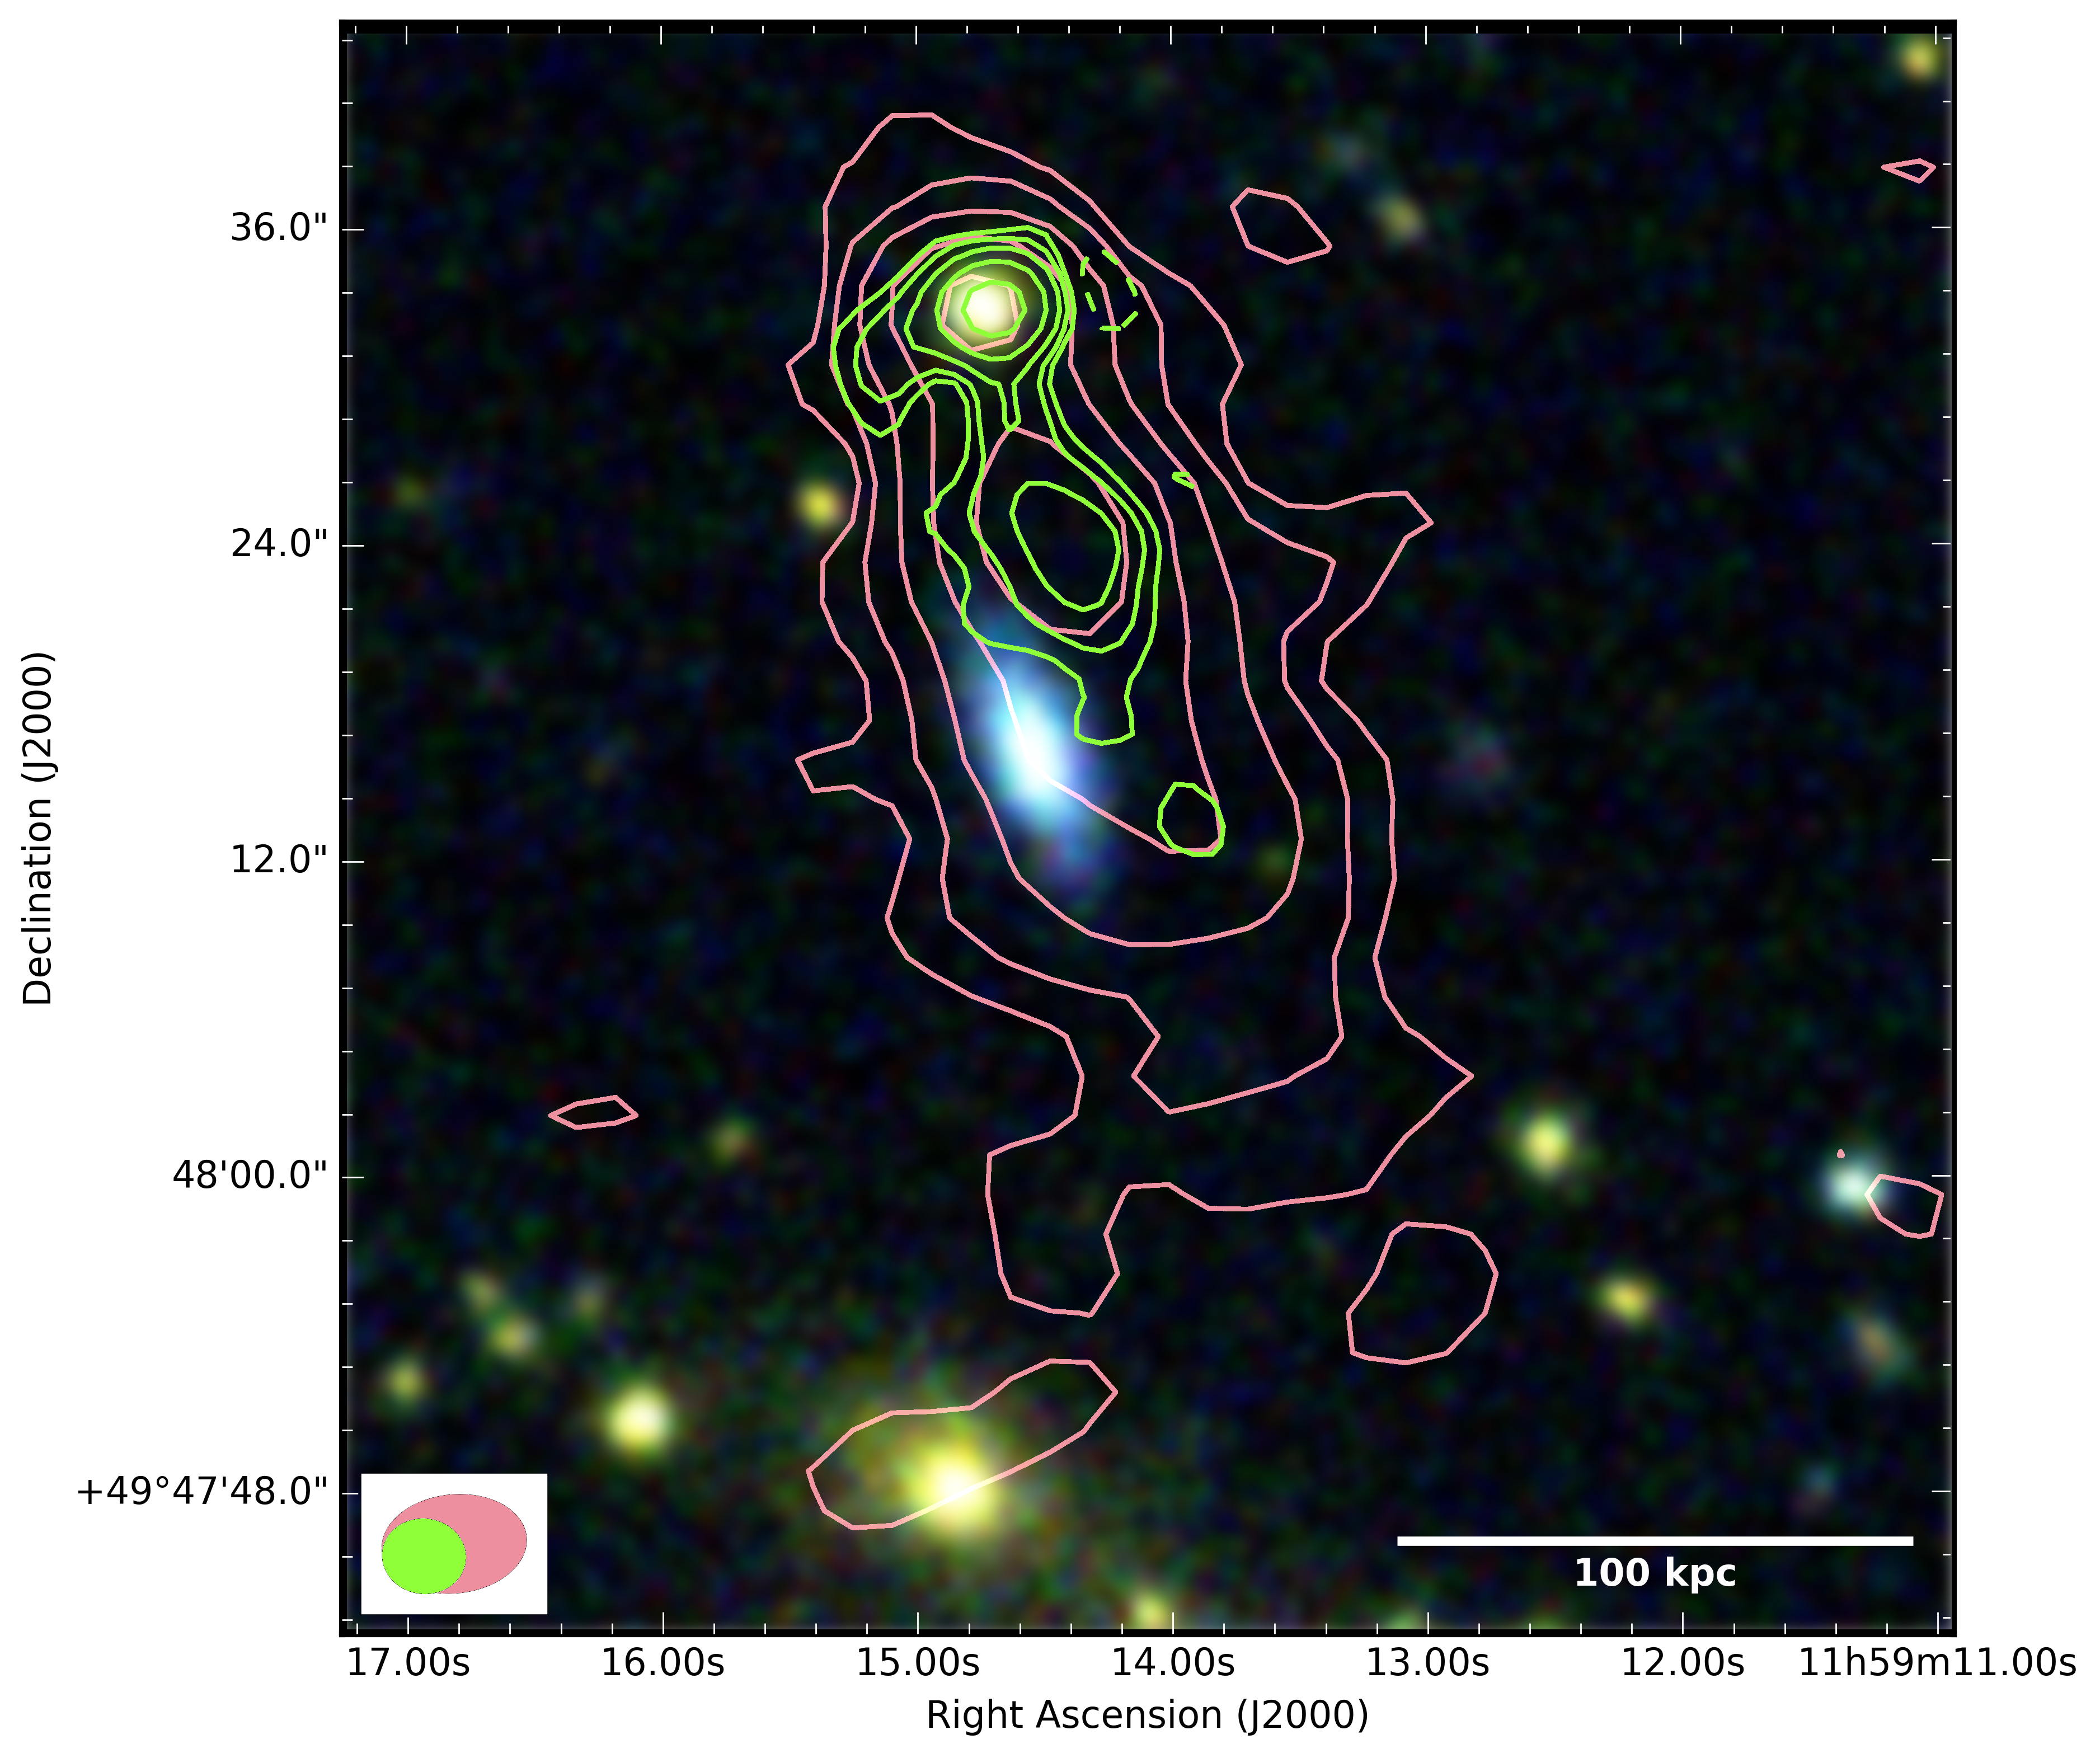
The most striking radio emission feature in A1430 is large diffuse emission apparently related to the subcluster B, see Fig. 8. Due to its morphology, we dub it in the following ‘Pillow’. It is located to the west of the two radio galaxies A and B.
Because the tails of the two radio galaxies are directed towards the east, the majority of the Pillow emission does not overlap with these radio galaxies, only part of the emission of the Pillow to the east is difficult to recover due to the radio galaxy subtraction. The emission region has a large extent, at least about 1.2 Mpc in diameter. The surface brightness of the emission appears to be quite smoothly distributed, without any evident outer edges, large filaments, or other discontinuities.
The flux density of the emission amounts to , see Fig. 9 for the region where the flux density has been measured. The flux density corresponds to a rest frame luminosity of .
One may speculate that the Pillow actually originates from old lobes of one or more radio galaxies. Candidates would be evidently the galaxies a and b. However, we consider this very unlikely for the following reasons: Firstly, galaxy a has a clear head-tail morphology with the tail to the east, suggesting that the galaxy is falling into the subcluster and making it unlikely that luminous lobe emission is found to the east. Secondly, also galaxy b shows a head-tail morphology with a tail to the south-east, indicating that the galaxy is falling into the cluster. Moreover, the Pillow is rather luminous and its surface brightness roughly agrees with the X-ray surface brightness, except towards the east, where the presence of the radio galaxies a and b prevent us from determining its morphology. In addition to the orientation of a and b, also the morphology of the Pillow and its correlation to the X-ray surface brightness disfavour that the Pillow originates from old lobes.
In the L-band low resolution image the Pillow is clearly visible as well, see Fig.11. We measure a flux density of after source subtraction. This implies that the Pillow has a moderately steep spectrum with a spectral index . We note that the subtraction of the compact sources make up a large share of the flux density uncertainty. Moreover, the extended emission with a surface brightness only a few times above the noise level is notoriously difficult to deconvolve in interferometric data. To definitely determine the surface brightness distribution of the Pillow substantially deeper observations are required. However, the detection of patches of diffuse emission, especially at the location where the peak of the Pillow has been found in the LOFAR image, clearly indicates a spectral index flatter than about , disfavouring that the emission is caused by fossil plasma ejected by an active galactic nucleus (AGN) some time ago. The spectral index rather suggests that the Pillow is caused by turbulence or shocks in the ICM as it is the case for halos or relics, respectively.
The emission here is located at the cluster periphery of A1430-A. A conceivable scenario for the origin of the Pillow is that A1430-A underwent a major merger some time ago, the same merger which causes the halo in A1430-A, and the Pillow is actually a radio relic caused by a large merger shock. The location of the Pillow would be roughly in agreement with the elongation of A1430-A, indicating the merger axis. To not prevent a merger shock front from forming, A1430-B would have to have some offset along the line of sight w.r.t. to A1430-A. However, the Pillow does not show the outer edge typical for relics, hence, the Pillow morphology differs significantly from the one common for relics. The LOFAR and the VLA images revealed a similar morphology of the Pillow, excluding a clear spectral steepening, which would be characteristic for a relic. We note that the diffuse emission in Abell 2256 (van Weeren et al., 2012b; Owen et al., 2014) also shows a morphology very different from ‘typical’ relics and is considered as the rare situation where a relic is believed to be seen face-on. The relic in Abell 2256 is highly polarised at 1.5 GHz, reaching values as high as 70 % (Owen et al., 2014). We do not find evidence for polarised emission for the Pillow in the VLA data, however, due to the low surface brightness of the Pillow we can only rule out a fractional polarisation as high as a few ten percent. To summarise, we do not find any confirming evidence for a classification as relic, in particular neither an outer edge coinciding with a jump in X-ray surface brightness nor an apparent gradient in the spectral index, nor polarised emission. We therefore consider it as unlikely that the Pillow is a radio relic related to a merger shock front, however, we cannot fully rule out that possibility.
If the Pillow is not a relic, it most likely originates from turbulence, similar to radio halos. Recently, radio emission has been reported for the filaments which connect the two clusters pairs Abell 399 – Abell 401 (Govoni et al., 2019) and Abell 1758N – Abell 1758S (Botteon et al., 2018b, 2020). This may indicate that in an early stage of a galaxy cluster merger, when the two clusters are still approaching each other, the medium in the connecting filament gets sufficiently disturbed to generate low Mach number shocks and to accelerate thermal or mildly relativistic electrons. Brunetti & Vazza (2020) showed that those radio bridges, extending on scales larger than clusters, may originate from second order Fermi (re-)acceleration of electrons interacting with turbulence originating from the complex dynamics of substructures in the filaments. The spectral index we found for the Pillow indeed agrees with the required steepness of to or steeper for the proposed acceleration mechanism. A plausible scenario for the origin of the Pillow therefore is, that A1430-A and A1430-B are significantly separated along the line of sight and we actually observe the radio emission of a connecting filament in projection. To test this scenario, deeper observations would be crucial to firmly determine the spectral properties of the Pillow.
Interestingly, the X-ray temperature in the sector between the two clusters, see Fig. 4, left panel (magenta region), is much higher than at the same distance from the cluster centre in other directions and the same distance from the main cluster, see Fig. 4, right panel. It suggests that adiabatic compression, shock dissipation or turbulence resulting from the interaction of the subcluster with the main cluster may have already increased the temperature in that region, possibly similar to the situation in the cluster pair Abell 1758N and Abell 1758S (Botteon et al., 2018b). Interestingly, also the region to the north-east of A1430-A (cyan region) shows a rather high temperature. We speculate that this is related to a merger shock front originating from the merger which caused the halo in A1430-A and is not related to the Pillow emission.
4.4 Redshift separation of A1430-A and B
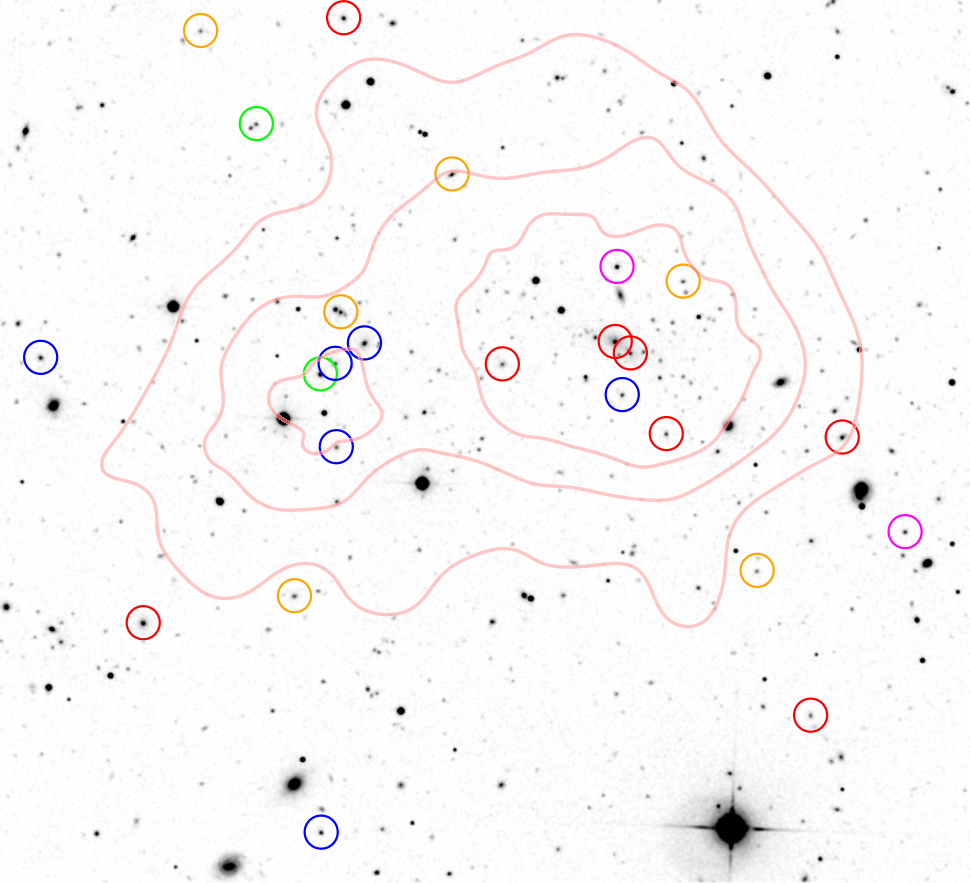
Fig. 6 shows the SDSS -band image where 19 out of 27 galaxies are marked with a colour-coding that represents redshift subintervals. Though there is a concentration of the red symbols towards the right-hand side and of the blue ones towards the left-hand side, there is no clear spatial separation of the redshifts. Therefore, substructures should be additionally identified in redshift space. We decided for an approach that is based on a combination of the redshift distribution and the positions of the BCGs.
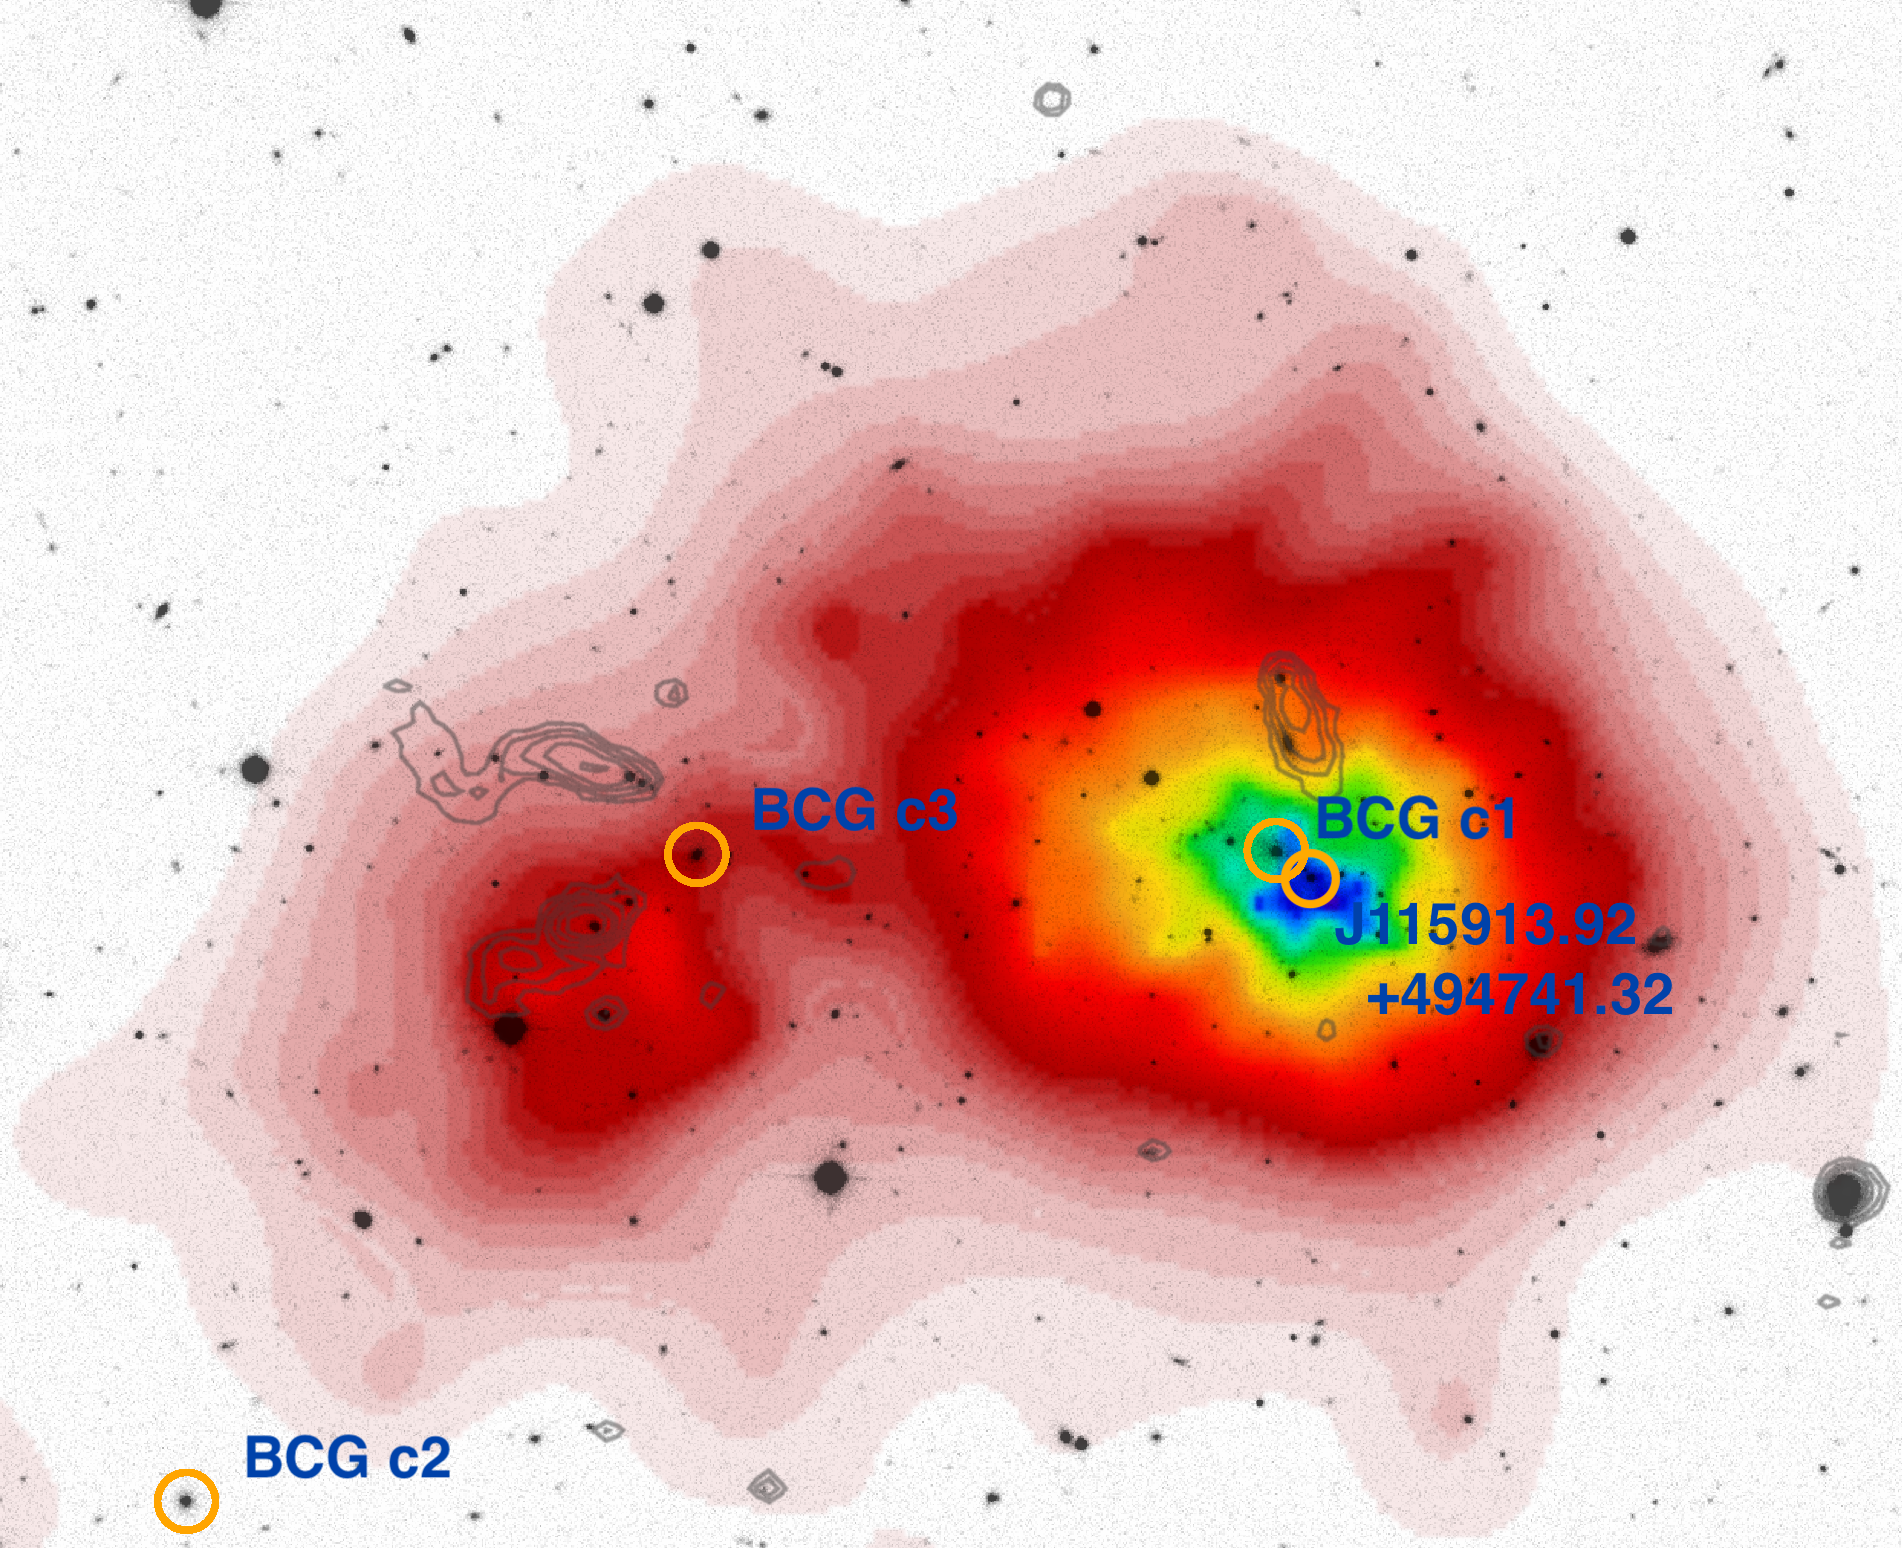
The ‘Optical Catalog of Galaxy Clusters Obtained from an Adaptive Matched Filter Finder Applied to SDSS DR6’ (Szabo et al., 2011) lists three BCG candidates in the cluster. For the candidate BCGs c1, c2 and c3 redshifts of , and no spectroscopic redshift, respectively, were given. In SDSS DR16, a spectroscopic redshift of is reported for BCG c3. In Fig. 5 the candidate BCGs are marked with orange circles.
We assume that the brightest galaxy in the sample, BCG c1, represents the bottom of the gravitational potential and its redshift is representative of the cluster. Moreover, we assume a typical velocity dispersion of km s-1 and classify all sample galaxies within the redshift range from to as members of cluster A1430-A (magenta and red symbols in Fig. 6). According to its redshift, the BCG c2 would belong to cluster A1430-A, but the BCG c3 would not. We consider BCG c3 as the brightest galaxy in A1430-B with candidate members that are selected with redshift from to (blue and magenta symbols). The redshift distributions associated with A1430-A and B overlap marginally (magenta symbols). Finally, galaxies with redshift smaller are considered as foreground (green symbols) and those with redshift larger as background (orage symbols). We compute the average redshift for members of A1430-A and A1430-B and find a mean redshift difference , or . If alternatively interpreted as a radial distance this would correspond to a separation of about .
Do the two samples related to A1430-A and B represent two clusters, or are they drawn from the same galaxy population? There are several straightforward approaches to probe a distribution for unimodality versus bimodality, or multimodality. We used Sarle’s bimodality coefficient
| (3) |
where is the sample skewness, is the sample excess kurtosis and is the number of objects in the sample (Pfister et al., 2013). A bimodality coefficient larger than the benchmark value for a uniform distribution points towards bimodality or multimodality. For the galaxies in the two substructures, we find , indicating a bimodal distribution.
The galaxies in the left part of Fig. 6 are scattered over the whole redshift range , which corresponds to a luminosity distance interval of and might indicate a large-scale filament nearly perpendicular to the plane of the sky.
The evidence for bimodality supports that the merger in A1430 does not take place in the plane of the sky but rather along the line of sight. The redshift difference of main cluster and subcluster indicates that either A1430-B is about 20 Mpc less distant than A1430-A, is at same distance as A1430-A and moves with about km s-1 towards the observer, or any combination of these two scenarios. The velocity difference is typical for merging clusters. However, we stress that this relative velocity needs to be achieved with a separation in the plane of the sky of about 1 Mpc. The large scatter of galaxy redshifts may additionally support that we observe here a large cosmic filament along the line of sight.
4.5 A similar merger in a cosmological simulation
To verify that it is plausible to assume that the subcluster moves with a significant velocity along the line of sight despite the separation of about 1 Mpc in the plane of the sky, we inspect a large cosmological simulation in search for mergers with characteristics as close to A1430 as possible.
The Three Hundred Project (Cui et al., 2018) introduces a large sample of hydrodynamical galaxy cluster re-simulations extracted from a periodic box of comoving length on a side, including physics such as gas cooling, star formation, and stellar/AGN feedback. Mass resolution in zoomed-in regions corresponds to M⊙ and M⊙ for dark-matter and gas particles, respectively. The gravitational softening length for these particles in the high-resolution zones was set to . Some of the advantages of this sample include: an improved modelling of subgrid physics, and a state-of-the-art implementation of the smoothed-particle hydrodynamics (SPH) scheme. Moreover, the large number of available snapshots allows an excellent coverage of cluster evolution.
We looked for a merging system with a similar mass ratio in a redshift range from 0.3 to 0.4. However, since major mergers are rare, we focused on those with central-to-subcluster mass ratios below 3:1. Similar to the clusters in A1430, we are mainly interested in separations of about in the plane of the sky and relative velocities along the line of sight of about .
From our suite of simulated galaxy clusters, we selected a merging system at redshift 0.333 with a mass ratio of 5:1, being the mass of the main cluster M⊙. Fig. 12 shows the X-ray surface brightness (left panel) and flux-weighted gas temperature (right panel) for our merging cluster example. Since there is an offset between simulated and observed gas temperatures for the largest cluster masses (see, e.g., Fig. 9 of Cui et al. 2018), flux-weighted temperatures have been scaled to roughly match A1430’s observed profile for the main cluster. We note, however, that cluster simulations tend to have cooler cores than real ones. While this renders a detailed comparison difficult, this does not affect our conclusions.
The projected distance between clusters in our example is kpc; whereas their relative velocity along the line-of-sight is km s-1, which is similar to the observed velocity difference of the subclusters in A1430. From the simulation snapshots, we observe that the subcluster is approaching, for the first time, towards the central one in a fairly radial orbit, still leading to an off-axis merger. Interestingly, as shown in the right panel of Fig. 12, the gas temperature increases between the clusters, indicating that the system is interacting. Moreover, there is also a region with enhanced temperature on a side of the main cluster, resembling the cyan region in Fig. 4. In the simulation, this is produced by a minor substructure merging earlier with the central one.
This example illustrates that it is plausible to assume that the main and secondary clusters in A1430 are in the process of a merger. In principle, we cannot exclude the possibility that the observed redshift difference between the clusters could either indicate that A1430 actually consists of two still physically separated objects. However, the temperature increase observed in sectors 6 and 7 of A1430 most likely suggests that the two objects are already interacting. Moreover, the simulation shows that the observed redshift difference along the line-of-sight is not uncommon for merging galaxy clusters.
5 Conclusion
We analysed the LOFAR, XMM-Newton, Chandra, VLA and SDSS data of the galaxy cluster Abell 1430. The cluster undergoes a major merger and the LOTSS data reveal a very extended diffuse radio emission which is apparently comprised of a radio halo in the main cluster and a puzzling, extended radio emission related to the infalling subcluster. In detail, we found:
-
•
The X-ray surface brightness distribution reveals that A1430 is a double system, composed of a main cluster A1430-A and a subcluster A1430-B with a mass ratio 2:1.
-
•
The LoTSS data reveal a radio halo for A1430-A. The morphology of the halo closely follows the X-ray surface brightness distribution of the main cluster component. The offset between the BCG, the X-ray concentration parameter and the centroid shift, and the missing cold core indicate that A1430-A is a disturbed system, which is typical for the clusters where a radio halo is present.
-
•
A large radio feature, which we dub ‘Pillow’ owing to its morphology, is apparently associated with A1430-B. If indeed diffuse emission, this emission would be very unusual since it is located in a region of very low ICM density and it appears unlikely that it is a radio relic. We speculate that the two cluster components undergo an off-axis merger, providing the necessary energy dissipation for the Pillow radio feature.
-
•
The redshift distribution of galaxies in A1430, as obtained from spectroscopic information from SDSS, indicates that the two subclusters have a redshift difference of about . Together with the X-ray temperature distribution, this supports that A1430-B is indeed merging with A1430-A at a large impact parameter. We inspected a large-volume cosmological simulation and identified a merger with similar parameters that shows a similar pattern of enhanced temperature in the interaction region.
The LOFAR observations have revealed an atypical diffuse radio emission in a low-density environment, which put our understanding of the origin of diffuse radio emission onto test.
Acknowledgements.
This paper is based on data obtained with the International LOFAR Telescope (ILT) under project codes LC2_038 and LC3_008. LOFAR (van Haarlem et al., 2013) is the LOw Frequency ARray designed and constructed by ASTRON. It has observing, data processing, and data storage facilities in several countries, which are owned by various parties (each with their own funding sources) and are collectively operated by the ILT foundation under a joint scientific policy. The ILT resources have benefited from the following recent major funding sources: CNRS-INSU, Observatoire de Paris and Université d’Orléans, France; BMBF, MIWF-NRW, MPG, Germany; Science Foundation Ireland (SFI), Department of Business, Enterprise and Innovation (DBEI), Ireland; NWO, The Netherlands; The Science and Technology Facilities Council, UK; Ministry of Science and Higher Education, Poland; The Istituto Nazionale di Astrofisica (INAF), Italy. This research made use of the Dutch national e-infrastructure with support of the SURF Cooperative (e-infra 180169) and the LOFAR e-infra group. The Jülich LOFAR Long Term Archive and the German LOFAR network are both coordinated and operated by the Jülich Supercomputing Centre (JSC). Computing resources on the supercomputer JUWELS at JSC were provided by the Gauss Centre for Supercomputing e.V. (grant CHTB00) through the John von Neumann Institute for Computing (NIC). This research made use of the University of Hertfordshire high-performance computing facility (http://uhhpc.herts.ac.uk) and the LOFAR-UK computing facility located at the University of Hertfordshire and supported by STFC [ST/P000096/1].CD acknowledges support by the German Academic Exchange Service (DAAD). AD acknowledges support by the BMBF Verbundforschung under the grant 05A20STA. KR acknowledges financial support from the ERC Starting Grant “MAGCOW”, no. 714196. SEN acknowledges support by the Agencia Nacional de Promoción Científica y Tecnológica (ANPCyT, PICT-2016-0667). He is member of the Carrera del Investigador Científico of CONICET. RJvW and AB acknowledge support from the VIDI research programme with project number 639.042.729, which is financed by the Netherlands Organisation for Scientific Research (NWO). LL acknowledges financial contribution from the contracts ASI-INAF Athena 2019-27-HH.0, “Attività di Studio per la comunità scientifica di Astrofisica delle Alte Energie e Fisica Astroparticellare” (Accordo Attuativo ASI-INAF n. 2017-14-H.0), and from INAF “Call per interventi aggiuntivi a sostegno della ricerca di main stream di INA”. GY acknowledges financial support from MICIN/FEDER (Spain) under research grant PGC2018-094975-C21.
The numerical simulations of the The Three Hundred collaboration used in this work have been done at the MareNostrum Supercomputer of the BSC-CNS thanks to computing time granted by The Red Española de Supercomputación and at the SuperMUC supercomputer of the ‘Leibniz-Rechenzentrum’ with CPU time assigned to the Project ‘pr83li’.
This research has made use of data products from the Sloan Digital Sky Survey (SDSS). Funding for the SDSS and SDSS-II has been provided by the Alfred P. Sloan Foundation, the Participating Institutions (see below), the National Science Foundation, the National Aeronautics and Space Administration, the U.S. Department of Energy, the Japanese Monbukagakusho, the Max Planck Society, and the Higher Education Funding Council for England. The SDSS Web site is http://www.sdss.org/. The SDSS is managed by the Astrophysical Research Consortium (ARC) for the Participating Institutions. The Participating Institutions are: the American Museum of Natural History, Astrophysical Institute Potsdam, University of Basel, University of Cambridge (Cambridge University), Case Western Reserve University, the University of Chicago, the Fermi National Accelerator Laboratory (Fermilab), the Institute for Advanced Study, the Japan Participation Group, the Johns Hopkins University, the Joint Institute for Nuclear Astrophysics, the Kavli Institute for Particle Astrophysics and Cosmology, the Korean Scientist Group, the Los Alamos National Laboratory, the Max-Planck-Institute for Astronomy (MPIA), the Max-Planck-Institute for Astrophysics (MPA), the New Mexico State University, the Ohio State University, the University of Pittsburgh, University of Portsmouth, Princeton University, the United States Naval Observatory, and the University of Washington.
References
- Abell (1958) Abell, G. O. 1958, ApJS, 3, 211
- Aguado et al. (2019) Aguado, D. S., Ahumada, R., Almeida, A., et al. 2019, ApJS, 240, 23
- Akamatsu & Kawahara (2013) Akamatsu, H. & Kawahara, H. 2013, PASJ, 65, 16
- Bacchi et al. (2003) Bacchi, M., Feretti, L., Giovannini, G., & Govoni, F. 2003, A&A, 400, 465
- Böhringer et al. (2013) Böhringer, H., Chon, G., Collins, C. A., et al. 2013, A&A, 555, A30
- Böhringer et al. (2017) Böhringer, H., Chon, G., Retzlaff, J., et al. 2017, AJ, 153, 220
- Böhringer et al. (2000) Böhringer, H., Voges, W., Huchra, J. P., et al. 2000, ApJS, 129, 435
- Bonafede et al. (2009) Bonafede, A., Giovannini, G., Feretti, L., Govoni, F., & Murgia, M. 2009, A&A, 494, 429
- Botteon et al. (2016) Botteon, A., Gastaldello, F., Brunetti, G., & Kale, R. 2016, MNRAS, 463, 1534
- Botteon et al. (2018a) Botteon, A., Shimwell, T. W., Bonafede, A., et al. 2018a, MNRAS, 478, 885
- Botteon et al. (2018b) Botteon, A., Shimwell, T. W., Bonafede, A., et al. 2018b, MNRAS, 478, 885
- Botteon et al. (2020) Botteon, A., van Weeren, R. J., Brunetti, G., et al. 2020, MNRAS, 499, L11
- Bourdin et al. (2013) Bourdin, H., Mazzotta, P., Markevitch, M., Giacintucci, S., & Brunetti, G. 2013, ApJ, 764, 82
- Briggs (1995) Briggs, D. S. 1995, in American Astronomical Society Meeting Abstracts, Vol. 187, American Astronomical Society Meeting Abstracts, 112.02
- Brown et al. (2011) Brown, S., Emerick, A., Rudnick, L., & Brunetti, G. 2011, ApJ, 740, L28
- Brunetti & Jones (2014) Brunetti, G. & Jones, T. W. 2014, International Journal of Modern Physics D, 23, 1430007
- Brunetti & Vazza (2020) Brunetti, G. & Vazza, F. 2020, Phys. Rev. Lett., 124, 051101
- Buote (2001) Buote, D. A. 2001, ApJ, 553, L15
- Cassano et al. (2013) Cassano, R., Ettori, S., Brunetti, G., et al. 2013, ApJ, 777, 141
- Cassano et al. (2010) Cassano, R., Ettori, S., Giacintucci, S., et al. 2010, ApJ, 721, L82
- Clarke & Ensslin (2006) Clarke, T. E. & Ensslin, T. A. 2006, AJ, 131, 2900
- Cuciti et al. (2018) Cuciti, V., Brunetti, G., van Weeren, R., et al. 2018, A&A, 609, A61
- Cui et al. (2018) Cui, W., Knebe, A., Yepes, G., et al. 2018, MNRAS, 480, 2898
- Ebeling et al. (2000) Ebeling, H., Edge, A. C., & Henry, J. P. 2000, in Bulletin of the American Astronomical Society, Vol. 32, AAS/High Energy Astrophysics Division #5, 1209
- Eckert et al. (2017) Eckert, D., Ettori, S., Pointecouteau, E., et al. 2017, Astronomische Nachrichten, 338, 293
- Feretti et al. (2012) Feretti, L., Giovannini, G., Govoni, F., & Murgia, M. 2012, A&A Rev., 20, 54
- Finoguenov et al. (2010) Finoguenov, A., Sarazin, C. L., Nakazawa, K., Wik, D. R., & Clarke, T. E. 2010, ApJ, 715, 1143
- Ghirardini et al. (2019) Ghirardini, V., Eckert, D., Ettori, S., et al. 2019, A&A, 621, A41
- Giovannini et al. (2009) Giovannini, G., Bonafede, A., Feretti, L., et al. 2009, A&A, 507, 1257
- Golovich et al. (2019) Golovich, N., Dawson, W. A., Wittman, D. M., et al. 2019, ApJ, 882, 69
- Govoni et al. (2001) Govoni, F., Feretti, L., Giovannini, G., et al. 2001, A&A, 376, 803
- Govoni et al. (2019) Govoni, F., Orrù, E., Bonafede, A., et al. 2019, Science, 364, 981
- Hao et al. (2010) Hao, J., McKay, T. A., Koester, B. P., et al. 2010, ApJS, 191, 254
- Hoang et al. (2018) Hoang, D. N., Shimwell, T. W., van Weeren, R. J., et al. 2018, MNRAS, 478, 2218
- Kierdorf et al. (2017) Kierdorf, M., Beck, R., Hoeft, M., et al. 2017, A&A, 600, A18
- Markevitch et al. (2002) Markevitch, M., Gonzalez, A. H., David, L., et al. 2002, ApJ, 567, L27
- Offringa et al. (2010) Offringa, A. R., de Bruyn, A. G., Biehl, M., et al. 2010, MNRAS, 405, 155
- Offringa et al. (2014) Offringa, A. R., McKinley, B., Hurley-Walker, et al. 2014, MNRAS, 444, 606
- Owen et al. (2014) Owen, F. N., Rudnick, L., Eilek, J., et al. 2014, ApJ, 794, 24
- Perley & Butler (2013) Perley, R. A. & Butler, B. J. 2013, ApJS, 204, 19
- Pfister et al. (2013) Pfister, R., Schwarz, K., Janczyk, M., Dale, R., & Freeman, J. 2013, Frontiers in Psychology, 4
- Planck Collaboration et al. (2015) Planck Collaboration, Ade, P. A. R., Aghanim, N., et al. 2015, A&A, 581, A14
- Planck Collaboration et al. (2011) Planck Collaboration, Ade, P. A. R., Aghanim, N., et al. 2011, A&A, 536, A1
- Planck Collaboration et al. (2016) Planck Collaboration, Ade, P. A. R., Aghanim, N., et al. 2016, A&A, 594, A27
- Pratt et al. (2009) Pratt, G. W., Croston, J. H., Arnaud, M., & Böhringer, H. 2009, A&A, 498, 361
- Rossetti et al. (2016) Rossetti, M., Gastaldello, F., Ferioli, G., et al. 2016, MNRAS, 457, 4515
- Rozo et al. (2015) Rozo, E., Rykoff, E. S., Bartlett, J. G., & Melin, J.-B. 2015, MNRAS, 450, 592
- Sanderson et al. (2009) Sanderson, A. J. R., Edge, A. C., & Smith, G. P. 2009, MNRAS, 398, 1698
- Shimwell et al. (2019) Shimwell, T. W., Tasse, C., Hardcastle, M. J., et al. 2019, A&A, 622, A1
- Smirnov & Tasse (2015) Smirnov, O. M. & Tasse, C. 2015, MNRAS, 449, 2668
- Struble & Rood (1991) Struble, M. F. & Rood, H. J. 1991, ApJS, 77, 363
- Szabo et al. (2011) Szabo, T., Pierpaoli, E., Dong, F., Pipino, A., & Gunn, J. 2011, ApJ, 736, 21
- Tasse (2014a) Tasse, C. 2014a, arXiv e-prints, arXiv:1410.8706
- Tasse (2014b) Tasse, C. 2014b, A&A, 566, A127
- Tasse et al. (2018) Tasse, C., Hugo, B., Mirmont, M., et al. 2018, A&A, 611, A87
- Tasse et al. (2021) Tasse, C., Shimwell, T., Hardcastle, M. J., et al. 2021, A&A, 648, A1
- van Diepen et al. (2018) van Diepen, G., Dijkema, T. J., & Offringa, A. 2018, DPPP: Default Pre-Processing Pipeline
- van Haarlem et al. (2013) van Haarlem, M. P., Wise, M. W., Gunst, A. W., et al. 2013, A&A, 556, A2
- van Weeren et al. (2019) van Weeren, R. J., de Gasperin, F., Akamatsu, H., et al. 2019, Space Sci. Rev., 215, 16
- van Weeren et al. (2010) van Weeren, R. J., Röttgering, H. J. A., Brüggen, M., & Hoeft, M. 2010, Science, 330, 347
- van Weeren et al. (2012a) van Weeren, R. J., Röttgering, H. J. A., Intema, H. T., et al. 2012a, A&A, 546, A124
- van Weeren et al. (2012b) van Weeren, R. J., Röttgering, H. J. A., Rafferty, D. A., et al. 2012b, A&A, 543, A43
- van Weeren et al. (2020) van Weeren, R. J., Shimwell, T. W., Botteon, A., et al. 2020, arXiv e-prints, arXiv:2011.02387
- van Weeren et al. (2016) van Weeren, R. J., Williams, W. L., Hardcastle, M. J., et al. 2016, ApJS, 223, 2
- Vikhlinin et al. (2005) Vikhlinin, A., Markevitch, M., Murray, S. S., et al. 2005, ApJ, 628, 655
- Williams et al. (2016) Williams, W. L., van Weeren, R. J., Röttgering, H. J. A., et al. 2016, MNRAS, 460, 2385
- Wright (2006) Wright, E. L. 2006, PASP, 118, 1711
- Zhang et al. (2011) Zhang, Y.-Y., Böhringer, H., Finoguenov, A., et al. 2011, A&A, 527, C2