58 \jyear2020 \firstpagenotePosted with permission from the Annual Review of Astronomy and Astrophysics, Volume 58 © 2020 by Annual Reviews, http://www.annualreviews.org/.
Star-Forming Galaxies at Cosmic Noon
Abstract
Ever deeper and wider lookback surveys have led to a fairly robust outline
of the cosmic star formation history, which culminated around –
a period often nicknamed “cosmic noon.”
Our knowledge about star-forming galaxies at these epochs has dramatically
advanced from increasingly complete population censuses and
detailed views of individual galaxies.
We highlight some of the key observational insights that influenced
our current understanding of galaxy evolution in the equilibrium
growth picture:
scaling relations between galaxy properties are fairly well established
among massive galaxies at least out to , pointing to regulating
mechanisms already acting on galaxy growth;
resolved views reveal that gravitational instabilities and efficient
secular processes within the gas- and baryon-rich galaxies at
play an important role in the early build-up of galactic structure;
ever more sensitive observations of kinematics at are
probing the baryon and dark matter budget on galactic scales and the links
between star-forming galaxies and their likely descendants;
towards higher masses, massive bulges, dense cores, and powerful
AGN and AGN-driven outflows are more prevalent and likely play a role in
quenching star formation.
We outline emerging questions and exciting prospects for the next decade with
upcoming instrumentation, including the James Webb Space Telescope
and the next generation of Extremely Large Telescopes.
doi:
10.1146/annurev-astro-032620-021910keywords:
galaxy evolution, galaxy kinematics, galaxy structure, interstellar medium, star formation, stellar populations1 INTRODUCTION
1.1 Background
Star-forming galaxies at redshift , 10 billion years ago, trace the prime formation epoch of today’s massive disk and elliptical galaxies. Our knowledge about their properties, and their place in the global context of galaxy evolution, has undergone spectacular advances in the past two decades from both increasingly complete population censuses at ever earlier cosmic times and increasingly detailed descriptions of individual systems. The identification and characterization of galaxies according to their global colors, stellar populations, structure and morphologies, and environment is now routinely done out to , encompassing 85% of the Universe’s history. Comprehensive surveys of the kinematics and interstellar medium (ISM) properties have been obtained from spatially- and spectrally-resolved observations of ionized gas line emission out to . The cold gas content has been measured, and is being resolved on subgalactic scales for rapidly rising numbers. Growing samples at are being assembled and the first candidates have been identified at within 500 Myr of the Big Bang, yielding insights into the progenitor populations of star-forming galaxies.
[30pt] \entryISMInterstellar medium. \entrySMBHSupermassive black hole. \entrySFRStar formation rate. \entrySFGStar-forming galaxy. \entryMSmain sequence of SFGs, referring to the observed tight relationship between their stellar mass and star formation rate.
This body of observational work has led to a fairly robust outline of the evolution of the stellar mass build-up and star formation activity of galaxies and the growth of supermassive black holes (SMBHs) over most of the Universe’s history (Madau & Dickinson, 2014). As much as half of the stellar mass observed in galaxies today was formed in just about 3.5 Gyr between and . After a rapid rise , the cosmic star formation rate (SFR) volume density peaked around and subsequently declined as to . The comoving rate of SMBH accretion follows a similar evolution, in support of co-evolution of central black holes and their host galaxies. This evolution in cosmically averaged rates finds its counterpart in the observed properties of individual star-forming galaxies (SFGs), which around were forming stars and feeding their central black holes times faster than today’s SFGs. At least up to , the vast majority of SFGs follows tightly a roughly linear “main sequence” (MS) between SFR and stellar mass (e.g., Rodighiero et al., 2011, Speagle et al., 2014), whose zero-point evolution reflects the decline in cosmic SFR density to the present time. Other scaling relations involving size, kinematics, metal, and gas content are also observed as early as (e.g., van der Wel et al., 2014a, Übler et al., 2017, Maiolino & Mannucci, 2019, Tacconi et al., 2020). Detailed mapping of the distribution and motions of stars and gas within galaxies have begun to probe the internal workings of galaxy evolution, and the spatial and temporal progression of the build-up of galactic components. Despite increasingly clumpy and irregular appearances at higher redshift, more so in the rest-frame ultraviolet (e.g., Conselice, 2014), there is now compelling evidence that the bulk of (massive) SFGs have global disk-like stellar light distributions and kinematics (e.g., Wuyts et al., 2011b, Wisnioski et al., 2019).
The existence of scaling relations and the prevalence of disk structure at implies that regulating mechanisms already controlled the growth and lifecycle of SFGs at early times. Specifically, these observations have highlighted the importance of internal processes in shaping galaxies and of smoother modes of accretion, with a lesser role of (gas-rich) major merger events able to dramatically alter the structure and drive large short-term fluctuations in SFRs. Taken together, these findings have laid out the empirical foundations for the “equilibrium growth model” (e.g.. Dekel et al., 2009a, Bouché et al., 2010, Lilly et al., 2013), in which the stellar mass growth of galaxies is governed by the balance between accretion, star formation, and outflows, until they reach a stellar mass of where their star formation is quenched and they rapidly transition to the sequence of quiescent galaxies (e.g., Peng et al., 2010).
1.2 Setting the Stage
Once dubbed the “redshift desert” because of the relative inaccessibility of key spectral features for source identification with then available instrumentation, our matured view driven by rapid observational progress now shows that is a pivotal epoch in galaxy evolution — it is “cosmic noon”.
[215pt] \entry{sansmath} James Webb Space Telescope. \entryELTExtremely Large Telescope. \entryTMTThirty Meter Telescope. \entryGMTGiant Magellan Telescope. \entry{sansmath} Hubble Space Telescope.
Lookback studies are at a turning point, with major leaps forward anticipated in the next decade from cutting-edge instrumentation at existing observatories, the imminent launch of the James Webb Space Telescope (JWST), and the coming of next-generation large aperture ground-based telescopes such as the 39 m Extremely Large Telescope (ELT), the Thirty Meter Telescope (TMT), and the 25 m Giant Magellan Telescope (GMT). Recent and future capabilities at current facilities will allow us to establish the missing links between the distributions and kinematics of stars, gas, and metals in and around galaxies, unraveling vital phases of the baryon cycle and the interplay between baryons and dark matter. With transformative boosts in sensitivity and angular resolution afforded by JWST and the extremely large telescopes, galaxy evolution at will be charted with unprecedented completeness well into the epoch of reionization and with unrivaled sharpness down to the 100-pc scale of individual giant star-forming complexes — a landscape revolution akin to the advent of the Hubble Space Telescope (HST) and the first 8 m-class telescopes in the 1990s.
Of the remarkably rich observational harvest of the past 5-10 years, we can here only highlight select aspects that have been among the most influential in advancing our knowledge about SFGs. We focus on the internal properties of galaxies as revealed by diagnostics in emission and typical environments found in deep extragalactic fields, which comprise the bulk of the galaxy population. Section 2 presents the observational landscape. Section 4 discusses global properties providing the population context and enabling evolutionary links, and Section 6 zooms on resolved properties providing insights into the physics shaping galaxies. Section 9 discusses subpopulations of SFGs with extreme properties. Section 10 briefly comments on the theoretical landscape. In closing, Section 11 summarizes the article, and outlines open issues and future observational opportunities.
For simplicity, we refer throughout to the epochs as “” or “high ” unless explicitly stated otherwise. We adopt a -dominated cosmology with , , and . For this cosmology, 1′′ corresponds to 8.4 kpc at . Magnitudes are given in the AB photometric system. Where relevant, galaxy masses and star formation properties are adjusted to a common Chabrier (2003) stellar initial mass function (IMF). {marginnote}[0pt] \entryIMFInitial mass function of stars.
2 OBSERVATIONAL LANDSCAPE
The dramatic advances in our knowledge about galaxies at cosmic noon have been driven by the confluence of novel observational techniques and sensitive high-multiplex ground- and space-based instrumentation across the electromagnetic spectrum. The concentration of multi-wavelength campaigns in select fields targeted as part of the Great Observatories Origins Deep Survey (GOODS), the Cosmic Evolution Survey (COSMOS), the All-wavelength Extended Groth strip International Survey (AEGIS), and the UKIDSS Ultra-Deep Survey (UDS) have yielded rich data sets and have seen their legacy value fully realized by providing samples of choice for many detailed follow-up studies. Several reviews have covered various aspects of galaxy surveys in the past decade (notably Shapley, 2011, Glazebrook, 2013, Madau & Dickinson, 2014, Lutz, 2014, Conselice, 2014, Tacconi et al., 2020). This Section gives an update incorporating recent programs with the goal of highlighting the observational underpinnings of our current physical understanding of cosmic noon galaxies.
[210pt] \entryIRInfrared. \entryUVUltraviolet.
Our empirical knowledge rests on a ladder going from the identification of galaxies from large photometric samples and their spectroscopic confirmation enabling statistical descriptions of the population, to increasingly detailed studies of subsets from spectrally/spatially resolved data. Observations at optical to near-IR wavelengths form a major part of each step, probing the redshifted, rest-frame UV to optical emission from galaxies. Figure 1 identifies salient spectral features on a model spectrum created for an example SFG at and shows how they shift across the various atmospheric bandpasses from to 3. These features include (with rest wavelengths given in Å):
-
•
hydrogen recombination and atomic forbidden emission lines from warm ionized gas excited by star formation, AGN, and shock activity, which provide diagnostics of nebular conditions, dust attenuation, galaxy dynamics, and gas outflows (Ly 1216, H 4861, H 6563, [OII]3726,3729, [OIII]4959,5007, [SII]6716,6730); {marginnote}[0pt] \entryAGNActive galactic nucleus.
-
•
stellar continuum emission, encompassing the Balmer discontinuity at 3646Å and the 4000Å break caused by hydrogen and multiple metallic species and molecules in the atmospheres of intermediate- to low-mass evolved stars, and on which estimates of the stellar age, stellar mass, and dust reddening are based;
-
•
a rich suite of far-UV (Å) interstellar low- and high-ionization atomic absorption lines useful to trace gas outflows/inflows, alongside various other absorption and emission features from stellar photospheres and winds, and gas photoionized by hot stars and AGN (including SiII1260, the blend OISiII1303, CII1334, SiIV1393,1402, CIV1548,1550, FeII1608, AlII1670);
-
•
weaker but important interstellar MgII2796,2803 absorption (another common ISM and outflow diagnostic) and the faint auroral [OIII]4363 line (a temperature-sensitive indicator in direct-method gas metallicity estimates).
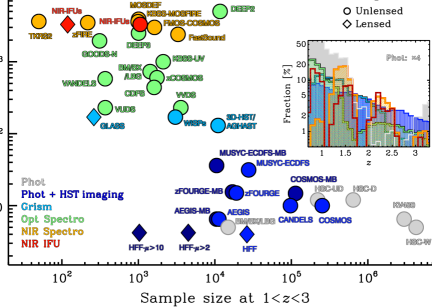
Figure 2 illustrates the ladder of surveys in terms of spectral resolution vs. the number of galaxies within the interval of interest for this article. The full list of surveys and main references are compiled in the Supplemental Tables 1 and 2.
2.1 Photometric Surveys in the Optical to Near-/Mid-infrared
Imaging in multiple photometric bandpasses is the most efficient way to identify and characterize large numbers of galaxies over a wide redshift range. Imaging campaigns at optical to mid-IR wavelengths () with sensitive cameras at ground-based telescopes and from space with HST and the Spitzer Space Telescope (hereafter Spitzer) have provided the most extensive censuses of distant galaxies. At , the multi-color information is primarily sensitive to the shape of the stellar continuum modulated by interstellar dust. The spectral energy distribution (SED) of galaxies is used to derive photometric redshifts () and basic properties such as stellar mass and SFR (for techniques, see Salvato et al. 2019 and Conroy 2013, respectively, and Supplemental Text). {marginnote}[2pt] \entrySEDSpectral energy distribution. \entry{sansmath} Photometric redshift, based on the broad/medium/ narrow-band SED. \entry{sansmath} Spectral resolution given as the ratio of wavelength to the full-width at half-maximum of a filter bandpass or spectral line spread function.
The inclusion of near/mid-IR wavelengths has been crucial to the inventory of the full population by detecting red optically-faint galaxies, probing wavelengths where outshining by young hot stars and attenuation by dust are reduced, and allowing to better trace the light from cooler stars that dominate the stellar mass. At , near-IR data are particularly important to gain leverage from the fairly sharp Balmer/4000 Å continuum breaks. Photometry in broad bandpasses is most sensitive but delivers coarse spectral resolution with typically . The addition of medium-band () and narrow-band ( up to ) information has proven vital to improve the accuracy and reliability of photometric redshifts and galaxy parameters (e.g., Ilbert et al., 2009, Whitaker et al., 2011). In the GOODS-S and COSMOS fields, with most extensive photometry in optical to mid-IR bands, estimates are as good as , with of catastrophic outliers (e.g., Skelton et al., 2014, Laigle et al., 2016). Because of the wide variety of galaxy SEDs, the accuracy depends on galaxy type, redshift range, specific set of filters, observational depth, treatment of line emission contributions, and availability of spectroscopic redshifts to calibrate the . Nonetheless, the wider wavelength coverage and finer SED sampling in many survey fields has brought decisive improvements. The tracking of similar rest-frame wavelengths across a broad range of redshifts allows more consistent comparisons of galaxy properties at different cosmic times. By better encompassing the full diversity of galaxy SEDs, more complete samples can be selected on the basis of photometric redshifts rather than color criteria involving a few bandpasses devised to isolate specific populations, or of more fundamental galaxy parameters such as stellar mass rather than brightness in a given filter with important -corrections. As a result, more robust distribution functions in terms of intrinsic galaxy properties and the evolution thereof have been derived, such as rest-frame luminosity functions and stellar mass functions.
Multi-band resolution imaging with HST has been increasingly exploited to not only detect distant galaxies and characterize their sizes and morphologies on scales, but also to derive maps of stellar properties from resolved color information. Here, the CANDELS survey (Grogin et al., 2011, Koekemoer et al., 2011) played a prominent role, bringing new sensitive near-IR and optical imaging over distributed in five premier sky regions within the GOODS-S and N, COSMOS, AEGIS, and UDS footprints. Together with imaging from other HST programs, this created a multi-tiered data set from ultra-deep ( depths of ) full 9-band imaging over (Illingworth et al., 2013), through deep () and wide () 47-band imaging to typical depths of , to the widest areas from the -band mosaic as part of COSMOS (, ; Scoville et al., 2007a) and -band imaging of a sub-area (, ) largely from the COSMOS-DASH program (Mowla et al., 2019b). The deepest pencil-beam surveys, reaching or fainter in areas magnified through gravitational lensing by massive foreground galaxy clusters (e.g., the Hubble Frontier Fields (HFF); Lotz et al., 2017) probe galaxies down to and masses well into the dwarf regime. At the other end, some recently undertaken very wide-area surveys such as the opticalnear-IR KiDSVIKING (Wright et al., 2019) and optical Hyper Suprime-Cam Subaru Strategic Program (HSC-SSP; Aihara et al., 2018) are deep enough to already yield sources at and in the first few hundreds of square degrees mapped. {marginnote}[] \entry{sansmath} characteristic value of the galaxy luminosity distribu- tion described by a Schechter function: . See Marchesini et al. (2012) and Parsa et al. (2016) for rest- optical and UV luminosity functions out to cosmic noon.
2.2 Spectroscopic Surveys in the Optical to Near-infrared
[30pt] \entry{sansmath} Spectroscopic redshift, based on a spectrum (typically at ). \entryS/NSignal-to-noise ratio.
Spectroscopic redshifts () are essential to validate and optimize techniques, construct the most precise galaxy distribution functions from confirmed samples, and provide secure targets for detailed and time-consuming follow-ups. Spectroscopy at is adequate to measure redshifts to within or better from ISM emission lines and/or from stellar absorption features. To be secure, ’s rely on the identification of at least two spectral features111 A distinct profile such as the characteristic asymmetry of Ly or doublets such as [OII] 3726,3729 can be sufficient if these lines are observed. , and the success also depends on the signal-to-noise ratio (S/N) of the data, the wavelength range probed, and the galaxy type. For instance, it is easier to measure the redshift of a source with higher emission line or continuum surface brightness, introducing a notorious bias towards bluer, more compact, more star-forming galaxies at in optical spectroscopic surveys. The challenges of confirming large samples at are manifold. The galaxies are faint. At , corresponds to and to , often necessitating long integrations to reach a sufficient S/N for measurements even with 8 m-class telescopes. Absorption and emission features observable in the optical are typically weak. The stronger nebular emission lines are shifted into the near-IR regime that is plagued by a dense forest of bright and variable emission lines mostly from OH radicals excited in the upper atmosphere, broad intervals of low atmospheric transmission around 1.4 and 1.9 , and thermal background from instrument to infrastructure and atmosphere at .
[150pt] \entryMOSMulti-object spectroscopy, or spectrograph. \entryVLTVery Large Telescope. \entry{sansmath} Redshift from grism spectroscopy, here specifically from HST grism data supplemented with photometric SEDs.
In the optical, great progress has come from high throughput multi-object spectrographs (MOS) such as Keck/LRIS and DEIMOS and VLT/VIMOS and FORS2, optimized to extend bluewards to the atmospheric cutoff near 3000 Å or redwards to to overcome the “redshift desert.” The more recent arrival of sensitive cryogenic near-IR MOS, including Keck/MOSFIRE and Subaru/FMOS and MOIRCS, further expanded confirmed samples mainly through rest-optical emission lines. Near-IR observations from space have an obvious advantage and use of the HST/WFC3 grism G141 with has been very productive at yielding redshifts. The lack of atmosphere ensures continuous coverage of the full grism window and greatly enhances continuum sensitivity, reducing biases towards line-emitting sources. The slitless aperture maximizes multiplexing and avoids target pre-selection biases, with the added ability to map spectral features at HST’s angular resolution. Reliable grism redshifts () from the 3D-HST and AGHAST programs (Momcheva et al., 2016), for instance, have nearly tripled the number of galaxies with secure spectroscopic redshifts in the five CANDELS fields, with typical accuracy of ( at ) at , and only worse for the subset of quiescent galaxies.
Besides redshift, spectra also provide a wealth of information on the stellar, gas, dust, and AGN content of galaxies. Detailed information is more demanding in terms of S/N and spectral resolution, to measure accurate emission and absorption line strengths and profiles for a range of fluxes and equivalent widths, and to deblend spectral features (e.g., [OII] and [SII] doublets, or kinematic components such as host disk and gas outflow). Among many results from MOS surveys at , scaling relations have been constructed such as the MS using SFR estimates from Balmer lines or UV luminosities, and the mass-metallicity(-SFR) relationship from strong line diagnostics of the gas-phase oxygen abundance. Excitation sequences in nebular line ratio diagrams have been examined to characterize the evolving ISM conditions at high . Galaxy kinematics have been investigated from integrated line widths and, with data subsets of sufficient spatial resolution and suitable slit alignment, from velocity gradients. The demographics and energetics of galactic outflows have been investigated from the strength and velocity profile of rest-UV interstellar absorption and rest-optical nebular line emission. In addition, stellar and dynamical properties of smaller but important samples of massive quiescent galaxies have been constrained from absorption (and in some cases weak emission) features – valuable to establish the fate of massive SFGs from their likely immediate descendants. These results are discussed throughout Sections 4, 6, and 9.
2.3 Integral Field Spectroscopic Surveys
Imaging spectroscopy at arguably provides the richest datasets of individual sources — a large multiplexing of its own. Integral field unit (IFU) spectroscopy is the most efficient technique — collecting simultaneously the full three-dimensional (3D) spatial and spectral information — and became possible for SFGs (with typical H fluxes of or fainter) with sensitive near-IR IFU instruments at 8 m-class telescopes. IFU studies have so far mainly used H[NII] line emission (or [OIII]H at ) to map the internal gas motions of galaxies, the distribution of star formation, gas excitation, and ISM metallicities within them, and the extent and properties of the gaseous winds they expel. Key results on these topics are covered in Sections 4 and 6.
[90pt] \entryIFUIntegral field unit. \entryAOAdaptive optics.
First samples were obtained with single-IFUs including VLT/SINFONI, Keck/OSIRIS, and Gemini/NIFS, all with resolving powers of and designed to be fed by an adaptive optics (AO) system improving the angular resolution from typical near-IR seeing of at their sites to the diffraction limit of their host telescopes ( at ). To date, near-IR single-IFU samples amount to targets altogether, with roughly half of these sources observed in AO mode. These samples, all drawn from spectroscopically-confirmed subsets of parent photometric samples with diverse primary selection criteria (magnitudes, colors, narrow-band identification, strong lensing) form a heterogeneous collection probing different parts in space (e.g., Glazebrook, 2013, Förster Schreiber et al., 2018, and references therein). Larger and more complete surveys have been enabled with the advent in 2013 of KMOS at the VLT, with 24 IFUs deployable over a -diameter patrol field. KMOS operates in natural seeing, covers with four bandpasses at each, and is well suited to detect faint, extended line emission over a wide redshift span. With SFGs targeted so far, KMOS has put results from single-IFU work on a more robust statistical footing (e.g., Wisnioski et al., 2015, 2019, Harrison et al., 2016, 2017). Importantly, it has also allowed to push into regimes previously unexplored with IFUs, including line emission of massive sub-MS galaxies (Belli et al., 2017b), and continuum for stellar populations and kinematics of massive quiescent field and cluster galaxies (e.g., Mendel et al., 2015, Beifiori et al., 2017).
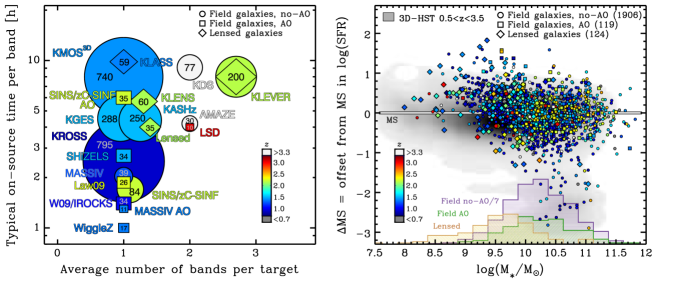
Figure 3 illustrates the observational and galaxy parameter space of the main near-IR IFU surveys of rest-optical line emission. The SFG population is extensively covered; detections also extend to SFRs or more below the MS, and to preferentially above the MS. While optical IFU spectroscopy is more relevant to studies, synergies are increasingly exploited by combining near-IR IFU samples with recent optical wide-field IFU surveys with VLT/MUSE at intermediate redshifts and large samples such as SAMI, CALIFA, and MaNGA observed with panoramic IFUs. Together, these surveys enable consistent comparisons and evolutionary links based on fully resolved kinematic and emission line properties from the same diagnostics over the past 11 Gyr of cosmic time.
2.4 Other Wavelengths as Probes of total SFRs, Cold Gas, and AGN
2.4.1 Infrared observations
Space-borne mid- to far-IR photometry with Spitzer/MIPS (at 24, 70, ) and then with Herschel (with PACS at 70, 100, and SPIRE at 250, 350, ) revolutionized IR surveys of distant galaxies thanks to their much improved sensitivity, angular resolution, and mapping speed compared to previous missions. They opened the window to statistical censuses of the dust-obscured component of the stellar and AGN radiation output from galaxies in the form of thermal emission (see Lutz, 2014, for a review). Spitzer/MIPS has delivered the deepest views of the dusty ISM of cosmic noon galaxies through 24 observations, enabling the detection of individual galaxies at down to (e.g., Whitaker et al., 2014). At these redshifts, however, 24 data measures rest-frame 8 light, where warm and transiently heated dust in HII regions and around AGN, polycyclic aromatic hydrocarbons arising from photodissociation regions, and absorption by silicate dust contribute. The conversion to total IR luminosity and SFR is thus prone to important uncertainties from the SED that needs to be assumed for the large extrapolation over the far-IR dust emission peak typically around rest-frame 100 (corresponding to a characteristic dust temperature of ). Measurements with submm instruments (e.g., JCMT/SCUBA and APEX/LABOCA) provided useful constraints on the Rayleigh-Jeans side, where AGN heating is minimized. The wavelength coverage and sensitivity afforded by Herschel has been vital in sampling directly the far-IR SED peak, enabling robust calorimetric estimates of galaxy SFRs (and cold dust properties).
2.4.2 Submm to mm observations
Observations in the submm to mm regimes probe the cold ISM component in galaxies. Its main constituent, , lacks a permanent electric dipole moment hence relevant emission lines at low excitation temperatures.{marginnote}[0pt] \entry(Sub)mmSubmillimeter and millimeter. Therefore, the strong rotational lines of CO (the second most abundant molecule) are used to trace molecular gas properties and kinematics of galaxies, with mid- transitions (2-1, 3-2, 4-3) being commonly employed at . Molecular gas masses (hereafter simply ) are estimated via an excitation correction to the ground-state 1-0 line and a conversion from CO line luminosity to mass (e.g., Bolatto et al., 2013, Genzel et al., 2015). The CO 1-0 transition is typically fainter than mid- lines and is shifted into the high-frequency radio bands, accessible for instance with the JVLA. The cold dust continuum luminosity is a viable and observationally efficient proxy for the gas mass and spatial distribution (e.g., Scoville et al., 2017, Tacconi et al., 2018).
Great strides in cold ISM studies of galaxies have been made possible with the IRAM/NOEMA interferometer in the northern hemisphere and ALMA in the south. With the gains in sensitivity and angular resolution of these arrays, studies of the global cold ISM content have shifted from the most luminous “submm galaxies” to the more typical MS population, although substantial integration times are still needed especially for CO line measurements and the limited primary beam sizes hamper mapping of sizeable areas (see recent reviews by Combes, 2018, Tacconi et al., 2020). Pointed CO or continuum surveys have been most efficient at assembling sets of at drawn from well-characterized parent samples. Blank field mosaicking surveys have been undertaken to build censuses out to , either optimized for emission line searches through spectral scans or emphasizing dust continuum emission, yielding so far a few to several 10’s of secure detections and with counterparts in the (deep) optical to mid-IR imaging available in the survey fields. Most of the CO and dust continuum measurements at are for massive SFGs. Detection in less massive (unlensed) galaxies becomes increasingly difficult as the amount of gas gets lower, and the ISM metallicity drops leading to more extensive UV photodissociation of CO and lower dust abundances. Alternative cold ISM tracers in emission are not practical because of their weakness, or because their higher frequency make them difficult or impossible to access from the ground at these redshifts. An obvious avenue for the future, in reach of NOEMA and ALMA, is more systematic spatially-resolved sub-arcsec CO and dust mapping at , which is currently limited to fairly small heteregenous sets dominated by very luminous or massive galaxies (e.g., Tacconi et al., 2013, Silverman et al., 2015, Barro et al., 2017b, Tadaki et al., 2017a, b).
2.4.3 Radio observations
At longer radio wavelengths, continuum observations probe AGN and star-forming systems mainly through non-thermal synchrotron emission, free from dust/gas obscuration. In SFGs, the synchrotron emission is produced in supernova remnants and, towards higher frequencies, free-free emission from HII regions also contributes (Condon, 1992). In AGN sources, the origin is more diverse, including jets, hotspots, and large-scale lobes, which complicates the quantitative relationship between observed radio emission and AGN luminosity (e.g., Tadhunter, 2016). Surveys at and lower frequencies down to () with facilities such as the JVLA, VLBA, LOFAR, GMRT, GBT, and ATCA have been carried out in many cosmological deep fields, with a range of sensitivities, beam size, and area. AGN dominate at brighter flux densities while SFGs become increasingly important at sub-mJy levels. Given that the tight radio-IR luminosity correlation for SFGs holds out to at least , with fairly well constrained (mild) evolution (, and in the range to ), the radio flux density can serve as SFR estimator, and the radio excess above the correlation can be used as diagnostic for the presence of an AGN (e.g., Magnelli et al., 2015, Delhaize et al., 2017). The deepest GHz-regime VLA imaging at ′′ resolution (in AEGIS, GOODS-N, COSMOS; Ivison et al., 2007, Morrison et al., 2010, Smolčić et al., 2017) reaches sensitivities of , corresponding to at .
2.4.4 X-ray observations
At the other end of the spectrum, observations of X-ray radiation () in galaxies trace predominantly nuclear activity (e.g., Brandt & Alexander, 2015). Produced in the immediate vicinity of the SMBH via Compton up-scattering in the accretion-disk corona, in powerful nuclear jets, and via Compton reflection and scattering interaction processes with matter throughout the nuclear regions, X-rays are able to penetrate through substantial gas columns (becoming hindered in the highly Compton-thick regime with ). Non-AGN X-ray emission in galaxies arises from X-ray binaries and hot gas but is both less energetic and softer compared to that of (luminous) AGNs. The most extensive cosmological surveys have been carried out with the space-borne Chandra and XMM-Newton Observatories, operating since 20 years, with on-board instruments enabling efficient spectroscopic imaging of wide areas in soft and hard bands ( and ), while the more recently launched NuSTAR telescope has started to unveil the distant universe in radiation. The deepest and sharpest views were achieved with Chandra/ACIS through the cumulative 7 Ms exposure of in the Chandra Deep Field-South (encompassing GOODS-S), yielding nearly 1000 detections to . While AGN dominate the source counts, the more so at higher and luminosities, the depth of the data reaches intrinsic rest-frame out to (Luo et al., 2017), where SFRs from several 100 to can be detected. Because the rapid variability of AGN emission at these energies and the potential presence of high absorbing gas columns near the nucleus can bias X-ray samples, AGN identification benefits from complementary diagnostics such as high-excitation rest-UV/optical emission lines, radio luminosity, and mid-IR colors (e.g., Padovani et al., 2017).
2.5 Mass-matching vs. Abundance-matching
In order to bring theoretical models and observations into the same arena for an apples-to-apples comparison, a common interface needs to be found. Different approaches can be employed, bringing this interface either very close to the direct observables (e.g., by treating numerical simulations with radiative transfer and/or placing them into a lightcone to predict number counts as a function of observed flux) or alternatively working from the observables backward to interpret them in terms of physical quantities (e.g., using the spectral modeling techniques outlined in the Supplemental Text). Once stellar population properties such as stellar masses are inferred from the multi-wavelength SEDs, and provided sufficient depth, mass-complete samples of galaxies can be extracted from the flux-limited parent catalog. Those in turn can serve as basis for population-averaged comparisons to models, where for example the evolution of the SFR, size, metallicity, rotational velocity or other physical quantity is traced as a function of redshift at fixed stellar mass. How far back the population-averaged evolution can be recovered depends on the mass regime considered, as the parent catalog’s flux limit will necessarily impose a redshift-dependent mass completeness limit.
While valuable, such population censuses do not by themselves reflect the growth histories of individual systems. Galaxies gain stellar mass through star formation and merging activity, moving out of the considered mass bin while others move in. Methods to empirically reconstruct evolutionary sequences for individual galaxies from the mass-complete samples, linking their progenitor and descendant phases, gained significant attention in recent years. The most common ansatz is to assume the preservation of mass ranking, in which case progenitors and descendants are anticipated to live at the same comoving number density (e.g., van Dokkum et al., 2010). The resulting evolutionary tracks can then directly be compared to the main progenitor branch extracted from a galaxy formation model.
The efficacy of this technique relies in part on the infrequent occurrence of major galaxy mergers, and indeed refinements have been proposed on the basis of cosmological simulations to account for a non-negligible divergence in growth rates, in part influenced by merging activity (van de Voort, 2016, Wellons & Torrey, 2017, Clauwens et al., 2017). Here, it is of note that slightly different prescriptions are desired for tracing galaxies backwards vs. forward (Torrey et al., 2017, Wellons & Torrey, 2017), and that the technique is designed primarily to work when the galaxy population is well described as a one-parameter family characterized by stellar mass. If considering subpopulations defined by, e.g., mass and color, galaxies may not only enter a particular mass bin due to their stellar growth, but also their color evolution, potentially introducing progenitor bias (e.g., Carollo et al., 2013). Finally, from the perspective of the flux-limited parent catalog, the abundance matching technique leaves more of the collected data unused, as higher mass cuts are adopted at later times to identify progenitors and descendants, whereas the deepest mass completeness limits are reached at the lowest redshifts.
[!t]
3 STELLAR, GAS, AND STRUCTURAL PROPERTIES
, ,
:
Total stellar, cold molecular gas, and baryonic (stellargas) masses.
Schechter function:
Parametrization of the galaxy number density
vs. stellar mass (or luminosity), with
or
(single- or double-Schechter);
the characteristic value is referred to as the Schechter mass
(Schechter, 1976).
sSFR: specific star formation rate, .
:
Logarithmic offset in sSFR (or SFR) from the MS,
.
SFH:
Star formation history; common forms include an exponential
, delayed , or log-normal
SFR where , , and are the time, timescale, and logarithmic
delay time.
Sérsic profile: Frequently used parametrization of the surface
density distribution of galaxies,
,
where is the Sérsic index, and is a scaling coupled to such
that half of the total light is within (e.g., Graham & Driver, 2005).
The Gaussian, exponential, and de Vaucouleurs profiles correspond to
=0.5 and =0.69, =1 and =1.68, and =4 and =7.67,
respectively.
{sansmath}:
Effective radius, enclosing half the total light (or mass).
{sansmath}:
Disk scalelength for an exponential profile
, in which case
.
{sansmath}:
Projected minor-to-major axis ratio of an inclined disk (also denoted ).
{sansmath}:
Circularized effective radius, scaling by .
{sansmath}:
Radius enclosing 80% of the total light (or mass).
, ,
:
Stellar mass, gas mass, and SFR surface densities conventionally within
, taking half the total , , and
SFR and dividing by .
:
Stellar mass surface density within the central 1 kpc,
, where
is computed from the best-fit Sérsic profile
to the surface density distribution.
{sansmath},
:
Gas-to-baryonic mass fraction , and
gas depletion time via star formation .
4 GLOBAL PROPERTIES OF STAR-FORMING GALAXIES AT z 2
Along with the cosmically integrated evolution of the SFR, stellar mass, and SMBH accretion rate density (Madau & Dickinson, 2014), a key outcome of lookback surveys was to reveal and establish the existence of scaling relations between global properties of galaxies out to at least , and a census of how they are populated (often quantified by galaxy type). In what follows, we first address the build-up of stellar mass in galaxies. Section 4.1 considers the scaling relation between the (in-situ) growth rate (SFR) and its time integral (, including effects of stellar mass loss and merging), followed by an overview of results on census (Section 4.2) and a discussion on the interpretation of these joint observational constraints (Section 4.3). We then expand our scope to include global structural measures (Section 4.4), ISM probes (Sections 5.1 - 5.2) and nuclear activity (Section 5.3).
4.1 The “Main Sequence” of Star-forming Galaxies
Locally, the existence of a strong correlation between the SFR and stellar mass of galaxies was first established based on the vast number statistics offered by the Sloan Digital Sky Survey (SDSS; Brinchmann et al., 2004). Subsequent work on deep lookback surveys revealed that a similarly tight and near-linear relation, dubbed the “Main Sequence,” was already in place since (Noeske et al., 2007, Elbaz et al., 2007, Daddi et al., 2007). Its main change with cosmic epoch is one of rapid zero-point evolution. For galaxies below the specific SFR evolves as whereas more massive galaxies exhibit a faster pace of evolution, with for (Whitaker et al., 2014).
[0pt] \entrysSFRSpecific star formation rate.
The past few years have seen a consolidation of the MS relationship, leading to an emerging picture in which (a) the scatter is constant at over the full stellar mass and redshift range probed, (b) the low-mass slope is consistent with unity, and (c) a turnover and flattening is evident at higher masses, most prominently so towards lower redshifts and conversely nearly vanishing by (e.g., Whitaker et al., 2014, Schreiber et al., 2015, Tomczak et al., 2016, Figure 4). Some studies favor or adopt single powerlaw fits (Speagle et al., 2014, Pearson et al., 2018), then finding its slope to steepen with increasing redshift.
Quantitative differences in derived scatter, slope/shape and normalization can be attributed to a range of reasons, including (1) method and strictness of SFG selection, (2) dynamic range over which the relation is fit, and (3) use of different SFR tracers. We briefly elaborate on these systematics before highlighting the significance of the MS scaling relation.
[130pt] \entry{sansmath} Rest-frame vs. color diagram.
Whitaker et al. (2012) demonstrate how a color selection vs. selecting only blue star-forming galaxies makes the difference between finding a sub-linear vs. linear slope. Similarly, Rodighiero et al. (2014) and Johnston et al. (2015) illustrate how, by adopting different color cuts or selection criteria based on SED-modeled properties, inferred slopes may vary between and . Noteworthy also is that, when restricting samples to pure disks or considering only the disk components of SFGs, a slope of unity is found (Abramson et al., 2014). As we will allude to in Section 4.3, galaxies may well lack a bimodality in their sSFR distribution akin to that seen in their colors, implying that the choice of SFG selection criterion may largely be arbitrary. In this case there is no formally correct answer regarding the MS shape, and inferences on galaxy evolution need to treat the SFG and quiescent population jointly or at least preserve internal consistency in selection criteria used.

Unavoidably, the dynamic range in stellar mass over which the MS shape can be constrained is a function of redshift, with for example the ZFOURGE magnitude limit of corresponding to 90% completeness limits of , 9.5 and 10 at , 2 and 3, respectively (Tomczak et al., 2016). Particularly if there is curvature to the MS this can impact recovered parameterizations that adopt a power-law slope. The finite depth of observed SFR tracers further implies that many studies rely at least in part on stacking procedures, which may suffer from confusion biases (Pearson et al., 2018).
Even with extreme depth and a consistent SFG definition, determinations of the MS scatter, normalization, and shape will be affected by uncertainties in the inferred SFRs and stellar masses. When the two are derived from overlapping data and sometimes a single modeling procedure, the uncertainties will be correlated and can potentially conspire to an artificially tight relation, compensating the opposite and mostly subtle boosting of scatter due to finite redshift bins that is not always accounted for. A comprehensive discussion of systematic uncertainties affecting estimates of SFR and is presented by Conroy (2013, see also Supplemental Text, which summarizes the ingredients, assumptions, and challenges of spectral modeling techniques). Possible concerns include the saturation of reddening as a dust attenuation tracer at the highly star-forming and massive end (e.g., Wuyts et al., 2011a), extra extinction towards HII regions which remains difficult to pin down observationally (e.g., Reddy et al., 2015), contamination by other sources of emission such as AGN, circumstellar dust around asymptotic giant branch (AGB) stars or diffuse cirrus dust heated by old stellar populations, and unintended biases induced by the choice of adopted parameterization of and/or prior on the SFH (Carnall et al., 2019, Leja et al., 2019a).
Despite the above considerations, the meta-analysis by Speagle et al. (2014) finds a remarkable consensus among MS observations, with an interpublication scatter as small as 0.1 dex. On an individual galaxy basis different SFR estimates do of course vary more than that, but may not need to agree in detail either, as they can probe different timescales. H recombination lines are the closest to a measurement of the instantaneous SFR because of the short lifetime ( Myr) of Lyman-continuum producing OB stars, while rest-UV and IR tracers will integrate the contribution of stars with (stellar) main sequence lifetimes of Myr. As such, differences in MS scatter inferred from different SFR tracers could in principle encode the short-term stochasticity of star formation and the timescale on which galaxies lose “memory” of previous activity (Caplar & Tacchella, 2019). A slightly enhanced scatter around the H-based MS at cosmic noon relative to the one constructed from UV or UV+IR based diagnostics has been reported (Shivaei et al., 2015, Belli et al., 2017b), but systematic uncertainties regarding dust corrections make the interpretation in terms of star formation timescales not unique.
[295pt] \entrySFHStar formation history.
Setting aside the above caveats, we conclude this Section by noting two immediate implications of the existence of a MS relation and its observed evolution with cosmic time. First, assuming SFGs are located on the MS at all times we can integrate along the evolving scaling relation to recover the typical star formation history (SFH). Doing so, one unambiguously finds the star formation activity first rises before it falls, as such mimicking the shape of the cosmic SFR density evolution (Renzini, 2009, Peng et al., 2010, Leitner, 2012, Speagle et al., 2014, Tomczak et al., 2016, Ciesla et al., 2017). In common with findings from the fossil record (e.g., Thomas et al., 2005), these studies also infer SFHs of more massive galaxies to peak earlier. A second point of significance is that the tightness of the MS implies that any large excursions in star formation activity as one might expect from (major) merging have either very short duty cycles or are very rare (Rodighiero et al., 2011).
4.2 The Stellar Mass Function
An extensive body of work has documented the census of galaxies as a function of their stellar mass over most of cosmic history on the basis of well-sampled SEDs for deep, near-IR selected samples (e.g., Ilbert et al., 2013, Tomczak et al., 2014, see Figure 4). In common between these studies are the following findings. First, provided sufficiently deep stellar mass completeness limits a double-Schechter functional form is favored over a single-Schechter fit. This conclusion holds for both the star-forming and quiescent population individually, and for the combined, total galaxy stellar mass function. Second, between and the present day there is no statistically significant evolution in the characteristic mass of either the total stellar mass function or that of SFGs (Peng et al., 2010). Values quoted in the literature for this characteristic mass vary in the range with the higher results stemming from single-Schechter and the lower ones from double-Schechter fits (see, e.g., Tomczak et al., 2014). Minor differences further arise from the adopted fitting method ( vs. maximum-likelihood), systematics in the determination of redshifts and stellar mass, and how uncertainties in the latter are accounted for. A third conclusion is that little to no evolution in the low-mass slope is noted since cosmic noon, neither for the total nor the star-forming galaxy population.222 In the case of a double-Schechter fit, we here refer to the steeper of the two fitted slopes , which dominates at the low-mass end. Most of the evolution over the past 10 Gyr can thus be described by an increase in . The redshift-invariance of the low-mass slope is in line with a MS slope of unity at masses below . As pointed out by Peng et al. (2010), a sub-linear MS slope would inevitably lead to a fast steepening of , and only very slight deviations from a unity slope can be accommodated by merging away low-mass galaxies. Whereas until recently inconsistencies at the level of were found between integrating the MS metric and the evolving stellar mass function (Leja et al., 2015, Tomczak et al., 2016), which could not all be accounted for by merging, the latest such exercise with revised SFRs and stellar masses from advanced spectral modeling shows an improved internal consistency (Leja et al., 2019b).333 All modeling combining measures of SFR and stellar mass accounts for stellar mass loss, which reduces the mass present in stars (including remnants) compared to the integral over the SFH, by a factor 0.6 at late times for a Chabrier IMF.
As illustrated in Figure 4, the quiescent galaxy mass function looks markedly different. At all epochs it features a clear peak around , and the quiescent population grows in numbers more rapidly than the star-forming one. At masses above quiescent number densities have grown by a factor 6 since , whereas at lower masses there is a increase. The mass-dependent growth of the quiescent population, with quenching of low-mass galaxies happening at later times (Ilbert et al., 2013, Huang et al., 2013), has been attributed to two different quenching channels. Since the environmentally driven low-mass channel only manifests itself appreciably after the epoch of cosmic noon, this review focuses on the high-mass quenching dominant at early times.
4.3 Interpreting the Observed Stellar Mass Growth
Whereas observational campaigns of the stellar mass growth across most of cosmic history have tightened the error bars on its scaling relation (the MS) and census (the galaxy stellar mass function), perhaps of more debate today is the interpretation of these observational diagnostics. That is, what are the implications of the cross-sectional view of the galaxy population at a range of epochs for the evolutionary tracks that individual galaxies follow?
In this context two schools of thought have developed which, to use the nomenclature of Abramson et al. (2015), can be described as “mean-based” and “dispersion-based” approaches. The former aim to reconstruct the average SFH of individual galaxies based on ensemble averages (e.g., Peng et al., 2010, Behroozi et al., 2013b), whereas the latter put emphasis on the diversity of SFHs (e.g., Gladders et al., 2013, Kelson, 2014, Abramson et al., 2015, 2016). Both schools infer characteristic SFHs that first rise and then fall, but differ in key aspects of the interpretation.
Peng et al. (2010) for example adopt the redshift-invariance of as an indication that galaxies live on and grow along the evolving MS until they reach this critical mass, after which the probability of quenching increases rapidly . Proposed mechanisms to explain this “mass quenching” include the rapid expulsion of gas by SMBHs, but there is no consensus yet regarding its physical cause. Scatter around the MS is in such models typically attributed to short timescale () variations in SFR at a given mass, induced by the breathing cycles of star formation feedback and temporal fluctuations in the rate of gaseous inflows and/or minor mergers.
[180pt] \entryDMDark matter.
The “dispersion-based” school on the other hand attributes scatter around the MS relation as an imprint of SFHs that are differentiated on Hubble timescales. In this picture galaxies follow smooth trajectories that let them pass across the moving MS, rather than at any time being stochastically scattered around the scaling relation. There is in such a scenario no discernable signature of quenching. That is, no rapid quenching mode and no specific time (other than arguably the peak in SFH) at which a shutdown in star formation is triggered. Along the same vein, Eales et al. (2014) report a continuous distribution of galaxies in the space, lacking a bimodality in specific SFRs as undeniably seen in their color distribution. The color bimodality, they argue, reveals the peculiarities of stellar evolution (i.e., ageing stellar populations saturating in color) rather than a signature of galaxy evolution producing two sharply distinct populations of galaxies. A common interpretation in these studies is that the SFH shape is set by initial density conditions intimately related to dark matter (DM) properties such as the halo formation redshift. A family of log-normal SFHs, parameterized by varying peak times and widths, can yield an adequate description of the relevant observational metrics (Gladders et al., 2013, Abramson et al., 2015, 2016, Diemer et al., 2017), although the fact that the central limit theorem produces a similar relation between SFR and stellar mass within a framework in which galaxies grow stochastically illustrates that this inference is not unique (Kelson, 2014, Kelson et al., 2016).
Speagle et al. (2014) present a hybrid approach in which average SFHs are derived by integrating the MS similar to what was done by Renzini (2009) and Peng et al. (2010), but its scatter is reproduced by imposing an initial spread in formation times to the smooth evolutionary tracks as opposed to adding short-term fluctuations in SFR at a given mass. Turning to numerical simulations of galaxy formation where the individual evolutionary paths of galaxies are by construction known, Matthee & Schaye (2019) argue that the MS scatter contains contributions from (slightly dominant) short-timescale self-regulation of star formation as well as halo-related variations on Hubble timescales. Of course, the precise contribution from short-timescale fluctuations may depend on the detailed recipes implemented in the numerical simulation.
A promising path forward to discriminate between the two schools of thought is to look for correlations between the offset from the MS midline and other SFG properties that can be assumed to vary more slowly over time, such as galaxy structure. Absence of a correlation within the MS scatter would then favor a short-timescale origin whereas a correlation between MS offset and longer lasting features would favor a Hubble-timescale differentiation. This requires accurate SFR measurements, where possible contrasting MS offsets quantified using multiple SFR tracers (e.g., Fang et al., 2018), ideally with different timescale sensitivities (Caplar & Tacchella, 2019). Given challenges posed in this regard by dust treatment, we conclude that SFRs and stellar masses by themselves may ultimately prove insufficient to recover the underlying evolutionary paths of galaxies. Progress thus entails incorporating the information provided by spatially resolved studies of the build-up of galaxies in all their baryonic components (stars, gas, metals), tied with kinematic tracers of the full gravitational potential (i.e., including DM) and of the feedback processes at play. In the remainder of this Section, we cover the global structure, ISM, and accretion scaling relations, to delve more into resolved properties in Section 6.
4.4 The Mass-Size Relation
Following initial work with HST on the sizes of the UV-selected subpopulation of SFGs (Giavalisco et al., 1996, Ferguson et al., 2004), size evolution of mass-complete samples since cosmic noon was first explored in large numbers using ground-based near-IR surveys (Franx et al., 2008, Williams et al., 2009), to be transformed by rest-optical imaging at high resolution for statistical samples after the installment of WFC3 onboard HST. This Section focuses on stellar light-weighted sizes. Insights gained from a multi-tracer analysis combining stellar mass-weighted sizes and radial distributions of star formation, gas, and dust are covered in Section 6.1.
[275pt] \entryPSFPoint spread function.
Even when concentrating on a single tracer/wavelength, multiple definitions of galaxy size are possible, and increasingly explored alongside one another. Different methods classify broadly as parametric and non-parametric. By far the most common approach entails fitting of a parametric (usually Sérsic) functional form convolved with the point spread function to the two-dimensional (2D) surface brightness distribution, and adopting the radius enclosing 50% of the light (a.k.a. the effective radius) as size measure, either defined along the major axis or in circularized form (). Variations include quantifying galaxy size based on a different percentile (e.g., ) or decomposing the light distribution in multiple components (e.g., bulge and disk) with a size associated to each. Non-parametric approaches range from curve of growth analyses to quantifying the pixel area above a given surface brightness threshold. The former requires a center and aperture definition, whereas the latter is designed to function well also for highly irregular morphologies but requires accounting for cosmological surface brightness dimming and luminosity evolution. Unlike the parametric approach that applies forward modeling of point spread function (PSF) smearing, the finite resolution is to be accounted for a posteriori in these non-parametric measures, typically using a simulation-based lookup table as correction factors are size and profile shape dependent. Here, we outline the main inferences from conventional Sérsic fitting, but note in passing how some conclusions change, even on a qualitative level, when adopting an alternative definition of size.
The sizes of star-forming and quiescent galaxies both show a tight ( dex intrinsic scatter) but distinct scaling with galaxy stellar mass (van der Wel et al., 2014a, see Figure 4). SFGs are larger than their quiescent counterparts at all masses over the range. Their size-mass relation exhibits a non-evolving slope of compared to the steeper slope of for early-type galaxies. Considering the redshift dependence of the intercept, a slower evolution in the average size of the population at fixed mass is quantified for SFGs () compared the quiescent systems, which as a population show dramatic growth from compact red nuggets at cosmic noon to the large ellipticals in today’s Universe (). Of note is that the above characterizes the evolution in the size distribution of the population, not by itself the evolutionary tracks of individual galaxies. Connecting progenitor-descendant sequences based on their constant cumulative number density as outlined in Section 2.5, information from the evolving galaxy stellar mass function can be folded in together with the size measurements to infer that: (1) the progenitors of present-day Milky Way mass galaxies have evolved, on average, along individual growth tracks of (i.e., an inside-out growth track slightly steeper than the slope of the star-forming size-mass relation at any epoch; van Dokkum et al. 2013, 2015); and (2) the most massive galaxies have experienced much steeper size growth with individual tracks following , consistent with scenarios where an early dissipative core formation phase is followed by the build-up of profile wings through dissipationless, predominantly minor, mergers (van Dokkum et al., 2010, Patel et al., 2013a).
[170pt] \entrySMHMStellar mass – halo mass relation.
The formation of galactic disks is inherently linked to the DM halos that host them. In its simplest form, disk scalelengths are expected to scale with the virial radii of their host halos as:
| (1) |
which boils down to a linear scaling with the virial radius provided the accreting baryons retain the specific angular momentum of their host halo (; Mo et al. 1998). The width of the log-normal distribution in spin parameters obtained from N-body simulations in a cosmology (Bullock et al., 2001) is sufficient to account for the observed scatter in the size-mass relation. Such a scenario predicts an evolution in size at fixed halo mass following , in agreement with the observed evolution for late-type galaxies by van der Wel et al. (2014a), who note that a parameterization as a function of is marginally favored over that with the scale factor . Adopting the stellar mass - halo mass (SMHM) relation inferred from abundance matching, the observed size - mass relation can be converted to a galaxy size - halo size relation (Kravtsov, 2013, Huang et al., 2017, Somerville et al., 2018). Applied to observations at , such analyses reveal a linear relation between and and hence evidence for homologous growth between galaxies and their host halos. At least at the normalization for late-type galaxies is consistent with expectations from simple disk formation models (see also Section 7.1.4 for kinematic evidence of specific angular momentum retention in an ensemble-averaged sense). The effective radii of early-type galaxies on the other hand lie below the relation at all epochs. Mowla et al. (2019a) however suggest that expressed in quiescent galaxies and SFGs occupy a single size-mass relation, with these outer size measurements exhibiting a close relationship to the host halos for the full population. Whereas observations and simulations agree on a general linear relation of the form , recent theoretical work has called into question whether the proportionality constant , and hence the variation in galaxy size at fixed mass, is set by the halo spin parameter as in equation 1, halo concentration (Jiang et al., 2019), or a combination of both (Somerville et al., 2018).
[!t]
5 DARK MATTER HALO AND RELATED PROPERTIES
:
Virial radius of a DM halo, usually the radius within which the
mean mass density is 200 times the critical density for closure of the
Universe at the redshift of interest; also denoted
(Mo et al., 1998).
:
Spin parameter of a DM halo (Bullock et al., 2001).
{sansmath},
,
:
Mass of a DM halo, and its total and specific angular momentum at the
virial radius (with ).
{sansmath},
:
Mass and angular momentum of the baryonic disk galaxy expressed as fractions
of the host DM halo mass and angular momentum
(such that ,
).
[140pt] \entryLBGLyman break galaxy, selected based on its characteristic rest-UV spectral break.
Key in the above results is that they are based on mass-complete samples of galaxies. Individual sub-populations may differ in their growth rate. Allen et al. (2017) report a significantly faster size growth for Lyman break galaxies (LBGs; ) than for the underlying full SFG population since , a trend also seen in previous studies spanning a more modest redshift range, implying that LBGs represent a special subsample of highly star-forming and compact galaxies. Population differences aside, Ribeiro et al. (2016) report for the same sample of spectroscopically confirmed SFGs at differences in size evolution at fixed mass ranging from using conventional Sérsic profile fits to no size evolution at all over the considered 2 billion years leading up to cosmic noon when adopting a non-parametric measure of size quantified based on the pixel count above a threshold surface brightness. They attribute this to galaxies in their earliest phase of assembly being quite extended and irregular, and poorly described by a single Sérsic profile. An example at later epochs where alternative size definitions change trends in a qualitative manner includes work by Carollo et al. (2013) who adopt curve-of-growth sizes with a posteriori PSF correction factors to conclude, at odds with van der Wel et al. (2014a), that there is no decline in number densities of compact quiescent galaxies since , thus placing more emphasis on progenitor bias than individual galaxy growth as an explanation of the observed size evolution of early-type galaxies.
5.1 Cold Gas Content
The cold gas reservoir of galaxies lies at the core of their evolution, fueling their star formation activity and SMBH growth, and efficiently mediating mass, angular momentum, and energy transfer. CO line or far-IR to dust continuum observations have accumulated ample evidence that SFGs at cosmic noon have copious amounts of molecular gas (see reviews by Combes, 2018, Tacconi et al., 2020). A recent focus has been on scaling relationships described in relation to the MS, facilitating the interpretation in the framework of galaxy evolution and providing well-calibrated recipes to estimate in the absence of actual cold ISM measurements (e.g., Genzel et al., 2015, Scoville et al., 2017, Tacconi et al., 2018). These analyses showed that over the depletion time depends primarily on redshift and MS offset , and so does the ratio of molecular gas to stellar mass with an additional dependence on . In the updated derivation by Tacconi et al. (2020), unifying CO and dust continuum-based gas mass estimates including most recent NOEMA and ALMA data, and adopting the Speagle et al. (2014) MS parametrization, . Accordingly, the depletion time for MS SFGs at fixed increases by a factor of from to the present day while the gas fraction drops by a factor of (Figure 4). It also follows from these gas scalings, the near-linear MS and its evolution (from Speagle et al., 2014), and the size-mass relation for SFGs (from van der Wel et al., 2014a), that the gas mass surface density at fixed evolves strongly over as with , and more slowly at with .
At all epochs, the average gas depletion time is nearly ten times shorter than the Hubble time, requiring sustained replenishment of the galactic cold gas reservoirs to maintain the SFG population as a whole on the tight observed MS. As summarized by Tacconi et al. (2020), this argument is a cornerstone of the “equilibrium growth” model, and favors that the bulk of SFGs are fed by smoother gas accretion modes via cold streams along the cosmic web and minor mergers rather than major mergers. At fixed and , the gas scaling relations imply that the enhanced SFRs well above the MS are driven by both higher gas fractions and higher star formation efficiencies (), plausibly reflecting increased gas accretion and concentration as, e.g., in a major merger event. On the MS, the star formation efficiency is roughly constant but decreases towards higher masses, along with the sSFR, suggesting that a lack of fuel (resulting from, e.g., suppressed accretion or gas removal) sets quenching on rather than reduced efficiency (from, e.g., gas stabilization against fragmentation by a massive bulge or ISM heating mechanisms). Setting tighter constraints on these scenarios through measurements of the cold ISM in sub-MS galaxies at is very challenging, and the very few results published to date are inconclusive (e.g., Bezanson et al., 2019).
Gas scaling relations at are most firmly established at , where high- samples probe well the SFG population and where the luminosity-to-gas mass calibrations are best constrained. The more extensive data sets now available do not support a significant dependence of the CO- conversion on (Tacconi et al., 2020). In contrast, there is a strong variation of CO- and of the dust-to-gas ratio with metallicity (e.g., Genzel et al., 2012, Bolatto et al., 2013), which is folded in the scaling relations given above. At , the atomic gas contribution to on galactic scales is generally neglected (though a 36% correction for He is applied) since most of the hydrogen is expected to be in molecular form at the high densities inferred () and Damped Lyman Absorbers studies indicate a slow evolution in HI gas density (; Péroux & Howk, 2020).
5.2 Metallicity and ISM Conditions
The metal content of galaxies is a sensitive probe of the baryon cycle, carrying the imprint of gas accretion, stellar nucleosynthesis, galactic winds, and internal gas mixing. Observational constraints for SFGs have largely come from strong rest-optical nebular emission lines, interpreted through empirical and/or theoretical calibrations in terms of the gas-phase oxygen abundance (O/H). These lines also depend on the nebular conditions and structure, and on the excitation sources, affecting calibrations. The reviews by Maiolino & Mannucci (2019) and Kewley et al. (2019) discuss in detail the strengths and limitations of various indicators, and stress the importance of combining multiple diagnostics, of adopting the same method(s) to reduce the impact of systematic differences in calibrations, and of using consistent approaches in deriving galaxy properties (, SFR, …) used to establish scaling relations.
[480pt] \entry{sansmath} Local electron density, the number of electrons per unit volume of an ionized nebula.
Offsets in the location of (non-AGN) SFGs relative to the excitation sequences in line ratio diagrams have long been known (e.g., in [NII] and [SII] vs. [OIII], and ([OII][OIII]) vs. [OIII][OII]). The growing near-IR spectroscopic data sets at have enabled a more systematic exploration of the origin of the observed offsets, providing evidence for evolving conditions of the ionized gas in terms of a harder ionizing radiation, elevated N/O abundance ratio, higher electron density and ISM pressure, and higher ionization parameter, at fixed O/H abundance (e.g., Masters et al., 2016, Steidel et al., 2016, Strom et al., 2018, Kashino et al., 2019). Other factors may be at play such as the presence of weak AGN activity, galactic-scale outflows and shocks, and diffuse ionized gas — the importance of which varies with redshift — as well as sample selection, and aperture and weighting effects where spectra of high- and low- galaxies may encompass different physical regions and span a range of excitation (e.g., Shapley et al., 2015, 2019, Kaasinen et al., 2017, Sanders et al., 2017). Constraints on the electron density of ionized gas have also been obtained from the [OII] and [SII] doublet ratio, pointing to an increase with redshift, with in the range for SFGs compared to for galaxies (e.g., Sanders et al., 2016a, Kaasinen et al., 2017). These estimates may be somewhat inflated by emission from denser gas in the ubiquitous galactic winds at (Section 7.3) in the single-component line fits commonly performed.
Turning to metallicity, while the “strong line” methods based on nebular rest-optical emission can lead to systematic differences in by up to , relative estimates based on the same calibration are more accurate. The general shape and evolution of the mass-metallicity relation (MZR) agree qualitatively among various studies out to , with lower metallicities at lower , an overall decline in metallicity at earlier times, and a stronger evolution in the low-mass regime, in agreement with the (scarcer) results from rest-UV metallicity-sensitive features in young stars (see Maiolino & Mannucci, 2019). Among several proposed parametrizations, the form is physically motivated based on considerations of the chemical yields in the presence of inflows and outflows. It describes well the bending shape of the MZR up to , where is the asymptotic value at high mass and is the evolving turnover mass (with where ) below which the relation follows a power law of index (e.g., Zahid et al., 2014, Wuyts et al., 2014, and references therein; see Figure 4).
[95pt] \entryMZRStellar mass - metallicity relation. \entryFMRFundamental metallicity relation, linking stellar mass, metallicity, and SFR.
A secondary dependence on the SFR, ultimately tied to the gas fraction, is expected in a theoretical framework, where accretion of metal-poor gas dilutes the galactic gas-phase metallicity while increasing the gas reservoir fueling star formation. Based on the large set of SDSS local galaxy spectra and first results at high , Mannucci et al. (2010) proposed a redshift-invariant fundamental metallicity relation (FMR) between , , and SFR, parametrized in terms of . While subsequent work at high has led to mixed results possibly due to the limited dynamic range and uncertainties in SFRs, a consensus is now emerging for the detection of a FMR albeit with hints of a modest evolution with lower at fixed and SFR to , and possibly stronger evolution at (e.g., Sanders et al., 2018, Maiolino & Mannucci, 2019). Such an evolution may reflect a progressive increase of the mass loading factor of galactic winds (the ratio of mass outflow rate to SFR) and/or decrease of the metallicity of inflowing gas with lookback time; beyond , infall rates of more pristine gas may overwhelm metal production through stellar nucleosynthesis, resulting in stronger dilution. Theoretical models and numerical simulations that match the observed MZR, FMR, and evolution thereof underscore the role of stellar feedback in the chemical evolution of galaxies, requiring an increasing in lower-mass galaxies and winds removing gas at roughly the same rate as consumed by star formation around (e.g., Erb, 2008, Lilly et al., 2013, Muratov et al., 2015, Davé et al., 2017). More direct observational constraints on at will be discussed in Section 8.0.1.
5.3 AGN Demographics
The link between the growth of galaxies and their SMBHs, deduced from local scaling relations and the co-evolution in cosmic SFR and black hole accretion rate densities, has motivated an abundant literature on AGN activity and feedback across cosmic time (e.g., Fabian, 2012, Heckman & Best, 2014, Lutz, 2014, Brandt & Alexander, 2015, Padovani et al., 2017, for reviews). We summarize key aspects on the demographics of radiative-mode AGN at high .
[300pt] \entry{sansmath} X-ray AGN luminosity, generally computed in the rest-frame hard band and corrected for absorption.
AGN, identified at X-ray and other wavelengths, are preferentially found in higher mass galaxies, which, for an underlying positive correlation between AGN luminosity and host mass, reflects flux limits in the data from which AGN are identified. Comparisons of the host properties of X-ray-selected AGN with those of mass-matched samples of inactive galaxies showed that AGN reside mainly in MS SFGs with little correlation between X-ray luminosity and SFR, are rarely associated with disturbed morphologies, but are more prevalent in hosts with denser stellar cores (e.g., Silverman et al., 2009, Kocevski et al., 2012, 2017, Mullaney et al., 2012a, Santini et al., 2012). The lack of correlation between and SFR is understood in terms of the short-term variability of AGN compared to the timescales of galactic star formation processes (e.g., Hickox et al., 2014). X-ray stacking analyses, effectively averaging over time, revealed a closer connection between inferred SMBH accretion rate and host SFR (e.g., Mullaney et al., 2012b). The ratio of average SMBH accretion rate to SFR appears to be largely independent of galaxy stellar mass, and so is the distribution of specific (often taken as a proxy for the Eddington ratio; e.g., Aird et al. 2012, 2018). While the distribution in specific shifts to higher values towards higher , a mass-independent distribution at fixed implies that a wider range of is probed at higher host mass. AGN selected by rest-optical and mid-IR diagnostics are less prone to variability effects but susceptible to similar biases related to “dilution” by host galaxy emission (e.g., Padovani et al., 2017). A longer term connection between and SFR, coupled with evidence from morphologies, is consistent with a picture in which AGN are fueled by stochastic accretion, and secular processes (rather than major mergers) within the gas-rich hosts promote the growth of both SMBH and a central bulge (e.g., Mullaney et al., 2012b). The exception might be for the most luminous and most obscured mid-IR-selected AGN, underrepresented in X-ray surveys, whose morphologies are significantly more frequently disturbed or indicative of merging (Donley et al., 2018).
Observations, as well as theoretical models and cosmological simulations (e.g., Somerville & Davé, 2015, Naab & Ostriker, 2017) support a link between AGN and star formation quenching at high masses. Causality, however, remains so far elusive. Empirical connections through galactic structure and outflows are discussed in Sections 6.1 and 7.3.
6 RESOLVED PROPERTIES OF STAR-FORMING GALAXIES at z 2
Our understanding of the processes driving the evolution of the global galaxy properties discussed above has greatly benefitted from the growing amount of data resolving individual galaxies. A key finding was that high SFGs are predominantly disks, albeit more turbulent than local spirals. The growth and evolution of disks as derived from stellar light, star formation, and kinematic tracers is first discussed (Sections 6.1 - 6.3), followed by emerging dynamical constraints on the interplay between baryons and DM on galactic scales (Section 7.1) and deviations from disk rotation (Section 7.2). Non-gravitational motions (i.e., gas outflows) are then addressed, as direct probe of feedback in action (Section 7.3).
6.1 Star-Forming Galaxies as Axisymmetric Systems
6.1.1 Morphological disk settling and the emerging Hubble sequence
Many key features regarding the structural build-up of SFGs can be captured in a framework where we consider them as flattened, axisymmetric structures. This approach also fundamentally underpins semi-analytical models where any structural evolution is only described radially. Intrinsic 3D shapes inferred from projected axial ratio distributions illustrate how at any given epoch there is a tendency of increased fractions of SFGs with prolate (i.e., elongated) shapes in the low-mass regime, whereas the fraction of oblate (i.e., disky) systems increases with mass and toward later times (van der Wel et al., 2014b, Zhang et al., 2019). This downsizing pattern for morphological disk settling finds its counterpart in kinematic surveys, which show similar mass and redshift dependencies for orderly rotating disk fractions, with dispersion-dominated systems gaining in prevalence toward lower masses (see Section 6.3 and Figure 4). This Section discusses the radial characteristics of SFGs with an emphasis on relatively massive () systems for which the axisymmetric disk framework is most appropriate. In the next Section we discuss how or where the actual morphology deviates from axisymmetry.
Salient features of the size-mass relation of SFGs were discussed in Section 4.4. The same HST surveys also shed light on surface brightness profile shapes, often quantified parametrically with a Sérsic model. For the MS population, exponential disk profiles of are the norm (Wuyts et al., 2011b), in line with the disk-like nature inferred from axial ratios and kinematics. Exceptions arise more frequently at the very tip of the MS, and among the rare population of starbursting outliers above the MS, which on average are characterized by more centrally concentrated profiles. We can conclude that the overall structure quantified from rest-optical/UV light and colors correlates with location in the plane, with most star formation happening in disks while quiescent galaxies feature cuspier profiles. A Hubble sequence, where the dominant morphology and stellar populations are intimately tied, can thus be said to be in place already since at least .
While it is most straightforward to compare sizes and profile shapes across epochs at fixed mass, individual galaxies build up stellar mass over time through star formation and mergers. Applying the cumulative comoving number density technique outlined in Section 2.5, progenitor-descendant sequences have been reconstructed to reveal the growth in size and build-up of extended profile wings around central cores for galaxies at the most massive end and to recover the structural growth history of Milky Way progenitors (van Dokkum et al., 2010, 2013, see also Patel et al. 2013b). The latter feature a more modest size growth and at least at a more self-similar evolution in profile shape than the most massive galaxies which increase rapidly in Sérsic index.
Other than by disentangling the population growth from growth of individual systems, major advances in our understanding of structural evolution are arising from comparing multiple tracers. Initially, this focused on rest-UV to rest-optical stellar emission, but increasingly this is complemented by resolved probes of ionized and molecular gas as well as reprocessed emission by dust.
[420pt] \entryM/LMass-to-light ratio.
6.1.2 Stellar mass distributions
With resolved imaging sampling the distribution of stellar light below and above the Balmer/4000Å break out to a picture has emerged in which negative color gradients (i.e., redder centers than outskirts) become increasingly prominent towards the high-mass end and at later times (e.g., Liu et al., 2017, 2018). The age-dust degeneracy in a space of mass-to-light (M/L) ratio vs. rest-optical color (e.g., Bell & de Jong, 2001) allows for a relatively robust translation of the multi-band light maps to a stellar mass distribution (Wuyts et al., 2012, Szomoru et al., 2013, Tacchella et al., 2015, Wang et al., 2017, Suess et al., 2019, see Figure 5). In common to such studies is the finding of more compact and centrally concentrated stellar mass profiles compared to those observed in light, especially at lower redshifts and higher masses. Carrying out bulge-disk decompositions on stellar mass maps, Lang et al. (2014) find that while SFGs are well described by exponential disks at low masses, once crossing the Schechter mass they already contain 40-50% of their stars in a bulge component, even prior to their eventual quenching. Overall, taking both SFGs and quiescent galaxies together, it is now well established that measures of bulge prominence or central surface density (e.g., ; Cheung et al., 2012, Barro et al., 2017a, see Figure 4) form much more reliable predictors of quiescence than stellar mass by itself. However, the origin of this strong correlation, in particular its interpretation in terms of a causal connection, remains debated (Lilly & Carollo, 2016, Abramson & Morishita, 2018). Building on the increased prevalence of AGN with host central stellar mass density and the empirical inference that quenching sets on when the cumulative radiative energy of SMBHs reaches the halo binding energy, Chen et al. (2020) recently put forward a phenomenological model that strengthens the role of AGN in quenching by explaining naturally the structural differences between star-forming and quenched galaxies.
6.1.3 Observed H profiles
WFC3 grism surveys such as 3D-HST (Momcheva et al., 2016) give access to the H surface brightness distributions on kpc scales for galaxies out to . Such observations have illustrated that the H emission of MS galaxies, tracing the unobscured instantaneous star formation, follows on average exponential disk profiles (Nelson et al., 2013), and that there is a resolved equivalent of the MS, a correlation between the local star formation and stellar surface density (Wuyts et al. 2013; see also Wang et al. 2017). Deviations from this relation are seen in the centers of – particularly massive – SFGs, with also asymmetric features such as clumps contributing to the scatter (Section 6.2). Stacking H and maps of 3200 SFGs Nelson et al. (2016b) find the (unobscured) star formation to be slightly more extended than the stellar continuum emission, with a weak dependence on mass: . Translated to H equivalent widths (EWs) this results in centrally dipping profiles, with the central depression in H EW being most prominent at the high-mass end. AO-assisted IFU surveys were able to push resolved H EW measurements out to , resulting in qualitatively similar findings (Tacchella et al., 2015). With such{marginnote}[130pt] \entryEWEquivalent width, for an emission line equal to the ratio of line flux to continuum flux density. numbers at present limited to a few dozen (fewer when considering the high-mass end alone) and accumulated at a rate of one 8-m telescope night per object, significant progress on number statistics here is anticipated from grism observing modes on JWST. Already with existing ground-based (yet seeing-limited) instrumentation, however, larger samples with consistent continuum and H size measurements over the full range can be compiled. Doing so, Wilman et al. (2020) find an average size ratio of , without significant dependence on the redshift, mass and star formation activity. Adopting the observed size ratio as an upper limit to (a limit due to the possible presence of differential extinction and dust gradients), they infer the associated size growth due to star formation alone to proceed along a vector of , consistent with results from constant comoving number density arguments and only slightly steeper than the observed slope of the size-mass relation at any epoch. Other processes than simply adding new stars, such as feedback, angular momentum redistribution, (minor) mergers and the preferential quenching of more compact SFGs may need to be invoked to reconcile the relatively slow growth due to star formation with the observed size evolution of SFGs.
6.1.4 Attenuation gradients
In the absence of dust all of the above radial profiles, size differences, and red centeredness would be attributed most straightforwardly in terms of stellar population age (or sSFR) gradients consistent with a picture of inside-out disk growth. SFGs at cosmic noon however are far from dust free, particularly in the massive and highly star-forming regime where most of the internal color dispersion (e.g., Boada et al., 2015) and radial gradients are seen. With only a single rest-optical color, the effects of age and dust are fully degenerate. While this enables a robust estimate of spatial M/L ratio variations, explaining the origin of these variations (spatially inhomogeneous SFH vs. extinction) is by the same token a challenging task. Several approaches have been pursued to pin down to which degree levels of extinction vary across galaxy disks. Wuyts et al. (2012) used resolved SED modeling of 7-band ACS+WFC3 photometry to constrain the stellar populations of individual pixel bins in SFGs. Nelson et al. (2016a) were able to extract a more direct probe of extinction for SFGs in the form of the Balmer decrement (H/H), although relying on stacked profiles for relatively broad bins in stellar mass. Complementary broadband approaches further include use of the dust-sensitive UV slope (Tacchella et al., 2018) and a rest-frame color-color diagram (Wang et al., 2017, Liu et al., 2017).
While quantitative differences remain and direct comparisons are complicated by differences in applicable redshift range and technique (e.g., individual galaxies vs. stacking), a converging picture is emerging. Galaxies do feature radial gradients in extinction, with the amount of central enhancement increasing with stellar mass, reaching magnitudes of central extinction at the high-mass end. Propagating this knowledge to the reconstruction of sSFR profiles yields on average surprisingly flat profiles over the full radial range for intermediate mass galaxies. Only among the most massive galaxies central drops in the star formation activity remain present after dust correction, a trend that is interpreted as a signature of inside-out quenching. For example, Tacchella et al. (2018) exploit near-IR AO-assisted IFU data at to find a radially constant mass-doubling timescale of Myr for SFGs below , and central star formation suppression by a factor of above this mass. At , Wang et al. (2017) report qualitatively similar results with flat sSFR profiles for SFGs below and central declines of 20-25% above this mass. (see also Liu et al., 2016). The flat inferred sSFR profiles of intermediate mass galaxies are seemingly at odds with the inside-out growth inferred from constant comoving number density arguments (Section 6.1.1). Possibly the stellar build-up proceeds more rapidly outside the inner within which most stellar population and dust gradients have been quantified, but it has also been argued that the mass-weighted size growth may be more modest than the observed light-weighted one (Suess et al., 2019). Resolved diagrams and direct measurements444 It should be noted that at the resolution of the WFC3/G141 grism H and [NII] are blended and additionally underlying stellar absorption, especially to H, should be accounted for. of radial Balmer decrement profiles of individual galaxies will undoubtedly play a vital role in progressing our understanding of where within SFGs stars are formed, and are within reach of JWST’s imaging and (grism) spectroscopic capabilities. That said, we caution that the central effective of magnitudes inferred for massive SFGs under a foreground screen approximation may well conceal total dust column densities that are several times higher, depending on the dust geometry, its clumpiness and albedo (Seon & Draine, 2016). We thus conclude that dust modeling at present poses a key challenge to quantifying galaxy sizes and SFR distributions at the massive end.
6.1.5 Compact dusty cores and implications for SFR profiles
Having highlighted the significant role of dust, it is important to underline the potential offered by far-IR to radio observations to complement our view of where star formation is happening (as seen reprocessed by dust) and where within the disks cold gas, the fuel for star formation, resides (as revealed by CO line emission). Here, ALMA, NOEMA and the JVLA with their recently enhanced sensitivities and long baselines are making major contributions. In low- CO transitions, MS galaxies feature a similar extent as observed in the (rest-)optical. This appears to be the case both at (Tacconi et al., 2013) and (Bolatto et al., 2015), although numbers in the higher redshift bin remain limited. A different picture is painted when considering continuum probes of star formation. Comprised predominantly of non-thermal synchrotron radiation from charged particles accelerated within supernova remnants, 1.4 GHz continuum emission serves as a dust-unbiased SFR tracer (Condon, 1992). Using a uv-stacking algorithm to trace the 1.4 GHz continuum size evolution of MS SFGs with spanning , Lindroos et al. (2018) find the measured radio sizes to be typically a factor of two smaller than those measured in the rest-optical. Likewise, focusing on thermal dust emission from a sample of normal MS galaxies at , Tadaki et al. (2017a) combined ALMA observations in compact and extended configuration to infer that the dust sizes of their targets were more than a factor of two smaller than those observed at rest-optical (and even more so H) wavelengths.
These results are in contrast to what naively would be anticipated given the typical centrally declining H EWs in the same high-mass regime at , even after dust corrections. Star formation happening in such centrally concentrated cores could in several hundred Myr build up a central bulge with , akin to the central densities of lower redshift quiescent systems. Resolved maps at a second, higher frequency IR wavelength are needed to rule out or reveal any negative gradients in dust temperature that may bias the inferred half-SFR sizes to low values. In the handful of objects where resolved CO and dust continuum measurements are both available, authors also noted the smaller dust compared to CO sizes (Spilker et al., 2015, Tadaki et al., 2017b). Rujopakarn et al. (2016) on the other hand found 5 cm and 1.3 mm sizes of somewhat lower mass () SFGs at the same redshift to both be comparable to the extent of the stellar mass maps. Enhancing the robustness of multi-tracer structural measurements and interpreting the relative sizes of dust, stellar, and H emission as a function of mass stands as an important challenge for future studies. This applies especially to reconciling the apparently inconsistent findings from cold ISM and H observations at the massive end. At present, ambiguity remains whether this is due to uncertain dust corrections or instead differences between samples that fit into a common evolutionary sequence where massive galaxies undergo compaction events triggering nuclear starbursts (responsible for the compact dust sizes) followed by a phase of inside-out quenching (responsible for the centrally declining H EWs; e.g., Tacchella et al. 2016).
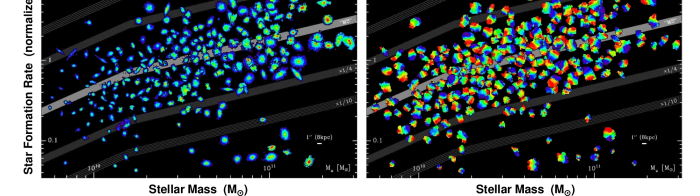
6.2 Deviations from Axisymmetry
6.2.1 Shapes and morphologies
Thus far, we discussed the structural properties of high-z SFGs in terms of sizes and radial profiles. Skewed axial ratio distributions for low-mass () SFGs at cosmic noon suggest that a framework of flattened axisymmetric disks may be inappropriate for young systems that have not had the time to settle into an equilibrium disk configuration (Law et al., 2012b, van der Wel et al., 2014b). Modeling the joint distribution of projected axis ratios and sizes, and accounting for the finding that smaller SFGs are systematically rounder, Zhang et al. (2019) argue that prolate and/or spheroidal shapes may in fact be even more common than inferred by van der Wel et al. (2014b), also for the regime. They report young, low-mass galaxies in the VELA set of high-resolution hydrodynamical cosmological zoom-in simulations to be prolate as well. Kinematics reveal a qualitatively similar trend, with a threshold mass for disk settling that decreases with decreasing redshift (Section 6.3).
Even above , the morphological appearance of high- SFGs often looks markedly different from that of the relatively smooth disk population in the local Universe. Rising fractions of irregular morphologies were first noted in early HST observations probing the rest-UV (Griffiths et al., 1994, Windhorst et al., 1995, Abraham et al., 1996), and later quantified using the larger samples provided by rest-optical legacy surveys such as CANDELS (e.g., Conselice, 2014, Huertas-Company et al., 2016). Methods to quantify the evolving morphological mix through cosmic time encompass non-parametric morphological measures (e.g., concentration, asymmetry, Gini, M20; Conselice 2003; Lotz et al. 2004) or Principal Component Analysis thereof (Peth et al., 2016), visual classifications by experts or citizen scientists (e.g., Kartaltepe et al., 2015, Simmons et al., 2017), and increasingly deep-learning techniques using visually classified training sets (Huertas-Company et al., 2015) as well as unsupervised machine learning (Hocking et al., 2018). Cross-comparisons often show a good concordance between these approaches. This does however not mean that the physical origin of the irregular morphologies, often featuring asymmetries in the form of off-center clumps, can be readily interpreted. While historically frequently used alongside pair counts to quantify the evolution in merger rates, the clumpy morphologies are nowadays more often interpreted as massive star-forming regions originating in marginally stable, gas-rich disks. The tightness of the MS, kinematic evidence for ordered rotation, average surface brightness profiles and axial ratio distributions as well as probes of the cold gas reservoirs all contributed to this paradigm shift. In addition, the wavelength dependence of clumpy morphologies (more prominent in the rest-UV where they are identified) attributed to spatial variations in the SFH and/or dust extinction also imply that the underlying mass distribution is smoother than the galaxies appear in light, unlike what may be expected from mergers (e.g., Wuyts et al., 2012, Cibinel et al., 2015).
Indeed, several studies have addressed the ability to identify mergers at cosmic noon by exploiting mock observations of galaxies extracted from simulated cosmological volumes where their (non-)merger state is intrinsically known (e.g., Snyder et al., 2015, Thompson et al., 2015). This exercise reveals dependencies of completeness and contamination fraction of the selected mergers on merger stage, viewing angle, and depth of observation, yielding in some of the simulations that reproduce realistically high gas fractions at results that are no better than a random guess (Abruzzo et al., 2018).
This does not imply that mergers do not happen, nor that all clumps share the same formation process. Targeting mostly higher redshifts (), Ribeiro et al. (2017) find the most massive clumps () to typically reside in galaxies featuring just 2 clumps, arguably interpretable as a merger, whereas less massive clumps () occur in galaxies featuring a larger number of them, consistent with disk fragmentation. The distinction between ex-situ and in-situ clumps, with the former featuring higher masses and older stellar ages, is also seen in hydrodynamical simulations (Mandelker et al., 2017).
6.2.2 Clump properties
Turning to the properties of individual clumps, a first realization stemming from multi-band stellar population analyses of these features is that, while striking in appearance, they do not dominate the integrated UV emission of the galaxies, let alone add up to a major contribution of the star formation, and even less so account for a substantial fraction of the overall stellar mass. While a precise breakdown depends on details of sample selection, clump selection (e.g., threshold depth and wavelength), and whether and how underlying diffuse disk emission is accounted for (e.g., Förster Schreiber et al., 2011, Guo et al., 2018), different censuses report clump contributions (i.e., summed over all clumps) to the overall UV emission, SFR, and stellar mass of mass-selected SFGs at cosmic noon of , and , respectively (Wuyts et al., 2012, Guo et al., 2015, Soto et al., 2017). The fraction of SFGs that appear clumpy is itself a function of both mass and redshift. While of low-mass () SFGs features clumpy UV morphologies over the full range, the clumpy fraction for intermediate and high-mass SFGs drops from 55% to 40% and from 55% to 15% over the same range, respectively (Guo et al., 2015).
The characteristic scales of giant star-forming clumps reported in the literature are on the order of a kiloparsec, with corresponding stellar masses ranging up to a few (e.g., Förster Schreiber et al., 2011, Guo et al., 2018). These scales are in accordance with the Toomre scale and mass anticipated for gravitational instabilities within gas-rich turbulent disks (Elmegreen, 2009, Genzel et al., 2008, 2011, Dekel et al., 2009a). It is worth noting though that structures on these scales are only marginally resolved in studies of field galaxies, and may correspond to conglomerations of blended clumps of smaller physical scales. Samples of a handful of lensed galaxies reaching spatial resolutions of do indeed reveal progressively smaller clump sizes as the resolution is enhanced with respect to blank field observations (Dessauges-Zavadsky et al., 2017, Rigby et al., 2017). This is illustrated perhaps most convincingly in the analysis of multiple lensed images of the same object at different magnifications (Cava et al., 2018). In this light, zoom-in simulations of turbulent gas-rich disks resolving the multi-phase ISM on parsec scales will prove useful in tracing fragmentation below the Toomre scale and interpreting the higher resolution observations that will become feasible with JWST and ultimately the extremely large telescopes. Already, first attempts on lensed samples are made to characterize the clump mass functions (Dessauges-Zavadsky & Adamo, 2018), yielding results consistent with a power-law slope of anticipated for fragmentation due to a turbulent cascade (Chandar et al., 2014, Adamo et al., 2017).
Typical stellar ages inferred for the star-forming clumps are on the order of (Förster Schreiber et al., 2011, Wuyts et al., 2012, Guo et al., 2012, 2018). A single massive clump consisting almost entirely of line emission (i.e., massive in gas, but an order of magnitude lower in stellar mass) was discovered by Zanella et al. (2015), for which they estimate an age of , confirming the in-situ formation by gravitational collapse as origin of the clump phenomenon. Mimicking the azimuthally averaged radial trends of stellar population tracers discussed in Section 6.1, clumps themselves also feature redder rest-optical colors, lower H EWs, and – inferred from those – older ages (by a few 100 Myr) and lower sSFRs towards the galaxy centers (Förster Schreiber et al., 2011, Adamo et al., 2013, Guo et al., 2012, 2018, Soto et al., 2017). The gradients steepen with increasing stellar mass and decreasing redshift, and are found to be overall steeper than the radial gradients observed for the intra-clump regions (Guo et al., 2018). As a caveat we note that in most of these studies radial gradients are quantified on the basis of ensembles of clumps collected from multiple galaxies within relatively coarse bins of mass and redshift, as the number of detectable clumps in individual systems remains limited.
The longevity of clumps forms an outstanding question with significant implications for the subsequent structural evolution of the galaxies that host them. If remaining intact and surviving internal stellar feedback for a few hundred Myr, their inward migration due to dynamical friction is predicted to be an efficient mode of in-situ bulge growth (e.g., Bournaud et al., 2007, Elmegreen et al., 2008, Ceverino et al., 2010). On the other hand, simulations with stronger feedback implementations such as FIRE (Oklopčić et al., 2017) and NIHAO (Buck et al., 2017) feature shorter clump lifetimes ( Myr) and substantially less inward migration. Despite their differences both flavors of simulations claim to reproduce the observed phenomenology of wavelength dependent clump prominence, their characteristic stellar ages and even radial gradients (e.g., Oklopčić et al., 2017, Mandelker et al., 2014). A duty cycle argument relating the existence of a very young clump as found by Zanella et al. (2015) to the abundance of equally massive clumps that are older supports long inferred clump lifetimes (). Measured ages of the stellar populations in clumps may not necessarily match the timescale of clump survival as clumps are in constant interaction with their surrounding disk due to outflows, tidal stripping, and continued accretion (Bournaud et al., 2014). Perhaps the observable with most discriminating power between the different suites of simulations will prove to be the gas fraction, on an individual clump basis, but even already at the galaxy-integrated level.
6.3 Star-Forming Galaxies as Rotating Turbulent Disks
Near-IR IFU observations, mainly of H but also [OIII] or [OII] line emission, have provided the most comprehensive and detailed censuses of the kinematic properties of SFGs, and the most convincing evidence for the prevalence of disks among them. Mitigating M/L variations that can complicate the interpretation of morphologies, especially at , kinematics trace the full underlying mass distribution and are a sensitive probe of a system’s dynamical state. Spatially-resolved kinematics of cold gas line emission from (sub)mm interferometry are still scarce for typical MS SFGs, and while near-IR slit spectra have also been exploited to derive emission line kinematic properties, they give spatially limited information with larger uncertainties related to slit placement relative to the galaxy center and kinematic axis. Stellar kinematics at are still restricted to quiescent galaxies, absent of young hot stars filling in absorption features, and in all but a few cases are limited to galaxy-integrated velocity dispersions.
The first step in exploiting 3D kinematic data is to identify the nature of the galaxies. Different procedures are followed but they conceptually rely on similar criteria based on 2D maps, and on the main derived parameters of maximum rotation velocity and local velocity dispersion corrected as appropriate for spatial and spectral resolution and for galaxy inclination (extraction methods are summarized in the Supplemental Text). The basis is encapsulated in the following set of disk criteria adopted in several studies, motivated by expectations for an ideal rotating disk, and increasingly stringent and demanding of the data (e.g., Förster Schreiber et al., 2018, Wisnioski et al., 2019):
-
1.
a smooth monotonic velocity gradient across the galaxy, defining the kinematic axis;
-
2.
a centrally peaked velocity dispersion distribution with maximum at the position of steepest velocity gradient, defining the kinematic center;
-
3.
dominant rotational support, quantified by the ratio;
-
4.
co-aligned morphological and kinematic major axes (a.k.a. kinematic misalignment);
-
5.
spatial coincidence of the kinematic and morphological centers.
Application of these criteria is usually done from measurements of the parameters and visual inspection, or through comparisons to disk models. Kinemetry, an approach based on harmonic expansion along ellipses of the moment maps of the line-of-sight velocity distribution, has also been used in some studies to quantify the degree of asymmetry in velocity and dispersion maps, either as main classification or in support of the criteria above. Details on disk modeling and kinemetry can be found in the Supplemental Text. It is increasingly common to supplement the kinematic criteria with information on galaxy morphology and possible companions, e.g., from HST imaging, for a more complete characterization.
[!t]
7 KINEMATIC PROPERTIES
Rotation curve (RC):
Rotation velocity vs. galactocentric radius . For a “Freeman” thin
disk with exponential surface density distribution, scale length ,
and ,
,
where is the gravitational constant, is the central surface
density, and and are the modified Bessel functions of order .
At fixed mass profile , thick disks
(scale height )
have a lower peak reached at larger radius,
while in the spherical approximation the peak is lower and at
smaller radius
(Freeman, 1970, Binney & Tremaine, 2008, Noordermeer, 2008).
{sansmath}:
Maximum intrinsic rotation velocity (i.e., corrected for beam smearing and
galaxy inclination when measured from observations), with
denoting the radius where it is reached in intrinsic space.
{sansmath}:
Intrinsic rotation velocity at , where a Freeman disk
RC peaks (corresponding to ). For profiles,
differs from the peak .
:
Local intrinsic velocity dispersion (i.e., corrected for beam smearing when
derived from observations); it is assumed to be isotropic and constant across
disks (Section 7.0.2).
{sansmath}:
Circular velocity, here as a measure of the potential well. For a thin
disk, ; for a thick disk with non-negligible
turbulent pressure gradient,
(e.g., Burkert et al., 2016).
{sansmath}:
Alternative kinematic estimator for a spherically symmetric system in an
isothermal potential, defined as
(e.g. Weiner et al., 2006a).
{sansmath}:
Enclosed dynamical mass. For a spherical distribution,
;
for a Freeman disk,
(Binney & Tremaine, 2008).
{sansmath}, ,
:
Ratio of stellar, baryonic, and DM mass to dynamical mass.
{sansmath}:
specific angular momentum of a (disk) galaxy, .
The outcome of the morpho-kinematic classification scheme depends on how well the galaxies are resolved and how sensitive the data are. It is usually adequate to provide a first-order description of the system and the basis for quantitative interpretation of the measurements. Deeper data detecting fainter extended emission and/or higher resolution (AO-assisted vs. seeing-limited) set better constraints on the nature of the galaxies and can reveal additional interesting features (Section 7.2). The choice of threshold varies from 1 to 3 between different studies, with the intermediate value of corresponding to equal contribution from rotation and random motions to the dynamical support of a turbulent disk. Several efforts have been devoted to assess the reliability of kinematic classification based on mock observations of template data, encompassing nearby systems to high resolution cosmological simulations. Low misclassification fractions of are generally obtained for disks and major mergers alike, with the range reflecting the specific criteria employed, and data resolution and S/N (Shapiro et al., 2008, Épinat et al., 2010, Bellocchi et al., 2016). Using zoom-in simulations from the VELA suite of isolated galaxies and mergers over many sightlines to create mock-observed data sets in seeing, Simons et al. (2019) conclude that disks are identified with high confidence, while misclassification of mergers as disks varies widely but, unsurprisingly, is lowest () when applying all critera above and folding in HST-like morphological information.
7.0.1 Disk fractions
Recent large kinematic surveys have confirmed the findings from earlier smaller samples that up to a large proportion of massive SFGs are fairly regular disks, albeit with higher velocity dispersions than present-day spirals. The largest and most complete surveys, comprising hundreds of SFGs on/around the MS at with resolved kinematics from KMOS, find of rotation-dominated galaxies (i.e., satisfying criteria 1-3 above, with ; Wisnioski et al., 2015, 2019, Stott et al., 2016), a result borne out by deep AO-assisted SINFONI data of 35 SFGs in the same mass range (Förster Schreiber et al., 2018). Imposing all criteria reduces the disk fractions to . Significant trends in the kinematic mix of SFGs are emerging from IFU surveys, with lower at earlier epochs and, at fixed , towards lower masses (e.g., Wisnioski et al., 2019, Turner et al., 2017). {marginnote}[0pt] \entry{sansmath} Fraction of galaxies classified as disks. These results strengthen and extend out to findings from optical and near-IR slit spectroscopy over (e.g., Kassin et al., 2012, Simons et al., 2017). The dependence on and of the fraction of rotation-dominated galaxies is illustrated in Figure 4 (where the curves are adjusted to match the binned data presented by Simons et al. 2017, Turner et al. 2017, and Wisnioski et al. 2019).555 A sigmoid function in and lookback time is used in Figure 4 so that the fraction is bounded, and because this functional form better reproduces the data in than in . The curves broadly match the trends implied by the linear fits in for different bins given by Simons et al. (2017). The trends reflect primarily those with , with the evolution of largely driving the variation and the connection between and galaxy mass (via the Tully-Fisher relation) dominating the dependence (see Sections 7.0.2 and 7.1.2). They also account for the range in () reported by various studies based on samples of SFGs probing different mass and redshift ranges, in addition to other factors such as S/N, resolution, details and strictness of the classification procedure (e.g., Law et al., 2009, Épinat et al., 2012, Livermore et al., 2015, Mieda et al., 2016, Mason et al., 2017, Girard et al., 2018a, Gillman et al., 2019).
The variation of disk fraction and with galaxy mass and redshift has been interpreted in a “disk settling” scenario (Kassin et al., 2012). Massive SFGs settled earlier into more rotationally-dominated “mature” disks, gradually followed by lower-mass galaxies at later times and with more massive disks being dynamically colder at all epochs. This evolution is reflected in the trends between mass, morphology, and specific angular momentum of disks (discussed in Section 7.1.4). It also finds its counterpart in the structure of the stellar component from HST imaging inferred from the projected axial ratio distributions (Section 6.2), and is qualitatively reproduced by the recent high-resolution TNG50 cosmological simulation (Pillepich et al., 2019).
Sections 7.0.2 and 7.1 focus on the properties of disks identified as described above and interpreted in an ideal disk framework, Section 7.2 comments on deviations thereof. The mass dependence of the disk fraction implies that disk samples preferentially probe, on average, higher mass SFGs compared to mass-selected samples.
7.0.2 Disk turbulence
The elevated gas velocity dispersion of disks is well established and implies that they are geometrically thick,666 For a disk of finite intrinsic thickness , the inclination is obtained via ; for suggested by axial ratio (and ) distributions at , the difference in inclination correction compared to amounts to or less. as observed in HST imaging (e.g., Elmegreen & Elmegreen, 2005, 2017). At the level of beam smearing of high- observations ( in natural seeing, and using AO), unresolved noncircular motions induced by deviations from axisymmetry of the gravitational potential (e.g., massive clumps, bars) or related to outflows may contribute to the measured along with local turbulent gas motions. The agreement in between no-AO and AO data sets (after beam smearing corrections) suggests that potential noncircular motions on scales have little impact on the measurements. For simplicity, is usually referred to as “turbulence.”
Typical dispersions measured in ionized gas are at , compared to at , varying as ; cold atomic and molecular gas measurements at are scarcer but follow a similar evolution albeit with lower dispersions (Übler et al., 2019, and references therein). The evolution is consistent with that of the galactic gas mass fractions in the framework of marginally-stable gas-rich disks in which (e.g., Genzel et al., 2011, Wisnioski et al., 2015, Johnson et al., 2018). At fixed redshift, the scatter in is substantial and there is evidence that an important part of it is intrinsic to the galaxy population, but only a weak or no trend is found between and global galaxy parameters such as , SFR, , mass and SFR surface densities, or inclination (e.g., Jones et al., 2010a, Genzel et al., 2011, Johnson et al., 2018, Übler et al., 2019). Reasons could include limited ranges and uncertainties in properties in a given slice, complex dependence of on more than one parameter, or possible accretion-driven variations on short timescales as recently proposed by Hung et al. (2019) based on FIRE high-resolution numerical simulations. In high S/N AO data of well resolved disks, no convincing trend on spatially-resolved scales has been seen either between , , or even galactocentric radius in the outer disk parts (away from where beam smearing corrections become large and more uncertain; Förster Schreiber et al. 2018, Übler et al. 2019). Given the lack of clear variations, the disk dispersions are thus taken as isotropic and radially constant.
Constraining the physical driver(s) of the gas turbulence at high thus still proves difficult. This supersonic turbulence would rapidly decay within a crossing time () if not continuously powered, and gas accretion from the cosmic web, disk instabilities, and stellar feedback have been proposed as energy sources (see, e.g., summaries by Krumholz et al., 2018, Übler et al., 2019). Theoretical models and numerical simulations make different predictions as to the generated amount of gas turbulence (e.g., Aumer et al., 2010, Hopkins et al., 2012, Gatto et al., 2015, Goldbaum et al., 2015, 2016). The impact of stellar feedback varies a lot depending on the inclusion/treatment of radiation pressure and the location where feedback is injected into the ISM, although a general conclusion is that it can maintain galaxy-wide turbulence of (and is necessary to reproduce various other galaxy properties and scaling relations). In contrast, gravitational processes including gas transport and instabilities within the disks appear to more easily match the observed range of under the conditions prevailing at higher redshifts. Plausibly, both forms of drivers are present as in the unified model of Krumholz et al. (2018), with gravity-driving dominating at earlier cosmic times and a gradual transition to feedback-driving at later times. Further insights will benefit from more direct estimates of cold gas masses in individual galaxies, and maps of the gas, SFR, and kinematics at high spatial and velocity resolution.
7.1 Mass and Angular Momentum Budget
Constraints from resolved kinematics have been used to investigate the mass budget and angular momentum of high SFGs. At , it is important to account for the significant contribution of gas to the baryonic component, and of the random motions to the dynamical support In the turbulent disk framework, the circular velocity (as a measure of the potential well) at radius can be computed through . Corrections can be applied for deviations from profiles (e.g., when a massive bulge is present), and for disk “truncation” appreciably reducing in strongly dispersion-dominated cases (Burkert et al., 2016). The enclosed dynamical mass can be estimated, for instance at , through , where is the gravitational constant. This expression is for the spherical approximation; for an infinitely thin Freeman disk the values would scale down by . Other methods to derive dynamical masses have been used, including a two-pronged approach applying the rotating disk estimator neglecting pressure support for rotation-dominated disks (i.e., taking ) and through the virial mass estimator with the integrated dispersion for dispersion-dominated sources ( with in the range typically adopted). Forward modeling accounting for disk thickness and turbulence, and fitting simultaneously the velocity and dispersion profiles, incorporates self-consistently all relevant effects though comparisons with simpler approaches as outlined above indicate overall agreement within (e.g., Förster Schreiber et al., 2018).
7.1.1 Dynamical vs. baryonic mass estimates
In the most straightforward approach to constraining the mass budget, global dynamical mass estimates are compared to stellar and gas mass estimates. Studies based on near-IR IFU or slit spectroscopy data generally concur on overall elevated baryonic mass fractions , with large scatter, among SFGs (e.g., Förster Schreiber et al., 2009, Stott et al., 2016, Price et al., 2020). Modeling deep H kinematic data over a wide range across from the survey in legacy fields providing detailed constraints on galaxy stellar and size properties, Wuyts et al. (2016b) found a large rise in derived within the central regions from at to at and a modest increase in stellar mass fraction from to , reflecting the evolution. The scatter at fixed is driven by positive correlations with average stellar and gas mass surface densities at . These trends hold when accounting for mass incompleteness or considering only progenitors of galaxies, and are fairly robust to SED modeling assumptions or gas scaling relations among plausible choices. At , the -based results thus leave little room for DM mass contribution () within the probed by the observations. Noting that the analyses above are for a Chabrier IMF, more bottom-heavy galaxy-wide IMFs such as a Salpeter slope down to would also be disfavored.
[95pt] \entryTFRTully-Fisher relation, linking measures of a galaxy mass and kinematics. Various forms are considered, involving or as a function of , , , or .
7.1.2 Tully-Fisher relation
The Tully-Fisher relation (TFR) relates measures of galaxy mass to the full potential well; it is thus sensitive to the galactic baryonic content and can place powerful constraints on cosmological disk formation models (e.g., Mo et al., 1998, Dutton et al., 2007, Somerville et al., 2008, McGaugh, 2012, among many others). Kinematic studies agree on the existence of a TFR out to and on the reduced scatter about the relation when accounting for pressure support in the turbulent high disks but with mixed outcome as to the evolution, ranging from none over (e.g., Kassin et al., 2007, Miller et al., 2012, Tiley et al., 2019a) to significant in the sense of lower disk mass at fixed velocity for samples (e.g., Cresci et al., 2009, Turner et al., 2017, Übler et al., 2017). The conclusions hinge on several interrelated factors including the adopted form and parametrization of the relation, galaxy sample properties, and choice of reference TFR (Übler et al., 2017, Tiley et al., 2019a). The range in galaxy parameters spanned by the high data sets generally hampers reliable fits to the slope of the relation, such that the evolution is usually quantified in terms of the zero-point (ZP) obtained assuming a non-evolving slope. The magnitude of the ZP offsets also depends on whether the relation is constructed from the stellar or the baryonic mass, and from , , , or .
Exploiting the wide baseline from , the study of Übler et al. (2017) provided the most self-consistent constraints across cosmic noon based on H kinematics from IFU observations, identical analysis method, selection through uniform data quality, galaxy parameters, and stringent disk criteria, with resulting subsamples well matched in and location around the MS and mass-size relations. Focussing on (fixed-slope) relations in terms of , the stellar TFR shows no significant ZP evolution from to while the baryonic TFR ZP exhibits a negative evolution (lower at fixed ), and both relations imply similar positive evolution since compared to published TFRs. In the latter redshift interval, Tiley et al. (2019a) found instead little, if any, evolution in terms of using matched data quality, methods, and samples over from the KROSS and local SAMI IFU surveys of H. The persisting discrepancies around underscore the importance of disentangling observationally- and physically-driven effects in order to establish firmly the evolution and explore the residuals of the TFR across all of .
7.1.3 Outer disk rotation curves
Constraining the mass distribution from the shape of the rotation curve (RC) alleviates the uncertainties of global M/L conversions for the baryonic components. This approach is challenging at with current instrumentation, as tracing emission line kinematics beyond requires very long integrations.
Recent results from very sensitive H IFU data of a handful of massive star-forming disks extending to showed significant and symmetric drops in the individual RCs beyond their peak (Genzel et al., 2017). Similar falloffs in stacked H RCs reaching constructed from high quality IFU data of typical star-forming disks suggested that this behaviour may be widespread at high , and on average more pronounced towards higher and lower disks (Lang et al., 2017). The outer slopes for these samples are nearly Keplerian, and in stark contrast to the flat or rising RCs of local spirals. The falloffs can be naturally explained as the imprint of baryons strongly dominating the mass over the regions probed by the kinematics together with sizeable levels of pressure support maintained well past the RC peak. The more detailed constraints from the individual extended RCs and dispersion profiles, simultaneously fit with turbulent disk bulge DM halo models, yield with the 3/6 galaxies at having the lowest fractions. In turn, the stacked RC is best matched by models with a high fraction of total bayonic disk mass to DM halo mass , in line with analysis of the angular momenta of a larger sample of SFGs (Burkert et al., 2016) and consistent with abundance matching results once accounting for the high at high (; Moster et al., 2013, Behroozi et al., 2013a). Although the exact numbers depend on details of the distribution of the mass components, the implications of low central DM fractions and an overall high disk to DM halo mass ratio were shown to be fairly robust to the assumptions within plausible ranges.
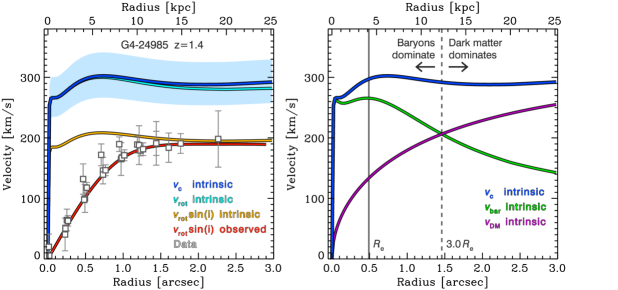
These findings spurred a number of follow-up studies, reporting mixed results. For instance, Tiley et al. (2019b) concluded that the averaged H outer RCs at are flat or rising, in contrast to Lang et al. (2017). As noted by both groups, stacking methodology matters. Re-scaling the data according to the observed radius and velocity at the RC peak as favored by Lang et al. is more sensitive to the relative concentration of baryons vs. DM and, although it relies on detecting a change of slope in the inner velocity gradient, possible biases against recovery of flat or rising RCs were shown to be unlikely. Normalizing instead with the radius and velocity in observed space corresponding to based on fits to the morphologies as favored by Tiley et al. probes the baryonic to DM content on more global scales but any spread in from a range in Sérsic indices would smear the peak in the composite RC. Importantly, the stacked samples are different, with the Lang et al. stricter disk selection resulting in higher mass and ranges compared to Tiley et al.. Comparisons are therefore not straightforward but given the large variations in with radius, the conclusion of Tiley et al. (2019b) that within high SFGs are DM-dominated is not necessarily incompatible with them being strongly baryon-dominated within , even when displaying a flat outer RC in high cases (Figure 6 and, e.g., Übler et al., 2018). On-going extensions to several tens of disks with high quality individual kinematics data are revealing ever more clearly a dependence with galaxy mass, redshift, and measures of central baryonic mass concentration (Genzel et al., 2020), which were apparent in some previous outer RC studies. These trends echo the findings from the global mass budget (Section 7.1.1), account for the strong baryon dominance to reported by van Dokkum et al. (2015) for 10 compact massive SFGs from the declining composite RC inferred from integrated H line widths, and explain the range of conclusions from different outer RC samples.
7.1.4 Angular momentum
The connection between SFGs and their host DM halos has been further explored via measurements of the specific angular momentum . The inferred halo scale angular momenta are broadly consistent in mean and scatter with the theoretically predicted lognormal distribution of halo spin parameters , and the estimates scale approximately as similar to the theoretical (e.g., Burkert et al., 2016, Harrison et al., 2017, Swinbank et al., 2017). The long made assumption that on average , expected if disks retain most of the specific angular momentum acquired by tidal torques in their early formation phases and shown to hold for local spirals (e.g., Fall & Romanowsky, 2013), thus appears to be borne out by observations up to . Even in a population-wide sense, this finding is not trivial given that (i) infalling baryons can lose and gain angular momentum from the virial to the disk scale (e.g., Danovich et al., 2015), (ii) angular momentum can be efficiently redistributed in and out of galaxies (e.g., Dekel et al., 2009a, Übler et al., 2014, Bournaud, 2016), and (iii) of the cosmically available baryons are incorporated into the stellar component of galaxies (; e.g., Moster et al., 2013, Behroozi et al., 2013a) and at most 30% when including gas at (Burkert et al., 2016). Although simulations and semi-analytical models are now able to produce realistic distributions of galaxy size, specific angular momentum, and stellar-to-halo mass ratios, there is no consensus yet on how various mechanisms interact to preserve net angular momentum (e.g., Genel et al., 2015, Zavala et al., 2016, Jiang et al., 2019).
The observed scatter in specific angular momenta has an intrinsic component at all epochs. The low tail encompasses massive early-type spirals and ellipticals at , and more dispersion-dominated (and unstable) as well as more centrally concentrated star-forming disks in the high samples. These correlations reflect an underlying mass-spin-morphology relation that likely underpins the Hubble sequence (e.g., Obreschkow & Glazebrook, 2014) and may suggest that “disk settling” with cosmic time (see Section 6.3) is driven at least in part by angular momentum evolution (e.g., Swinbank et al., 2017). Noting that central mass concentration increases with galaxy mass and thus “disk maturity” (see Sections 6.1 and 6.3), Burkert et al. (2016) found in their sample of star-forming disks a significantly weaker anticorrelation between and central stellar surface density than with the galaxy-averaged and — a result suggesting that accumulation of (low angular momentum) material in the galaxy centers may be decoupled from the processes that set the global disk scale and angular momentum.
7.1.5 Interpreting the mass and angular momentum budget
A consistent picture appears to be emerging in which star-forming disks at are typically baryon-rich on the physical scales probed by the data, with lower DM mass contribution at among more massive, centrally denser, and higher galaxies. These trends are qualitatively reproduced by matched populations (in , SFR, ) in recent cosmological numerical simulations (e.g., Wuyts et al., 2016b, Swinbank et al., 2017, Lovell et al., 2018, Teklu et al., 2018). While the role of the evolving gas content can be easily understood, the trends in mass fractions and ZP of the TFRs point to differences in the relative distribution of baryons vs. DM on galactic scales among SFGs of comparable masses at different cosmic epochs. These have been ascribed to a combination of (i) disk size growth at fixed mass, where the baryons at lower extend further into the surrounding DM halo, (ii) evolving DM halo profiles, with shallower inner profiles at earlier times (e.g., less concentrated, or more cored; Martizzi et al., 2012, Dutton & Macciò, 2014), and (iii) efficient dissipative processes in the gas-rich environments at higher concentrating baryons in the central regions (e.g., Dekel & Burkert, 2014, Zolotov et al., 2015). The weaker coupling between and vs. and (Burkert et al., 2016) would naturally result from inward radial gas transport through the latter processes.
The kinematically inferred low of massive star-forming disks overlaps with the range for massive early-type galaxies — their likely descendants. This echoes evolutionary links based, for instance, on the stellar sizes and central mass densities (Section 4.4 and 6.1), and on the fossil record (e.g., Cappellari, 2016). Current results are summarized in Figure 7 (following Genzel et al. 2017, Übler et al. 2018) incorporating an expanded sample of individually modeled RCs (Genzel et al., 2020). The inverse dependence of with galaxy mass (and mass concentration) is reminiscent of the trends observed in local disks captured by the unified picture of Courteau & Dutton (2015). In this picture, the outward moving transition from baryon-dominated center to DM-dominated outskirts (relative to a fiducial for ) in more massive systems can be tied to the disk size – circular velocity – stellar mass scaling relations, with scatter in attributed at least in part to size variations at fixed . The differentiation in at fixed mass seen between local early- and late-type galaxies (e.g., Courteau & Dutton, 2015) also appears to be present at cosmic noon (e.g., Mendel et al., 2020), which plausibly is rooted in the same processes that lead to the distinction between SFGs and quiescent galaxies in their stellar structural properties (e.g., Lang et al., 2014, van der Wel et al., 2014a).
By necessity, the kinematics of star-forming disks are interpreted in a simplified axisymmetric framework with circular orbital motions. Observations of local disks indicate frequent deviations from this simple assumption caused, for instance, by interactions, warps and other such dynamical instabilities, and radial motions, which are difficult to constrain at the typical resolution and S/N of high- data. Signatures of the latter are discussed in the next Section. Bending instabilities, such as warping or buckling, may be expected to be suppressed or short-lived in gas-rich turbulent disks (see the discussion by Genzel et al., 2017). Minor interaction-induced perturbations may not be ruled out but the exclusion of galaxies with potential companions wherever possible should reduce their role in disk samples. The validity of the disk framework for low-mass objects may be called into question in light of the increasing prevalence of prolate and/or triaxial systems towards lower masses and higher suggested by statistical studies of the morphological axial ratios (Section 6.2), although this may be a lesser concern when applying the morpho-kinematic disk criteria (notably the requirement of kinematic and morphological major axes alignment; e.g., Franx et al. 1991). Furthermore, the generally small and spatially flat residuals in velocity and dispersion maps compared to axisymmetric disk models (resulting from the disk selection criteria employed in most studies) suggest that the potential impact of minor merger perturbations and prolateness/triaxiality is small in the kinematic analyses.
Cosmological simulations are useful to assess the validity of assumptions made in interpreting data under more realistic high redshift environments. For instance, Wellons et al. (2020) quantified the effects of pressure gradients, noncircular motions, and asphericity in the gravitational potential on the rotation velocity and estimates in high-resolution FIRE numerical simulations of a range of massive turbulent disks at based on the mass particle distributions, finding that pressure support usually makes the largest impact and that when it is accounted for, kinematically-derived mass profiles agree with the true enclosed mass within typically over the range explored. Realistically replicating observables and empirical methodologies from simulations is not straightforward and subject to various limitations (numerical resolution, sub-grid recipes, radiative transfer, …) but the informative potential is motivating a growing number of investigations to improve on both the simulation ingredients and data interpretation.
7.2 Deviations from Disk Rotation
In kinematics data of SFGs, modest deviations from regular patterns are seen in a subset of galaxies otherwise consistent with global disk rotation. Interpreting such kinematic asymmetries is not trivial in high data but can plausibly be ascribed to internally- or externally-induced in-disk inflows, or to outflows. As will be discussed further in the next Section, the emission associated with the latter has a broad velocity distribution but low amplitude, and should have a negligible effect on the single-component line profile fitting that is usually performed in extracting 2D kinematic maps, unless the outflow is particularly strong (Förster Schreiber et al., 2018)777 In integrated or slit spectra, the presence of outflows can however inflate the line widths and lead to overestimates of based thereupon (Wisnioski et al., 2018). . The gas-rich environments prevailing at are expected to naturally promote perturbations in the marginally-stable gas-rich disks, with fragmentation and efficient transport of material towards the center via, e.g., inward gas streaming and clump migration, while the gas reservoirs of galaxies are continuously replenished by anisotropic accretion via streams and minor mergers. Material streaming inwards can induce twists in the isovelocity contours and off-center peaks in the dispersion map at the level of a few tens of (), and differences in magnitude and orientation of the angular momentum between inner and outer regions expected to remain even after bulge growth slows (e.g., van der Kruit & Allen, 1978, Cappellari, 2016). Characteristic signatures thereof are indeed identified in some of the galaxies with high S/N, high resolution AO-assisted observations, along with morphologically identified bar- and spiral-like features in some cases (e.g., Genzel et al., 2006, Law et al., 2012a, Förster Schreiber et al., 2018). These processes may be important in bulge and SMBH buildup, and concurrent disk growth through angular momentum redistribution (e.g., Bournaud et al., 2014, Dekel & Burkert, 2014, Zolotov et al., 2015). The ubiquity of dense stellar cores and large nuclear concentrations of cold gas in massive SFGs, and the weak correlation between disk-scale angular momentum with call for further sensitive and high resolution kinematics data to more directly assess the role of radial gas transport at cosmic noon vs. alternative scenarios such as inside-out galaxy growth (van Dokkum et al., 2015, Lilly & Carollo, 2016).
Strong kinematic distortions are generally interpreted as indicative of major merging. Assuming very simplistically that all SFGs not identified as rotation-dominated disks according to the classification scheme of Section 6.3 are major mergers, the fractions thereof would be at and (depending on the exact set of criteria and ; Wisnioski et al. 2019). These fractions are comparable to those inferred from morphologies and close pair statistics in a similar mass range (e.g., Conselice, 2014, López-Sanjuan et al., 2013, Rodrigues et al., 2018), and consistent with cosmological simulations (e.g., Genel et al., 2008, Snyder et al., 2017). Taking the major merger fraction as is obviously an oversimplification. Shallower data are more biased towards high surface brightness regions that may partly and unevenly sample the full system and result in apparently disturbed kinematics, exacerbated for clumpy morphologies (see Fig. 9 of Förster Schreiber et al., 2018). A poorly resolved, low object does not necessarily imply it is a major merger (Newman et al., 2013). More face-on disks may also be more difficult to identify because of the resulting small projected velocity gradient, reduced central dispersion peak, and possible clumps biasing the determination of morphological position angle and center (Wuyts et al., 2016b). As is the case for morphologies, kinematic signatures of interactions depend strongly on the system’s orbital configuration, the properties and mass ratio of the progenitor galaxies, the sightline, and the merger stage (e.g., Bellocchi et al., 2016, Simons et al., 2019), introducing uncertainties in identifying major mergers. Despite these uncertainties, the kinematic mix among SFGs at suggests a dominant timescale in a disk configuration, consistent with several other lines of evidence from scaling relations of galaxy properties pointing to the importance of processes other than major merger events in building up stellar mass and structure.
7.3 Galactic-scale Outflows
Galactic winds are thought to play a critical role in the evolution of galaxies by regulating their mass build-up, size growth, star formation, and chemical enrichment, by redistributing angular momentum, and by mediating the relationship between SMBHs and their host galaxies. Stellar feedback at low galaxy masses expels gas from the shallow potential wells, reducing the reservoirs fueling star formation and keeping a low galactic metal content (e.g., Dekel & Silk, 1986, Davé et al., 2017). Above the Schechter mass (or ), accreting SMBHs are thought to be important in suppressing star formation through ejective “QSO mode” feedback driving powerful winds during high Eddington ratio phases that sweep gas out of the host galaxy, and subsequent preventive “radio mode” feedback maintaining galaxies quenched by depositing kinetic energy into the halo that inhibits cooling alongside virial shocks (see review by Fabian, 2012).
[270pt] \entryQSOQuasi-stellar object (quasar). \entryISInterstellar.
Galactic winds should be particularly effective at the peak epoch of star formation and SMBH accretion rates. The most easily accessible diagnostics at high are rest-UV to optical interstellar (IS) absorption features and nebular emission lines, which probe neutral and warm ionized gas phases. Winds are identified through their kinematic imprint: centroid velocity offsets and broad wings of blueshifted IS absorption relative to the systemic redshift (e.g., from stellar features), redshifted Ly profile (accessible at ), and broad line emission typically underneath a narrower component arising from star-forming regions in the galaxy.888 While common, a blueshift for emission line tracers is not necessary; depending on outflow geometry and extinction by dust in the galaxy, backside receding gas can be detected. Alongside understanding the physical drivers of outflows, a major goal of studies at high is to assess their role in galaxy evolution. To this aim, population-wide censuses are essential to reveal the global and time-averaged impact of outflows, reducing biases from selection on properties that would be closely linked to the strongest activity. Such censuses have been greatly facilitated with the advent of optical and near-IR MOS and IFU instruments. IFU observations have proven particularly powerful, by (i) locating the launching sites and constraining the extent of outflowing gas, and (ii) facilitating the separation between large-scale gravitationally-driven and outflow-related motions that both contribute to velocity broadening in integrated spectra.
7.3.1 Outflow Demographics at
Much like in the nearby Universe (e.g., Veilleux et al., 2005), SF- and AGN-driven winds at high are distinguished on the basis of their velocities, spatial origin, and excitation properties (Figure 8). SF-driven outflows with velocities up to several are detected from shifted IS absorption and Ly emission (e.g., Shapley et al., 2003, Weiner et al., 2009), and from broad emission in H, [NII], and [SII] on galactic and sub-galactic scales{marginnote}[10pt] \entryFWHMFull width at half maximum. (e.g., Genzel et al., 2011, Newman et al., 2012a, b). In deep resolution IFUAO observations, the broad emission arises from extended regions across the galaxies and is often enhanced near bright star-forming clumps. The line excitation properties are consistent with dominant photoionization by young stars and possibly modest contribution by shocks. Faster AGN-driven winds with velocities up to a few in galaxies hosting luminous AGN are identified from various rest-UV/optical tracers (see reviews by Fabian, 2012, Heckman & Best, 2014). In near-IR observations, spatially extended broad emission with typical is detected in Balmer as well as forbidden [NII], [SII], and [OIII] emission (precluding significant contribution from high-density broad-line region gas; Nesvadba et al., 2008, Cano-Diáz et al., 2012, Genzel et al., 2014b, Cresci et al., 2015). It typically originates from the center of galaxies, can extend over for luminous QSOs, and both broad and narrow component line ratios indicate high excitation.
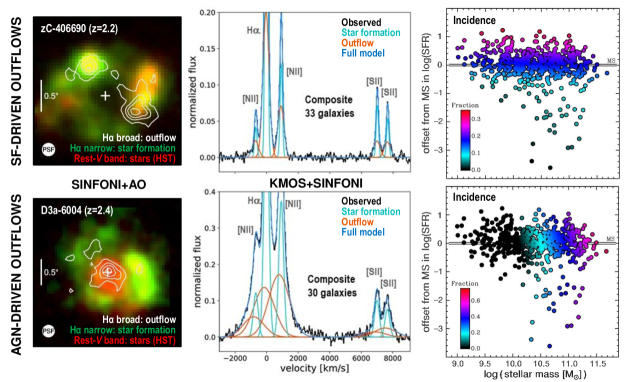
SF- and AGN-driven winds follow distinct demographic trends, most clearly revealed in a recent near-IR IFU study of a sample of primarily mass-selected galaxies at , covering a wide range in both mass and star formation activity levels ( and , see Figure 8; Förster Schreiber et al. 2019). SF-driven outflows are observed at all masses, with an incidence that correlates mainly with star formation properties, and more specifically the MS offset, specific and absolute SFR, and . In contrast, the incidence of AGN-driven outflows (identified based on the combination of rest-optical line profiles and multi-wavelength AGN diagnostics) depends strongly on stellar mass and measures of central stellar mass concentration, irrespective of the level and intensity of star formation activity. The strong differentiation in resulting stacked spectra and decoupling in incidence trends suggest little cross-contamination between dominant SF- and AGN-driven winds.
Several aspects are important in interpreting demographics and comparing between studies. In both nebular emission and IS absorption tracers, the ability to detect an outflow depends on the strength of the wind signature (along with S/N and spectral resolution of the data), such that the trends in incidence partly reflect trends in outflow properties. Slower or weaker winds are more difficult to detect, especially in nebular lines because of the blending with emission from star formation, which underscore the advantage of IFU data in enabling the removal of large-scale orbital motions of the host galaxy. IS absorption features integrate along the line of sight, are sensitive to outflowing material over a wider range and to lower gas densities, and probe material over physical scales up to tens of kpc hence plausibly average over longer timescales. In turn, the emission line technique is more sensitive to denser material closer to the launching sites (as evidenced by high-resolution IFU maps), making it a more instantaneous probe of outflows. Differences in spatial scales probed, along with possibly less collimated winds in “puffier” higher galaxies (Law et al., 2012c), may lead to different dependences with galaxy inclination. Given the trends with galaxy properties discussed below, results will also depend on the sample selection and parameter space coverage.
For SF-driven winds, qualitatively similar trends in incidence, or in strength and velocity width of the wind signature, with measures of star formation activity have been found in many other studies. Quantitatively, there are some notable differences especially between studies using different techniques. For instance, among the full near-IR sample studied by Förster Schreiber et al. (2019), the global fraction of SF-driven outflows is , reaches at or ; no strong trend with galaxy inclination is found (see also, e.g., Newman et al., 2012b). These fractions are lower than the based on the occurrence of blueshifted IS absorption lines after accounting for anisotropic geometry (trends with inclination in these studies are stronger) and clumpiness of the outflowing gas (e.g., Weiner et al., 2009, Kornei et al., 2012). These differences in incidence are consistent with different physical and time scales of outflows probed by each technique and possibly reflect differences in sample selection (mass- vs. UV-selected). The interdependence between SFR, , and , and the choice of criteria employed to identify/exclude AGN, may introduce residual trends with (e.g., Weiner et al., 2009, Freeman et al., 2019, Swinbank et al., 2019). In general, SF-driven outflows appear to become most prominent above , suggesting a higher threshold for wind breakout that may be related to the geometrically thicker, denser, and more turbulent ISM in high galaxies (e.g., Newman et al., 2012b, Davies et al., 2019).
Turning to AGN-driven outflows, near-IR studies considering the full galaxy population highlighted a steep increase in incidence towards higher masses, most pronounced above (e.g., Genzel et al., 2014b, Förster Schreiber et al., 2019, Leung et al., 2019), qualitatively tracking the behavior for AGN fractions identified in flux-limited surveys (e.g., in X-rays; see Section 5.3). The tight positive trends with measures of central stellar mass concentration (such as and ; Förster Schreiber et al. 2019, see also Wisnioski et al. 2018) may not be surprising in light of the observed correlations between these properties and , and the elevated fraction of AGN among compact SFGs in samples (e.g., Barro et al., 2014a, Rangel et al., 2014, Kocevski et al., 2017). Among AGN, the frequency and/or velocities of outflows appears to increase with , consistent with simple expectations where more luminous AGN can drive more powerful winds (e.g., Harrison et al., 2012, 2016, Brusa et al., 2015a, Leung et al., 2019). In terms of absolute fractions, most studies imply fairly large outflow fractions among AGN, in the range except for Leung et al. (2019), who report a lower incidence (but similar trends with galaxy and AGN properties). Leung et al. (2019) noted in their sample that the outflow fraction among AGN is roughly constant with , and so is , concluding that AGN can drive an outflow with equal probability irrespective of the host galaxy mass and that observed trends among the full galaxy population reflect those in AGN luminosity coupled with a (mass-independent) Eddington ratio distribution. Detailed comparisons between all studies are still hampered by the heterogeneity in sample size, selection, AGN and outflow identification, data sets (IFU vs. slit spectra) and S/N, but broadly support the picture that more powerful AGN-driven outflows become common in the most massive galaxies.
[!t]
8 PROPERTIES OF OUTFLOWS AND THEIR POWER SOURCES
:
Outflow velocity, estimated from the profile of the emission or absorption
line wind tracer. Methods based on the centroid or median velocity shift
relative to the systemic value probe the bulk of outflowing gas. Other
methods including the line width at a fraction of peak amplitude or of
cumulative flux/absorption probe the wind velocity distribution.
{sansmath}:
Outflow radial extent, most easily and directly obtained from maps of emission
tracing the wind gas.
{sansmath}:
Local electron density and hydrogen column density of the outflowing gas.
{sansmath}:
Mass of outflowing material; it is
for ionized gas emission tracers where is the luminosity of the
broad outflow-related line component, and
for IS absorption tracers.
Ṁ:
Mass outflow rate, estimated as .
:
Mass loading factor, the ratio .
Ė,
ṗ:
Outflow energy and momentum rates,
and
; the ratio with
stellar or AGN luminosity and momentum rate constrains the
wind power source and driving mechanism.
{sansmath}:
Bolometric luminosity of the stellar population, dominated by young
massive stars such that , and from the
AGN, estimated from, e.g., X-ray, SED modeling, or nebular line emission.
8.0.1 Properties of star formation-driven winds
Outflow velocity, mass, momentum, and energy properties across the galaxy population are essential to constrain the physical drivers of winds and impact of stellar feedback on the evolution of galaxies (e.g., Dutton & van den Bosch, 2009, Davé et al., 2017). By necessity, many simplifications are involved in interpreting the data of high galaxies, usually in the context of idealized models consisting of a conical or spherical geometry, with the velocity distribution, extent, and gas mass being the main parameters. In the theoretical framework, the outflow velocity is generally assumed to be close to the escape velocity, such that . Energy and momentum conservation arguments lead to mass loading factors for energy-driven winds and for momentum-driven winds, where and is the mass outflow rate (e.g., Murray et al., 2005, Oppenheimer & Davé, 2006). With or (e.g., Mo et al., 1998) and on the MS, is expected to follow a power-law with stellar mass and SFR with index or for energy- or momentum-driven winds, respectively. There is a strong predicted differentiation in , with for energy-driven winds and for momentum-driven winds (e.g., Strickland et al., 2004, Murray et al., 2005, 2011). These scalings are consistent with recent cosmological zoom simulations of high galaxies (e.g., Hopkins et al., 2012, Muratov et al., 2015).
Measurements of rely on parametrizations of the observed line profiles, and various approaches have been followed depending on the diagnostic and the data set (e.g., based on the FWHM or full width at zero power of emission tracers, centroid or fractional absolute or cumulative absorption for IS lines). Despite these differences, studies generally find results consistent with ratios within a factor of a few around unity, with a linear or slightly sub-linear trend (e.g., Weiner et al., 2009, Erb et al., 2012, Davies et al., 2019, Förster Schreiber et al., 2019, Swinbank et al., 2019). Given that the escape velocity for realistic halo mass distributions (Binney & Tremaine, 2008), these results indicate that the higher velocity tail of the outflowing gas may escape from galaxies, and more easily so in lower-mass galaxies, but that recycling may not be negligible.
The broad H emission is well suited to estimate mass outflow rates and energetics. Assuming case B recombination and an electron temperature , the mass of ionized gas in the outflow can be estimated via where is the intrinsic luminosity in the broad emission component and is the local electron density, from which the mass outflow rate can be computed as where and are the outflow velocity and extent (e.g., Genzel et al., 2011, Newman et al., 2012a). Calculations typically assume H dominates the mass and apply a mass correction for He. Based on these relationships, estimates in the range up to above unity were derived on galactic and sub-galactic scales (e.g., Genzel et al., 2011, Newman et al., 2012a, b, Förster Schreiber et al., 2019, Davies et al., 2019, Freeman et al., 2019, Swinbank et al., 2019). While details in assumptions and samples vary among studies, a key difference lies in the adopted value for , which ranges between and . No significant or mildly positive trends of with stellar mass were found in the larger samples spanning , assuming a constant (e.g., Förster Schreiber et al., 2019, Freeman et al., 2019, Swinbank et al., 2019). Estimates based on IS absorption features depend more importantly on geometrical factors, as the absorption strength traces the gas columns along the line of sight, with (where and are the angular and clumpiness covering fractions, and is the column density), as well as ISM chemistry and radiative transfer effects on the line profiles (e.g., Veilleux et al., 2005). Under reasonable assumptions, were found in outflow studies of SFG samples employing this technique (e.g., Weiner et al., 2009, Kornei et al., 2012). Comparing wind momentum and energy rate, and , to the momentum and luminosity input from star formation and , most results are in the ranges and and thus consistent with momentum-driven winds powered by the star formation activity (e.g., Genzel et al., 2011, Newman et al., 2012a, Förster Schreiber et al., 2019, but see Swinbank et al. 2019 for a contrasting result). Trends of found in other studies from emission and IS absorption diagnostics suggest a possible mixture of momentum- and energy-driving (e.g., Weiner et al., 2009, Davies et al., 2019).
Estimates of through the density-sensitive but weak [S II] 6716,6731 doublet have long been hampered by S/N limitations. A first reliable broadnarrow Gaussian decomposition in very high S/N stacked spectra (Figure 8; Förster Schreiber et al., 2019) yielded for the outflowing gas (and for the narrow star formation-dominated component). These results suggest the outflowing gas may experience compression, supported by enhanced broad component [NII]/H ratios in the same stacks as well as from multiple diagnostic (total) line ratios for some bright individual star-forming clumps (Newman et al., 2012a) and samples with multi-band near-IR spectra (Freeman et al., 2019). Different outflow gas densities adopted in the literature can account for much of the differences in and other outflow properties, as the observables themselves (broad-to-narrow H flux ratio, , and ) are fairly comparable. With the new evidence suggesting higher , a lower range of () in the warm ionized gas phase would seem favored.
Taken at face value, low mass loading factors and the lack of evidence for an anticorrelation with galaxy stellar mass appear to be in tension with theoretical expectations and numerical simulations, for which at and with in the range to (e.g., Lilly et al., 2013, Muratov et al., 2015). The tension is compounded by the results suggesting that some fraction of the outflowing gas may not be able to escape from the galaxy’s potential (reducing the effective ). Notwithstanding all the simplifications made and large uncertainties, the mass outflow, momentum, and energy rates discussed above almost certainly represent lower limits as they miss potentially important wind phases, as seen in local starburst galaxies where the neutral and cold molecular phases dominate the mass and the hot phase dominates the energetics (e.g., Veilleux et al., 2005, Heckman & Thompson, 2017).
8.0.2 Properties of AGN-driven winds
The role of ejective AGN feedback through “QSO mode” has been much debated in the recent observational literature. At high , while individual luminous AGN may drive sufficiently massive and energetic outflows to suppress star formation in their host (e.g., Cano-Diáz et al., 2012, Cresci et al., 2015, Carniani et al., 2016, Kakkad et al., 2016), QSOs are rare, such that their impact on the massive galaxy population as a whole and in the long run has remained unclear. The more recent studies based on rest-optical emission lines of larger samples, encompassing unbiased (mass-selected) populations and/or AGN selected in deep X-ray surveys, both covering broader ranges in AGN luminosities (in some cases down to ) are shedding new light on this issue (e.g., Förster Schreiber et al., 2014, 2019, Genzel et al., 2014b, Harrison et al., 2016, Talia et al., 2017, Leung et al., 2019).
A first general conclusion is that with typical high velocities , AGN-driven winds are in principle able to escape the galaxies and even the halo. The outflow velocity appears to depend on but otherwise not on galaxy properties such as or SFR, consistent with the AGN as main power source. Double-Gaussian fits to high S/N stacked spectra suggest dense gas with from the [SII] doublet (Figure 8; Förster Schreiber et al., 2019) albeit with significant uncertainties because of the important blending for the broad emission of the fast AGN-driven winds and the doublet ratio reaching towards the high-density limit. Elevated [NII]/H ratios of in broad and narrow emission alike for a significant subset of this sample suggests an important contribution from shock excitation. Keeping in mind all the uncertainties involved, different assumptions adopted by different authors, and large scatter among galaxies, there is overall agreement that on average the momentum and energy rates of AGN-driven outflows exceed those that could be produced by star formation alone, and are consistent with energy-driving contributing or even dominating (Förster Schreiber et al., 2019, Leung et al., 2019), as also suggested by the dependence on (Talia et al., 2017, Leung et al., 2019). Mass outflow rates (compared to the SFRs) are found to be modest to low () on average among SFGs, and possibly higher towards the sub-MS regime.
While AGN-driven winds may expel ionized gas at modest rates compared to the SFRs (similarly to the SF-driven outflows), they carry substantial amounts of momentum and energy ( times or more than the SF-driven winds). If more mass, momentum, and energy are contained in other wind phases (or if estimates are lower than adopted), all estimates would increase. Measurements in other phases are still scarce at ; CO observations suggest in two MS SFGs hosting AGN, one of which is a QSO (Herrera-Camus et al., 2019, Brusa et al., 2018). Even if not substantially depleting the gas reservoirs of their host, the high-velocity and energetic AGN-driven winds escaping from the galaxies may interact with halo gas, reach high temperatures with long cooling time, and help prevent further gas infall together with virial shocks. The rapid increase in the incidence of AGN-driven winds among the galaxy population at around the Schechter mass echoing the decline in specific SFR and molecular gas mass fractions (Whitaker et al., 2014, Tacconi et al., 2018) is suggestive of a connection between AGN-driven winds and quenching, although it may not be sufficient alone to establish a causal link. Given the wide range in AGN luminosities and inferred Eddington ratios for the larger samples discussed above, the results appear to be qualitatively in line with suggestions based on recent cosmological simulations that kinetic feedback from SMBHs accreting at low Eddington ratio may be more efficient at quenching star formation through preventive feedback in the circumgalactic medium (Bower et al., 2017, Nelson et al., 2018, Pillepich et al., 2018a).
9 OTHER z 2 STAR-FORMING POPULATIONS
We here briefly discuss specific subpopulations among SFGs that have been the focus of dedicated analyses for reasons of their extreme starburst nature and/or their role as candidate immediate progenitors to the accumulating population of quiescent galaxies at cosmic noon. Salient physical features of the latter class of galaxies are summarized as well.
9.1 “MS outliers,” and Submm Galaxies
Whereas normal MS galaxies are predominantly disks, at all epochs a population of starbursting outliers exists that may well result from merging activity. At such starburst galaxies, defined by their SFR being more than four times higher than on the MS, represent only 2% of the mass-selected SFGs, accounting for only 10% of the cosmic SFR density at this epoch (Rodighiero et al., 2011). Modeling the SFR distribution of SFGs at fixed mass with a double gaussian reveals a similar, constant or only weakly redshift-dependent, starburst contribution of to the overall SFR budget (Sargent et al., 2012).
Structurally, there are indications that above-MS outliers exhibit smaller effective radii and cuspier light profiles than their exponential disk counterparts along the MS ridgeline. This is seen for nearby populations, but in rest-UV/optical and radio observations at cosmic noon as well, albeit with significant scatter and only when collecting samples over wide areas to sample the poorly populated high-SFR tail of the galaxy population (Wuyts et al., 2011b, Elbaz et al., 2011). Splitting the SFG population in below-, on- and above-MS subsets Nelson et al. (2016b) find the above-MS SFGs to feature enhanced H at all radii. Only for is the enhancement particularly seen in the center. It should be noted though that extreme outliers ( above the MS) have 90% of their star formation revealed only in the far-IR and often are optically thick even in H (Puglisi et al., 2017).
Beyond structural properties, a systematic increase in gas fraction (e.g., Tacconi et al., 2020), dust temperature (Magnelli et al., 2014), and ratio of total IR to rest-8m luminosities (Elbaz et al., 2011, Nordon et al., 2012) is seen as one moves across the MS towards higher SFRs. Not only does the amount of obscuration by dust increase (Wuyts et al., 2011b), the resulting effective attenuation law as imprinted in the IRX- relation also varies systematically with position in SFR-mass space (Nordon et al., 2013).999The non-universality of attenuation law shapes at cosmic noon has also been reported by Salmon et al. (2016) and Reddy et al. (2018), with increasingly shallower slopes towards the more enriched and dustier regime, rooted in changing star – dust geometries and possibly grain size distributions. All of these trends between MS offset and physical diagnostics suggest that the observed scatter around the MS is real, and cannot be fully attributed to measurement uncertainties associated with the various SFR tracers employed. Confirming this point more directly, Fang et al. (2018) demonstrate that independent measurements based on 24 m and UV-to-optical diagnostics correlate significantly.
[250pt] \entrySMGSubmm galaxy.
Predating the terminology of a main sequence and orthogonal to the historical background of rest-UV/optical lookback surveys is the rare population of very luminous high- Submm Galaxies (SMGs), first discovered in the late 1990s through observations with SCUBA on the JCMT (′′ beam; Smail et al., 1997). Since then, higher resolution far-IR observations have refined our understanding of the nature of SMGs, identifying multi-component morphologies in some and very compact cores with large velocity ranges in other cases (Tacconi et al., 2006, 2008). These results point to merger-driven short-lived () “maximum starburst” events. ALMA 1 mm observations demonstrated that multiplicity of single-dish sources becomes increasingly common towards the bright end, with 28% of sources and 44% of sources being identified as blends (Stach et al., 2018). Using spectroscopic follow-up of individual components for modest samples (Hayward et al., 2018) or a statistical approach based on photometric redshifts for samples of several dozen SMGs (Stach et al., 2018) it is further apparent that both chance alignments and physically associated components make up a significant fraction of the blends, with physically associated pairs adding up to at least 30%.
Accounting for multiplicity hence reduces the inferred SFRs for some of the brightest SMGs, relieving some tension with models and bringing them closer to the MS. Their MS offset is further reduced when allowing for multi-component SFHs, which have a tendency of increasing the inferred stellar mass. For this reason, Michałowski et al. (2014) argue that SMGs reside predominantly at the high-mass tip of the MS rather than being positioned above, consequently also questioning their merger nature.
The rarity of above-MS outliers and SMGs can be interpreted in terms of short duty cycles preceding a quenching event. For example, Wuyts et al. (2011b) contrast the number density of outliers to the growing number density of quiescent galaxies at cosmic noon inferring timescales of order for the starbursting phase. Toft et al. (2014) take a different approach, in which they contrast the inferred formation redshifts of compact quiescent galaxies at to the redshift distribution of the SMG population, finding a good match that is further underlined by their similar positions in size-mass space and consistently high characteristic velocities. Assuming an evolutionary connection, they can reconcile their relative space densities by invoking an SMG lifetime of . The relatively short timescales found in the above studies are consistent with the duration of the final merger phase and peak starburst around coalescence of dissipative major mergers (e.g., Mihos & Hernquist, 1994, Hopkins et al., 2006).
9.2 Compact Star-Forming Galaxies
[185pt] \entrycSFGCompact star-forming galaxy.
In order to reveal evolutionary connections between galaxies before and after quenching, a selection on the basis of similar structural properties (i.e., identifying SFGs in the compact corner of size-mass space where high- quiescent galaxies reside) has become a popular approach (e.g., Barro et al., 2013, 2014a). After the number density of these compact star-forming galaxies (cSFGs) are dropping precipitously, while the number density of compact quiescent galaxies is still rising. Duty cycle arguments akin to those described in the previous Section yield typical lifetimes for this cSFG phase of , dependent on the precise compactness and star formation selection criteria imposed (Barro et al., 2013, van Dokkum et al., 2015). cSFGs thus represent a longer-lasting phase than the one discussed in Section 9.1, which is also reflected in their larger abundance and larger range in star formation activities, from above to on and below the MS.
A salient feature of the cSFG population is that both X-ray and line ratio diagnostics reveal a very high AGN fraction ( based on X-rays and up to when folding in line ratio diagnostics). This enhancement in AGN activity is highly significant relative to quiescent galaxies but also compared to similar-mass SFGs that are more extended (Barro et al., 2014a, Kocevski et al., 2017, Wisnioski et al., 2018). They are further found to be highly obscured, with dust cores even smaller than their stellar extent (Barro et al., 2016) and galaxy-integrated ionized gas velocity dispersions (and in one case a measurement of a stellar velocity dispersion) of several , consistent with those measured using stellar tracers in compact quiescent galaxies. The implied dynamical masses of cSFGs are comparable with their stellar mass content (Nelson et al., 2014, Barro et al., 2014b, van Dokkum et al., 2015). Resolved gas kinematics of cSFGs have revealed that the large galaxy-integrated linewidths can to a large degree be attributed to unresolved disk rotation (Barro et al., 2017b, Wisnioski et al., 2018). While their stellar distributions are by definition compact, the ionized gas disks are often more extended (van Dokkum et al., 2015, Wisnioski et al., 2018). Even when modeled with rotating disks and accounting for inclination and beam-smearing effects the resulting stellar-to-dynamical mass ratios of the more compact SFGs are close to unity and larger than that of extended SFGs (van Dokkum et al., 2015, Wuyts et al., 2016b, Wisnioski et al., 2018). These dynamical measurements support a picture that cSFGs are in their last stretch of star formation with already dwindling gas fractions and short depletion times. Spilker et al. (2016) and Popping et al. (2017) have come to a similar conclusion on the basis of molecular line measurements for this sub-population.
Several lines of evidence highlight the resemblance in dynamical terms between cSFGs and the quiescent population to which they are candidate immediate progenitors. Compact quiescent galaxies at cosmic noon exhibit more flattened projected shapes than anticipated for a pressure supported population (van der Wel et al., 2011, Chang et al., 2013), their ratios calculated from galaxy-integrated stellar velocity dispersions using a virial mass estimator are higher for systems with flatter projected axis ratios (Belli et al., 2017a), and in four gravitationally lensed cases stellar velocity curves reveal unambiguously their rotationally supported nature (Newman et al., 2015, 2018b, Toft et al., 2017), consistent with a highly dissipational formation process (Wuyts et al., 2010, Wellons et al., 2015).
10 THEORETICAL PICTURE AND ADVANCES IN NUMERICAL SIMULATIONS
Models of galaxy formation in a CDM context have seen significant improvements over the past decade. In particular, great strides forward were made in resolving the so-called angular momentum catastrophy (the inability to reproduce the Tully-Fisher and rotation speed - angular momentum relation of observed disks galaxies; Navarro & Steinmetz, 2000), and the overproduction of stars in both low- and high-mass galaxies. Cosmological galaxy formation models still feature variations at the factor of level in for example the peak stellar-to-halo mass ratio reached around and possibly more at lower/higher masses, but they now fall within the range of uncertainties from abundance matching estimates that traditionally serve as a benchmark. Today, we face a landscape of theoretical models that can be differentiated by the physical scales they resolve, the numerical techniques they employ, and the (astro)physics they implement. The scales that are resolved dictate which physical properties can be considered “imposed” versus “emerging” from such models (see reviews by Somerville & Davé, 2015, Naab & Ostriker, 2017).
On the largest scales, semi-analytic models can efficiently imprint the baryonic growth of galaxies on merger trees extracted from DM-only simulations with box sizes of Gpc (Millennium, Millennium-XXL, Bolshoi, Las Damas). Effectively resolving individual galaxies at the halo scale, basic structural properties such as galaxy sizes are then evaluated through analytical recipes that either assume specific angular momentum conservation (Mo et al., 1998) or encode dependencies on both angular momentum and halo concentration (Somerville et al., 2018, Jiang et al., 2019), and are designed to capture processes such as disk instabilities and mergers. For the latter, simple energy conservation arguments are often augmented with calibrations based on idealized merger simulations to account for the impact of dissipative processes on the resulting bulges (Covington et al., 2011). While intrinsically unable to track detailed structural evolution from first principles, such models have the merit of being computationally cheap (7 CPU hours to execute a single realization producing over galaxies). They are therefore the only type of models for which a full exploration of parameter space and a mapping of its degeneracies by means of Monte Carlo Markov Chains is feasible (e.g., Henriques et al., 2015).
Inclusion of hydrodynamics comes at a major computational expense but allows key processes for structural evolution to be resolved rather than prescribed. State-of-the-art full cosmological simulations (Illustris, EAGLE, Magneticum, Horizon-AGN, Illustris TNG, SIMBA) are capable of evolving populations of galaxies in boxes with sufficient resolution (baryonic particle masses of , sub-kpc gravitational softening lengths) to track their internal structural development and kinematics. With a temperature floor of and the reliance on subgrid recipes to infer cold gas fractions, they are complemented by zoom-in simulations of more than 100 times enhanced mass and spatial resolution, which are capable of resolving Jeans mass/length scales, giant molecular cloud formation and a self-consistent modeling of the multi-phase ISM (e.g., FIRE, Auriga, VELA). Further down the series of Russian dolls come simulations of isolated galaxies or ISM slices in an external potential resolved down to parsec scales (e.g., SILCC). They are ideally suited to track the multi-phase breakdown of the ISM including the chemistry of molecular gas formation, the local injection of energy and momentum by late stages of stellar evolution and its coupling to the surrounding medium (e.g., effects of peak driving vs. supernovae exploding after stars migrate away from their birthclouds, ISM porosity and the possibility of feedback energy escaping through the path of least resistance, impact of the IR opacity on the effectiveness of radiation pressure, …).
The hydro-solvers employed in generating the above multi-scale simulations range from grid-based Adaptive Mesh Refinement (AMR) to Smoothed Particle Hydrodynamics (SPH; with refinements to better capture contact discontinuities and shock fronts, Hopkins 2015), and include hybrid moving mesh approaches (Springel, 2010). In common between these models, the physics of gravity, hydrodynamics, cooling and heating, star formation and evolution (SNIa, SNII, AGB), chemical enrichment (tracking up to 11 individual elements), black hole growth, and stellar and AGN feedback are now routinely implemented. Increasingly, also the impact of other processes, such as magnetic fields, radiation pressure, cosmic rays and even the formation and destruction of dust are explored, albeit some of them restricted to the highest resolution simulations only.
Qualitatively, overcoming the hurdles posed by the angular momentum problem and the observed inefficiency of galaxy formation took the implementation of strong feedback processes. How exactly this goal is most realistically achieved through numerical and/or subgrid recipes remains a matter of intense debate, on which resolved observations of galaxy structure and kinematics aim to shed light. Implementations of stellar feedback differ in their injection velocities, mass loadings and directionality, and whether or not wind particles are temporarily decoupled from hydrodynamic interactions to prevent numerical overcooling. Likewise, AGN feedback as a term covers a considerable range of implementations, starting from the choice of black hole seeding, whether or not boosting factors are applied to conventional Bondi accretion, directionality and continuity/stochasticity with which gas particles are being heated or receive kinetic kicks. Different choices are made regarding which gas particles this thermal/kinetic energy is imparted on, and whether (e.g., Illustris TNG) or not (e.g., EAGLE) different prescriptions are applied in the high vs. low accretion rate regime. Consequently, predictions on key wind properties are still in flux, with for example TNG winds being faster but of lower mass loading than those in its Illustris precursor. This illustrates the continued need for empirical guidance.
Last but not least, significant work on the interface between simulations and observations is enabling ever more consistent comparisons. This starts with the basic question of what it is that constitutes a galaxy’s stellar mass, and related, what it is that observers are measuring. Pillepich et al. (2018b) illustrate how aperture-based masses (as opposed to total stellar masses integrated out to the virial radius) can significantly alter our view on the stellar mass function and SMHM relation, particularly for the most massive galaxies featuring extended wings, but even so at the knee of the SMHM relation. Bringing the models yet more into the observational realm, post-processing with advanced radiative transfer techniques (SKIRT, Sunrise, Powderday) are enabling mock observations accounting for the effects of light weighting, dust extinction and reprocessing, including also ionized and molecular gas line emission. These can aid refined calibrations of observational diagnostics and SED modeling techniques, and are adopted in feasibility studies for upcoming observing facilities.
11 SUMMARY AND OUTLOOK
This article highlighted some of the key insights emerging from increasingly complete population censuses and increasingly detailed studies of individual galaxies back to the cosmic noon epoch. Many global and resolved properties tracing the stars, gas, and kinematics are well probed down to 10 (or below). Current results draw a consistent broad picture (see Summary Points) and raise the next questions for future work (see Future Issues for a selection). The knowledge gained from these observations has contributed to transform — in some aspects, profoundly — our view of galaxy evolution. The emerging picture is encapsulated in the equilibrium growth model summarized in Section 1.1, and discussed by Tacconi et al. (2020) in relation to the evolution of the characteristic timescales of the processes controlling galaxy growth including cosmic accretion, merging, galactic gas depletion and star formation, internal dynamics, and gas recycling.
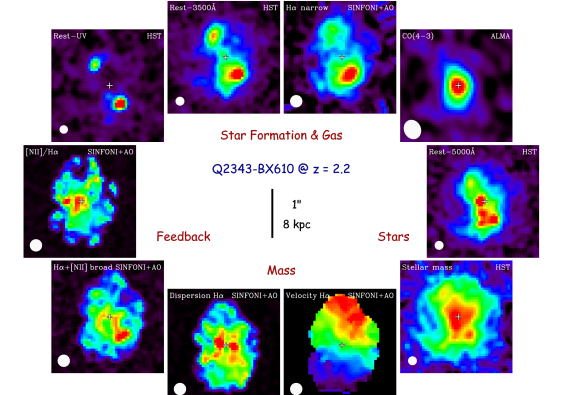
The state-of-the-art in our knowledge of the properties of SFGs is illustrated in Figures 9 and 10. The censuses and scaling relations allow a depiction of the evolutionary and dynamical state of SFGs in relation to the MS. Coupled with the assumption that mass-ranking of galaxies is conserved, this cross-sectional view of the galaxy population at different epochs can be translated to tracks representing the average evolution of individual galaxies. The outcome of such an approach is shown in Figure 9 for a galaxy reaching the stellar mass of the Milky Way by the present day. Cosmic noon is the main formation epoch of stars in galaxies of masses similar and up to higher than the Milky Way (), which account for as much as of the local stellar mass budget. In turn, resolved mapping is now possible for various tracers of the baryon cycle from gas and star formation to metal enrichment and feedback, of the dynamical state, of processes leading to the build-up of galactic components and their imprint on the distribution of stars. Such comprehensive sets at the currently best achievable resolution (unlensed) are still limited to small numbers of SFGs; Figure 10 shows one example.
[SUMMARY POINTS]
-
1.
Two key observational aspects have driven major advances in our understanding of how galaxies evolved since cosmic noon by providing unparalleled comprehensive views of distant galaxies: (i) the concentration in “legacy cosmological fields” of photometric and spectroscopic surveys across the electromagnetic spectrum, and (ii) the growing samples with stellar structure, star formation, and gas kinematics resolved on subgalactic scales. Mass selection is routinely used, allowing more complete population-wide censuses of physical processes driving galaxy evolution.
-
2.
Scaling relations between galaxy stellar mass, SFR, metallicity, gas content, size, structure, and kinematics are in place since at least , indicating that regulatory mechanisms start to act on galaxy growth within of the Big Bang. There is significant evolution in population properties: compared to , typical SFGs at were forming stars and growing their central SMBH faster from larger cold molecular gas reservoirs. Disks are prevalent but smaller, more turbulent, and thicker that today’s spirals. Quenching was underway at high masses, through mechanisms that appear to largely preserve disky structure.
-
3.
Resolved stellar light, star formation, and kinematics on scales down to point to spatial patterns — more pronounced in higher mass SFGs — from dense and strongly baryon-dominated core regions with possibly suppressed star formation to more actively star-forming outskirts. Whether these patterns reflect inside-out growth/quenching scenarios, or carry the imprint of strong radial gradients in extinction and efficient dissipative processes in gas-rich disks is open. The detection of large nuclear concentrations of cold gas and kinematic evidence of radial inflows in the most massive galaxies support the latter scenario, in which case massive but highly obscured stellar bulges may still be rapidly growing.
-
4.
Outflows traced by warm ionized and neutral high-velocity gas act across a wide swath of the galaxy population. SF-driven winds dominate below the Schechter mass and are more ubiquitous and/or stronger at higher star formation levels, but may largely remain bound to the galaxy. AGN-driven winds dominate at higher masses, with rapidly rising incidence and/or strength with stellar mass and central concentration thereof. Improved constraints suggest dense, possibly shocked-compressed ionized material in both outflow types, leading to modest sub-unity mass loading factors in the warm ionized phase. The high duty-cycle AGN-driven winds are sufficiently fast to escape their massive host and heat halo gas, tantalizingly suggesting a preventive form of AGN feedback contributes to quenching.
[FUTURE ISSUES]
-
1.
What is the origin of scatter in galaxy scaling relations (between , SFR, size, gas content, metallicity, …)? Is any scatter around the observed relations attributed to short-term stochasticity (i.e., the equivalent of “weather”) or an imprint of a long-term differentiation in growth histories among SFGs of the same mass at a given epoch? If the latter, what (halo) property other than mass is most appropriate to describe the SFG population as a two-parameter family?
-
2.
What is the physics responsible for setting the gas turbulence? The redshift evolution of can be understood in the framework of marginally stable disks with gas fractions that are dwindling with cosmic time. Yet, at fixed redshift, no clear correlation with galaxy properties is emerging that would unambiguously identify the main driver of turbulence. Is this because of limited dynamic range sampled, significant contributions from unresolved non-circular motions, other observational factors? Results from strongly-lensed galaxies indicate elevated dispersions on scales down to a few 100 pc, but samples are still small and limited in galaxy mass coverage. Tighter constraints on spatial variations and anisotropy (as observed in nearby disks) will be helpful in addressing these questions.
-
3.
What is the origin of the high baryon fractions and concentrations of SFGs? A robust trend of increasing baryon fractions with redshift up to , and a correlation with increasing surface density, are emerging from disk modeling of IFU kinematics. Several lines of empirical evidence, supported by theoretical work, point to the important role of efficient transport of material from the halo to the disk scale and further inwards to the bulge in the gas-rich high disks. More direct constraints are needed on gas inflows onto and within galaxies, and on the relative importance of radial transport vs. inside-out growth in setting the structure of galactic components and, possibly, contributing to star formation quenching.
-
4.
Where do massive SFGs form their last stars before they get quenched? Balmer decrement maps for individual galaxies and bolometric UV+IR SFR maps accounting for potential gradients in dust temperature will be required to address whether half-SFR sizes at the tip of the MS are smaller than, equal to, or larger than the half-stellar mass sizes inferred from multi-wavelength HST imagery.
-
5.
What are the total mass loading and energetics of galactic-scale winds, and the breakdown into multi-phase components? Much of our knowledge about wind properties and demographics is based on the warm ionized and neutral phase. A more holistic view on wind properties and their impact on galaxies will strongly benefit from the combination of multi-phase tracers, still limited to small numbers of more extreme objects and very few normal MS SFGs at high . A few pilot programs suggest that, akin to what is seen in nearby starbursts, the bulk of the mass flow may be in the molecular phase, highlighting the importance of cold molecular gas kinematics to fully capture their role in galaxy evolution and baryon cycling.
-
6.
What are the exact mechanisms responsible for the shutdown of star formation in massive galaxies? The increase in the prevalence of massive bulges, dense cores, and powerful AGN and AGN-driven outflows at high galaxy masses, where the specific SFR and cold gas mass fractions drop, suggest they likely play a role in galaxy quenching. The evidence of an association with quenching, however, remains to date largely circumstancial, and further observational constraints are needed to pin down the mechanism(s) at play and establish causality.
-
7.
How do galaxies below fit into the emerging picture anchored in the properties of higher mass populations? Low-mass galaxies are still poorly explored because of current observational limitations. If an increasing proportion of the low-mass population has prolate/triaxial structure, how can we interpret their kinematics until we can fully resolve them? Do scaling relations break down at these masses?
The outlined questions, among others, frame the observational (and theoretical) landscape for the next decade, with exciting progress anticipated from developments on the instrumentation scene. NOEMA and ALMA are leveraging our knowledge about the stellar component and ionized gas with that of the cold molecular gas. The combination of the multi-IFU KMOS and the new sensitive AO-assisted ERIS single-IFU at the VLT will expand samples with kinematics, star formation, and ISM conditions from near-IR observations, and resolve them on sub-galactic scales down to . JWST at near- and mid-IR wavelengths will open up an unprecedented window on the earliest stages of galaxy evolution, charting the progenitor populations of cosmic noon galaxies. The giant leap in resolution afforded by diffraction-limited instruments on the next generation of 25-40 m-class telescopes, such as the first-light imager and spectrometer MICADO and the IFU HARMONI at the ELT, will be the next game-changers (Figure 11). With unparalleled sharp views of the galaxy population on the scales of individual giant molecular cloud and star-forming complexes, the era of extremely large telescopes will undoubtedly dramatically boost our knowledge and change our approach to studying galaxy evolution across all times.
DISCLOSURE STATEMENT
The authors are not aware of any affiliations, memberships, funding, or financial holdings that might be perceived as affecting the objectivity of this review.
ACKNOWLEDGMENTS
We are grateful to our many colleagues and friends for stimulating, critical, and inspiring discussions throughout the years, which have all contributed to shape the present work. We thank the members of the SINS/zC-SINF, , PHIBSS, and 3D-HST teams for their input and involvement in various aspects covered in this article. We give our special thanks to Ralf Bender, Michele Cirasuolo, Ric Davies, Sandy Faber, Marijn Franx, Reinhard Genzel, Dieter Lutz, Trevor Mendel, Sedona Price, Alvio Renzini, Mara Salvato, Alice Shapley, Taro Shimizu, Linda Tacconi, Hannah Übler, Pieter van Dokkum, Emily Wisnioski for discussions and comments that were extremely useful while writing this manuscript, and for input for Figures. We are also grateful to Mark Swinbank, Marianne Girard, and Chris Harrison for sharing information in advance of publication. Star-forming galaxies at cosmic noon is a vast topic that rests on a much richer body of work than can be included in a single article within space allocation — we have strived to provide useful references through which further work can be found.
References
- Abraham et al. (1996) Abraham RG, van den Bergh S, Glazebrook K, et al. 1996. ApJS, 107:1–17
- Abramson et al. (2014) Abramson LE, Kelson DD, Dressler A, et al. 2014. ApJ, 785:36
- Abramson et al. (2015) Abramson LE, Gladders MD, Dressler A, et al. 2015. ApJ, 801:L12
- Abramson et al. (2016) Abramson LE, Gladders MD, Dressler A, et al. 2016. ApJ, 832:7
- Abramson & Morishita (2018) Abramson LE, Morishita T. 2018. ApJ, 858:40
- Abruzzo et al. (2018) Abruzzo MW, Narayanan D, Davé R, Thompson R. 2018. arXiv1803.02374
- Adamo et al. (2013) Adamo A, Östlin G, Bastian N, et al. 2013. ApJ, 766:105
- Adamo et al. (2017) Adamo A, Ryon JE, Messa M, et al. 2017. ApJ, 841:131
- Aihara et al. (2018) Aihara H, Armstrong R, Bickerton S, et al. 2018. PASJ, 70:S8
- Aird et al. (2012) Aird J, Coil AL, Moustakas J, et al. 2012. ApJ, 746:90
- Aird et al. (2018) Aird J, Coil AL, Georgakakis A. 2018. ApJ, 775:41
- Allen et al. (2017) Allen RJ, Kacprzak GG, Glazebrook K, et al. 2017. ApJ, 834:11
- Aumer et al. (2010) Aumer M, Burkert A, Johansson PH, Genzel R. 2010. ApJ, 719:1230-43
- Barro et al. (2013) Barro G, Faber SM, Pérez-González PG, et al. 2013. ApJ, 765:104
- Barro et al. (2014a) Barro G, Faber SM, Pérez-González PG, et al. 2014a. ApJ, 791:52
- Barro et al. (2014b) Barro G, Trump JR, Koo DC, et al. 2014b. ApJ, 795:145
- Barro et al. (2016) Barro G, Kriek M, Pérez-González PG, et al. 2016. ApJ, 827:32
- Barro et al. (2017a) Barro G, Faber SM, Koo DC, et al. 2017a. ApJ, 840:47
- Barro et al. (2017b) Barro G, Kriek M, Pérez-González PG, et al. 2017b. ApJ, 851:L40
- Behroozi et al. (2013a) Behroozi PS, Wechsler RH, Conroy C. 2013a. ApJ, 762:L31
- Behroozi et al. (2013b) Behroozi PS, Wechsler RH, Conroy C. 2013b. ApJ, 770:57
- Beifiori et al. (2017) Beifiori A, Mendel JT, Chan JCC, et al. 2017. ApJ, 846:120
- Bell & de Jong (2001) Bell EF, de Jong RS. 2001. ApJ, 550:212–29
- Belli et al. (2017a) Belli S, Newman AB, Ellis RS. 2017. ApJ, 834:18
- Belli et al. (2017b) Belli S, Genzel R, Förster Schreiber NM, et al. 2017b. ApJ, 841:L6
- Bellocchi et al. (2016) Bellocchi E, Arribas S, Colina L. 2016. A&A, 591:A85
- Bezanson et al. (2019) Bezanson R, Spilker J, Williams CC, et al. 2019. ApJ, 873:L19
- Binney & Tremaine (2008) Binney J, Tremaine S. 2008. Galactic Dynamics (2nd ed.; Princeton, NJ: Princeton Univ. Press)
- Bland-Hawthorn & Gerhard (2016) Bland-Hawthorn J, Gerhard O. 2016. ARA&A, 54:529–96
- Boada et al. (2015) Boada S, Tilvi V, Papovich C, et al. 2015. ApJ, 803:104
- Bolatto et al. (2015) Bolatto AD, Warren SR, Leroy AK, et al. 2015. ApJ, 809:175
- Bolatto et al. (2013) Bolatto AD, Wolfire M, Leroy AK. 2013. ARA&A, 51:207–68
- Bouché et al. (2010) Bouché N, Dekel A, Genzel R, et al. 2010. ApJ, 718:1001–18
- Bournaud et al. (2007) Bournaud F, Elmegreen BG, Elmegreen DM. 2007. ApJ, 670:237–48
- Bournaud et al. (2014) Bournaud F, Perret V, Renaud F, et al. 2014. ApJ, 780:57
- Bournaud (2016) Bournaud F. 2016. in Galactic Bulges, Astrophysics and Space Science Library, 418:355–90. Eds. E. Laurikainen et al. (City:Springer)
- Bower et al. (2017) Bower RG, Schaye J, Frenk CS, et al. 2017 MNRAS, 465:32–44
- Brandt & Alexander (2015) Brandt WN, Alexander DM. 2015. Astron. Astrophys. Rev,, 23:1
- Brinchmann et al. (2004) Brinchmann J, Charlot S, White SDM, et al. 2004. MNRAS, 351:1151–79
- Brusa et al. (2015a) Brusa M, Bongiorno A, Cresci G, et al. 2015a. MNRAS, 446:2394–2417
- Brusa et al. (2018) Brusa M, Cresci G, Daddi E, et al. 2018. A&A, 612:A29
- Buck et al. (2017) Buck T, Macciò AV, Obreja A, et al. 2017. MNRAS, 468:3628–49
- Bullock et al. (2001) Bullock JS, Dekel A, Kolatt TS, et al. 2001. ApJ, 555:240–57
- Burkert et al. (2016) Burkert A, Förster Schreiber NM, Genzel R, et al. 2016. ApJ, 826:214
- Cano-Diáz et al. (2012) Cano-Diáz M, Maiolino R, Marconi A, et al. 2012. A&A, 537:L8
- Caplar & Tacchella (2019) Caplar N, Tacchella S. 2019. MNRAS, 487:3845–69
- Cappellari et al. (2013) Cappellari M, Scott N, Alatalo K, et al. 2013. MNRAS, 432:1709–41
- Cappellari (2016) Cappellari M. 2016. ARA&A, 54:597–665
- Carnall et al. (2019) Carnall AC, Leja J, Johnson BD, et al. 2019 ApJ, 873:44
- Carnall et al. (2018) Carnall AC, McLure RJ, Dunlop JS, Davé R. 2018 MNRAS, 480:4379–401
- Carniani et al. (2016) Carniani S, Marconi A, Maiolino R, et al. 2016 A&A, 591:A28
- Carollo et al. (2013) Carollo CM, Bschorr TJ, Renzini A, et al. 2013. ApJ, 773:112
- Cava et al. (2018) Cava A, Schaerer D, Richard J, et al. 2018. Nature Astronomy, 2:76–82
- Ceverino et al. (2010) Ceverino D, Dekel A, Bournaud F. 2010. MNRAS, 404:2151–69
- Ceverino et al. (2015) Ceverino D, Dekel A, Tweed D, Primack J. 2015. MNRAS, 447:3291–310
- Chabrier (2003) Chabrier G. 2003 PASP, 115, 763–95
- Chandar et al. (2014) Chandar R, Whitmore, BC, Calzetti D, O’Connell R. 2014. ApJ, 787:17
- Chang et al. (2013) Chang YY, van der Wel A, Rix HW, et al. 2013. ApJ, 762:83
- Chen et al. (2020) Chen Z, Faber SM, Koo DC, et al. 2020. ApJ, 897:102
- Cheung et al. (2012) Cheung E, Faber SM, Koo DC, et al. 2012. ApJ, 760:131
- Cibinel et al. (2015) Cibinel A, Le Floc’h E, Perret V, et al. 2015. ApJ, 805:181
- Ciesla et al. (2017) Ciesla L, Elbaz D, Fensch J. 2017. A&A, 608:A41
- Clauwens et al. (2017) Clauwens B, Hill A, Franx M, Schaye J. 2017. MNRAS, 469:58–62
- Combes (2018) Combes, F. 2018 Astron. Astrophys. Rev,, 26:5
- Condon (1992) Condon JJ. 1992. ARA&A, 30:575–611
- Conroy (2013) Conroy C. 2013. ARA&A, 51:393–455
- Conselice (2003) Conselice CJ. 2003. ApJS, 147:1–28
- Conselice (2014) Conselice C. 2014. ARA&A, 52:291–337
- Courteau & Dutton (2015) Courteau S, Dutton AA. 2015. ApJ, 801:L20
- Covington et al. (2011) Covington MD, Primack JR, Porter LA, et al. 2011. MNRAS, 415:3135–52
- Cresci et al. (2009) Cresci C, Hicks EKS, Genzel R, et al. 2009. ApJ, 697:115–32
- Cresci et al. (2015) Cresci C, Mainieri V, Brusa M, et al. 2015. ApJ, 799:82
- Daddi et al. (2007) Daddi E, Dickinson M, Morrison G, et al. 2007. ApJ, 670:156
- Danovich et al. (2015) Danovich M, Dekel A, Hahn O, Ceverino D, Primack J. 2015. MNRAS, 449:2087–111
- Davé et al. (2017) Davé R, Rafieferantsoa MH, Thompson RJ, Hopkins PF. 2017. MNRAS, 467:115–32
- Davies et al. (2019) Davies RL, Förster Schreiber NM, Üebler H, et al. 2019 ApJ, 873, 122
- Dekel & Silk (1986) Dekel A, Silk J. 1986. ApJ, 303:39–55
- Dekel et al. (2009a) Dekel A, Sari R, Ceverino D. 2009a. ApJ, 703:785–801
- Dekel & Burkert (2014) Dekel A, Burkert A. 2014. MNRAS, 438:1870–79
- Delhaize et al. (2017) Delhaize J, Smolčić V, Delvecchio I, et al. 2017. A&A, 602:A4
- Dessauges-Zavadsky et al. (2017) Dessauges-Zavadsky M, Schaerer D, Cava A, Mayer L, Tamburello V. 2017. ApJ, 836:22
- Dessauges-Zavadsky & Adamo (2018) Dessauges-Zavadsky M, Adamo A. 2018. MNRAS, 479:118–22
- Diemer et al. (2017) Diemer B, Sparre M, Abramson LE, Torrey P. 2017. ApJ, 839:26
- Donley et al. (2018) Donley JL, Kartaltepe J, Kocevski D, et al. 2018. ApJ, 853:63
- Dutton et al. (2007) Dutton AA, van den Bosch FC, Dekel A, Courteau S. 2007. ApJ, 654:27–52
- Dutton & van den Bosch (2009) Dutton AA, van den Bosch FC. 2009. MNRAS, 396:141–64
- Dutton & Macciò (2014) Dutton AA, Macciò AV. 2014. MNRAS, 441:3359–74
- Eales et al. (2014) Eales S, de Vis P, Smith MW, et al. 2017. MNRAS, 465:3125–33
- Elbaz et al. (2007) Elbaz D, Daddi E, Le Borgne D, et al. 2007. A&A, 468:33
- Elbaz et al. (2011) Elbaz D, Dickinson M, Hwang HS, et al. 2011. A&A, 533:119
- Elmegreen (2009) Elmegreen BG. 2009. In IAU Symp. 254, The Galaxy Disk in Cosmological Context, ed. J. Anderson, J. Bland-Hawthorn, & B. Nordström (Cambridge: Cambridge Univ. Press), 289
- Elmegreen et al. (2008) Elmegreen BG, Bournaud F, Elmegreen DM. 2008. ApJ, 688:67–77
- Elmegreen & Elmegreen (2017) Elmegreen DB, Elmegreen BG. 2017. ApJ, 851, L44
- Elmegreen & Elmegreen (2005) Elmegreen BG, Elmegreen DM. 2005. ApJ, 627:632–46
- Épinat et al. (2010) Épinat B, Amram P, Balkowski C, Marcelin M. 2010. MNRAS, 401:2113–47
- Épinat et al. (2012) Épinat B, Tasca L, Amram P, et al. 2012. A&A, 539:A92
- Erb (2008) Erb DK. 2008. ApJ, 674:151–6
- Erb et al. (2012) Erb DK, Quider AM, Henry AL, Martin CL. 2012. ApJ, 759:26
- Fabian (2012) Fabian AC. 2012 ARA&A, 50:455–89
- Fall & Romanowsky (2013) Fall SM, Romanowsky AJ. 2013. ApJ, 769:L26
- Fang et al. (2018) Fang JJ, Faber SM, Koo DC, et al. 2018. ApJ, 858:100
- Ferguson et al. (2004) Ferguson HC, Dickinson M, Giavalisco M, et al. 2004. ApJ, 600:L107–10
- Förster Schreiber et al. (2009) Förster Schreiber NM, Genzel R, Bouché N, et al. 2009. ApJ, 706:1364–428
- Förster Schreiber et al. (2011) Förster Schreiber NM, Shapley AE, Genzel R, et al. 2011. ApJ, 739:45
- Förster Schreiber et al. (2014) Förster Schreiber NM, Genzel R, Newman SF, et al. 2014. ApJ, 787:38
- Förster Schreiber et al. (2018) Förster Schreiber NM, Renzini A, Mancini C, et al. 2018. ApJS, 238:21
- Förster Schreiber et al. (2019) Förster Schreiber NM, Übler H, Davies RL, et al. 2019. ApJ, 875:21
- Franx et al. (1991) Franx M, Illingworth G, de Zeeuw T. 1991. ApJ, 383:112–34
- Franx et al. (2008) Franx M, van Dokkum PG, Förster Schreiber NM, et al. 2008. ApJ, 688:770–88
- Freeman (1970) Freeman KC. 1970. ApJ, 160:811–30
- Freeman et al. (2019) Freeman WR, Siana B, Kriek M, et al. 2019. ApJ, 873:102
- Gatto et al. (2015) Gatto A, Walch S, Mac Low M-M, et al. 2015 MNRAS, 449:1057–75
- Genel et al. (2008) Genel S, Genzel R, Bouché N, et al. 2008. ApJ, 688:789–93
- Genel et al. (2015) Genel S, Fall SM, Hernquist L, et al. 2015. ApJ, 804:L40
- Genzel et al. (2006) Genzel R, Tacconi LJ, Eisenhauer F, et al. 2006. Nature, 442:786–9
- Genzel et al. (2008) Genzel R, Burkert A, Bouché N, et al. 2008. ApJ, 687:59–77
- Genzel et al. (2011) Genzel R, Newman S, Jones T, et al. 2011. ApJ, 733:101
- Genzel et al. (2012) Genzel R, Tacconi LJ, Combes F, et al. 2012. ApJ, 746:69
- Genzel et al. (2014b) Genzel R, Förster Schreiber NM, Rosario D, et al. 2014b. ApJ, 796:7
- Genzel et al. (2015) Genzel R, Tacconi LJ, Lutz D, et al. 2015. ApJ, 800:20
- Genzel et al. (2017) Genzel R, Förster Schreiber NM, Übler H. et al. 2017. Nature, 543:397–401
- Genzel et al. (2020) Genzel R, Price SH, Übler H, et al. 2020 ApJ, in press (arXiv:2006.03046)
- Giavalisco et al. (1996) Giavalisco M, Steidel CC, Macchetto FD. 1996. ApJ, 470:189–94
- Gillman et al. (2019) Gillman S, Swinbank AM, Tiley AL, et al. 2019. MNRAS, 486:175–94
- Girard et al. (2018a) Girard M, Dessauges-Zavadsky M, Schaerer D, et al. 2018a. A&A, 613:A72
- Gladders et al. (2013) Gladders MD, Oemler A, Dressler A, et al. 2013. ApJ, 770:64
- Glazebrook (2013) Glazebrook K 2013. PASA, 30:56
- Goldbaum et al. (2015) Goldbaum NJ, Krumholz MR, Forbes JC. 2015. ApJ, 814:131
- Goldbaum et al. (2016) Goldbaum NJ, Krumholz MR, Forbes JC. 2015. ApJ, 827:28
- Graham & Driver (2005) Graham AW, Driver SP. 2005. PASA, 22:118–27
- Griffiths et al. (1994) Griffiths RE, Casertano S, Ratnatunga KU, et al. 1994. ApJ, 435:19–22
- Grogin et al. (2011) Grogin NA, Kocevski DD, Faber SM, et al. 2011. ApJS, 197:35
- Guo et al. (2012) Guo Y, Giavalisco M, Ferguson HC, Cassata P, Koekemoer AM. 2012. ApJ, 757:120
- Guo et al. (2015) Guo Y, Ferguson HC, Bell EF, et al. 2015. ApJ, 800:39
- Guo et al. (2018) Guo Y, Rafelski M, Bell EF, et al. 2018. ApJ, 853:108
- Harrison et al. (2016) Harrison CM, Alexander DM, Mullaney JR, et al. 2016. MNRAS, 456:1195–220
- Harrison et al. (2017) Harrison CM, Johnson HL, Swinbank AM, et al. 2017. MNRAS, 467:1965–83
- Harrison et al. (2012) Harrison CM, Alexander DM, Swinbank AM, et al. 2012. MNRAS, 426:1073–96
- Hayward et al. (2018) Hayward CC, Chapman SC, Steidel CC, et al. 2018. MNRAS, 476:2278–87
- Heckman & Best (2014) Heckman TM, Best PN. 2014. ARA&A, 52:589–660
- Heckman & Thompson (2017) Heckman TM, Thompson TA. 2017. Galactic Winds and the Role Played by Massive Stars. In: Alsabti A., Murdin P. (eds) Handbook of Supernovae. Springer, Cham. pp. 2431–54
- Henriques et al. (2015) Henriques BMB, White SDM, Thomas PA, et al. 2015. MNRAS, 451:2663–80
- Herrera-Camus et al. (2019) Herrera-Camus R, Tacconi L, Genzel R, et al. 2010. ApJ, 871:37
- Hickox et al. (2014) Hickox RC, Mullaney JR, Alexander DM, et al. 2014. ApJ, 782:9
- Hill et al. (2017) Hill AR, Muzzin A, Franx M, Marchesini D. 2017. ApJ, 849:L26
- Hocking et al. (2018) Hocking A, Geach JE, Sun Y, Davey N. 2018. MNRAS, 473:1108–29
- Hopkins et al. (2006) Hopkins PF, Hernquist L, Cox TJ, et al. 2006. ApJS, 163:1–49
- Hopkins et al. (2012) Hopkins PF, Quataert E, Murray N. 2012. MNRAS, 421:3522–37
- Hopkins (2015) Hopkins PF. 2015. MNRAS, 450:53–110
- Huang et al. (2013) Huang JS, Faber SM, Willmer CNA, et al. 2013. ApJ, 766:21
- Huang et al. (2017) Huang K-H, Fall SM, Ferguson HC, et al. 2017. ApJ, 838:6
- Huertas-Company et al. (2015) Huertas-Company M, Gravet R, Cabrera-Vives G, et al. 2015. ApJS, 221:8
- Huertas-Company et al. (2016) Huertas-Company M, Bernardi M, Pérez-González PG, et al. 2016. MNRAS, 462:4495–516
- Hung et al. (2019) Hung C.-L., Hayward CC, Yuan T, et al. 2019. MNRAS, 482:5125–37
- Ilbert et al. (2009) Ilbert O, Capak P, Salvato M, et al. 2009. ApJ, 690:1236–49
- Ilbert et al. (2013) Ilbert O, McCracken HJ, Le Fèvre O, et al. 2013. A&A, 556:A55
- Illingworth et al. (2013) Illingworth GD, Magee D, Oesch PA, et al. 2013. ApJS, 209:6
- Ivison et al. (2007) Ivison RJ, Magnelli B, Ibar E, et al. 2010. A&A, 518:L31
- Jiang et al. (2019) Jiang F, Dekel A, Kneller, O, et al. 2019. MNRAS, 488:4801–15
- Johnson et al. (2018) Johnson , et al. 2015. MNRAS, 453:2540–57
- Johnston et al. (2015) Johnston R, Vaccari M, Jarvis M, et al. 2015. MNRAS, 453:2540–57
- Jones et al. (2010a) Jones TA, Swinbank AM, Ellis RS, Richard J, Stark DP. 2010a. MNRAS, 404:1247–62
- Kaasinen et al. (2017) Kaasinen M, Bian F, Groves B, Kewley LJ, Gupta A. 2017. MNRAS, 465:3220–34
- Kakkad et al. (2016) Kakkad D, Mainieri V, Padovani P, et al. 2016. A&A, 592:A148
- Kartaltepe et al. (2015) Kartaltepe JS, Mozena M, Kocevski D, et al. 2015. ApJS, 221:11
- Kashino et al. (2019) Kashino D, Silverman JD, Sanders D, et al. 2019. ApJS, 241:10
- Kassin et al. (2007) Kassin SA, Weiner BJ, Faber SM, et al. 2007. ApJ, 660:L35–38
- Kassin et al. (2012) Kassin SA, Weiner BJ, Faber SM, et al. 2012. ApJ, 758:106
- Kelson (2014) Kelson DD. 2014. arXiv:1406.5191
- Kelson et al. (2016) Kelson DD, Benson AJ, Abramson LE. 2016. arXiv:1610.06566
- Kewley et al. (2019) Kewley LJ, Nicholls DC, Sutherland RS. 2019. ARA&A, 57:511–70
- Kocevski et al. (2012) Kocevski DD, Faber SM, Mozena M, et al. 2012. ApJ, 744:148
- Kocevski et al. (2017) Kocevski DD, Barro G, Faber SM, et al. 2017. ApJ, 846:112
- Koekemoer et al. (2011) Koekemoer AM, Faber SM, Ferguson HC, et al. 2011. ApJS, 197:36
- Kornei et al. (2012) Kornei KA, Shapley AE, Martin CL, et al. 2012. ApJ, 758:135
- Kravtsov (2013) Kravtsov AV. 2013. ApJ, 764:L31
- Krumholz et al. (2018) Krumholz MR, Blakesley B, Forbes JC, Crocker RM. 2018. MNRAS, 477:2716–40
- Laigle et al. (2016) Laigle C, McCracken HJ, Ilbert O, et al. 2016. ApJS, 224:24
- Lang et al. (2014) Lang P, Wuyts S, Somerville RS, et al. 2014. ApJ, 788:11
- Lang et al. (2017) Lang P, Förster Schreiber NM, Genzel R, et al. 2017. ApJ, 840:92
- Larsen & Richtler (1999) Larsen SS, Richtler T. 1999. A&A, 345:59–72
- Law et al. (2009) Law DR, Steidel CC, Erb DK, et al. 2009 ApJ, 697:2057–82
- Law et al. (2012a) Law DR, Shapley AE, Steidel CC, et al. 2012a Nature, 487:338–40
- Law et al. (2012b) Law DR, Steidel CC, Shapley AE, et al. 2012b ApJ, 745:85
- Law et al. (2012c) Law DR, Steidel CC, Shapley AE, et al. 2012c ApJ, 759:29
- Leitner (2012) Leitner SN. 2012. ApJ, 745:149
- Leja et al. (2015) Leja J, van Dokkum PG, Franx M, Whitaker KE. 2015. ApJ, 798:115
- Leja et al. (2019a) Leja J, Carnall AC, Johnson BD, Conroy C, Speagle JS. 2019a. ApJ, 876:3
- Leja et al. (2019b) Leja J, Johnson BD, Conroy C, et al. 2019b. ApJ, 877:140
- Leschinski et al. (2016) Leschinski K, Czoske O, Köhler R, et al. 2016. Proc. SPIE, 9911, 991124
- Leung et al. (2019) Leung GCK, Coil AL, Aird J, et al. 2019. ApJ, 886:11
- Lilly et al. (2013) Lilly SJ, Carollo CM, Pipino A, Renzini A, Peng Y. 2013. ApJ, 772:119
- Lilly & Carollo (2016) Lilly SJ, Carollo CM. 2016. ApJ, 833:1
- Lindroos et al. (2018) Lindroos L, Knudsen KK, Stanley, F, et al. 2018. MNRAS, 476:3544–54
- Liu et al. (2016) Liu FS, Jiang D, Guo Y, et al. 2016. ApJ, 822:L25
- Liu et al. (2017) Liu FS, Jiang D, Faber SM, et al. 2017. ApJ, 844:L2
- Liu et al. (2018) Liu FS, Jia M, Yesuf HM, et al. 2018. ApJ, 860:60
- Livermore et al. (2015) Livermore RC, Jones TA, Richard J, et al. 2015. MNRAS, 450:1812–35
- López-Sanjuan et al. (2013) López-Sanjuan C, Le Fèvre O, Tasca LAM, et al. 2013. A&A, 553, A78
- Lotz et al. (2004) Lotz JM, Primack J, Madau P. 2004. AJ, 128:163–82
- Lotz et al. (2017) Lotz JM, Koekemoer A, Coe D, et al. 2017. AJ, 837:97
- Lovell et al. (2018) Lovell MR, Pillepich A, Genel S, et al. 2018. MNRAS, 481:1950–75
- Luo et al. (2017) Luo B, Brandt WN, Xue YQ, et al. 2017. ApJS, 228:2
- Lutz (2014) Lutz D. 2014. ARA&A, 52:373–414
- Madau & Dickinson (2014) Madau P, Dickinson M. 2014. ARA&A, 52:415–86
- Magnelli et al. (2014) Magnelli B, Lutz D, Saintonge A, et al. 2014. A&A, 561:86
- Magnelli et al. (2015) Magnelli B, Ivison RJ, Lutz D, et al. 2015. A&A, 573:A45
- Maiolino & Mannucci (2019) Maiolino R, Mannucci F. 2019. A&AReview, 27:3
- Mandelker et al. (2014) Mandelker N, Dekel A, Ceverino D, et al. 2014. MNRAS, 443:3675–702
- Mandelker et al. (2017) Mandelker N, Dekel A, Ceverino D, et al. 2017. MNRAS, 464:635–65
- Mannucci et al. (2010) Mannucci F, Cresci G, Maiolino R, Marconi A, Gnerucci A. 2010. MNRAS, 408:2115–27
- Marchesini et al. (2012) Marchesini D, Stefanon M, Brammer GB, Whitaker KE, 2012. ApJ, 748:126
- Martinsson et al. (2013) Martinsson TPK, Verheijen MAW, Westfall KB, et al. 2013. A&A, 557:A131
- Martizzi et al. (2012) Martizzi D, Teyssier R, Moore B, Wentz T. 2012. MNRAS, 422:3081–91
- Mason et al. (2017) Mason CA, Treu T, Fontana A, et al. 2017. ApJ, 838:14
- Masters et al. (2016) Masters D, Faisst A, Capak P. 2016. ApJ, 828:18
- Matthee & Schaye (2019) Matthee J, Schaye J. 2019. MNRAS484:915–32
- McGaugh (2012) McGaugh S. 2012. AJ, 143:40
- Mendel et al. (2015) Mendel JT, Saglia RP, Bender R, et al. 2015. ApJ, 804:L4
- Mendel et al. (2020) Mendel JT, Beifiori A, Saglia RP, et al. 2020. ApJ, 899, 87
- Michałowski et al. (2014) Michałowski MJ, Hayward CC, Dunlop JS, et al. 2014. A&A, 571:75
- Mieda et al. (2016) Mieda E, Wright SA, Larkin JE, et al. 2016. ApJ, 831:78
- Mihos & Hernquist (1994) Mihos JC, Hernquist L. 1994. ApJ, 431:9–12
- Miller et al. (2012) Miller SH, Ellis RS, Sullivan M, et al. (2012) ApJ, 753:74
- Mo et al. (1998) Mo HJ, Mao S, White SDM. 1998. MNRAS, 295:319–36
- Momcheva et al. (2016) Momcheva IG, Brammer GB, van Dokkum PG, et al. 2016. ApJS, 225:27
- Morrison et al. (2010) Morrison GE, Owen FN, Dickinson M, Ivison RJ, Ibar E. 2010. ApJS, 188:178–86
- Moster et al. (2013) Moster BP, Naab T, White SDM. 2013 MNRAS, 428:3121–38
- Mowla et al. (2019a) Mowla L, van der Wel A, van Dokkum P, Miller TB. 2019a. ApJ, 872:13
- Mowla et al. (2019b) Mowla L, van Dokkum P, Brammer GB. 2019b. ApJ, 880:57
- Mullaney et al. (2012a) Mullaney JR, Pannella M, Daddi E, et al. 2012a. MNRAS, 419:95–115
- Mullaney et al. (2012b) Mullaney JR, Daddi E, Béthermin M, et al. 2012b. ApJ, 753:L30
- Muratov et al. (2015) Muratov AL, Kereš D, Faucher-Giguère C.-A. et al. 2015. MNRAS, 454:2691–713
- Murray et al. (2011) Murray N, Ménard B, Thompson TA. 2011. ApJ, 735:66
- Murray et al. (2005) Murray N, Quataert E, Thompson TA. 2005. ApJ, 618:569–85
- Naab & Ostriker (2017) Naab T, Ostriker JP. 2017. ARA&A, 55:59–109
- Navarro & Steinmetz (2000) Navarro JF, Steinmetz M. 2000. ApJ, 538:477–88
- Nelson et al. (2018) Nelson D, Pillepich A, Springel V, et al. 2018. MNRAS, 475:624–47
- Nelson et al. (2013) Nelson EJ, van Dokkum PG, Momcheva I, et al. 2013. ApJ, 763:L16
- Nelson et al. (2014) Nelson E, van Dokkum P, Franx M, et al. 2014. Nature, 513:394–97
- Nelson et al. (2016a) Nelson EJ, van Dokkum PG, Momcheva, IG, et al. 2016a. ApJ, 817:L9
- Nelson et al. (2016b) Nelson EJ, van Dokkum PG, Förster Schreiber NM, et al. 2016b. ApJ, 828:27
- Nesvadba et al. (2008) Nesvadba N, Lehnert M, DeBreuck C, Gilbert A, vanBreugel W. 2008.A&A, 491:407-424
- Newman et al. (2015) Newman AB, Belli S, Ellis RS. 2015. ApJ, 813:L7
- Newman et al. (2018b) Newman AB, Belli S, Ellis RS, Patel SG. 2018b. ApJ, 862:126
- Newman et al. (2012a) Newman SF, Genzel R, Förster Schreiber NM, et al. 2012a. ApJ, 761:43
- Newman et al. (2013) Newman SF, Genzel R, Förster Schreiber NM, et al. 2013. ApJ, 767:104
- Newman et al. (2012b) Newman SF, Shapiro Griffin K, Genzel R, et al. 2012b. ApJ, 752:111
- Noeske et al. (2007) Noeske KG, Faber SM, Weiner BJ, et al. 2007. ApJ, 660:L43–6
- Noordermeer (2008) Noordermeer E. 2008. MNRAS, 385:1359–64
- Nordon et al. (2012) Nordon R, Lutz D, Genzel R, et al. 2012. ApJ, 745:182
- Nordon et al. (2013) Nordon R, Lutz D, Saintonge A, et al. 2013. ApJ, 762:125
- Obreschkow & Glazebrook (2014) Obreschkow D, Glazebrook K. 2014. ApJ, 784:26
- Oklopčić et al. (2017) Oklopčić A, Hopkins PF, Feldmann R, et al. 2017. MNRAS, 465:952–69
- Oppenheimer & Davé (2006) Oppenheimer BD, Davé R. 2006. MNRAS, 373:1265-92
- Padovani et al. (2017) Padovani P, Alexander DM, Assef RJ, et al. 2017. Astron. Astrophys. Rev,, 25:2
- Parsa et al. (2016) Parsa S, Dunlop JS, McLure RJ, Mortlock A, 2016. MNRAS, 456:3194–211
- Patel et al. (2013a) Patel SG, van Dokkum PG, Franx M, et al. 2013a. ApJ, 766:15
- Patel et al. (2013b) Patel SG, Fumagalli M, Franx M, et al. 2013b. ApJ, 778:115
- Pearson et al. (2018) Pearson WJ, Wang L, Hurley PD, et al. 2018. A&A, 615:146
- Peng et al. (2010) Peng Y, Lilly SJ, Kovač K, et al. 2010. ApJ, 721:193–221
- Péroux & Howk (2020) Péroux C, Howk JC. 2020. ARA&A, this volume
- Peth et al. (2016) Peth MA, Lotz JM, Freeman PE, et al. 2016. MNRAS, 458:963-987
- Pettini & Pagel (2004) Pettini M, Pagel BEJ. 2004. MNRAS, 348:L59–63
- Pillepich et al. (2018a) Pillepich A, Springel V, Nelson D, et al. 2018a MNRAS, 473:4077–106
- Pillepich et al. (2018b) Pillepich A, Nelson D, Hernquist L, et al. 2018b. MNRAS, 475:648–75
- Pillepich et al. (2019) Pillepich A, Nelson D, Springel V, et al. 2019. MNRAS, 490:3196–233
- Popping et al. (2017) Popping G, Decarli R, Man AWS, et al. 2017. A&A, 602:11
- Price et al. (2020) Price SH, Kriek M, Barro G, et al. 2020 ApJ, 894:91
- Puglisi et al. (2017) Puglisi A, Daddi E, Renzini A, et al. 2017. ApJ, 838:18
- Rangel et al. (2014) Rangel C, Nandra K, Barro G, et al. 2014. MNRAS, 440:
- Reddy et al. (2015) Reddy NA, Kriek M, Shapley AE, et al. 2015. ApJ, 806, 259
- Reddy et al. (2018) Reddy NA, Oesch PA, Bouwens RJ, et al. 2018. ApJ, 853:56
- Renzini (2009) Renzini A. 2009. MNRAS, 398:58–62
- Ribeiro et al. (2016) Ribeiro B, Le Fèvre O, Tasca LAM, et al. 2016. A&A, 593:A22
- Ribeiro et al. (2017) Ribeiro B, Le Fèvre O, Cassata P, et al. 2017. A&A, 608:A16
- Rigby et al. (2017) Rigby JR, Johnson TL, Sharon K, et al. 2017. ApJ, 843:79
- Rodighiero et al. (2011) Rodighiero G, Daddi E, Baronchelli I, et al. 2011. ApJ, 739:L40
- Rodighiero et al. (2014) Rodighiero G, Renzini A, Daddi E, et al. 2014. MNRAS, 443:19–30
- Rodrigues et al. (2018) Rodrigues M, Puech M, Flores H, Hammer F, Pirzkal N. 2018. MNRAS, 475:5133–43
- Rujopakarn et al. (2016) Rujopakarn W, Dunlop JS, Rieke GH, et al. 2016. ApJ, 833:12
- Salmon et al. (2016) Salmon B, Papovich C, Long J, et al. 2016. ApJ, 827:20
- Salvato et al. (2019) Salvato M, Ilbert O, Hoyle B. 2019. Nature Astronomy, 3:212–22
- Sanders et al. (2016a) Sanders RL, Shapley AE, Kriek M, et al. 2016a. ApJ, 816:23
- Sanders et al. (2017) Sanders RL, Shapley AE, Zhang K, Yan R. 2017. ApJ, 850:136
- Sanders et al. (2018) Sanders RL, Shapley AE, Kriek M, et al. 2018. ApJ, 858:99
- Santini et al. (2012) Santini P, Rosario DJ, Shao L, et al. 2012. A&A, 540:A109
- Sargent et al. (2012) Sargent MT, Béthermin M, Daddi E, Elbaz D. 2012. ApJ, 747:31
- Schechter (1976) Schechter P. 1976. ApJ, 203:297–306
- Schreiber et al. (2015) Schreiber C, Pannella M, Elbaz D, et al. 2015. A&A, 575:74
- Scoville et al. (2007) Scoville N, Abraham RG, Aussel H, et al. 2007. ApJS, 172:38–45
- Scoville et al. (2017) Scoville N, Lee N, Vanden Bout P, et al. 2017. ApJ, 837:150
- Seon & Draine (2016) Seon K-I, Draine BT. 2016. ApJ, 833:201
- Shapiro et al. (2008) Shapiro KL, Genzel R, Förster Schreiber, et al. 2008. ApJ, 682:231–51
- Shapiro et al. (2010) Shapiro KL, Genzel R, Förster Schreiber NM. 2010. MNRAS, 403:L36–40
- Shapley (2011) Shapley AE. 2011. ARA&A, 49:525–80
- Shapley et al. (2003) Shapley AE, Steidel CC, Pettini M, Adelberger KL. 2003. ApJ, 588:65–89
- Shapley et al. (2015) Shapley AE, Reddy NA, Kriek M, et al. 2015. ApJ, 801:88
- Shapley et al. (2019) Shapley AE, Sanders RL, Shao P, et al. 2019. ApJ, 881:L35
- Shivaei et al. (2015) Shivaei I, Reddy NA, Shapley AE, et al. 2015. ApJ, 815:98
- Silverman et al. (2009) Silverman JD, Lamareille F, Maier C, et al. 2009. ApJ, 696:396–410
- Silverman et al. (2015) Silverman JD, Daddi E, Rodighiero G, et al. 2015. ApJ, 812:L23
- Simmons et al. (2017) Simmons BD, Lintott C, Willett KW, et al. 2017. MNRAS, 464:4420–47
- Simons et al. (2017) Simons RC, Kassin SA, Weiner BJ, et al. 2017. ApJ, 843:46
- Simons et al. (2019) Simons RC, Kassin SA, Snyder GF, et al. 2019. ApJ, 874:59
- Skelton et al. (2014) Skelton RE, Whitaker KE, Momcheva IG, et al. 2014. ApJS, 214:24
- Smail et al. (1997) Smail I, Ivision RJ, Blain AW. 1997. ApJ, 490:5–8
- Smolčić et al. (2017) Smolčić V, Novak M, Bondi M, et al. 2017. A&A, 602:A1
- Snyder et al. (2015) Snyder GF, Lotz JM, Moody C, et al. 2015. MNRAS, 451:4290–310
- Snyder et al. (2017) Snyder GF, Lotz JM, Rodriguez-Gomez V, et al. 2017. MNRAS, 468:207–16
- Somerville & Davé (2015) Somerville RS, Davé R. 2015. ARA&A, 53:51–113
- Somerville et al. (2008) Somerville RS, Barden M, Rix H-W., et al. 2008. ApJ, 672:776–86
- Somerville et al. (2018) Somerville RS, Behroozi P, Pandya V, et al. 2018. MNRAS, 473:2714–36
- Soto et al. (2017) Soto E, de Mello DF, Rafelski M, et al. 2017. ApJ, 834:6
- Speagle et al. (2014) Speagle JS, Steinhardt CL, Capak PL, Silverman JD. 2014. ApJS, 214:15
- Spilker et al. (2015) Spilker JS, Aravena M, Marrone DP, et al. 2015. ApJ, 811:124
- Spilker et al. (2016) Spilker JS, Bezanson R, Marrone DP, et al. 2016. ApJ, 832:19
- Springel (2010) Springel V. 2010. MNRAS, 401:791–851
- Stach et al. (2018) Stach SM, Smail I, Swinbank AM, et al. 2018. ApJ, 860:161
- Steidel et al. (2016) Steidel CC, Strom AL, Pettini M, et al. 2016. ApJ, 826:159
- Stott et al. (2016) Stott JP, Swinbank AM, Johnson HL, et al. 2016. MNRAS, 457:1888–904
- Strickland et al. (2004) Strickland DK, Heckman TM, Colbert EJM, Hoopes CG, Weaver KA. 2004. ApJ, 606:829–52
- Strom et al. (2018) Strom AL, Steidel CC, Rudie GC et al. 2018. ApJ, 836:164
- Suess et al. (2019) Suess KA, Kriek M, Price SH, Barro G. 2019. ApJ, 877:103
- Swinbank et al. (2017) Swinbank AM, Harrison CM, Trayford J, et al. 2017. MNRAS, 467:3140–59
- Swinbank et al. (2019) Swinbank AM, Harrison CM, Tiley AL, et al. 2019. MNRAS, 487:381–93
- Szomoru et al. (2013) Szomoru D, Franx M, van Dokkum PG, et al. 2013. ApJ, 763:73
- Tacchella et al. (2015) Tacchella S, Carollo CM, Renzini A, et al. 2015. Science, 348:314–7
- Tacchella et al. (2016) Tacchella S, Dekel A, Carollo CM, et al. 2016. MNRAS, 458:242–63
- Tacchella et al. (2018) Tacchella S, Carollo CM, Förster Schreiber NM, et al. 2018. ApJ, 859:56
- Tacconi et al. (2006) Tacconi LJ, Neri R, Chapman, SC, et al. 2006. ApJ, 640:228–40
- Tacconi et al. (2008) Tacconi LJ, Genzel R, Smail I, et al. 2008. ApJ, 680:246–62
- Tacconi et al. (2013) Tacconi LJ, Neri R, Genzel R, et al. 2013. ApJ, 768:74
- Tacconi et al. (2018) Tacconi LJ, Genzel R, Saintonge A, et al. 2018. ApJ, 853:179
- Tacconi et al. (2020) Tacconi LJ, Genzel R, Sternberg A. 2020. ARA&A, this volume
- Tadaki et al. (2017a) Tadaki K, Genzel R, Kodama T, et al. 2017a. ApJ, 834:135
- Tadaki et al. (2017b) Tadaki K, Kodama T, Nelson EJ, et al. 2017b. ApJ, 841:L25
- Tadhunter (2016) Tadhunter C. 2016. Astron. Astrophys. Rev,, 24:10
- Talia et al. (2017) Talia M, Brusa M, Cimatti A, et al. 2017 MNRAS, 471:4527–40
- Teklu et al. (2018) Teklu AF, Remus R-S, Dolag K, et al. 2018. ApJ, 854:L28
- Thomas et al. (2005) Thomas D, Maraston C, Bender R, Mendes de Oliveira C. 2005. ApJ, 621:673-94
- Thompson et al. (2015) Thompson R, Davé R, Huang S, Katz N. 2015. arXiv1508.01851
- Tiley et al. (2019a) Tiley AL, Bureau M, Cortese L, et al. 2019a. MNRAS, 482:2166–88
- Tiley et al. (2019b) Tiley AL, Swinbank AM, Harrison CM, et al. 2019b. MNRAS, 485:934–60
- Toft et al. (2014) Toft S, Smolčić V, Magnelli B., et al. 2014. ApJ, 782:68
- Toft et al. (2017) Toft S, Zabl J, Richard J, et al. 2017. Nature, 546:510–3
- Tomczak et al. (2014) Tomczak AR, Quadri RF, Tran K-VH, et al. 2014 ApJ, 783, 85
- Tomczak et al. (2016) Tomczak AR, Quadri RF, Tran K-VH, et al. 2016 ApJ, 817, 118
- Torrey et al. (2017) Torrey P, Wellons S, Ma CP, Hopkins PF, Vogelsberger M. 2017. MNRAS, 467:4872–85
- Turner et al. (2017) Turner OJ, Cirasuolo M, Harrison CM, et al. 2017 MNRAS, 471, 1280–320
- Übler et al. (2014) Übler H, Naab T, Oser L, et al. 2014. MNRAS, 443:2092–111
- Übler et al. (2017) Übler H, Förster Schreiber NM, Genzel R, et al. 2017. ApJ, 842:121
- Übler et al. (2018) Übler H, Genzel R, Tacconi LJ, et al. 2018. ApJ, 854:L24
- Übler et al. (2019) Übler H, Genzel R, Wisnioski E, et al. 2019. ApJ, 880:48
- van der Kruit & Allen (1978) van der Kruit PC, Allen RJ. 1978. ARA&A, 16:103–39
- van der Wel et al. (2011) van der Wel A, Rix, HW, Wuyts S, et al. 2011. ApJ, 730:38
- van der Wel et al. (2014a) van der Wel A., Franx M, van Dokkum PG, et al. 2014a. ApJ, 788:28
- van der Wel et al. (2014b) van der Wel A., Chang Y, Bell EF, et al. 2014b. ApJ, 792:L6
- van de Voort (2016) van de Voort F. 2016. MNRAS, 462:778–93
- van Dokkum et al. (2010) van Dokkum PG, Whitaker KE, Brammer G, et al. 2010. ApJ, 709:1018–41
- van Dokkum et al. (2013) van Dokkum PG, Leja J, Nelson EJ, et al. 2013. ApJ, 771:L35
- van Dokkum et al. (2015) van Dokkum PG, Nelson EJ, Franx M, et al. 2015. ApJ, 813:23
- Veilleux et al. (2005) Veilleux S, Cecil G, Bland-Hawthorn J. 2005. ARA&A, 43:769–826
- Wang et al. (2017) Wang W, Faber SM, Liu FS, et al. 2017. MNRAS, 469:4063–82
- Weiner et al. (2009) Weiner BJ, Coil AL, Prochaska JX, et al. 2009. ApJ, 692:187–211
- Weiner et al. (2006a) Weiner BJ, Willmer CNA, Faber SM, et al. 2006a. ApJ, 653:1027–48
- Wellons et al. (2015) Wellons S, Torrey P, Ma CP, et al. 2015. MNRAS, 449:361–72
- Wellons & Torrey (2017) Wellons S, Torrey P. 2017. MNRAS, 467:3887–97
- Wellons et al. (2020) Wellons S, Faucher-Giguére C-A, Anglés-Alcàzar D, et al. 2020. MNRAS, 497, 4051–65
- Whitaker et al. (2011) Whitaker KE, Labbé I, van Dokkum PG, et al. 2011. ApJ, 735:86
- Whitaker et al. (2012) Whitaker KE, van Dokkum PG, Brammer G, Franx M. 2012. ApJ, 754:29
- Whitaker et al. (2014) Whitaker KE, Franx M, Leja J, et al. 2014. ApJ, 795:104
- Williams et al. (2009) Williams RJ, Quadri RF, Franx M, van Dokkum PG, Labbé I. 2009. ApJ, 691:1879–95
- Wilman et al. (2020) Wilman DJ, Fossati M, Mendel JT, et al. 2020. ApJ, 892:1
- Windhorst et al. (1995) Windhorst RA, Fomalont EB, Kellermann KI, et al. 1995. Nature, 375:471–4
- Wisnioski et al. (2015) Wisnioski E, Förster Schreiber NM, Wuyts S, et al. 2015. ApJ, 799:209
- Wisnioski et al. (2018) Wisnioski E, Mendel JT, Förster Schreiber NM, et al. 2018. ApJ, 855:97
- Wisnioski et al. (2019) Wisnioski E, Förster Schreiber NM, Fossati M, et al. 2019. ApJ, 886:124
- Wright et al. (2019) Wright AH, Hildebrandt H, Kuijken K, et al. 2019. A&A, 632:A34
- Wuyts et al. (2014) Wuyts E, Kurk JD, Förster Schreiber NM, et al. 2014. ApJ, 789:L40
- Wuyts et al. (2010) Wuyts S, Cox TJ, Hayward CC, et al. 2010. ApJ, 722:1666–84
- Wuyts et al. (2011a) Wuyts S, Förster Schreiber NM, Lutz D, et al. 2011a. ApJ, 738:106
- Wuyts et al. (2011b) Wuyts S, Förster Schreiber NM, van der Wel A, et al. 2011b. ApJ, 742:96
- Wuyts et al. (2012) Wuyts S, Förster Schreiber NM, Genzel R, et al. 2012. ApJ, 753:114
- Wuyts et al. (2013) Wuyts S, Förster Schreiber NM, Nelson EJ, et al. 2013. ApJ, 779:135
- Wuyts et al. (2016b) Wuyts S, Förster Schreiber NM, Wisnioski E, et al. 2016b. ApJ, 831:149
- Zahid et al. (2014) Zahid HJ, Dima GI, Kudritzki R-P, et al. 2014. ApJ, 791:130
- Zanella et al. (2015) Zanella A, Daddi E, Le Floc’h E, et al. 2015. Nature, 521:54–6
- Zavala et al. (2016) Zavala J, Frenk CS, Bower R, et al. 2016. MNRAS, 460:4466–82
- Zhang et al. (2019) Zhang H, Primack JR, Faber SM, et al. 2019. MNRAS, 484:5170–91
- Zolotov et al. (2015) Zolotov A, Dekel A, Mandelker N, et al. 2015. MNRAS, 450:2327–53
SUPPLEMENTAL TABLES
The Tables below are associated with Figures 2 and 3 of the main article, which feature a selection of extragalactic surveys providing relevant samples at cosmic noon epochs, either specifically targeting objects or having a significant number of sources overlapping with the interval. Table 1 lists the photometric and spectroscopic surveys, acronyms or brief description, and the main reference for the source catalogs used in Figure 2. Table 2 focusses on the near-IR IFU surveys plotted in Figure 3, with their acronyms or brief description, the main IFU instrument and observing mode used, and the reference for the published galaxy sample properties.
-
Surveya Full Name or Description Reference(s) Wide-field Ground-based Multi-band Photometric Imaging Surveys KiDSVIKING-450b (KV450) Kilo Degree Survey VISTA Kilo degree Infrared Galaxy Wright et al. (2019) HSC-SSPb (HSC-W/-D/-UD) Hyper Suprime-Cam Subaru Strategic Program (Wide, Deep, UltraDeep) Aihara et al. (2018) BM/BX/LBG Imaging campaigns centered on QSO fields Steidel et al. (2003, 2004) Wide- to Deep-field Ground-/space-based Multi-band Photometric Surveys, including HST Imaging COSMOS Cosmic Evolution Survey (COSMOS2015 catalog) Scoville et al. (2007a), Laigle et al. (2016) CANDELS Cosmic Assembly Near-infrared Deep Extragalactic Legacy Survey Grogin et al. (2011), Koekemoer et al. (2011) MUSYC/ECDFS Multi-wavelength Survey by Yale-Chile / Extended Chandra Deep Field South Cardamone et al. (2010) zFOURGE FourStar Galaxy Evolution survey Straatman et al. (2016) AEGIS All-wavelength Extended Groth strip International Survey, NEWFIRM Medium Band Survey Davis et al. (2007), Whitaker et al. (2011) HFF Hubble Frontier Fields Treasury Survey (HFF-DeepSpace catalog) Lotz et al. (2017), Shipley et al. (2018) HST Grism Spectroscopic Imaging Surveys 3D-HST/AGHAST HST WFC3/G141 grism spectroscopic surveys Momcheva et al. (2016) WISPs WFC3 Infrared Spectroscopic Parallel surveys Atek et al. (2010), Colbert et al. (2013) GLASS Grism Lens-Amplified Survey from Space Treu et al. (2015) Ground-based Optical and Near-IR Spectroscopic Surveys DEEP2/DEEP3 Keck/DEIMOS spectroscopic surveys Newman et al. (2013), Cooper et al. (2012) VVDS VIMOS VLT Deep Survey Le Fèvre et al. (2013) zCOSMOS Bright and Deep spectroscopic survey in COSMOS (COSMOS2015 catalog) Lilly et al. (2009), Laigle et al. (2016) BM/BX/LBG Optical spectroscopy of rest-UV-selected galaxies Steidel et al. (2003, 2004) VUDSb VIMOS Ultra-Deep Survey Le Fèvre et al. (2015), Tasca et al. (2017) VANDELSb VIMOS survey of the CANDELS CDFS and UDS fields McLure et al. (2018), Pentericci et al. (2018) GOODS-N Compilation of optical spectroscopic redshifts from multiple programs in GOODS-North Barger et al. (2008) CDFS Compilation of optical spectroscopic redshifts from multiple programs in GOODS/CDF-South Master Catalog v3.0c (excluding VVDS) KBSS-UV/-MOSFIRE Keck Baryonic Structure Survey with LRIS (optical), MOSFIRE (near-IR) Steidel et al. (2014), Strom et al. (2017) FastSound Subaru/FMOS near-IR galaxy redshift survey Tonegawa et al. (2015), Okada et al. (2016) FMOS-COSMOS Subaru/FMOS near-IR spectroscopic survey in COSMOS Kashino et al. (2019) MOSDEF MOSFIRE Deep Evolution Field survey (near-IR) Kriek et al. (2015) zFIRE Keck/MOSFIRE near-IR spectroscopic survey in rich environments Nanayakkara et al. (2016) TKRS2 Team Keck Redshift Survey in near-IR with MOSFIRE Wirth et al. (2015) {tabnote}aLabel used in Figure 2 is given in parenthesis if different from the survey name. bOn-going observations or final data processing; information included in Figure 2 is based on interim source catalog releases presented in the reference(s) in the last column. cThe compilation and references are available at https://www.eso.org/sci/activities/garching/projects/goods/MasterSpectroscopy.html; the VVDS survey is plotted separately in Figure 2 of the main article.
-
Survey Full Name or Description Instrument and modea Redshifts Reference(s) KMOS IFU survey across cosmic noon KMOS, no-AO Wisnioski et al. (2015, 2019) KROSS KMOS Redshift One Spectroscopic Survey KMOS, no-AO Stott et al. (2016), Harrison et al. (2017) KGES KMOS Galaxy Evolution Survey KMOS, no-AO Gillman et al. (2020) KDS KMOS Deep Survey KMOS, no-AO Turner et al. (2017) KLEVERb KMOS LEnsed galaxies Velocity and Emission line Review KMOS, no-AO Curti et al. (2020) KLASSc KMOS Lens-Amplified Spectroscopic Survey KMOS, no-AO Mason et al. (2017), Girard et al. (2020) KLENS KMOS LENsing Survey KMOS, no-AO Girard et al. (2018) KASHzb KMOS AGN Survey at High redshift KMOS, no-AO Harrison et al. (2016), Scholtz et al. (2020) SINS/zC-SINF Spectroscopic Imaging survey in the Near-IR with SINFONI SINFONI, no-AO and AO Förster Schreiber et al. (2009) zCOSMOS-SINFONI project SINFONI, no-AO Mancini et al. (2011) SINS/zC-SINF AO AO follow-up of SINS/zC-SINF sample SINFONI, AO Förster Schreiber et al. (2018) MASSIV Mass Assembly Survey with SINFONI in VVDS SINFONI, no-AO and AO Contini et al. (2012), Épinat et al. (2012) AMAZE Assessing the Mass-Abundance redshift[-Z] Evolution SINFONI, no-AO Troncoso et al. (2014) LSD Lyman-break galaxies Stellar populations and Dynamics SINFONI, AO Troncoso et al. (2014) Law09 IFU observations of rest-UV-selected galaxies OSIRIS, AO Law et al. (2009, 2012) W09 IFU observations of rest-UV-selected galaxies OSIRIS, AO Wright et al. (2009) IROCKs Intermediate Redshift OSIRIS Chemo-Kinematic Survey OSIRIS, AO Mieda et al. (2016) WiggleZ IFU follow-up of rest-UV selected galaxies OSIRIS, AO Wisnioski et al. (2011) SHiZELS SINFONI - High-Z Emission Line Survey SINFONI, OSIRIS, NIFS, AO Gillman et al. (2019) Lensed Collection of strongly-lensed targets SINFONI, OSIRIS, NIFS, AO Jones et al. (2010, 2013) Yuan et al. (2011, 2012) Wuyts et al. (2014) Livermore et al. (2015) Leethochawalit et al. (2016) {tabnote}a KMOS: multi-IFU at the VLT; SINFONI: single-IFU at the VLT; OSIRIS: single-IFU at Keck; NIFS: single-IFU at Gemini. Seeing-limited and adaptive optics-assisted surveys are distinguished (no-AO, AO). b Survey on-going or recently completed; band, on-source integration times, number of objects targeted, redshift range, and galaxy properties of detected subsets in Figure 3 and in fourth column refer to the published samples in the references given in the last column. c KLASS also targeted galaxies.
SUPPLEMENTAL TEXT: SPECTRAL AND KINEMATIC MODELING
The past decade has seen important developments in modeling of the spectral energy distribution (SED) and kinematics data of distant galaxies, to derive their stellar populations properties such as stellar mass, age, star formation rate and history as well as their dynamical properties such as circular velocity and dynamical mass. Deriving these fundamental properties is essential to place observed galaxies in the theoretical framework of galaxy evolution through comparisons with (semi-)analytical models and numerical cosmological simulations. As spectral and kinematic data sets are growing rapidly in both sample size and detail of information, increasingly sophisticated approaches are being developed to improve the efficiency of modeling codes and treat adequately the various parameter correlations involved. Here we summarize basic ingredients and methods employed in state-of-the-art SED and kinematic modeling applied to data of high-redshift galaxies.
Spectral Modeling
The translation from SEDs to physical quantities describing a galaxy’s stellar mass, star formation rate or history requires the use of stellar population synthesis (SPS), dust, and ideally photoionization models. This is the case for SEDs sampled at any spectral resolution, and we therefore discuss these techniques indiscriminately of .
The ingredients to SPS models include a stellar spectral library, a set of isochrones, an IMF, and a star formation history (SFH). Each of these components is discussed in depth in the review by Conroy (2013). Here we highlight a few succinct aspects of particular relevance to the study of distant galaxies. The stellar library is to cover a range in stellar metallicities, effective temperatures and surface gravities appropriate for the stellar population hosted by the galaxy under consideration. Since empirical libraries are composed from spectral observations of stars in the Solar neighborhood, they may lack or cover too sparsely certain regions of parameter space that potentially could contribute significantly to the integrated emission of early galaxies. In order to include very sub- or super-Solar metallicities, or stars caught during short-lived evolutionary phases such as Wolf-Rayet (WR) or thermally-pulsating asymptotic giant branch (TP-AGB) phases, theoretical libraries can be employed instead, even though these are not without flaws themselves, ranging from the treatment of convection to the quality and completeness of atomic and molecular line lists underpinning them. A hybrid approach has been applied as well, in which theoretically motivated differential corrections are applied to empirical spectra to provide a denser and more complete sampling of parameter space, e.g., in metallicity and elemental abundance (Conroy & van Dokkum, 2012). Short-lived evolutionary phases also pose a challenge when pairing stellar libraries with isochrones to construct so-called single (i.e., mono-age) stellar populations. Approaches alternative to the “isochrone synthesis” technique have been explored by, e.g., Maraston (2005) who adopted the fuel consumption theorem in which the amount of hydrogen and/or helium consumed is taken as integration variable, in principle allowing luminous, short-lived evolutionary stages such as TP-AGB stars to be captured more fully. With substantial contributions to the rest-frame near-IR they were argued to significantly impact inferred galaxy stellar ages and masses, particularly at cosmic noon where characteristic stellar population ages match the phase where TP-AGB stars are most prominent (). That said, observational efforts at intermediate (Kriek et al., 2010) and higher spectral resolution (Zibetti et al., 2013) failed to find strong TP-AGB spectral signatures in those galaxies where they ought to be most prominent, potentially explained by (self-produced) dust attenuating the TP-AGB light. An extensive review on the IMF, and evidence for potential deviations from the standard Chabrier (2003) IMF, is presented by Hopkins et al. (2018). Claims of non-universality of the IMF based on observations of distant galaxies themselves (e.g., a top-heavy IMF in order to reconcile number counts of submillimeter galaxies with models (Baugh et al., 2005), or to reconcile a census of the cosmic SFR density and stellar mass assembly history (Wilkins et al., 2008)) are not unambiguous in their interpretation (see, e.g., Safarzadeh et al., 2017, Leja et al., 2019b). More convincing evidence, of a more bottom-heavy IMF in nearby ellipticals with high velocity dispersions, was provided based on three orthogonal lines of inquiry: IR spectroscopy (Conroy & van Dokkum, 2012), dynamical modeling (Cappellari et al., 2013) and gravitational lensing (Treu et al., 2010). While the peak in SFH of these galaxies can be traced back to the cosmic noon era, an application of such IMF variations has yet to find its way into direct look-back studies, with as additional complication that the respective IMF changes may be confined to the central regions of these galaxies (Conroy et al., 2017).
Finally, SFGs are not well represented by single stellar populations, and need to be modeled with extended SFHs. Here, a common approach has originally been to parametrize the SFH by an exponentially declining, so-called model, largely because of its historical roots in SPS modeling of nearby early-type galaxies to which the technique was applied first. Renzini (2009) made the case that rising SFHs may be more appropriate for SFGs at cosmic noon, and hence more flexible functional forms (delayed models, log-normal SFHs, or double power laws) are increasingly being adopted. Offering yet more freedom, Pacifici et al. (2015) adopt a more extensive and physically motivated library of SFHs drawn from a semi-analytical model of galaxy formation, and conclude that a quantification of the normalization, slope and scatter of the stellar mass - SFR relation can be severely biased if both quantities are inferred from a common, oversimplified approach. In the same vein Leja et al. (2019a) advocate the use of more flexible non-parametric (i.e., piecewise constant) star formation histories, and stress the importance of adopting appropriate priors.
Attenuation by dust, present in copious amounts within massive SFGs at cosmic noon, has a dimming and reddening effect on the emerging SED. With the exception of the potential presence of a bump at 2175Å, often attributed to PAH molecules, its wavelength dependence is smooth, but nevertheless leaves a signature that is highly degenerate with variations in stellar age and/or metallicity. Whereas the most common approach is to adopt the Calzetti et al. (2000) reddening law calibrated locally on a sample of starbursting galaxies, in recent years first strides are made to map the attenuation curves at high and their variation as a function of galaxy type directly (e.g., Kriek & Conroy, 2013, Reddy et al., 2015). As an aid in breaking age-metallicity-dust degeneracies, SPS modeling codes increasingly are capable of accounting for far-IR constraints, where available. Any emission absorbed at short wavelengths should contribute to dust heating with associated reprocessed emission at long wavelengths. Several state-of-the-art SPS modeling codes such as MAGPHYS (da Cunha et al., 2015), BEAGLE (Chevallard & Charlot, 2016), Prospector (Leja et al., 2017), and BAGPIPES (Carnall et al., 2018) now incorporate such energy balance arguments as well as Bayesian inference to explore parameter space. If not known spectroscopically, redshifts can be fit for simultaneously by these codes, enabling a self-consistent assessment of the error budget, including covariances.
As a third component besides the SPS and dust models, photoionization codes such as CLOUDY (Ferland et al., 2017) or MAPPINGS (Sutherland & Dopita, 2017) can be employed to superpose on the stellar emission the anticipated nebular lines. This is indispensable for full spectral fitting, but contributions from nebular line emission can also matter (and provided proper modeling even help) at lower spectral resolutions, especially when medium- or narrow-bands are included or for galaxies with high specific SFRs (e.g., van der Wel et al., 2011). Kewley et al. (2019) and Maiolino & Mannucci (2019) present comprehensive overviews of the ingredients to photoionization models and recent advances in their application and calibration to galaxies across cosmic time. The need for redshift-appropriate calibrations was brought to light by the observation of systematic shifts in the characteristic strong rest-optical line ratios captured in excitation diagrams, revealing the evolving ISM conditions (see Section 3.6) as well as the changing shapes of the ionizing radiation field. Topics of current debate in this regard entail, from a modeling perspective, the role attributed to stellar rotation, binary evolution, and stellar mass loss in determining the amount of ionizing photons and their hardness (e.g., Eldridge & Stanway, 2012). SPS codes equipped with grids from photoionization models generally implement this in a self-consistent manner such that line intensities are tied to the metallicity and star formation history of the stellar population, but nevertheless the dimensionality of the problem is typically increased by the introduction of additional free parameters, such as the extra attenuation to HII regions.
Overall, it is well established that stellar mass represents the quantity on which SPS techniques can place the tightest constraints, as its inference requires an assessment of the mass-to-light (M/L) ratio only, to zeroth-order blind to the physical conditions responsible for setting this M/L (i.e., the balance of age, metallicity and dust attenuation). Whereas systematic differences arise depending on the assumptions made, code-by-code comparisons at various levels of control suggest that at least in terms of mass ranking a high degree of consistency is reached (Mobasher et al., 2015). SFRs can be more challenging in the presence of large columns of dust, in which case panchromatic information aids greatly. Star formation histories represent the most challenging inference in the case of SFGs.
Looking ahead, a few avenues can be identified for future progress in this area. First, with the increasing availability (and with the advent of JWST also wavelength coverage) of spatially resolved information, SPS modeling can be applied to SEDs extracted on sub-galactic scales. This has the merit of allowing to trace the stellar build-up in situ, but in addition can mitigate outshining effects. Whereas resolved SED modeling may go at the expense of wavelength coverage and sampling, galaxy-integrated constraints can be imposed (see, e.g., Wuyts et al., 2012). Second, in almost all applications to date a uniform metallicity is adopted for the entire stellar population. In future work, one could envision star formation and chemical enrichment histories to be coupled self-consistently, an approach that several of the aforementioned codes already allow for in principle. Exactly what constitutes a self-consistent treatment is an issue that may not be addressed trivially, as the connection between the two histories is modulated by gaseous in- and outflows, both of which are ubiquitous around cosmic noon. Finally, a full interpretation of galaxy spectra and emission lines would ideally account not only for full SPS but also for radiative transfer. Such full-fledged 3D radiative transfer modeling is to date restricted to a handful of very nearby galaxies for which very high-resolution datasets are available (e.g., De Looze et al., 2014). Much simplified analytical descriptions of absorption and scattering under different geometries such as homogeneous mixtures, (clumpy) foreground screens, and mixtures thereof can be applied via analytical recipes to interpret the distribution of line strengths and ratios resolved on kiloparsec scales within 100s of nearby galaxies (e.g., Li et al., 2019).
Kinematic Measurements and Modeling
To date, kinematics of distant star-forming galaxies come exclusively from observations of emission lines, mostly H or other rest-optical nebular lines, or CO transitions in the submillimeter regime. The best constraints are obtained from integral field unit (IFU) spectroscopy or interferometry, providing simultaneously the full three-dimensional (3D) data, which is the focus in what follows. Galaxy-integrated and slit spectra have been used to derive kinematic properties, and slit spectra were also modeled, following similar approaches as outlined below adapted for that type of data (e.g., Weiner et al., 2006, Price et al., 2016).
The data are usually interpreted in the framework of axisymmetric rotating disks motivated by the observations (Section 4 of the main article) where physical quantities of interest include for instance the intrinsic peak rotation velocity and local velocity dispersion 101010 For an exponential model, the maximum velocity is reached at a radius , where is the disk scale length and the effective radius enclosing half the light, in which case measuring a at is the same as . The choice between and depends on the goal of the analysis. Deviations from an exponential distribution change the (Binney & Tremaine, 2008), such that measuring the maximum is ideally done from the velocity curve rather than at fixed radius. The quantity refers to the velocity dispersion across the galaxy as a measure of “turbulence,” which, in the case of a disk and isotropic dispersion, is related to its geometrical thickness. It is to be distinguished from the total velocity dispersion measured from the line width in source-integrated spectra (which includes line broadening from galaxy-wide velocity gradients) and from the central velocity dispersion commonly employed in the analysis of early-type systems (which would be strongly dominated by beam-smearing of the steep inner velocity gradient for a disk). To minimize line broadening caused by inner disk velocity gradients, is best measured away from the central regions. In data of high- galaxies, may also include contributions by noncircular motions on scales below the resolution element ( depending on data set). , and the total dynamical mass of the system . Various approaches are followed, ranging from simple determinations based on the observed maximum velocity difference and line widths measured directly from the data or estimated by adjusting a parametric representation of the velocity curve and dispersion profile (e.g., computed for an exponential distribution, or approximated by an arctan function) to full forward modeling of the data. The simpler methods use one-dimensional (1D) major-axis profiles or 2D maps extracted from the data cubes. The flux, velocity, and dispersion are usually obtained by fitting the observed line emission with a single Gaussian, which was shown to be adequate for the typical resolved scales and S/N levels of high- galaxy data (Förster Schreiber et al., 2018, Tiley et al., 2019). Deviations from a single Gaussian may become appreciable in galaxy-integrated spectra depending, for instance, on the spatial distribution of the tracer emission line, the local intrinsic gas velocity dispersion, and the possible presence of strong galactic-scale winds; these effects should be taken into account in estimating rotation velocities from galaxy-integrated line widths (e.g., de Blok & Walter, 2014, Wisnioski et al., 2018). Spatial beam smearing, instrumental spectral resolution, and galaxy inclination are treated explicitly by rescaling of the observed maximum velocity and local dispersion through functions or lookup tables based on mock beam-smeared rotating disk models parametrized in terms of and galaxy properties (such as mass and inclination for ), by subtracting in quadrature the instrumental broadening from the measured dispersion, and by dividing the projected velocity by derived from the morphology (e.g., Burkert et al., 2016, Johnson et al., 2018). Studies applying forward modeling perform fits of 1D profiles, 2D maps, or 3D cubes. The effects of resolution and inclination are treated implicitly by convolving the intrinsic, inclined 3D model with a kernel representing the point and line spread functions (PSF and LSF; e.g., Cresci et al., 2009, di Teodoro & Fraternali, 2015).
Kinematic modeling codes developed specifically for application to observations at high redshift have become increasingly sophisticated in recent years to allow more flexibility in model assumptions, more efficient parameter space exploration, and better quantification of uncertainties of the best-fit values accounting for covariances. Examples include the DYSMAL code (e.g., Davies et al., 2011, with recent updates described by Wuyts et al. 2016, Übler et al. 2018, Genzel et al. 2020), GalPaK3D (Bouché et al., 2015), and 3DBAROLO (di Teodoro & Fraternali, 2015), all based on axisymmetric models but differing in ingredients and dimensional space in which fits are performed. The most recent version of DYSMAL allows to fit multiple mass components, such as a disk and a bulge, with relative mass ratios specified and parametrized as Sérsic profiles; the code self-consistently accounts for finite thickness (turbulent disk, flattened rotatin bulge) based on Noordermeer (2008). The baryonic component(s) can be embedded in a dark matter halo with a choice of profile parametrizations (e.g., “NFW,” Navarro et al. 1996; double power-law; cored Burkert 1995 profile). The line-of-sight velocity distribution is computed from the total mass model and relative weights can be applied to the light of different components. DYSMAL is optimized to fit in 1D or 2D although 3D fitting also is possible. is designed to fit simultaneously structural and kinematic parameters directly in 3D data cubes, assuming a light/mass component among several choices (e.g., exponential, Gaussian, and de Vaucouleurs profiles), different parametrizations of the velocity profile (e.g., arctan, inverted exponential, hyperbolic, or computed from the 3D mass model). Both DYSMAL and employ Markov chain Monte Carlo (MCMC) algorithms in a Bayesian framework to derive the best-fit parameters and uncertainties thereof. 3DBAROLO fits tilted ring models to 3D data, where each concentric ring is parametrized independently and is randomly populated with line emitting clouds in six dimensions (three in each of spatial and velocity space), from which line profiles are built and projected into the model cube. This method can more naturally account for possible variations in orbits with radius, such as warps. The code uses a multidimensional downhill simplex solver for the minimization of non-analytic models, with uncertainties estimated via a Monte Carlo method.
In principle, fitting in 3D space offers a number of advantages as it avoids the necessary loss of information in extracting the projected 2D maps or 1D profile from both data and model. In practice, the success of the fits can be hampered by low S/N and irregular or clumpy light distributions. For axisymmetric mass distributions, most of the information is encoded along the line of nodes, such that the parameters can be well determined from 1D fits; for sufficiently high S/N and well resolved galaxies, 2D maps can constrain more accurately the inclination. Especially at high redshift, the morphology in line emission can be quite different from the underlying mass distribution and cannot be captured by simple representations, let alone in 3D (which ideally would best account for projection and light weighting effects); in such cases, fits are best performed only in velocity and dispersion. Despite the flexibility afforded by the above models, the observations may not allow to constrain well all possible parameters but the implementation of Bayesian analysis and MCMC algorithms have brought a major improvement over previous modeling by allowing for priors and propagation of uncertainties including covariances rather than simply fixing values.
The residuals between observed data and best-fit kinematic model can be used in implementing the kinematic classification scheme discussed in Section 4.3. An alternative classification method relies on kinemetry, introduced by Krajnović et al. (2006) to analyze data of nearby early-type galaxies and adapted for applications to IFU studies of distant SFGs by Shapiro et al. (2008). Kinemetry is a generalization of surface photometry to the higher-order moments of the line-of-sight distribution, where the degree of (a)symmetry in the velocity field and dispersion map along best-fit ellipses is quantified through harmonic expansions. The exact values of the parameters will depend on the resolution and S/N regime of the data, such that the boundaries to distinguish between disks and mergers need to be appropriately calibrated for the data sets under analysis.
References
- Aihara et al. (2018) Aihara H, Armstrong R, Bickerton S, et al. 2018. PASJ, 70:S8
- Atek et al. (2010) Atek H, Malkan M, McCarthy P, et al. 2010. ApJ, 723:104-15
- Barger et al. (2008) Barger AJ, Cowie LL, Wang W-H. 2008. ApJ, 689:687–708
- Baugh et al. (2005) Baugh CM, Lacey CG, Frenk CS, et al. 2005. MNRAS, 356:1191–1200
- Binney & Tremaine (2008) Binney J, Tremaine S. 2008. Galactic Dynamics (2nd ed.; Princeton, NJ: Princeton Univ. Press)
- Bouché et al. (2015) Bouché N, Carfantan H, Schroetter I, Michel-Dansac L, Contini T. 2015. AJ, 150:92
- Burkert (1995) Burkert A. 1995. ApJ, 447:L25–8
- Burkert et al. (2016) Burkert A, Förster Schreiber NM, Genzel R, et al. 2016. ApJ, 826:214
- Calzetti et al. (2000) Calzetti D, Armus L, Bohlin RC, et al. 2000. ApJ, 533:682–95
- Cappellari et al. (2013) Cappellari M, McDermid RM, Alatalo K, et al. 2013. MNRAS, 432:1862–93
- Cardamone et al. (2010) Cardamone CN, van Dokkum PG, Urry CM, et al. 2010. ApJS, 189:270–85
- Carnall et al. (2018) Carnall AC, McLure RJ, Dunlop JS, Davé R. 2018 MNRAS, 480:4379–401
- Chabrier (2003) Chabrier G. 2003 PASP, 115, 763–95
- Chevallard & Charlot (2016) Chevallard J, Charlot S. 2016. MNRAS, 462:1415–43
- Colbert et al. (2013) Colbert JW, Teplitz H, Atek H, et al. 2013. ApJ, 779:34
- Conroy & van Dokkum (2012) Conroy C, van Dokkum PG. 2012. ApJ, 760:71–87
- Conroy (2013) Conroy C. 2013. ARA&A, 51:393–455
- Conroy et al. (2017) Conroy C, van Dokkum PG, Villaume A. 2017. ApJ, 837:166
- Contini et al. (2012) Contini T, Garilli B, Le Fèvre O, et al. 2012. A&A, 539:A91
- Cooper et al. (2012) Cooper MC, Griffith RL, Newman JA, et al. 2012. MNRAS, 419:3018–27
- Cresci et al. (2009) Cresci C, Hicks EKS, Genzel R, et al. 2009. ApJ, 697:115–32
- Curti et al. (2020) Curti M, Maiolino R, Cirasuolo M, et al. 2020. MNRAS, 492:821–42
- da Cunha et al. (2015) da Cunha E, Walter F, Smail IR, et al. 2015. ApJ, 806:110
- Davies et al. (2011) Davies RI, Förster Schreiber NM, Cresci G, et al. 2011. ApJ, 741:69
- Davies et al. (2019) Davies RL, Förster Schreiber NM, Üebler H, et al. 2019 ApJ, 873, 122
- Davis et al. (2007) Davis M, Guhathakurta P, Konidaris NP, et al. 2007. ApJ, 660:L1–6
- de Blok & Walter (2014) de Blok WJG, Walter F. 2014. AJ, 147:96
- De Looze et al. (2014) De Looze I, Fritz J, Baes M, et al. 2014. A&A, 571:69
- di Teodoro & Fraternali (2015) Di Teodoro EM, Fraternali F. 2015. MNRAS, 451:3021–33
- Eldridge & Stanway (2012) Eldridge JJ, Stanway ER. 2012. MNRAS, 419:479–89
- Épinat et al. (2012) Épinat B, Tasca L, Amram P, et al. 2012. A&A, 539:A92
- Ferland et al. (2017) Ferland GJ, Chatzikos M, Guzmán F, et al. 2017. Revista Mexicana de Astronomía y Astrofísica, 53:385
- Förster Schreiber et al. (2009) Förster Schreiber NM, Genzel R, Bouché N, et al. 2009. ApJ, 706:1364–428
- Förster Schreiber et al. (2018) Förster Schreiber NM, Renzini A, Mancini C, et al. 2018. ApJS, 238:21
- Genzel et al. (2020) Genzel R, Price SH, Übler H, et al. 2020. ApJ, submitted (arXiv:2006.03046)
- Gillman et al. (2019) Gillman S, Swinbank AM, Tiley AL, et al. 2019. MNRAS, 486:175–94
- Gillman et al. (2020) Gillman S, Tiley AL, Swinbank AM, et al. 2020. MNRAS, 492:1492–512
- Girard et al. (2018) Girard M, Dessauges-Zavadsky M, Schaerer D, et al. 2018. A&A, 613:A72
- Girard et al. (2020) Girard M, et al. 2020. MNRAS, submitted
- Grogin et al. (2011) Grogin NA, Kocevski DD, Faber SM, et al. 2011. ApJS, 197:35
- Harrison et al. (2016) Harrison CM, Alexander DM, Mullaney JR, et al. 2016. MNRAS, 456:1195–220
- Harrison et al. (2017) Harrison CM, Johnson HL, Swinbank AM, et al. 2017. MNRAS, 467:1965–83
- Hopkins et al. (2018) Hopkins AM. 2018. PASA, 35:39
- Johnson et al. (2018) Johnson AL, Harrison CM, Swinbank AM, et al. 2018. MNRAS, 474:5076–104
- Jones et al. (2010) Jones TA, Swinbank AM, Ellis RS, Richard J, Stark DP. 2010. MNRAS, 404:1247–62
- Jones et al. (2013) Jones TA, Ellis RS, Richard J, Jullo E. 2013. ApJ, 765:48
- Kashino et al. (2019) Kashino D, Silverman JD, Sanders D, et al. 2019. ApJS, 241:10
- Kewley et al. (2019) Kewley LJ, Nicholls DC, Sutherland RS. 2019. ARA&A, 57:511–70
- Koekemoer et al. (2011) Koekemoer AM, Faber SM, Ferguson HC, et al. 2011. ApJS, 197:36
- Krajnović et al. (2006) Krajnović D, Capellari M, de Zeeuw PT, Copin Y. 2006. MNRAS, 366:787–802
- Kriek et al. (2010) Kriek M, Labbé I, Conroy C, et al. 2010. ApJ, 722:64
- Kriek & Conroy (2013) Kriek M, Conroy C. 2013. ApJ, 775:16
- Kriek et al. (2015) Kriek M, Shapley AE, Reddy NA, et al. 2015. ApJS, 218:15
- Laigle et al. (2016) Laigle C, McCracken HJ, Ilbert O, et al. 2016. ApJS, 224:24
- Law et al. (2009) Law DR, Steidel CC, Erb DK, et al. 2009 ApJ, 697:2057–82
- Law et al. (2012) Law DR, Shapley AE, Steidel CC, et al. 2012 Nature, 487:338–40
- Leethochawalit et al. (2016) Leethochawalit N, Jones TA, Ellis RS, et al. 2016. ApJ, 820:84
- Le Fèvre et al. (2013) Le Fèvre O, Cassata P, Cucciati O, et al. 2013. A&A, 559:A14
- Le Fèvre et al. (2015) Le Fèvre O, Tasca LAM, Cassata P, et al. 2015. A&A, 576:A79
- Leja et al. (2017) Leja J, Johnson BD, Conroy C, van Dokkum PG, Byler N. 2017. ApJ, 837:170
- Leja et al. (2019a) Leja J, Carnall AC, Johnson BD, et al. 2019a. ApJ, 876:3
- Leja et al. (2019b) Leja J, Johnson BD, Conroy C, et al. 2019b. ApJ, 877:140
- Li et al. (2019) Li H, Wuyts S, Hao L, et al. 2019. ApJ, 872:63
- Lilly et al. (2009) Lilly SJ, Le Brun V, Maier C, et al. 2009. ApJS, 184:218–29
- Livermore et al. (2015) Livermore RC, Jones TA, Richard J, et al. 2015. MNRAS, 450:1812–35
- Lotz et al. (2017) Lotz JM, Koekemoer A, Coe D, et al. 2017. AJ, 837:97
- Maiolino & Mannucci (2019) Maiolino R, Mannucci F. 2019. A&AReview, 27:3
- Mancini et al. (2011) Mancini C, Förster Schreiber NM, Renzini A, et al. 2011. ApJ, 743:86
- Maraston (2005) Maraston C. 2005. MNRAS, 362:799–828
- Mason et al. (2017) Mason CA, Treu T, Fontana A, et al. 2017. ApJ, 838:14
- McLure et al. (2018) McLure RJ, Pentericci L, Cimatti A, et al. 2018. MNRAS, 479:25–42
- Mieda et al. (2016) Mieda E, Wright SA, Larkin JE, et al. 2016. ApJ, 831:78
- Mobasher et al. (2015) Mobasher B, Dahlen T, Ferguson HC, et al. 2015. ApJ, 808:101
- Momcheva et al. (2016) Momcheva IG, Brammer GB, van Dokkum PG, et al. 2016. ApJS, 225:27
- Nanayakkara et al. (2016) Nanayakkara T, Glazebrook K, Kacprzak GG, et al. 2016. ApJ, 828:21
- Navarro et al. (1996) Navarro JF, Frenk CS, White SDM. 1996. ApJ, 462:563–75
- Noordermeer (2008) Noordermeer E. 2008. MNRAS, 385:1359–64
- Newman et al. (2013) Newman JA, Cooper MC, Davis M, et al. 2013. ApJS, 208:5
- Okada et al. (2016) Okada H, Totani T, Tonegawa M, et al. 2016. PASJ, 68:47
- Pacifici et al. (2015) Pacifici C, da Cunha E, Charlot S, et al. 2015. MNRAS, 447:786–805
- Pentericci et al. (2018) Pentericci L, McLure RJ, Garilli B, et al. 2018. A&A, 616:A174
- Price et al. (2016) Price SH, Kriek M, Shapley AE, et al. 2016 ApJ, 819:80
- Reddy et al. (2015) Reddy NA, Kriek M, Shapley AE, et al. 2015. ApJ, 806, 259
- Renzini (2009) Renzini A. 2009. MNRAS, 398:58–62
- Safarzadeh et al. (2017) Safarzadeh M, Lu Y, Hayward CC. 2017. MNRAS, 472:2462–67
- Scholtz et al. (2020) Scholtz J, Harrison CM, Rosario DJ, et al. 2020. MNRAS, 492:3194–3216
- Scoville et al. (2007a) Scoville NZ, Aussel H, Brusa M, et al. 2007. ApJS, 172:1–8
- Shapiro et al. (2008) Shapiro KL, Genzel R, Förster Schreiber, et al. 2008. ApJ, 682:231–51
- Shipley et al. (2018) Shipley HV, Lange-Vagle D, Marchesini D, et al. 2018. ApJS, 235:14
- Steidel et al. (2003) Steidel CC, Adelberger KL, Shapley AE, et al. 2003. ApJ, 592:728–54
- Steidel et al. (2004) Steidel CC, Shapley AE, Pettini M, et al. 2004. ApJ, 604:534–50
- Steidel et al. (2014) Steidel CC, Rudie GC, Strom AL, et al. 2014. ApJ, 795:165
- Stott et al. (2016) Stott JP, Swinbank AM, Johnson HL, et al. 2016. MNRAS, 457:1888–904
- Straatman et al. (2016) Straatman CMS, Spitler LR, Quadri RF, et al. 2016. ApJ, 830:51
- Strom et al. (2017) Strom AL, Steidel CC, Rudie GC et al. 2017. ApJ, 836:164
- Sutherland & Dopita (2017) Sutherland RS, Dopita MA. 2017. ApJS, 229:34
- Tasca et al. (2017) Tasca LAM, Le Fèvre O, Ribeiro B, et al. 2017. A&A, 600:A110
- Tiley et al. (2019) Tiley AL, Swinbank AM, Harrison CM, et al. 2019. MNRAS, 485:934–60
- Tonegawa et al. (2015) Tonegawa M, Totani T, Okada H, et al. 2015 PASJ, 67:81
- Treu et al. (2010) Treu T, Auger MW, Koopmans LVE, et al. 2010. ApJ, 709:1195
- Treu et al. (2015) Treu T, Schmidt KB, Brammer GB, et al. 2015. ApJ, 812:114
- Troncoso et al. (2014) Troncoso P, Maiolino R, Sommariva V, et al. 2014. A&A, 563:A58
- Turner et al. (2017) Turner OJ, Cirasuolo M, Harrison CM, et al. 2017 MNRAS, 471, 1280–320
- Übler et al. (2018) Übler H, Genzel R, Tacconi LJ, et al. 2018. ApJ, 854:L24
- van der Wel et al. (2011) van der Wel A, Straughn AN, Rix, HW, et al. 2011. ApJ, 742:111
- Weiner et al. (2006) Weiner BJ, Willmer CNA, Faber SM, et al. 2006. ApJ, 653:1027–48
- Whitaker et al. (2011) Whitaker KE, Labbé I, van Dokkum PG, et al. 2011. ApJ, 735:86
- Wilkins et al. (2008) Wilkins SM, Hopkins AM, Trentham N, Tojeiro R. 2008. MNRAS, 391:363–68
- Wirth et al. (2015) Wirth GD, Trump JR, Barro G, et al. 2015. AJ, 150:153
- Wisnioski et al. (2011) Wisnioski E, Glazebrook K, Blake C, et al. 2011. MNRAS, 417:2061–23
- Wisnioski et al. (2015) Wisnioski E, Förster Schreiber NM, Wuyts S, et al. 2015. ApJ, 799:209
- Wisnioski et al. (2018) Wisnioski E, Mendel JT, Förster Schreiber NM, et al. 2018. ApJ, 855:97
- Wisnioski et al. (2019) Wisnioski E, Förster Schreiber NM, Fossati M, et al. 2019. ApJ, 886:124
- Wright et al. (2019) Wright AH, Hildebrandt H, Kuijken K, et al. 2019. A&A, 632:A34
- Wright et al. (2009) Wright SA, Larkin JE, Law DR, et al. 2009. ApJ, 699:421–440
- Wuyts et al. (2014) Wuyts E, Rigby JR, Gladders MD, Sharon K. 2014. ApJ, 781:61
- Wuyts et al. (2012) Wuyts S, Förster Schreiber NM, Genzel R, et al. 2012. ApJ, 753:114
- Wuyts et al. (2016) Wuyts S, Förster Schreiber NM, Wisnioski E, et al. 2016. ApJ, 831:149
- Yuan et al. (2011) Yuan T.-T., Kewley LJ, Swinbank AM, Richard J, Livermore RC. 2011. ApJ, 732:L14
- Yuan et al. (2012) Yuan T.-T., Kewley LJ, Swinbank AM, Richard J. 2012. ApJ, 759:66
- Zibetti et al. (2013) Zibetti S, Gallazzi A, Charlot S, Pierini D, Pasquali A. 2013. MNRAS, 428:1479–97