How Did That Get In My Phone?
Unwanted App Distribution on Android Devices
Abstract
Android is the most popular operating system with billions of active devices. Unfortunately, its popularity and openness makes it attractive for unwanted apps, i.e., malware and potentially unwanted programs (PUP). In Android, app installations typically happen via the official and alternative markets, but also via other smaller and less understood alternative distribution vectors such as Web downloads, pay-per-install (PPI) services, backup restoration, bloatware, and IM tools. This work performs a thorough investigation on unwanted app distribution by quantifying and comparing distribution through different vectors. At the core of our measurements are reputation logs of a large security vendor, which include 7.9M apps observed in 12M devices between June and September 2019. As a first step, we measure that between 10% and 24% of users devices encounter at least one unwanted app, and compare the prevalence of malware and PUP. An analysis of the who-installs-who relationships between installers and child apps reveals that the Play market is the main app distribution vector, responsible for 87% of all installs and 67% of unwanted app installs, but it also has the best defenses against unwanted apps. Alternative markets distribute instead 5.7% of all apps, but over 10% of unwanted apps. Bloatware is also a significant unwanted app distribution vector with 6% of those installs. And, backup restoration is an unintentional distribution vector that may even allow unwanted apps to survive users’ phone replacement. We estimate unwanted app distribution via PPI to be smaller than on Windows. Finally, we observe that Web downloads are rare, but provide a riskier proposition even compared to alternative markets.
I Introduction
Android has become the most popular operating system with over 2.5 billion active devices [43] and 75% of the mobile device market share [40]. A major reason behind Android’s success is its open environment that allows affordable access to new app developers, app distribution through the official Play market and alternative sources, and OS customization by vendors and mobile network operators. Unfortunately, popularity and openness comes with a cost. Abusive developers also have easy access to the ecosystem allowing them to distribute their unwanted apps to a large number of users [6]. We use unwanted apps to jointly refer to malware (e.g., ransomware, banking trojans) and potentially unwanted programs (PUP) (e.g., adware, rogueware). AV vendors keep reporting ever-increasing numbers of unwanted app detections and collected unwanted app samples [7, 12, 9].
By default, Android only installs apps from the official Play market, but the user can optionally enable installations from other (unknown) sources. Among those, alternative markets are popular especially in countries like China where Google services such as the Play market are restricted [53, 77]. Since app markets are popular and open to any user, prior work has focused on analyzing them [83, 53, 15, 72, 77]. However, the security community lacks a global understanding about how Android unwanted apps are distributed. While apps are largely distributed through markets, other smaller alternative distribution vectors such as Web downloads, pay-per-install (PPI) services, bloatware, backup restoration, and even instant messaging (IM) should not be ignored. We close this gap in the existing research by investigating how unwanted apps get distributed into user devices through different distribution vectors. We expect our findings to drive future defenses that protect users when installing apps from lesser-known distribution vectors such as backup restoration and bloatware, which are still responsible for a significant fraction of unwanted app installs. We also expect our findings to motivate further research on protecting the Play market, which despite its defenses, remains by far the largest unwanted app distribution vector.
At the core of our measurements are reputation logs that, over the four-month period between June and September 2019, capture the presence in 12M Android devices of 7.9M apps (34M APKs) and the who-installs-who relationship between apps. Such internal view of what is installed on user devices, and how it arrived, allows us to answer open questions such as what fraction of apps are installed through different distribution vectors, which distribution vectors install more unwanted apps, which apps in the same distribution vector (e.g., different markets or browsers) are riskier compared to each other, and what is the prevalence of unwanted app encounters by users.
Prior works have also leveraged a view of apps installed in real user devices. A recent study analyzed the presence of pre-installed apps in 2.7K Android devices [33]. In contrast, we examine the distribution of unwanted apps by pre-installed bloatware, and compare it with other distribution vectors. Furthermore, our device dataset is three orders of magnitude larger and contains longitudinal logs over a four-month period. Another recent work detects stalking apps by analyzing 50M Android devices during 2017–2019 [61]. In comparison, our analysis is performed on a smaller set of devices in a four-month-period. However, our analysis does not focus on one type of threat, but rather covers a large variety of unwanted apps distributed through various vectors. Shen et al. [67] compared rooted and unrooted devices, measuring the prevalence of five malware classes on 6M Android devices during April 2015. We also measure prevalence, finding, albeit on a four month period and including all malware and PUP classes, significantly higher prevalence.
As a prerequisite to analyze unwanted app distribution, we first identify unwanted apps in the dataset. We use the common practice to collect AV detection labels using the VirusTotal (VT) online service [75] and consider unwanted any APK flagged by at least a threshold number of AV engines [84]. Using those unwanted APKs we measure the number of devices that encountered at least one unwanted app over the four month analysis period. We measure an unwanted app prevalence of 10%–24%, depending on the selected VT threshold. This range is very conservative as it considers benign all APKs not queried to VT or not found in VT. Compared to previous studies on Windows malware prevalence on consumer and enterprise hosts [79, 46, 45], this shows that, despite many security improvements provided by the Android ecosystem, the security posture of Android devices with respect to unwanted apps is not better than that of Windows hosts. We also compare the prevalence of malware and PUP finding that the prevalence of both categories is almost identical, although we identify significantly more PUP samples on the devices.
Then, we examine the who-installs-who relationships between installers and the child apps they install. To compare distribution vectors we classify the installer apps into 12 categories: the official Play market, alternative markets, browsers, commercial PPI, backup and restore, IM, theme stores, file managers, file sharing apps, bloatware, mobile device management (MDM), and package installers. To compare distribution vectors we compute their vector detection ratio (VDR), i.e., the ratio of unwanted apps installed through that vector over all apps installed through that vector. Below we list our most significant findings on unwanted app distribution:
-
•
The Play market is the main app distribution vector responsible for 87% of all installs and 67% of unwanted installs. However, its VDR is only 0.6%, better than all other large distribution vectors. Thus, the Play market defenses against unwanted apps work, but still significant amounts of unwanted apps are able to bypass them, making it the main distribution vector for unwanted apps.
-
•
Among the remaining installs, alternative markets are the largest, being responsible for 5.7% of all installs and 10.4% of unwanted installs. However, on average they are five times riskier (3.2% VDR) than the Play market (0.6%). Download risk highly varies among alternative markets. Some like Amazon’s and Vivo’s are almost as safe as the Play market, but users of other top alternative markets have up to 19 times higher probability of encountering an unwanted app.
-
•
Backup restoration is an unintended unwanted app distribution vector responsible for 4.8% of unwanted installs. Cloning of apps during phone replacement can facilitate unwanted apps to survive phone changes by the user.
-
•
Bloatware is another surprisingly high distribution vector, responsible for 6% of unwanted installs. This is likely due to ad-based monetization by device vendors and carriers of the devices they sell. Bloatware installers are often privileged, making their removal by security tools and users challenging.
-
•
App downloads from the Web are rare (<0.1% installs), but have significantly higher risk (3.8% VDR) than downloads from markets, even alternative ones (3.2%).
-
•
We provide a very conservative lower bound on commercial PPI service distribution of 0.2% of all installs and 0.1% of unwanted installs and observe that such services seem to have improved their filtering of abusive advertisers compared to their Windows counterparts. We also estimate that all PPI activity may be responsible for up to 4% of the unwanted app installs. That upper bound is still significantly lower than the estimate of Windows commercial PPI services being responsible for over a quarter of PUP installs [45].
II Background
Android apps are distributed as Android application packages (APKs), which are compressed files that contain the app’s code (e.g., DEX files and ELF libraries), a manifest file, certificates, resources, and other assets. The manifest file contains a package name commonly used to identify the app. The developer is free to choose the package name and collisions are possible between apps from different developers. However, some markets, including the official Play market, use the package name as a unique app identifier and therefore do not accept two apps with the same package name. For this reason, benign developers avoid reusing existing package names. On the other hand, unwanted apps may impersonate benign apps by selecting the same package name as an app in the Play market, and distributing the impersonating app through alternative markets (e.g., [83, 26]).
II-A App Signing
APKs are digitally signed using a private key and they include the signature and a certificate chain for the corresponding public key, which the Android framework uses during installation to validate that the APK has not been modified. In practice, the vast majority of APKs contain only a single self-signed certificate. An installed app can only be updated by another APK with the same package name and only if the new version is signed with the same private key and has the same certificate as the old version. To prevent unwanted app developers from surreptitiously updating the benign apps with their own versions, it is strictly necessary that developers keep their private keys confidential. We use the term signer to refer to the entity that owns the private key that signs an APK. We identify the APK’s signer by either the SHA1 hash of the certificate or by the SHA256 hash of the certificate’s public key. Both identifiers are essentially equivalent since in an update the Android framework checks that the hash of the certificates is the same, providing no incentive to reuse public keys across certificates [21].
Fake apps may impersonate benign apps by using the same package name as the benign app and distributing the fake app through alternative distribution vectors. Impersonation allows the fake app to inherit the positive reputation of the benign app. Fake apps often correspond to repackaged versions of the benign app with some possibly malicious modifications (e.g., [83, 81, 26, 25]). Unless the attacker compromises the private key of the app being impersonated, the fake app will be signed with a different private key, and have a different certificate. To identify such impersonations and distinguish the original app from the impersonating app, we track apps in our data using both their package name and signer.
Platform keys.
Building an Android OS distribution requires the publisher to provide four pairs of public/private keys: platform, test, shared, media. Among these, the platform key is used to sign the core Android platform packages. APKs signed with a platform key can use System and SignatureOrSystem permissions [32]. Each device vendor will have at least one platform key to build its Android images. Some vendors may use different platform keys for different devices. The Android Open Source Project (AOSP) repository contains default platform, test, share, and media key pairs, and their corresponding certificates. The default AOSP private keys are used to sign Android OS debugging builds, and should be avoided when building production releases since the private keys are not really private. Signing an APK with an AOSP key is a well known security issue since any other app also using the AOSP certificate can update those apps.
II-B App Installation
This work analyzes the who-installs-who relationships among apps. In particular, we examine installations where a parent app installs a child app. When parent and child are the same app, we call it an app update, otherwise we call the parent app an installer and the event an install. When installing a new app, the Android framework stores the package name of the installer, which can then be accessed using method PackageInstaller.getInstallerPackageName111Added in API level 5 (October 2009). Replaced in API level 30 (February 2020) by three methods from the InstallSourceInfo class: getInitiatingPackageName, getInstallingPackageName, getOriginatingPackageName [18].. The installer package is only updated if the app is re-installed from a different source. The installer package may be null if the installer is unknown, e.g., when the APK was pre-installed.
Since Android API level 26 (August 2017), a user-level app that wants to install another app should declare the REQUEST_INSTALL_PACKAGES permission. In addition, if the installer is not a trusted source (i.e., not a first party market such as the Play market or the device manufacturer market), it needs to hold the install from unknown sources permission222Prior to API level 26 (August 2017), install from unknown sources was a system-wide configuration., which has to be explicitly granted by the user to the installer [27]. Even if the installer is authorized to install from unknown sources, the user is prompted to authorize the install. To perform installs that do not require user consent, i.e., silent installs, the installer must hold the system-level INSTALL_PACKAGES permission, which is only granted to apps signed by the platform key and privileged apps explicitly granted that permission [13].
Uninstallation.
Removing a user-level app prompts the user to accept the uninstallation. Silent uninstallations require the uninstaller to hold the system-level DELETE_PACKAGES permission and run in Device or Profile Owner modes [17]. Given these requirements, AV engines prompt the user to uninstall detected unwanted apps. Furthermore, system apps (i.e., installed under the read-only /system/ directory) cannot be uninstalled, only disabled, unless the device is rooted.
II-C Unwanted Apps, Malware, PUP
Malware is any software that intentionally causes harm to computer systems, networks, and their users. Some examples of malware classes are ransomware, banking trojans, and backdoors. In contrast, potentially unwanted programs (PUP) [50], also known as grayware [54, 16], potentially unwanted applications (PUA) [20, 52], or unwanted software [37], are software that, while not outright malicious (i.e., not malware) still may negatively impact computer systems, networks, and their users, e.g., in terms of privacy, performance, or user experience. PUP includes software that performs abusive advertising (adware), that does not implement the claimed functionality (e.g., rogueware), and tools that some users may want to install, but can also be abused (e.g., rooting tools). But, the boundary between malware and PUP is blurry and often differs between security vendors [50, 54, 20, 52, 37]. Some classes like spyware (i.e., software the leaks user data) are sometimes considered malware and others PUP.
Regardless of such differences, which are beyond the scope of this paper and deserve future work, AV engines alert users about the presence of both malware and PUP in their protected devices, although PUP treatment may be more lightweight. For example, mobile AV engines may display more stern and frequent notifications to ask the user to uninstall malware compared to PUP notifications, and may even allow the user to disable PUP notifications.
Currently, the security community lacks a term to jointly refer to malware and PUP. Calling both categories malware raises complaints that PUP is not necessarily malicious. On the other hand, malware is clearly unwanted. In this work, we use unwanted apps to jointly refer to Android malware and PUP, and separate both categories when needed, e.g., in our prevalence estimations.
| Dataset | Data | Full | Subset |
|---|---|---|---|
| Reputation Logs | Devices | 12.2 M | |
| Countries | 243 | ||
| APKs | 34.6 M | ||
| Packages | 7.9 M | ||
| Signers | 4.1 M | ||
| Unique events | 2.3 B | ||
| Install events | 1.7 B | 412.6 M | |
| Installer packages | 5.4 K | 4.2 K | |
| Child packages | 2.8 M | 1.6 M | |
| VirusTotal | Reports | 4.6 M |
III Datasets
This section details the datasets that lie at the core of our study. We use two main datasets summarized in Table I. Reputation logs from the security vendor contain information about apps installed on 12M Android devices, as well as parent-child install relationships among them. We query VirusTotal (VT) to obtain AV labels for unwanted app classification and APK metadata such as permissions and certificate info.
Reputation logs.
These logs capture metadata about the presence of apps in 12M Android devices. The dataset does not include the actual apps, but only their metadata. These logs are collected from real devices in use by customers of the security vendor. The customers opted-in to sharing their data and the devices are anonymized to preserve the privacy of the customers. The dataset covers four months that span from June 1st, 2019 to September 30th, 2019.
| # | Country | Devices |
|---|---|---|
| 1 | United States | 20.7% |
| 2 | India | 17.7% |
| 3 | Japan | 15.3% |
| 4 | Germany | 7.1% |
| 5 | United Kingdom | 5.3% |
| 6 | Brazil | 3.3% |
| 7 | Canada | 2.6% |
| 8 | Australia | 2.5% |
| 9 | France | 2.3% |
| 10 | Netherlands | 2.1% |
| 11 | Italy | 1.9% |
| 12 | Spain | 1.6% |
| 13 | Poland | 1.3% |
| 14 | Belgium | 1.0% |
| 15 | Russia | 0.9% |
| Vendor | Devices |
|---|---|
| Samsung | 40.5% |
| Xiaomi | 8.6% |
| Motorola | 7.0% |
| LYF | 4.9% |
| Huawei | 4.6% |
| Sony | 4.6% |
| LGE | 4.3% |
| Lenovo | 4.3% |
| Sharp | 2.6% |
| Asus | 1.9% |
| Fujitsu | 1.8% |
| HMD Global | 1.3% |
| OnePlus | 1.1% |
| Oppo | 1.1% |
| 1.0% |
The dataset contains devices in 243 country codes [3]. thus covering nearly all countries in the world, save a few exceptions like North Korea. The top 15 countries by number of devices are shown in Table III. These 15 countries cover 89% of the devices, but the distribution is long-tailed. The dataset is skewed towards North America, Europe, and Japan where the security vendor has a larger market share. Of the 20 largest countries by population we see that China, Indonesia, Pakistan, Nigeria, and Bangladesh are underrepresented, but we still have tens of thousands of devices in China and several thousands in the rest.
The dataset includes devices from over 3K device vendors. Table III shows the top 15 vendors by devices in the dataset. Samsung is the dominant device vendor with over 40% of the devices, followed by Xiaomi (8.6%) and Motorola (7.0%). Again, the distribution is long-tailed with only 14 vendors having more than 1% of the devices.
Each device in the dataset regularly queries a cloud-based reputation system to obtain the reputation for the APKs installed in the device. The query includes file metadata such as APK hash, APK package name, the signer key (i.e., the SHA256 of the public key in the APK’s certificate), and optionally the name of the parent package that installed the APK. The response includes a reputation score, which is one of the inputs, but not the only one, used by the security vendor’s AV engine to make a determination about an APK. Since the reputation score is proprietary, we avoid using it to make our approach replicable. We only use it to select samples with low reputation to query to VirusTotal.
The AV client may query the same APK at different times. To remove duplicated events, for each unique tuple of an anonymized device identifier, APK’s SHA256 hash, APK’s package name, APK’s signer key, and APK’s parent package name (potentially null), we obtain the earliest date when the tuple was queried to the reputation system. The dataset comprises of 2.3B such unique events with 34.6M APKs from 7.9M packages using 4.1M certificate chains.
The AV client queries Android’s Package Installer333Using the PackageInstaller.getInstallerPackageName method. to obtain the name of the parent package for each installed APK. If the parent package is known, it is included in the query to the reputation server. However, in some cases parent packages might be unknown to the Package Installer. Some examples are apps that come preinstalled on the device and sideloaded apps installed via the Android Debug Bridge (ADB) and for which the user did not provide an installer package name. Of the 2.3B unique events in the dataset, 75% correspond to installations (i.e., have a parent package different from the child package), 24% correspond to updates (i.e., same parent and child package), and 1% have no parent package information. The 1.7B install events contain 5.4K parent (installer) packages and 2.8M child packages.
The interplay between the AV engine and the reputation log collection is as follows. The APK reputation is part of the decision made by the AV client. APKs are queried to the reputation server prior to making a determination. Thus, apps flagged by the AV client will appear in the reputation logs for the device. Upon detection, if the app is classified as malware, the AV client displays a large warning and asks for permission to uninstall it. If classified as PUP, a notification explains the risks to the user and how to uninstall it.
VirusTotal.
We query the hash of APKs in VirusTotal (VT) [75], an online service that analyzes files and URLs submitted by users using a large number of security tools. VT offers a commercial API that given a file hash returns file metadata and the list of detection labels assigned by a large number of AV engines used to scan the file. Unfortunately, given VT’s API restrictions, we could not query all 34.6M APKs. We queried all parent APKs that performed at least one installation (i.e., all installers), the 10 most prevalent APKs for each signer, all the APKs with negative reputation, and a subset of the APKs with positive reputation. This resulted in VT reports for 4.6M APKs. We use the AV labels in the VT reports as an input to our unwanted app identification and classification. Since we only have VT reports for 13% of all APKs, our unwanted app prevalence results is a lower bound. We also use the VT reports to obtain APK metadata such as certificate information, used to analyze APK ownership, and permissions declared in the manifest, used to identify installers that can perform silent installations without user consent. Having APK metadata for 13% of samples does not affect our results because we only use the certificate information for analysis of selected samples and permissions for installers. In both cases, we have queried the necessary APKs.
Play market.
We check if an app found in user devices is available in Android’s official market by trying to download its public webpage using the app’s package name. For apps in the Play market, we obtain metadata such as its category. We queried all 7.9M package names during February 2020. Of those, 24% (1.9M) were present at that time in the Play market. More may have been available in the past, but have since been removed [76]. The rest may be distributed only through alternative distribution vectors, or may come pre-installed.
IV Approach
This section first describes data challenges we had to overcome and then explains how we identified platform keys and categorized installers.
Obtaining parent information.
The reputation logs contain the package name of the parent APK, but not the parent APK’s hash or public key. This is problematic because benign apps could be impersonated by unwanted apps, misleading us into assigning unwanted installs to benign installers. To avoid this, for each install event, we scan all reputation queries from that device during the 4 months, extracting those that queried an APK whose package name corresponds to the parent in the install event (i.e., the parent we look for appears as child). If such reputation queries exist, we sort them by decreasing time difference from the install event and assign the APK’s hash and public key from the closest event as the parent .
We apply this procedure on the 1.7B install events in the reputation logs (Full column in Table I), recovering parent information for 24% (412.6M) of the install events. This 24% subset of install events covers 78% (4.2 K) of the installer packages and 57% of the child packages in the full install events, as summarized in column Subset in Table I. Recovery failures are likely due to each APK being assigned a time-to-live (TTL) indicating when to re-query its reputation. For APKs positively benign, the TTL may be large enough so that the install event happens before our study period and the device never re-queries (or leaves the dataset before). Thus, the 24% install events may be skewed towards unwanted installers, which may bias VDR absolute numbers. We avoid this bias by computing the relative VDR and by confirming results do not significantly change when computed on all 1.7B install events.
Identifying platform keys.
To identify platform keys in the reputation logs we first obtain from the AOSP repository a list of 65 package names that are part of the Android OS. Then, we search for keys in the reputation logs that satisfy the following properties: signs com.android.phone (a core Android package) and signs at least ten AOSP packages. Third, for each of those candidate keys we identify the top 10 packages signed by the key. If at least half of those packages are present in the list of 65 AOSP packages we keep the key, otherwise we remove it. Finally, we examine the certificate information. If the subject DN mentions a specific vendor, and we are able to find a webpage for the vendor, we keep the key. Otherwise we remove it. For 10% of the examined keys we could not identify a vendor due to a generic Subject DN. This verification is manual, so we restrict it to keys that appear in more than 1K devices. However, thanks to this verification, we are confident that the resulting keys are platform keys. Using this procedure, we identified 201 platform keys belonging to 80 device vendors or OS publishers. The highest number of platform keys is 57 for Motorola that uses separate keys for different devices. Those 201 platform keys appear in over 6M (50%) devices. Thus, when we say a key is a platform key we are confident about it, but we may miss that some keys (e.g., for less prevalent vendors) are indeed platform keys.
Installer categorization.
To analyze how apps are distributed to the devices, we manually classify the installers into 12 categories that correspond to distribution vectors: the official Play market, alternative markets, browsers, commercial PPI, backup and restore, IM, theme stores, file managers, file sharing apps. bloatware, mobile device management (MDM), and package installers. Bloatware [51] corresponds to apps signed by a device vendor or a carrier with unclear functionality, i.e., they do not belong to any of the other categories. Bloatware typically comes pre-installed, although it could be installed later as well. MDM apps enable the administration of corporate mobile devices, e.g., ensuring corporate apps are installed and the corporate security policy is configured. Package installers are apps that enable installing APKs. They include implementations of Android’s Package Installer module (e.g., com.android.packageinstaller, com.google.android.packageinstaller, com.samsung.android.packageinstaller) as well third-party APK installers (e.g., com.apkinstaller.ApkInstaller, com.aefyr.sai). We also add an Other category that comprises of apps that we can classify but do not correspond to any of the 12 expected distribution vectors such as games, video players, and news. For installers available in the Play market we leverage their app description since market categories are too coarse-grained. However, only 12% of the installers were in the Play market when we queried them in February 2020. For the rest, we need to examine sources such as alternative markets, results from Web searches, and forums. This process is quite challenging for the long tail of less popular installers. Overall, out of the 4.2K installers, only 665 install at least one unwanted app. We focus on those and are able to classify 622 (95%). Those 662 include the most prevalent installers so we classify 96.3% of the 412.6M install events. The largest category is alternative markets with over one hundred installers. The results of the categorization are detailed in Section VI-A.
V Unwanted App Encounters
This section reports on unwanted app encounters that affected the 12M devices in the full reputation logs. Section V-A measures the prevalence of unwanted apps on the user devices. Section V-C describes the most common families in our dataset, and Section V-B details the top signers behind the unwanted apps.
V-A Unwanted App Prevalence
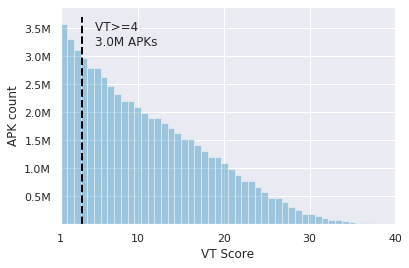
We measure the prevalence of unwanted apps on user devices, i.e., the fraction of user devices that had an unwanted app encounter throughout the four months analysis period. For this, we first identify unwanted apps installed on user devices. Then, we measure their prevalence across the 12M user devices. A common practice to identify unwanted apps is to collect their AV detection labels using VT and consider any file flagged (i.e., assigned a non-empty label) by at least a threshold number of AV engines [84]. A higher threshold reduces false positives due to a few AV engines making an incorrect determination, but may increase false negatives. As explained in Section III, we could not query all 34.6M APKs due to VT API restrictions, but were able to collect VT reports for 13% (4.6M) of all APKs. Figure 1 shows the number of unwanted APKs in our dataset depending on the selected VT threshold. The number of unwanted APKs decreases as the threshold increases.
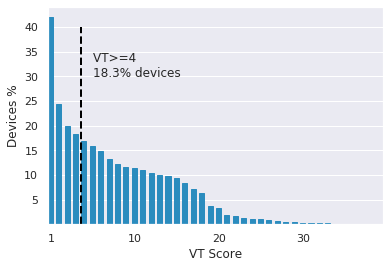
We use the set of unwanted APKs obtained at each threshold value to compute the device prevalence, i.e., the fraction of devices where those unwanted APKs were installed. Threshold selection varies among different works [84]. Thus, we provide the prevalence at all threshold values in Figure 2. The prevalence quickly decreases from t=1 to t=3, and then at around one percentage point per step increase until t=19. Recent work has shown that threshold values between two and 14 are good for stability and for balancing precision and recall [84]. Thus, the unwanted app prevalence in our dataset ranges between 24.3% (t=2) and 10.0% (t=14).
| Value | Unwanted Apps | PUP | Malware |
|---|---|---|---|
| Devices | 2.2 M (18.3%) | 1.3 M (11.1%) | 1.4 M (11.2%) |
| APKs | 3.0 M (8.6%) | 1.8 M (5.1%) | 1.2 M (3.4%) |
For the rest of the paper we need to set a threshold value, so that the set of unwanted APKs is fixed. We select t=4 as our threshold. This value falls in the range recommended in [84] and has been used in closely related works (e.g., [47, 45]). Using this threshold, there are 3.0M unwanted APKs and the prevalence is 18.3%, as summarized in Table IV. Clearly, this estimate is very conservative as it considers benign all APKs that were not queried to VT, or were not found in VT, or were flagged by less than four AV products. We believe this is a lower bound for prevalence. Among the devices with at least one unwanted app encounter at t=4, the median is 2.0 unwanted apps per device (avg=5.0, std=1497.0). Figure 3 in the Appendix details the distribution.
Table IV also provides the split between malware and PUP APKs, according to the AVClass malware labeling tool [63] (see Section V-C). It shows that 60% of the unwanted APKs at t=4 are considered PUP and 40% malware. However, malware prevalence (11.2% of all 12M devices) is almost the same as PUP prevalence (11.1%), indicating the presence of some high prevalence malware. The devices typically encounter only malware or PUP, but 490K devices encounter both types.
Comparison with prior work.
Shen et al [67] measured the fraction of devices with an AV detection over 6M Android devices in April 2015. Those detections belonged to five categories: trojan, infostealer, backdoor, hacktool, spyware. Unfortunately, they only provide the fraction of rooted and non-rooted devices with at least one detection of each category. Each number is in the range 0.10%–0.71%, but we cannot infer the total prevalence, making the comparison difficult. Still, our 10%–24% prevalence range seems significantly higher. This is likely due to our measurement including also PUP and covering four months. In addition, the last four years may have seen an increase in unwanted apps as Android became the dominant OS in user devices. We also examined recent threat reports from security vendors [7, 12]. However, those reports do not measure prevalence on devices, but rather number of detections and number of new samples discovered, which cannot be accurately compared. Other works have measured malware and PUP prevalence on Windows enterprise hosts [79, 46]. Some works [46] operated on a very different time period (three years versus four months in our study), making it difficult to compare prevalence estimates. However, Yen et al. [79] observed that 15% of hosts in a large enterprise encountered at least one detection by a specific AV engine over a four-month period in 2014. Yen et al. call the flagged samples malware, but the authors confirmed us they included all detections by the AV client. That prevalence falls in our 10%-24% range, also computed on a four-month period although in mid-2019, and is slightly lower than the 18.3% prevalence with the selected threshold.
Takeaway.
Even the very conservative estimate of 18.3% indicates that Android devices have an unwanted app prevalence rate similar and possibly slightly higher than Windows (enterprise) hosts. Thus, despite many security improvements provided by the Android ecosystem (e.g., OS app isolation, OS permission model, official market) the security posture of Android devices with respect to unwanted apps does not seem better than that of Windows (enterprise) hosts.
In the remainder of the paper, unwanted apps refers to the 3M APKs at t=4, i.e., flagged by at least 4 AV engines.
| # | Certificate Thumbprint | Name | Devices | Packages | APKs | Unw. APKs | SDR |
| 1 | 61ed377e85d386a8dfee6b864bd85b0bfaa5af81 | AOSP Test | 1,811,862 | 480,639 | 1,444,423 | 255,393 | 17.7% |
| 2 | 9edf7fe12ed2a2472fb07df1e398d1039b9d2f5d | O=Qbiki Networks | 328,286 | 75,537 | 134,488 | 27,073 | 20.1% |
| 3 | 27196e386b875e76adf700e7ea84e4c6eee33dfa | AOSP Platform | 197,602 | 22,782 | 355,841 | 16,489 | 4.6% |
| 4 | 3246bde9e58a7e0cdf779a7b403581ba958361c3 | O=Outfit7 Ltd. | 156,932 | 40 | 1,363 | 219 | 16.1% |
| 5 | 614d271d9102e30169822487fde5de00a352b01d | OU=gsr | 68,239 | 21,758 | 26,060 | 7,277 | 27.9% |
| 6 | ac640e8372e429f9894a5e1dff1081e223aa94e3 | CN=1mobile | 66,508 | 20 | 17,541 | 2,045 | 11.7% |
| 7 | bc87c82cd2886a4e07e1f2e1156ddc9b2c467dc8 | O=NetDragon | 60,171 | 13,176 | 31,311 | 10,806 | 34.5% |
| 8 | 5d08264b44e0e53fbccc70b4f016474cc6c5ab5c | CN:Android Debug | 52,402 | 1,010 | 19,066 | 9,696 | 50.9% |
| 9 | 971da0d8842f7539c666f87b74676c4548c26341 | CN=iMobLife | 46,609 | 230 | 1,849 | 130 | 7.0% |
| 10 | 6d2aa36c370d8b6156dba70798a8c6c728265404 | CN=Pravesh Agrawal | 28,302 | 6,104 | 10,648 | 6,343 | 59.6% |
V-B Unwanted App Signers
We use the certificate’s public key hash to identify the signer, i.e., the entity that signs an APK. For each of the 4.1M signers in the full reputation logs, we compute the signer detection ratio (SDR), i.e., the fraction of unwanted APKs it signs over the total number of APKs it signs. The SDR allows to identify signers with a significant fraction of unwanted APKs. The distribution is bimodal, 86% of the signers have 0% SDR and 13% have 100% SDR, with only 1% in between. We consider a signer unwanted if it has SDR 4% and signs at least 100 unwanted APKs. We experimentally chose these thresholds to minimize flagging signers with a small number of APKs compromised in a short time period (e.g., using an abusive SDK in some versions), who later on addressed the issue. Using these thresholds, we flag 146 (0.003%) of all signers as unwanted, with only 70 of those being present in over 1K devices.
Table V shows the top 10 unwanted signers by device prevalence. For each signer, the table shows ranking; certificate thumbprint; a name that corresponds to a well known key or a distinguishing substring of the certificate’s Subject DN; number of devices where APKs from the signer are installed, number of distinct package names of APKs signed by the signer, number of APKs signed by the signer, number of unwanted APKs among those, and SDR.
Six of the 10 signers correspond to generic certificates that sign apps from multiple developers. Ranks 1 and 3 correspond to default AOSP keys. Signing an APK with an AOSP key is a well known security issue since the private keys are known and any other apps signed with the same key could perform an update. There are 1.83M (1.5%) devices with APKs signed by any of the AOSP keys. Since the Play market does not allow apps signed with these keys to be uploaded, these apps must have been installed from alternative sources. APKs signed with these keys include popular package names such as MineCraft and WhatsApp, indicating impersonation of benign apps by unwanted app developers. Using the AOSP keys facilitates the unwanted app developers to hide among the crowd of other developers also using them. Prior work has observed the use of AOSP keys in custom firmware images [82, 80]. Our work differs in reporting their abuse and the fraction of devices affected by them. At rank 8 there is an Android Debug certificate, used by Android Studio to sign applications during debugging. Similar to the AOSP certificates, such certificates should not be used outside debugging, and applications using them cannot be uploaded to the Play market.
Generic certificates at ranks 2, 5, and 10 correspond to the SeattleCloud [62], AppsGeyser [19], and WordPress2Apk [78] online app generators (OAGs), respectively. OAGs automate app development, lowering the technical skill required by app developers, and may offer publishing the produced apps to the Play market [55]. Our results indicate OAGs publish unwanted apps from their clients, possibly due to limited vetting of the apps they (are paid to) publish. Identifying such generic certificates is fundamental to avoid false positives in detection systems that leverage signer reputation, as well as when attributing apps to their owners [64].
The remaining four signers correspond to specific unwanted app developers. Both 1Mobile and Netdragon do not have any apps in the Play market. 1Mobile publishes an alternative market of the same name. The 1Mobile market app (me.onemobile.android) has 17,466 APKs, an unusually high number of versions possibly indicating polymorphism to bypass detection. NetDragon sold part of its business to Baidu in July 2013 [28]. We believe the reason why NetDragon appears in the list is the 2015 discovery of a backdoor in Baidu’s MoPlus SDK [66]. Both Outfit7 and iMobLife have multiple apps in the Play market. Surprisingly, iMobLife uses a large number of Play developer accounts to distribute their performance optimization and mindfulness apps. The accounts include iMobLife Inc.; AIO Software Technology CO., Ltd.; Daily Yoga Culture Technology Co., Ltd; HK SMARTER MOBI TECHNOLOGY CO.,LIMITED; SM Health Team; and The Unexplainable Store®.
Takeaway.
In addition to APK polymorphism, unwanted app developers also leverage developer account polymorphism, which provides isolation between apps in different accounts. In this way, even if some of the apps are removed by the market, others could remain available. We observe AOSP keys being abused to sign unwanted apps and being present in 1.83M devices. Moreover, we also observe online app generators being abused to generate and publish unwanted apps.
| Family | Type | Devices | APK | Pkg. | Sig. | |
|---|---|---|---|---|---|---|
| necro | Mal | Dropper | 680K | 985 | 288 | 608 |
| jiagu | PUP | Tool | 577K | 248K | 82K | 49K |
| hiddad | Mal | Adware | 225K | 128K | 11K | 9K |
| smsreg | PUP | SMS | 179K | 150K | 79K | 49K |
| revmob | PUP | AdLibrary | 169K | 62K | 54K | 13K |
| inmobi | PUP | AdLibrary | 131K | 26K | 24K | 5K |
| leadbolt | PUP | AdLibrary | 127K | 37K | 28K | 10K |
| datacollector | PUP | Infostealer | 123K | 9K | 4K | 3K |
| autoins | PUP | Infostealer | 112K | 14K | 6K | 3K |
| anydown | PUP | Adware | 109K | 24K | 18K | 5K |
| mocen | Mal | Adware | 94K | 753 | 248 | 132 |
| airpush | PUP | AdLibrary | 91K | 64K | 39K | 15K |
| dnotua | PUP | Riskware | 80K | 50K | 32K | 6K |
| secapk | PUP | Tool | 72K | 25K | 14K | 6K |
| domob | PUP | AdLibrary | 70K | 18K | 10K | 3K |
| appsgeyser | PUP | AppGen | 59K | 14K | 13K | 161 |
| dowgin | PUP | Adware | 58K | 32K | 25K | 9K |
| dianjin | PUP | AdLibrary | 58K | 8K | 5K | 913 |
| utilcode | PUP | Tool | 50K | 3K | 785 | 678 |
| secneo | PUP | Tool | 50K | 13K | 5K | 3K |
V-C Family Classification
To understand the most prevalent threats affecting Android devices, we classify the unwanted APKs into families. For this, we feed the AV labels from the 4.6M VT reports to the AVClass malware labeling tool [63]. AVClass outputs the most likely family name for each sample and also classifies it as malware or PUP based on the presence of PUP-related keywords in the AV labels (e.g., adware, unwanted). Overall, AVClass labels 2.4M (76%) of the APKs belonging to 2.9K families. For the remaining 700K samples with a VT report, no family was identified as either they were not detected by any AV engine or their AV labels were generic.
Table VI shows the 20 most prevalent malware and PUP families identified by AVClass. PUP clearly dominates malware with 17 versus three families. Most PUP families are related to abusive advertisement including six advertisement libraries (inmobi, leadbolt, airpush, domob, dianjin), four adware families (hiddad, anydown, mocen, dowgin), and one app generator that monetizes through advertisement (appsgeyser). The ad libraries are added by other applications and their behaviour varies from displaying in-app ads like inmobi and leadbolt, to more aggressive techniques used by dianjin and airpush such as ads in the system notification bar or shortcut ads on the home screen or in the application list. Some ad libraries also collect personal identifiable information (e.g., GPS coordinates) and track users using permanent identifiers (e.g., IMEI), which violates Google Play policies [1]. Among the PUP families there are also three tools used for obfuscating mobile apps (jiagu, secapk, secneo). Obfuscation tools are commonly used by malware, but may be used also by benign software causing false positives [14].
The most prevalent malware family is necro, a trojan dropper that infected over 680K devices. Necro has been observed embedded in popular applications available in the Play market such as CamScanner [36]. According to the CamScanner developers the malware made it into their app through the third party advertising SDK provided by AdHub [34]. The table also includes two information-stealing families (datacollector, autoins). Other notorious malware families outside the top 20 are the triada rootkit (29K devices) [22, 44], the wroba banking trojan (21K) [56], and agentsmith (16K) that replaces installed apps such as WhatsApp with modified versions that show fraudulent ads [39]. We also search for ransomware and other banking trojans in our dataset. We identify 11 ransomware families affecting in total 31K devices including svpeng, congur, and jisut. This very modest prevalence matches industry reports that show ransomware decreasing in the wild after 2017 [7, 8]. We also identify 17 banking trojans affecting in total 30K devices. The most prevalent families are wroba, hqwar, and asacub. Industry reports mention that banking trojans samples increase over time, especially after 2018 [7, 12]. Their small prevalence in our dataset can be potentially explained by banking trojans being heavily polymorphic and AVs not always being able to assign them non-generic labels.
Takeaway.
The higher PUP sample prevalence in user devices observed in Section V-A also manifests in the largest families being PUP. Top PUP families are mostly ad-related and use popular obfuscation tools for protection. The largest malware families are information stealers, but we also observe rootkits and ransomware in tens of thousands of devices.
| Installs | Installer | Children | |||||||||
| Vector | All | Unw. | All | Unw. | Plat. | Pkg. | Sig. | Pkg. | Sig. | VDR | RVDR |
| Playstore | 87.2% | 67.5% | 10 | 3 | 0 | 2 | 9 | 1.2M | 816K | 0.6% | 1.0 |
| Alt-market | 5.7% | 10.4% | 102 | 31 | 15 | 87 | 67 | 128K | 77K | 3.2% | 5.3 |
| Backup | 2.0% | 4.8% | 49 | 2 | 24 | 31 | 39 | 528K | 355K | 0.9% | 1.5 |
| Pkginstaller | 0.7% | 10.5% | 79 | 5 | 25 | 11 | 74 | 197K | 127K | 2.4% | 4.0 |
| Bloatware | 0.4% | 6.0% | 54 | 2 | 28 | 37 | 41 | 2.1K | 1.3K | 1.2% | 2.0 |
| PPI | 0.2% | 0.1% | 21 | 0 | 2 | 20 | 11 | 1.5K | 1.3K | 0.3% | 0.5 |
| Fileshare | <0.1% | <0.1% | 13 | 3 | 4 | 13 | 11 | 8.8K | 7.4K | 1.3% | 2.1 |
| Themes | <0.1% | <0.1% | 2 | 0 | 2 | 2 | 2 | 634 | 14 | 0.3% | 0.5 |
| Browser | <0.1% | <0.1% | 47 | 4 | 3 | 40 | 38 | 4.8K | 3.3K | 3.8% | 6.3 |
| MDM | <0.1% | <0.1% | 7 | 1 | 1 | 7 | 6 | 766 | 489 | 0.3% | 0.5 |
| Filemanager | <0.1% | <0.1% | 58 | 11 | 9 | 32 | 43 | 6.6K | 4.7K | 2.6% | 4.3 |
| IM | <0.1% | <0.1% | 13 | 2 | 0 | 10 | 11 | 2K | 1.2K | 2.9% | 4.8 |
| Other | <0.1% | 0.3% | 151 | 68 | 28 | 125 | 98 | 9.1K | 5.3K | 3.9% | 6.5 |
| Unclassified | 3.7% | <0.1% | 3.5K | 2.4K | 386 | 3.3K | 814 | 91K | 16K | <0.1% | 0.1 |
| All | 100.0% | 100.0% | 4.2K | 2.5K | 79 | 3.6K | 1.0K | 1.6M | 992K | 1.6% | 2.6 |
VI Unwanted App Distribution
In this section, we investigate unwanted app installation vectors, i.e., how unwanted apps ended up on the devices. To this end, we use the Subset dataset in Table I with 412M install events, corresponding to the 24% install events for which we could recover parent information, as explained in Section IV. We uniquely identify an installer by the pair of its package name and its signer. That way we can differentiate unwanted installers that impersonate (i.e., use the package name of) a benign installer, as well as apps that have multiple signers, e.g., system apps that are signed by different device vendors. As explained in Section V-A, we consider unwanted any APK flagged by at least 4 AV engines. For each installer, we calculate the installer detection ratio (IDR), i.e., the fraction of unwanted APKs it installs over the total number of APKs it installs. We also compute the vector detection ratio (VDR) as the fraction of unwanted APKs installed using a distribution vector (e.g., alternative markets, browsers) over all APKs installed through that vector.
VI-A Distribution Vectors
To analyze what fraction of installs is delivered through each distribution vector we first classify the installer apps as detailed in Section IV. Table VII summarizes the top app distribution vectors we have identified. For each distribution vector the left part shows the percentage of install events (all and unwanted) the distribution vector is responsible for. The middle part summarizes the installers in the category: all installers, unwanted installers, installers signed with a platform key, and package names and signers for the installers. The right part of the table summarizes the child APKs installed through the distribution vector: number of packages, signers, and the vector detection ratio. VDR is the fraction of unwanted APKs installed using a distribution vector over all APKs installed via that vector. RVDR is the relative VDR with respect to the Play market, which is set as 1.0. Overall, as we explained in Section IV, we were able to classify 14% of the installers covering 96.3% of the 412M install events. While the fraction of classified installers is low, we cover the vast majority of installs, enabling us to accurately compare various distribution vectors.
The main distribution vector is the Play market, responsible for 87% of all and 67% of unwanted installs. While the percentage of unwanted installs is highest for the Play market, its VDR is only 0.6% and its RVDR the fourth lowest. This illustrates that installing from the Play market is safer than installing from most distribution vectors including alternative markets, browsers, and IM. However, unwanted app developers have a large incentive to make their apps appear in the Play market since it provides the apps with higher visibility, reputation, and trust. This leads to a low fraction, but large number overall, of unwanted apps being able to bypass Play’s defenses. The effectiveness of Play defenses against unwanted apps is illustrated by the lower rate of unwanted installs compared to all installs, i.e., they manage to remove a fraction of the unwanted apps. On the other hand, the defenses (if any) against unwanted apps used by other distribution vectors, save for commercial PPI, do not seem to be effective. The second largest distribution vector are the over 100 alternative markets identified, responsible for 5.7% of all installs and 10.4% of unwanted installs. We detail the top 10 markets in Table VIII and discuss them below. Prior work has analyzed the distribution of unwanted apps through markets by crawling official and alternative markets (e.g., [83, 77]). However, such crawling is limited to a fixed set of markets and a small fraction of apps in each market. Also, paid apps are typically ignored. In addition, some markets may not provide a web-based app download interface that researchers can easily crawl, e.g., the Vivo market in [77]. Compared to prior work, we can observe apps installed by user devices regardless of the type of app (paid or free) and from which market they come (we observe over one hundred alternative markets).
The third distribution vector is through backup restoration. These installs correspond to restoration of previously saved apps in the cloud, as well as transfer of apps while cloning an old phone into a new phone. These apps are not an intentional distribution vector, but surprisingly they are responsible for nearly 5% of unwanted apps installations. For cloud backups, the most likely explanation is that the user decided not to uninstall the unwanted app when prompted by the AV client and the app was thus saved. This matches with the majority of unwanted apps installed via this vector being PUP, for which the AV client generates lighter and less frequent notifications. In some cases it may also happen that the backup was taken before installing the AV client. Phone cloning apps are typically privileged (i.e., signed by the platform key) so that they can copy all apps in an old phone to the new phone. Otherwise, they cannot access the /system/ directory where system apps are installed. Thus, it may happen that privileged unwanted apps, which cannot be uninstalled by the AV client, are surviving a phone change by the user thanks to the high privilege of the phone cloning apps. One example involves a pre-installed unwanted app infected with the CoolReaper backdoor [5]. CoolReaper was discovered in phones manufactured by Coolpad, a Chinese device vendor, and among its many capabilities, it can perform fake over-the-air (OTA) updates for installing other unwanted apps. In conclusion, there seems to be an opportunity for backup and phone cloning apps to improve defenses against unwanted apps, e.g., by performing AV scans on the saved apps.
Installs by package installers rank fourth by fraction of installs, but second by unwanted installs (10.5%). These largely correspond to manual installs by the user, who may be consciously installing unwanted apps that offer desired functionality. For these installs, the vector through which the user downloaded the app into the phone is not known.
Bloatware is another surprisingly high distribution vector, being responsible for 6% of unwanted installs. Bloatware are pre-installed apps with unclear functionality. As explained in Section IV we consider in this category apps signed by a device vendor or a carrier, which do not belong to any of the other categories, i.e., for which we do not understand why they are installing apps. The most likely reason behind installs in this category, as well as the Other and Unclassified categories, is advertising. In other words, if we do not understand why an app is installing apps from other signers, then we assume that publishers of the child apps are paying for the installations. We discuss such pay-per-install (PPI) agreements in Section VI-B. In summary, this high number of installs by bloatware likely indicates aggressive ad-based monetization by device vendors and carriers of the phones they sell.
The browser category shows that app downloads from the Web are rare (<0.1% of all installs), but have the highest risk of being unwanted (3.8% VDR). In particular, the browser VDR is larger than that of alternative markets. Downloading apps through the browser is a riskier proposition than downloading them from markets, even the alternative ones. This highlights a need for stronger browser-based defenses against unwanted app downloads.
Next, we analyze the markets and browsers categories to understand differences between apps in the same category.
| Children | ||||
|---|---|---|---|---|
| Rk | Market | IDR | Sig. | Pkg. |
| 1 | com.android.vending | 0.6% | 816K | 1.2M |
| 7 | com.sec.android.app.samsungapps | 1.2% | 14K | 26K |
| 8 | com.mobile.indiapp | 1.6% | 12K | 15K |
| 9 | com.amazon.venezia | 0.7% | 12K | 23K |
| 10 | com.oppo.market | 2.8% | 10K | 12K |
| 11 | com.xiaomi.mipicks | 1.1% | 10K | 12K |
| 12 | com.farsitel.bazaar | 10.5% | 10K | 20K |
| 13 | ir.mservices.market | 4.4% | 8K | 13K |
| 15 | com.vivo.appstore | 0.9% | 8K | 9K |
| 18 | com.huawei.appmarket | 11.7% | 7K | 9K |
Markets.
Table VIII shows the top 10 markets by number of child signers. Each row corresponds to an installer, i.e., package name and signer pair. The top row corresponds to the Play market (com.android.vending). It does not include the previous package name for the official market (com.google.android.feedback) nor Play APKs from other signers such as the AOSP test key. For each market, the table shows the rank by number of child signers across all categories. We observe significant differences in IDR for different markets. The highest IDR of 11.7% is for the Huawei market (com.huawei.appmarket), followed by the Iranian Bazaar market (com.farsitel.bazaar) with 10.5%, the Iranian MyKet market (ir.mservices.market) with 4.4%, the NearMe market from Chinese vendor Oppo (com.oppo.market) with 2.8%, and the 9Apps Indian market (com.mobile.indiapp) with 1.6% IDR. On the better side of the spectrum, there are the Play market and Amazon’s market with the lowest IDRs of 0.6% and 0.7% respectively. This indicates that the security vetting process that the Play market applies to uploaded apps indeed has a positive effect on user security [2]. Compared to the Play market, the users of alternative markets have up to 19 times higher probability of encountering unwanted apps.
| Child | ||||
|---|---|---|---|---|
| Rk | Browser | Name | IDR | Sig. |
| 42 | com.UCMobile.intl | UC | 3.8% | 1,593 |
| 45 | com.android.chrome | Chrome | 3.9% | 1,521 |
| 80 | com.opera.browser | Opera | 3.6% | 536 |
| 142 | com.uc.browser.en | UC Mini | 5.0% | 225 |
| 158 | org.mozilla.firefox | Firefox | 3.6% | 193 |
| 164 | com.opera.mini.native | Opera Mini | 10.5% | 183 |
| 166 | com.brave.browser | Brave | 5.1% | 175 |
| 173 | com.coloros.browser | Oppo ColorOS | 4.0% | 157 |
| 197 | com.android.browser | Android (Oppo) | 8.8% | 133 |
| 215 | com.nearme.browser | Oppo NearMe | 6.7% | 111 |
Browsers.
Table IX is similar for the top 10 browsers. UC Browser tops the table followed closely by Chrome. These two browsers rank 42 and 45, respectively, among all installers. The top seven browsers are available in the Play market, while the last three correspond to browsers preinstalled in Oppo phones. Similar to the markets, we can observe significant differences in IDR between some mobile browsers. Most browsers have an IDR in the range 3.8%–5.1%, but Opera Mini has twice that risk (10.5% IDR), even more compared to the full Opera browser (3.6%). We don’t have a good explanation for the difference between Opera versions, as prior work comparing mobile browser security does not flag significant differences [49].
Privileged installers.
An orthogonal classification is whether installers are system or user level apps. System-level installers signed by a platform key are responsible for 4.1% of all installs and 9% of unwanted installs. The high ratio of unwanted installs is especially worrying because these installers have access to system level permissions and cannot be uninstalled by normal users or security tools, only by the superuser or through ADB. Security tools can only recommend the user to disable them. Most system-level installers come pre-installed, but we observe that 35% of their installs are for other system-level apps. Thus, it is possible for other system-level installers to be installed later in the device lifetime. Column Plat. in Table VII shows the number of system-level installers per category, which is dominated by bloatware and backup (i.e., phone cloning) apps. More than half of installers in those two categories are privileged. This matches common complaints by users that bloatware is installing apps in their phones and cannot be uninstalled.
Considering all installs.
So far, we have analyzed the Subset dataset corresponding to the 412M install events for which we could recover parent information. Table XI in the Appendix presents the same results in Table VII, but for the Full dataset of 1.7B install events. Results in Table XI could misclassify some installs due to impersonation, but avoid any bias introduced when selecting the Subset dataset. The results on both datasets are very similar, indicating that no significant sampling bias was introduced in the Subset dataset.
Takeaway.
To summarize, we observe that the Play market is the main app distribution vector responsible for 87% of all installs and 67% of unwanted installs. However, its VDR is only 0.6%, showing that the Play market defenses against unwanted apps work, but still significant amounts of unwanted apps are able to bypass them, making it the main distribution vector for unwanted apps. Among the remaining installs, alternative markets are the largest, being responsible for 5.7% of all installs and 10.4% of unwanted installs. Furthermore, on average they are five times riskier (3.2% VDR) than the Play market (0.6%). App downloads from the Web are rare (<0.1% installs), but have a significantly higher risk. Backup restoration is an unintended unwanted app distribution vector responsible for 4.8% of unwanted installs. Bloatware is another surprisingly high distribution vector, responsible for 6% of unwanted installs.
VI-B Pay-Per-Install
Pay-per-install (PPI) is a software distribution model where an advertiser pays publishers to advertise a program and have it installed on user devices. Publishers are paid a commission for each confirmed install on a new device. The advertiser can reach direct agreements with publishers, e.g., setting up an affiliate network, or can leverage PPI services, who act as middle-men between advertisers and publishers.
Previous work analyzed Windows PPI services, dividing them into underground and commercial [23, 45, 73]. Underground PPI services mostly distribute malware, do not advertise themselves publicly, and often use silent installs, i.e., the user is unaware of the installation [23]. Commercial PPI services, instead, are backed by companies and prompt offers for users to decide about the install [45, 73]. In both types, publishers are paid for each install of a PPI installer program that then downloads the currently advertised programs.
As far as we know, Android PPI services have not yet been analyzed, so we provide a first look at them. Advertising in Android often uses ad libraries that ad networks ask publishers to include into their apps. For PPI services, if the publishers are owners of popular apps, the service may provide them with a library to include in their apps. On the other hand, if the publishers are device vendors or carriers, the PPI service provides them with a stand-alone installer to be pre-installed in their branded devices. As a starting point, we knew the package names of three stand-alone installers for two Android commercial PPI services, IronSource (IS) and DigitalTurbine (DT), mentioned in prior work [33]. Both commercial PPI services partner with device vendors and carriers to pre-install their installer, which can then offer apps to the user. If the user installs an advertised app, PPI and partner (carrier or vendor) split the commission paid by the advertiser. In addition, we had a list of 59 apps identified in prior work [61] that pay their users a commission if they install other apps. In this PPI model, there is no publisher and the PPI service directly interacts with users. While these 59 apps appear in a handful of devices in the reputation logs, they did not perform any installs in our dataset. Starting from the known IS and DT PPI installers, we leveraged the 34.6M APKs in the reputation logs to identify further installers for those two services. For this, we examined apps from the same signer and/or similar package name. This process identified 48 IS and 38 DT installers. The identified 86 installers were used to produce the PPI results in Table VII.
The PPI row in Table VII shows that those two commercial PPI services are responsible for 0.2% of all installs and 0.1% of unwanted installs with DT being responsible for 644K installs and IS for 36K. Thus, DT is the larger PPI. Obviously, this is a very conservative lower bound on commercial PPI distribution as more Android commercial PPI services likely exist. However, we have not been able to identify more stand-alone commercial PPI installers in our dataset. It may happen that DT and IS dominate the agreements with carriers and vendors. Thus, other commercial PPI services provide their publishers with a library to embed into their apps, rather than a stand-alone installer. Those PPI publishers should then appear under the Other and Unclassified categories in Table VII. Thus, we can conservatively estimate that all PPI activity (commercial and underground) can be responsible between 0.1% and 4% of all unwanted app installs. Of course, assuming all uncategorized installers are involved in PPI is a conservative upper bound as well. But, that upper bound is already significantly lower than the estimate that Windows PPI services distributed over a quarter of all PUP [45]. Next, we detail these two commercial PPIs. Then, in Section VI-C we examine the unknown installers that may be involved in PPI distribution.
IronSource.
IS is an Israeli advertising company [41]. Its offering includes the Aura out-of-the-box experience (OOBE) platform, which they claim is installed in 130M devices [42]. The 48 IS installers include the name of vendor and carrier partners in the package name (e.g., com.aura.oobe.samsung). We observe 37 partners: 29 vendors (e.g., alcatel, huawei, htc, samsung, xiaomi, zte), 7 carriers (e.g., digicel, hutchinson, telus), and one OS publisher (remix). Of those, 8 vendors (dewav, huawei, irulu, lge, longcheer, tinno, yulong) and the OS publisher (remix) sign the IS installer with their platform keys, which gives it system privilege. The IDR for IS installers ranges 0%–5.6%, with a mean of 0.3% and a median of 0%. Thus, IS installs very few unwanted apps. In contrast, their Windows PPI service had a 81% IDR [45]. The most popular child apps are: Wish shopping, Booking, and Candy Crush Soda Saga. We also observe TikTok, Netflix, Outlook, SnapChat, Pinterest, Twitter, Skype, and Spotify. This shows that some of the most popular apps leverage IronSource to increase their user base. To conclude, we observe that IS has significantly cleaned their practices. Their vetting limits abusive advertisers, achieving a IDR lower than other distribution vectors such as markets and browsers. And, while they use many certificates and package names, those are clearly labeled as belonging to IronSource.
Digital Turbine.
DT is a public company headquartered in Austin, Texas. According to their 2019 fiscal year statement [11] it works with 30 carriers and OEM vendors, is installed in 260M devices, and has delivered one billion app installs. Their revenue for 2019 totaled $103.6M. Similar to IS, the 38 installers include the partner name (e.g., com.dti.att). We observe 21 partners: 9 carriers (e.g., att, cricket, comcast, uscc), 18 vendors (e.g., blu, lenovo, samsung, zte), and two others (sliide, smartapp). The IDR for the installers ranges 0.0%–9.7% with a mean of 1.1% and a median of 0%. This is worse than IS, but still low compared with other sources. The most downloaded apps are popular: Facebook, Slotomania, and Empire: Four Kingdoms. We also observe Instagram, Yelp, and YahooMail. The advertised apps are mostly disjoint from those IS advertises, but we found a few advertised through both PPIs, e.g., Wish Shopping and Candy Crush Saga. While the advertised apps are predominantly benign, com.dti.gionee (9.7% IDR) is a clear exception, distributing apps from two advertisers in Table V (VideoBuddy and MrOwl). Gionee mostly sells its devices in India, thus both apps likely target Indian users. We also found user reports that the installer name displayed in the device was changed from DT Ignite to Mobile Services Manager, with users complaining that this was done for obfuscation [4]. Thus, while their overall IDR is not bad, DT can still improve its transparency and advertiser vetting.
Takeaway.
We provide a very conservative lower bound on commercial PPI service distribution of 0.2% of all installs and 0.1% of unwanted installs and observe that such services seem to have improved their filtering of abusive advertisers compared to their Windows counterparts. We also estimate that all PPI activity may be responsible for up to 4% of the unwanted app installs. That upper bound is still significantly lower than the estimate of Windows commercial PPI services being responsible for over a quarter of PUP installs [45].
| Children | ||||||||||
|---|---|---|---|---|---|---|---|---|---|---|
| # | Package | Cert Thumbprint | GP | Plt. | IP | SDR | IDR | Pkg | Sig | GPR |
| 1 | cn.feelcool.superfiles | b0d2737aa9070973f8b66755f9cd32d98fd0bd83 | ✗ | ✗ | ✓ | 82.4% | 71.4% | 12 | 11 | 0.0% |
| 2 | com.google.android.play.ms72 | 82f0e9ff5dd5ad52cf74eb5e7189a3278ca76358 | ✗ | ✓ | ✗ | 0.6% | 50.0% | 12 | 12 | 41.7% |
| 3 | com.snaptube.premium | be135353437d704f3a37e2b413d040a5ddff4f19 | ✗ | ✗ | ✗ | 0.1% | 42.6% | 28 | 30 | 14.3% |
| 4 | cn.opda.a.phonoalbumshoushou | 8f8360b284a2dfd65dffe47acbd64ffff674cfee | ✗ | ✗ | ✓ | 3.3% | 18.5% | 23 | 23 | 17.4% |
| 5 | launcher3.android.com.hivelauncher | 28af6c75244a9cbd3f8aee304c425cdc1c66bc6c | ✗ | ✓ | ✓ | 0.0% | 10.5% | 30 | 28 | 60.0% |
| 6 | com.vivo.game | 283d60ddcd20c56ea1719ce90527f1235ae80efa | ✗ | ✓ | ✓ | 0.4% | 10.5% | 18 | 17 | 0.0% |
| 7 | com.zte.aliveupdate | 1ef46c04828e8994daab682bfe3211cae775a2b4 | ✗ | ✗ | ✓ | 1.5% | 10.4% | 31 | 23 | 29.0% |
| 8 | com.miui.system | 7b6dc7079c34739ce81159719fb5eb61d2a03225 | ✗ | ✓ | ✗ | 0.3% | 9.1% | 11 | 11 | 63.6% |
| 9 | com.transsion.appupdate | 37f3837469049e6022f3248b84372badb77d1a1e | ✗ | ✓ | ✗ | 0.5% | 8.9% | 25 | 24 | 84.0% |
| 10 | com.rahul.videoderbeta | 9816a59361ccd7c33542205da5c7178f32f38042 | ✗ | ✗ | ✗ | 1.1% | 8.3% | 21 | 21 | 9.5% |
VI-C Top Unknown Installers
In this Section we take a look at the installers for which it is not clear based on their public description why they would need to install other apps, other than for pay-per-install advertising. These correspond to three rows in Table VII, the installers that our classification labels as Bloatware and Other, as well as those left Unclassified. To make sure we analyze relevant installers, we focus on installers that install apps from at least 10 signers. Table X shows the top 10 installers satisfying those constraints, sorted by decreasing IDR. The top two installers are Unclassified, five are Bloatware (ranks 5–9), and three are Other, two video downloaders (Snaptube, Videoder) and one optimizer (Baidu Mobile Guard).
The top unknown installer is cn.feelcool.superfiles. It is clearly an unwanted installer since all its APKs known to VT are considered unwanted (i.e., VT 4); its signing key has a very high SDR (82.4%), i.e., its signer mostly signs unwanted apps; and it has a very high IDR (71.4%), i.e., it mostly installs unwanted apps. Furthermore, none of the 12 apps it installs are available in the Play market. AVClass labels its samples as adware from the hiddenads family. We believe we are the first to cast light on this unwanted installer. The rest of the installers are not unwanted (e.g., low SDR), but install a significant fraction of unwanted apps.
None of these installers are available in the Play market, so we examine how they arrived in the phone. We have no installation events for the top two Unclassified installers, Thus, they might come pre-installed, similar to the five bloatware apps. The apps in the Other category are installed from multiple alternative markets where they are quite popular.
Now we investigate whether those installs could have happened without user consent. While we do not know if there was user consent, we can determine that in some cases there had to be, as the installer lacks the necessary permissions for silent installations. Column IP in the table captures whether at least one APK from the installer have a VT report stating that it requests the Android system-level INSTALL_PACKAGES permission in their manifest. This permission is a pre-requisite for performing installs without user consent. The results shows that half of the installers have that permission and thus could perform silent installs if they wanted. Note that having the ability to perform silent installs does not mean they use it. We further discuss this issue in Section VIII.
Takeaway.
The top unknown unwanted installers often distribute apps not available in the Play market. Among these, cn.feelcool.superfiles clearly stands out distributing almost exclusively unwanted apps not in the Play market. Seven of these installers likely come pre-installed indicating PPI agreements with vendors and carriers. Of the pre-installed installers, five can perform installations without user consent. However, we do not know whether they use that capability.
VII Related Work
Few studies have analyzed malware prevalence and distribution on real Android devices [33, 61, 67]. Recently, Gamba et al. [33] analyzed pre-installed apps in 2.7K Android devices. They discover that a significant fraction of pre-installed software exhibits potentially unwanted behavior like personal data collection and user tracking. Our work considers pre-installed bloatware as one distribution vector and compares it with other vectors. Furthermore, our device dataset is three orders of magnitude larger. Roundy et al. [61] propose an approach for detecting stalking apps. They evaluate the detection on 50M Android devices, during the period of 2017–2019, discovering 855 stalking apps in 172K devices. Our analysis, in comparison, uses a smaller device dataset for a fourth-month period. However, we analyze a large variety of threats against users.
Several studies have quantified malware in Google Play Store [74, 24] and third-party markets [77, 53, 57]. In comparison, our work measures malware distribution via multiple channels like the Play market store, alternative markets, browsers, IM, and PPI services. Prior work has analyzed Windows malware distribution through underground pay-per-install services [23], drive-by downloads [58, 38], free streaming services [59], and download portals [60, 35]. Results from these studies do not necessarily extrapolate on Android due to inherent platform differences.
Prior academic work identifies emerging trends in the Android malware ecosystem [82, 70, 31, 48, 71]. Suarez-Tangil et al. [71] conducts a behavioral analysis of 1.2M Android malware samples collected from malware feeds, over a period of eight years (from 2010-2017). We measure malware families prevalence on real devices while prior work uses malware feeds that may be biased towards highly polymorphic families. Yearly industrial threat reports analyze new threats in the Android malware ecosystem [12, 7, 9, 10]. A comparison is difficult since they measure prevalence by number of detections and not by number of devices.
VIII Limitations
In this section, we discuss limitations of our work and possible avenues for improvement.
Selection bias.
Our dataset presents some selection bias worth revisiting. First, the reputation logs only include devices with an AV installed. Devices without an AV may have a different prevalence of unwanted apps, which we hypothesize may be somewhat larger. For example, the AV client may block, or alert the user about, some unwanted installers, reducing the number of unwanted apps they would otherwise install. Thus, our prevalence estimates may be conservative when considering all mobile devices. Second, the geographic distribution is skewed towards countries where the security vendor has a larger market share. We observe some large countries like China, Indonesia, Pakistan, Bangladesh, and Nigeria may be underrepresented, but we still have tens of thousands of devices in China and several thousands in the others. Third, to avoid assigning unwanted installs to benign installers we focus our distribution vector analysis on the 412M (24%) install events for which we can recover the parent’s signer. This selection could be biased towards unwanted installers since they have a shorter TTL that helps in the recovery. This could bias VDR absolute numbers. To avoid this selection bias, we also present relative VDR values. In addition, we repeat the distribution vector analysis using the Full dataset of 1.7B install events (Table XI in the Appendix). Using the Full dataset some unwanted installs could be wrongly assigned to benign installers, but selection bias should be removed. Both sets of results are very similar, indicating that the Subset dataset has no significant sampling bias.
Pre-installed apps.
Previous works have considered pre-installed apps to be the ones installed under the /system/ directory in an Android device [33]. Unfortunately, our dataset does not include the APK’s installation path. In this work, we use two proxies to analyze pre-installed apps. First, apps signed by the device’s platform key are very likely pre-installed. Second, we classify as bloatware those apps signed by a carrier or device vendor for which we cannot identify their goal, but observe user reports labeling them as bloatware. We believe such bloatware is very likely to have been pre-installed. Still, in both cases we cannot fully guarantee the apps were pre-installed, so we are cautious and only say they may be.
User consent.
The reputation logs do not directly capture if an install had user consent. To understand which installers may perform installs without user consent, we have examined apps that request the INSTALL_PACKAGES permission, a prerequisite for silent installs. Unfortunately, a request for this permission does not necessarily mean that the app is performing silent installs. One caveat is that the app may have the permission, but may not use it, although that could change at any app update. Another caveat is that the permission may not be granted, e.g., for user-level apps. Still, requesting the permission may indicate an interest in performing silent installs (e.g., in rooted devices).
Play presence.
We only checked the presence of apps in the Play market once during February 2020. Some apps may have been available in the past, but had since been removed when we queried them, making our 24% estimate a lower bound. Prior work has shown that nearly half of all apps are removed from Play during a two year period and that privacy violations are an important reason for those removals [76]. Thus, our lower bound may be conservative, especially for unwanted apps, which may be more likely to be removed. Another caveat is that we only query the Play market by package name and do not check if the certificate of the app in the market matches the one in our dataset. Thus, we may say an app was in the market even if there is a certificate mismatch. Our methodology of a single query for each app at a fixed point in time, and using solely the package name, is the same used to estimate that only 9% of pre-installed apps are present in the Play market [33]. Since 87% of all installs come from Play, it makes sense that our prevalence is a larger 24% as the ratio is expected to increase over the device lifetime.
Malware vs PUP.
Our classification using AVClass shows that 60% of unwanted APKs are PUP and 40% malware, although the prevalence of both classes is almost identical. PUP prevalence could in reality be larger as AVClass by default considers a sample is malware, i.e., a sample is PUP only if enough grayware related keywords are found in its labels. Thus, it could underestimate PUP samples. Overall, our results highlight the importance of PUP in Android. However, as we discuss in Section II-C, more research is needed into how to cleanly delineate the boundary between PUP and malware, especially on Android.
Publisher clustering.
A publisher could use multiple app signing keys and certificates. We did not cluster certificates from the same publisher because we only had app metadata available. Prior approaches have leveraged the Subject DN [47], which in Android can be spoofed. Publishers using certificate polymorphism will be identified as multiple publishers, possibly resulting in a lower DR. Developing a technique to cluster signers is an interesting avenue for future work.
IX Conclusion
This work performs an analysis on unwanted apps distribution vectors on Android devices, including the official and alternative markets, as well as secondary vectors such as Web downloads, pay-per-install (PPI) services, bloatware, backup restoration, and even instant messaging (IM) tools. We identify that between 10% and 24% of users devices encounter at least one unwanted app. We reveal that the Play market is indeed the main app distribution vector of both benign and unwanted apps, while, it has the best defenses against unwanted apps. Alternative markets distribute fewer apps but have higher probability to be unwanted. Bloatware is another surprisingly high distribution vector. Web downloads are rare and much more risky even compared to alternative markets. Surprisingly, unwanted apps may survive users’ phone replacement due to the usage of automated backup tools. Finally, we observe that app distribution via commercial PPI services on Android is significantly lower compared to Windows.
Acknowledgments
This research was supported by the Regional Government of Madrid through grant BLOQUES-CM P2018/TCS-4339 and by the Spanish Government through the SCUM grant RTI2018-102043-B-I00. This research received funding from the European Union’s Horizon 2020 Research and Innovation Programme under Grant Agreement No. 786669. Any opinions, findings, and conclusions or recommendations expressed in this material are those of the authors or originators, and do not necessarily reflect the views of the sponsors.
References
- [1] Google Play Advertising ID. https://support.google.com/googleplay/android-developer/answer/6048248?hl=en.
- [2] Google Play Protect. https://www.android.com/play-protect/.
- [3] Iso 3166-1 alpha-2. https://en.wikipedia.org/wiki/ISO_3166-1_alpha-2.
- [4] PSA: disable Mobile Services Manager in System Apps. https://forum.xda-developers.com/galaxy-s9-plus/how-to/psa-disable-mobile-services-manager-apps-t3764366.
- [5] Coolreaper: The coolpad backdoor, 2014. https://www.paloaltonetworks.com/apps/pan/public/downloadResource?pagePath=/content/pan/en_US/resources/research/cool-reaper.
- [6] The Judy Malware: Possibly the largest malware campaign found on Google Play, May 2017. https://blog.checkpoint.com/2017/05/25/judy-malware-possibly-largest-malware-campaign-found-google-play/.
- [7] 2018 mobile threat landscape, 2018. https://www.trendmicro.com/vinfo/in/security/research-and-analysis/threat-reports/roundup/2018-mobile-threat-landscape.
- [8] Android ransomware: From android defender to doublelocker, 2018. https://www.welivesecurity.com/wp-content/uploads/2018/02/Android_Ransomware_From_Android_Defender_to_Doublelocker.pdf.
- [9] 2019 crowdstrike mobile threat landscape report, 2019. https://www.crowdstrike.com/blog/mobile-threat-report-2019-trends-and-recommendations/.
- [10] Android security and privacy 2018 year in review, 2019. https://source.android.com/security/reports/Google_Android_Security_2018_Report_Final.pdf.
- [11] Digital turbine reports fourth quarter and fiscal full year 2019 results, June 2019. https://content.equisolve.net/_35bb1d6ea2a3024c2d067486da749df4/mandalaydigital/news/2019-06-03_Digital_Turbine_Reports_Fourth_Quarter_and_Fiscal__577.pdf.
- [12] Mcafee mobile threat report, 2019. https://www.mcafee.com/enterprise/en-us/assets/reports/rp-mobile-threat-report-2019.pdf.
- [13] Privileged permission whitelisting, 2020. https://source.android.com/devices/tech/config/perms-whitelist.
- [14] H. Aghakhani, F. Gritti, F. Mecca, M. Lindorfer, S. Ortolani, D. Balzarotti, G. Vigna, and C. Kruegel. When Malware is Packin’Heat; Limits of Machine Learning Classifiers Based on Static Analysis Features. In Network and Distributed Systems Security Symposium, 2020.
- [15] K. Allix, T. F. Bissyandé, J. Klein, and Y. Le Traon. AndroZoo: Collecting Millions of Android Apps for the Research Community. In International Conference on Mining Software Repositories, 2016.
- [16] B. Andow, A. Nadkarni, B. Bassett, W. Enck, and T. Xie. A Study of Grayware on Google Play. In IEEE Security and Privacy Workshops, 2016.
- [17] Android. Provision devices. https://developers.google.com/android/work/play/emm-api/prov-devices.
- [18] Android. Package installer, 2020. https://developer.android.com/reference/android/content/pm/PackageInstaller.
- [19] Appsgeyser. https://appsgeyser.com/.
- [20] Avira. Potentially unwanted applications. https://www.avira.com/en/potentially-unwanted-applications.
- [21] D. Barrera, D. McCarney, J. Clark, and P. C. Van Oorschot. Baton: Certificate Agility for Android’s Decentralized Signing Infrastructure. In ACM Conference on Security and Privacy in Wireless & Mobile Networks, 2014.
- [22] N. Buchka and M. Kuzin. Attack on zygote: a new twist in the evolution of mobile threats, March 2016. https://securelist.com/attack-on-zygote-a-new-twist-in-the-evolution-of-mobile-threats/74032/.
- [23] J. Caballero, C. Grier, C. Kreibich, and V. Paxson. Measuring Pay-per-Install: The Commoditization of Malware Distribution. In USENIX Security Symposium, 2011.
- [24] B. Carbunar and R. Potharaju. A longitudinal study of the google app market. In IEEE/ACM International Conference on Advances in Social Networks Analysis and Mining, 2015.
- [25] K. Chen, P. Wang, Y. Lee, X. Wang, N. Zhang, H. Huang, W. Zou, and P. Liu. Finding unknown malice in 10 seconds: Mass vetting for new threats at the google-play scale. In USENIX Security Symposium, 2015.
- [26] J. Crussell, C. Gibler, and H. Chen. Attack of the clones: Detecting cloned applications on android markets. In European Symposium on Research in Computer Security, 2012.
- [27] E. Cunningham. Making it safer to get apps on android o, August 2017. https://android-developers.googleblog.com/2017/08/making-it-safer-to-get-apps-on-android-o.html.
- [28] K.-M. Cutler. Baidu Agrees To Buy Chinese Android App Distributor 91 Wireless For $1.9B, July 2013. https://techcrunch.com/2013/07/15/baidu-agrees-to-buy-chinese-android-app-distributor-91-wireless-for-1-9b/.
- [29] S. Demetriou, W. Merrill, W. Yang, A. Zhang, and C. A. Gunter. Free for all! assessing user data exposure to advertising libraries on android. In Network and Distributed Systems Security Symposium, 2016.
- [30] F. Dong, H. Wang, L. Li, Y. Guo, T. F. Bissyandé, T. Liu, G. Xu, and J. Klein. Frauddroid: Automated ad fraud detection for android apps. In ACM Joint Meeting on European Software Engineering Conference and Symposium on the Foundations of Software Engineering, 2018.
- [31] A. P. Felt, M. Finifter, E. Chin, S. Hanna, and D. Wagner. A survey of mobile malware in the wild. In ACM Workshop on Security and Privacy in Smartphones and Mobile Devices, 2011.
- [32] A. P. Felt, K. Greenwood, and D. Wagner. The Effectiveness of Application Permissions. In USENIX Conference on Web Application Development, 2011.
- [33] J. Gamba, M. Rashed, A. Razaghpanah, J. Tapiador, and N. Vallina-Rodriguez. An analysis of pre-installed android software. In IEEE Symposium on Security and Privacy, 2020.
- [34] S. Gatlan. Trojan Dropper Malware Found in Android App With 100M Downloads, August 2019. https://www.bleepingcomputer.com/news/security/trojan-dropper-malware-found-in-android-app-with-100m-downloads/.
- [35] A. Geniola, M. Antikainen, and T. Aura. A Large-Scale Analysis of Download Portals and Freeware Installers. In Nordic Conference on Secure IT Systems, 2017.
- [36] I. Golovin and A. Kivva. An advertising dropper in Google Play, August 2019. https://securelist.com/dropper-in-google-play/92496/.
- [37] Google. Unwanted software policy. https://www.google.com/about/unwanted-software-policy.html.
- [38] C. Grier, L. Ballard, J. Caballero, N. Chachra, C. J. Dietrich, K. Levchenko, P. Mavrommatis, D. McCoy, A. Nappa, A. Pitsillidis, et al. Manufacturing compromise: the emergence of exploit-as-a-service. In ACM Conference on Computer and Communications Security, 2012.
- [39] A. Hazum, F. He, I. Marom, B. Melnykov, and A. Polkovnichenko. Agent Smith: A New Species of Mobile Malware, July 2019. https://research.checkpoint.com/2019/agent-smith-a-new-species-of-mobile-malware/.
- [40] A. Holst. Mobile operating systems’ market share worldwide from January 2012 to December 2019, January 2020. https://www.statista.com/statistics/272698/global-market-share-held-by-mobile-operating-systems-since-2009/.
- [41] IronSource. https://www.ironsrc.com/.
- [42] IronSource Aura. https://company.ironsrc.com/enterprise-solutions/.
- [43] T. Kerns. There are now more than 2.5 billion active Android devices, May 2019. https://www.androidpolice.com/2019/05/07/there-are-now-more-than-2-5-billion-active-android-devices/.
- [44] A. Kivva. Everyone sees not what they want to see, June 2016. https://security.googleblog.com/2019/06/pha-family-highlights-triada.html.
- [45] P. Kotzias, L. Bilge, and J. Caballero. Measuring PUP Prevalence and PUP Distribution through Pay-Per-Install Services. In USENIX Security Symposium, 2016.
- [46] P. Kotzias, L. Bilge, P.-A. Vervier, and J. Caballero. Mind your Own Business: A Longitudinal Study of Threats and Vulnerabilities in Enterprises. In Network and Distributed Systems Security Symposium, 2019.
- [47] P. Kotzias, S. Matic, R. Rivera, and J. Caballero. Certified PUP: Abuse in Authenticode Code Signing. In ACM Conference on Computer and Communication Security, 2015.
- [48] M. Lindorfer, M. Neugschwandtner, L. Weichselbaum, Y. Fratantonio, V. Van Der Veen, and C. Platzer. Andrubis–1,000,000 apps later: A view on current android malware behaviors. In International Workshop on Building Analysis Datasets and Gathering Experience Returns for Security, 2014.
- [49] M. Luo, P. Laperdrix, N. Honarmand, and N. Nikiforakis. Time does not heal all wounds: A longitudinal analysis of security-mechanism support in mobile browsers. In NDSS, 2019.
- [50] MalwareBytes. How to avoid potentially unwanted programs, February 2016. https://blog.malwarebytes.com/101/2016/02/how-to-avoid-potentially-unwanted-programs/.
- [51] P. McDaniel. Bloatware comes to the smartphone. IEEE Security & Privacy, 10(4):85–87, 2012.
- [52] Microsoft. How microsoft identifies malware and potentially unwanted applications, March 2020. https://docs.microsoft.com/en-us/windows/security/threat-protection/intelligence/criteria.
- [53] Y. Y. Ng, H. Zhou, Z. Ji, H. Luo, and Y. Dong. Which android app store can be trusted in china? In IEEE Annual Computer Software and Applications Conference, 2014.
- [54] Norton. What is grayware?, August 2015. https://uk.norton.com/norton-blog/2015/08/what_is_grayware.html.
- [55] M. Oltrogge, E. Derr, C. Stransky, Y. Acar, S. Fahl, C. Rossow, G. Pellegrino, S. Bugiel, and M. Backes. The Rise of the Citizen Developer: Assessing the Security Impact of Online App Generators. In IEEE Symposium on Security and Privacy, 2018.
- [56] A. Orozco. Trojan looks to “Wrob” Android users, October 2013. https://blog.malwarebytes.com/cybercrime/2013/10/trojan-looks-to-wrob-android-users/.
- [57] T. Petsas, A. Papadogiannakis, M. Polychronakis, E. P. Markatos, and T. Karagiannis. Measurement, modeling, and analysis of the mobile app ecosystem. ACM Transactions on Modeling and Performance Evaluation of Computing Systems (TOMPECS), 2(2):1–33, 2017.
- [58] N. Provos, P. Mavrommatis, M. Rajab, and F. Monrose. All your iframes point to us. 2008.
- [59] M. Z. Rafique, T. Van Goethem, W. Joosen, C. Huygens, and N. Nikiforakis. It’s free for a reason: Exploring the ecosystem of free live streaming services. In Network and Distributed System Security Symposium, 2016.
- [60] R. Rivera, P. Kotzias, A. Sudhodanan, and J. Caballero. Costly freeware: a systematic analysis of abuse in download portals. IET Information Security, 13(1):27–35, 2019.
- [61] K. A. Roundy, P. B. Mendelberg, N. Dell, D. McCoy, D. Nissani, T. Ristenpart, and A. Tamersoy. The many kinds of creepware used for interpersonal attacks. In IEEE Symposium on Security and Privacy, 2020.
- [62] Seattlecloud. https://seattleclouds.com/.
- [63] M. Sebastian, R. Rivera, P. Kotzias, and J. Caballero. Avclass: A tool for massive malware labeling. In Research in Attacks, Intrusions, and Defenses, 2016.
- [64] S. Sebastián and J. Caballero. Towards Attribution in Mobile Markets: Identifying Developer Account Polymorphism. In ACM Conference on Computer and Communication Security, 2020.
- [65] S. Shekhar, M. Dietz, and D. S. Wallach. Adsplit: Separating smartphone advertising from applications. In USENIX Security Symposium, 2012.
- [66] S. Shen. Setting the Record Straight on Moplus SDK and the Wormhole Vulnerability, November 2015. https://blog.trendmicro.com/trendlabs-security-intelligence/setting-the-record-straight-on-moplus-sdk-and-the-wormhole-vulnerability/.
- [67] Y. Shen, N. Evans, and A. Benameur. Insights into rooted and non-rooted android mobile devices with behavior analytics. In Annual ACM Symposium on Applied Computing, 2016.
- [68] S. Son, D. Kim, and V. Shmatikov. What mobile ads know about mobile users. In Network and Distributed Systems Security, 2016.
- [69] R. Stevens, C. Gibler, J. Crussell, J. Erickson, and H. Chen. Investigating user privacy in android ad libraries. In Workshop on Mobile Security Technologies, volume 10, 2012.
- [70] G. Suarez-Tangil and G. Stringhini. Eight years of rider measurement in the android malware ecosystem: Evolution and lessons learned, 2018.
- [71] C. Tang, S. Chen, L. Fan, L. Xu, Y. Liu, Z. Tang, and L. Dou. A large-scale empirical study on industrial fake apps. In IEEE/ACM International Conference on Software Engineering: Software Engineering in Practice (ICSE-SEIP), 2019.
- [72] V. F. Taylor and I. Martinovic. To Update or not to Update: Insights from a Two-Year Study of Android App Evolution. In ACM Asia Conference on Computer and Communications Security, 2017.
- [73] K. Thomas, J. A. E. Crespo, R. Rastil, J.-M. Picodi, L. Ballard, M. A. Rajab, N. Provos, E. Bursztein, and D. Mccoy. Investigating Commercial Pay-Per-Install and the Distribution of Unwanted Software. In USENIX Security Symposium, 2016.
- [74] N. Viennot, E. Garcia, and J. Nieh. A measurement study of google play. In ACM International Conference on Measurement and Modeling of Computer Systems, 2014.
- [75] VirusTotal. http://www.virustotal.com/.
- [76] H. Wang, H. Li, L. Li, Y. Guo, and G. Xu. Why are Android Apps Removed from Google Play? A Large-Scale Empirical Study. In IEEE/ACM International Conference on Mining Software Repositories, 2018.
- [77] H. Wang, Z. Liu, J. Liang, N. Vallina-Rodriguez, Y. Guo, L. Li, J. Tapiador, J. Cao, and G. Xu. Beyond google play: A large-scale comparative study of chinese android app markets. In Internet Measurement Conference, 2018.
- [78] Wordpress2apk. https://wp2apk.com/index.php.
- [79] T.-F. Yen, V. Heorhiadi, A. Oprea, M. K. Reiter, and A. Juels. An Epidemiological Study of Malware Encounters in a Large Enterprise. In ACM Conference on Computer and Communications Security, 2014.
- [80] M. Zheng, M. Sun, and J. C. Lui. Droidray: a security evaluation system for customized android firmwares. In ACM Symposium on Information, Computer and Communications Security, 2014.
- [81] W. Zhou, Y. Zhou, X. Jiang, and P. Ning. Detecting repackaged smartphone applications in third-party android marketplaces. In ACM Conference on Data and Application Security and Privacy, 2012.
- [82] Y. Zhou and X. Jiang. Dissecting android malware: Characterization and evolution. In IEEE Symposium on Security and Privacy, 2012.
- [83] Y. Zhou, Z. Wang, W. Zhou, and X. Jiang. Hey, you, get off of my market: detecting malicious apps in official and alternative android markets. In Network and Distributed Systems Security Symposium, 2012.
- [84] S. Zhu, J. Shi, L. Yang, B. Qin, Z. Zhang, L. Song, and G. Wang. Measuring and Modeling the Label Dynamics of Online Anti-Malware Engines. In USENIX Security Symposium, 2020.
Figure 3 shows the distribution of unwanted APKs per device, for devices with at least one encounter. The median is 2.0, the average 5.0, and the standard deviation 1497.0. The y-axis is logarithmic and the x-axis s cut at x=100.
Appendix A Additional Results
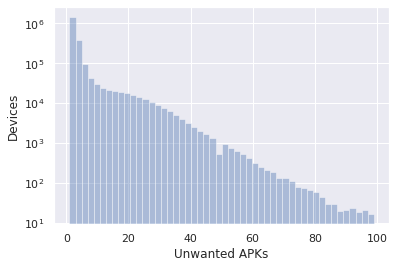
| Installs | Installer | Children | |||||
| Vector | All | Unw. | Pkg. | Pkg. | Sig. | VDR | RVDR |
| Playstore | 92.1% | 75.9% | 2 | 2.3M | 1.5M | 0.6% | 1.0 |
| Alt-market | 2.7% | 8.0% | 88 | 208K | 125K | 3.9% | 6.5 |
| Backup | 0.6% | 1.2% | 31 | 595K | 397K | 0.9% | 1.5 |
| Pkginstaller | 1.0% | 11.6% | 11 | 527K | 332K | 2.1% | 3.5 |
| Bloatware | 0.3% | 1.8% | 38 | 3K | 1.7K | 1.3% | 2.1 |
| PPI | 0.3% | 0.2% | 20 | 2K | 1.7K | 0.3% | 0.5 |
| Fileshare | <0.1% | <0.1% | 13 | 10K | 8.7K | 1.2% | 2.0 |
| Themes | <0.1% | <0.1% | 2 | 1.3K | 16 | 0.1% | 0.1 |
| Browser | <0.1% | 0.1% | 40 | 9.8K | 6.9K | 3.6% | 6.0 |
| MDM | <0.1% | <0.1% | 7 | 789 | 506 | 0.3% | 0.5 |
| Filemanager | <0.1% | <0.1% | 32 | 19K | 14K | 2.3% | 3.8 |
| IM | <0.1% | <0.1% | 10 | 2K | 1.2K | 2.8% | 4.6 |
| Other | <0.1% | 0.2% | 127 | 16K | 10.7K | 3.5% | 5.8 |
| Unclassified | 3.0% | 0.9% | 79K | 283K | 109.5K | 0.8% | 1.3 |
| All | 100.0% | 100.0% | 79K | 2.8M | 1.8M | 1.7% | 2.8 |
Table XI shows the summary of app distribution for all 1.7B installation events for which we could identify an installation vector, independent of the availability of parent information (i.e., installer hash and installer signer). The changes in the VDR column, compared to Table VII, shows minimal changes. The largest change is in the VDR value of the alternative markets that increases by 0.7% and the unclassified apps vector by 0.7%. The rest are increased at most by 0.3%.