SOrT-ing VQA Models : Contrastive Gradient Learning
for Improved Consistency
Abstract
Recent research in Visual Question Answering (VQA) has revealed state-of-the-art models to be inconsistent in their understanding of the world – they answer seemingly difficult questions requiring reasoning correctly but get simpler associated sub-questions wrong. These sub-questions pertain to lower level visual concepts in the image that models ideally should understand to be able to answer the higher level question correctly. To address this, we first present a gradient-based interpretability approach to determine the questions most strongly correlated with the reasoning question on an image, and use this to evaluate VQA models on their ability to identify the relevant sub-questions needed to answer a reasoning question. Next, we propose a contrastive gradient learning based approach called Sub-question Oriented Tuning (SOrT) which encourages models to rank relevant sub-questions higher than irrelevant questions for an image, reasoning-question pair. We show that SOrT improves model consistency by upto 6.5% points over existing baselines, while also improving visual grounding.
1 Introduction
Current visual question answering (VQA) models struggle with consistency. They often correctly answer complex reasoning questions, i.e, those requiring common sense knowledge and logic on top of perceptual capabilities, but fail on associated low level perception questions, i.e., those directly related to the visual content in the image. For e.g., in Fig 1, models answer the reasoning question “Was this taken in the daytime?” correctly, but fail on the associated perception question “Is the sky bright?” indicating that the models likely answered the reasoning question correctly for the wrong reason(s). In this work, we explore the usefulness of leveraging information about sub-questions, i.e., low level perception questions relevant to a reasoning question, and irrelevant questions, i.e., any other questions about the image that are unrelated to the reasoning question, to improve consistency in VQA models.
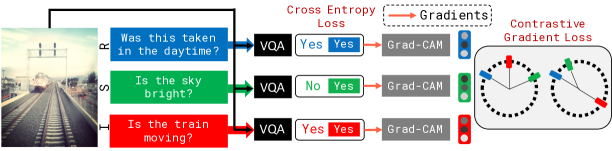
Selvaraju et al. (2020) have studied this problem and introduced the VQA-Introspect dataset that draws a distinction between higher-level reasoning questions and lower-level perception sub-questions. We augment this dataset with additional perception questions from the VQAv2 dataset such that each image, reasoning question pair contains a set of relevant perception questions, which we refer to as sub-questions (e.g.,“Is the sky bright?” in Fig 1) and irrelevant perception questions, which we refer to as irrelevant questions (e.g., “Is the train moving?” in Fig 1) throughout this paper.
We use Gradient-based Class Activation Mapping (Grad-CAM) vectors (Selvaraju et al., 2019a) – a faithful function of the model’s parameters, question, answer and image – to propose an interpretability technique that determines the questions most strongly correlated with a reasoning question for a model. This is measured by ranking questions based on the cosine similarity of their Grad-CAM vectors with that of the reasoning question. We find that even top-performing VQA models often rank irrelevant questions higher than relevant questions.
Motivated by this, we introduce a new approach based on contrastive gradient learning to fine-tune a VQA model by adding a loss term that enforces relevant sub-questions to be ranked higher than irrelevant questions while answering a reasoning question. This is achieved by forcing the cosine similarity of the reasoning question’s Grad-CAM vector with that of a sub-question to be higher than with that of an irrelevant question. We find that our approach improves the model’s consistency, defined as the frequency with which the model correctly answers a sub-question given that it correctly answers the reasoning question.
Additionally, we assess the effects of our approach on visual grounding (i.e, does the model look at the right visual regions while answering the question?) by comparing Grad-CAM heatmaps with human attention maps collected in the VQA-HAT dataset (Das et al., 2016). We find that our approach of enforcing this language-based alignment through better ranking of sub-questions also improves visual grounding.
2 Related Work
Visual Question Answering. The VQA task (Agrawal et al., 2015) requires answering a free form natural language question about visual content in an image. Previous work has shown that models often do well on the task by exploiting language and dataset biases Agrawal et al. (2017); Zhang et al. (2015); Ramakrishnan et al. (2018); Guo et al. (2019); Manjunatha et al. (2018). In order to evaluate the consistency of these models, Selvaraju et al. (2020) collected a new dataset, VQA-Introspect, containing human explanations in the form of sub-questions and answers for reasoning questions in the VQA dataset.
Model Interpretability. While prior work has attempted to explain VQA decisions in the visual modality Selvaraju et al. (2019a, b); Qiao et al. (2017), the multi-modal task of VQA has a language component which cannot always be explained visually, i.e., visual regions can be insufficient to express underlying concepts Goyal et al. (2016); Hu et al. (2017). Liang et al. (2019) introduced a spatio-temporal attention mechanism to interpret a VQA model’s decisions across a set of consecutive frames. Our work, operating on a single image, interprets the model’s decisions using Grad-CAM vectors which are more faithful to the model’s parameters than attention maps. Park et al. (2018) and Wu and Mooney (2019) generate textual justifications through datasets curated with human explanations. Our approach using Grad-CAM vectors differs by being fully self-contained and faithful to the model, requiring no additional parameters for interpreting its decisions.
Aligning network importances. Selvaraju et al. (2019b) introduced an approach to align visual explanations with regions deemed important by humans, thereby improving visual grounding in VQA models. In followup work, Selvaraju et al. (2020) introduced an approach to align attention maps for the reasoning question and associated perception sub-questions from VQA-Introspect to improve language based grounding. In contrast to attention maps, our work encourages Grad-CAM vectors of a reasoning question to be closer to those of sub-questions and farther away from those of irrelevant questions. Intuitively, this means that we are making the neurons used while answering a reasoning question to be similar to those used while answering a sub-question and dissimilar to those used while answering an irrelevant question. Our experiments show that this alignment improves the model’s consistency and visual grounding.
3 Approach
3.1 Preliminaries
Grad-CAM. Grad-CAM was introduced by Selvaraju et al. (2019a) as a technique to obtain visual explanations from any CNN-based deep neural network. In this work, we adopt Grad-CAM to compute the contribution of a neuron at the layer in a VQA model where the vision and language modalities are combined. This is computed by taking the gradient of the predicted output class score with respect to the neuron activations in the layer. We then point-wise multiply this with the corresponding activations to obtain our Grad-CAM importance vector. Specifically, if denotes the score of the ground-truth output class and the activations of layer of the model, the Grad-CAM importance vector (or simply, Grad-CAM vector) is computed as follows,
| (1) |
Unlike Grad-CAM visualizations, these vectors are not visually interpretable as they are not computed on the final convolutional layer of the CNN.
Consistency in VQA models. As defined in Selvaraju et al. (2020), the consistency of a VQA model refers to the proportion of sub-questions answered correctly, given that their corresponding reasoning questions were answered correctly. If a model is inconsistent, it is likely relying on incorrect perceptual signals or biases in the dataset to answer questions. Models that are consistent and based on appropriate perceptual signals are more likely to be reliable, interpretable and trustworthy.
3.2 Sub-question Oriented Tuning
The key idea behind Sub-question Oriented Tuning (SOrT) is to encourage the neurons most strongly relied on (as assessed by Grad-CAM vectors) while answering a reasoning question (“Was this taken in the daytime?” in Fig 1) to be similar to those used while answering the sub-questions (“Is the sky bright?”) and dissimilar to those used while answering the irrelevant questions (“Is the train moving?”). This enforces the model to use the same visual and lingustic concepts while making predictions on the reasoning question and the sub-questions. Our loss has the following two components.
Contrastive Gradient Loss. With the Grad-CAM vectors of the reasoning question , sub-question and irrelevant question , we formalize our intuition of a contrastive gradient loss as,
| (2) |
Binary Cross Entropy Loss. To retain performance of the model on the base task of answering questions correctly, we add a Binary Cross Entropy Loss term () that penalizes incorrect answers for all the questions.
Total Loss. Let , , , , and represent the predicted and ground-truth answers for the reasoning, sub-questions and irrelevant questions respectively, and , , be tunable hyper-parameters. Our total loss is,
| (3) |
4 Experiments
| Consistency Metrics | Accuracy Metrics | Ranking Metrics | |||||||||||
|---|---|---|---|---|---|---|---|---|---|---|---|---|---|
| Method | R✓ S✓ | R✓ S✗ | R✗ S✓ | R✗ S✗ | Consistency% | Reas. Accuracy% | VQA Accuracy% | MP@1 | Ranking Accuracy | MRR | WPR | ||
| Pythia | 50.61 | 19.88 | 17.15 | 12.36 | 71.81 | 75.15 | 64.95 | 57.75 | 30.33 | 71.87 | 52.75 | ||
| Pythia + SQuINT | 53.03 | 17.58 | 18.63 | 10.74 | 75.10 | 74.95 | 64.75 | 55.87 | 29.45 | 71.49 | 39.20 | ||
| Pythia + SOrT (only SQ) | 54.34 | 15.44 | 20.08 | 10.14 | 77.87 | 73.78 | 63.69 | 59.47 | 30.73 | 74.22 | 41.06 | ||
| Pythia + SOrT (SQ + IQ) | 54.62 | 15.09 | 20.31 | 9.97 | 78.35 | 74.18 | 64.07 | 61.73 | 31.90 | 74.43 | 40.03 | ||
Dataset. Our dataset pools VQA-Introspect and VQAv2 such that for every reasoning question in VQA-Introspect, we have a set of sub-question, answer pairs and a set of irrelevant question, answer pairs. The training/val splits contain 54,345/20,256 image, reasoning question pairs with an average of 2.58/2.81 sub-questions and 7.63/5.80 irrelevant questions for each pair.
Baselines. We compare SOrT against the following baselines: 1) Pythia. 2) SQuINT in which, as discussed in Sec 2, Selvaraju et al. (2020) fine-tuned Pythia with an attention alignment loss to ensure that the model looks at the same regions when answering the reasoning and sub-questions. 3) SOrT with only sub-questions in which we discard the irrelevant questions associated with a reasoning question and just align the Grad-CAM vectors of the sub-questions with that of the reasoning question. This ablation benchmarks the usefulness of the contrastive nature of our loss function.
4.1 Metrics
Ranking. We use four metrics to assess the capability of a model to correctly rank its sub-questions.
1. Mean Precision@1 (MP@1). Proportion of image, reasoning question pairs for which the highest ranked question is a sub-question.
2. Ranking Accuracy. Proportion of image, reasoning question pairs whose sub-questions are all ranked higher than their irrelevant questions .
3. Mean Reciprocal Rank (MRR). Average value of the highest reciprocal rank of a sub-question among all the image, reasoning question pairs. Higher is better.
4. Weighted Pairwise Rank (WPR) Loss. For pairs of incorrectly ranked sub, irrelevant questions, this computes the differences of their similarity scores with the reasoning question. Averaged across all pairs, this computes the extent by which rankings are incorrect. Lower is better.
Model Performance.
1) Quadrant Analysis.
a. R✓ S✓ The pairs where reasoning and sub-questions are both correctly answered.
b. R✓ S✗ The pairs where reasoning question is correctly answered, while the sub-question is incorrectly answered.
c. R✗ S✓ The pairs where reasoning question is incorrectly answered, while the sub-question is correctly answered.
d. R✗ S✗ The pairs where reasoning and sub-questions are both incorrectly answered.
2) Consistency. The frequency with which a model correctly answers a sub-question given that it correctly answers the reasoning question.
| (4) |
3) Reasoning Accuracy. The accuracy on the reasoning split of VQAv2 dataset, and
4) Overall Accuracy. Accuracy on the VQAv2 validation set.
More details on the metrics are in the Appendix.
4.2 Results
We attempt to answer the following questions:
Does SOrT help models better identify the perception questions relevant for answering a reasoning question?
As described in Sec 3.2, the model ranks perception questions (sub-questions and irrelevant questions) associated with an image, reasoning question pair according to the cosine similarities of their Grad-CAM vectors with that of the reasoning question.
As seen in Table 1, we find that our approach outperforms its baselines on nearly all the ranking metrics.
We observe gains of 4-6% points on MP@1 and MRR, and 1.5-2.5% points on Ranking Accuracy.
Likewise, the improvement in WPR - the soft metric that computes the extent by which rankings are incorrect - is a substantial 12% points over Pythia.
This confirms that our approach helps better distinguish between the relevant and irrelevant perceptual concepts needed for answering a reasoning question.
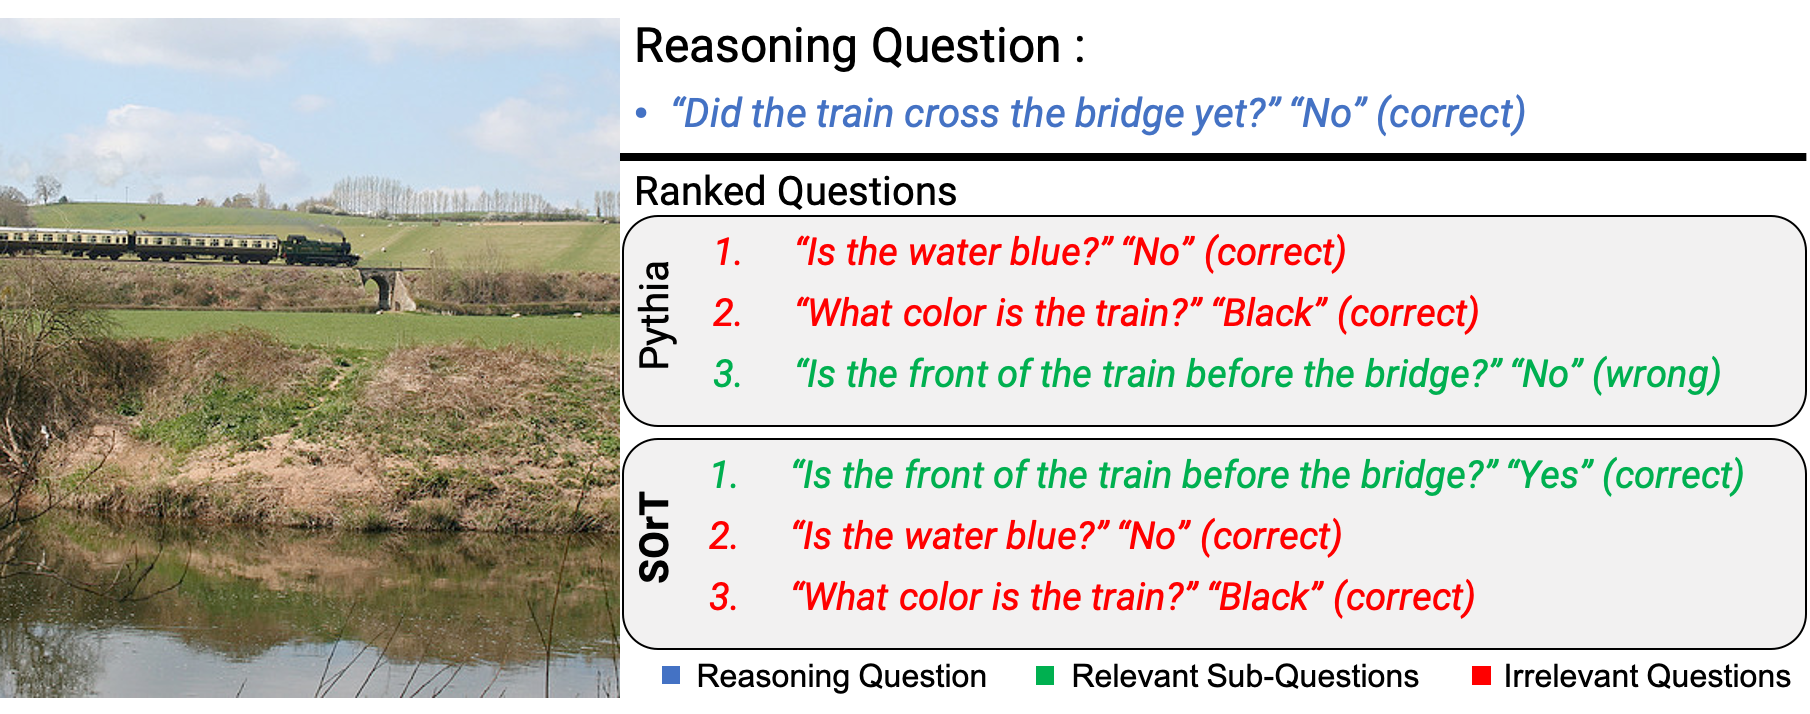
Does recognizing relevant sub-questions make models more consistent? We find that the improved ranking of sub-questions through SOrT improves consistency by 6.5% points over Pythia, 3.25% points over SQuINT and 0.5% points over an approach that just uses sub-questions while discarding irrelevant questions111These numbers are averaged values from 10-fold cross validation runs on the val split. The std dev values observed were 0.3 for Pythia and 0.41 for SQuINT and SOrT.. As seen in Table 1, the consistency gains are due to significant improvements in the R✓ S✓ and R✓ S✗ quadrants. As seen in Table 1, the consistency gains are due to significant improvements in the R✓ S✓ and R✓ S✗ quadrants. This comes at the expense of a drop in overall accuracy and reasoning accuracy by 1% point, likely due to the active disincentization of memorizing language priors and dataset biases through our contrastive gradient learning approach.
Gradient-based explanations have been shown to be more faithful to model decisions compared to attention maps Selvaraju et al. (2019b). Our results confirm this by showing that aligning Grad-CAM vectors for reasoning and sub-questions makes models more consistent compared to SQuINT, which aligns their attention maps. Fig 2 shows an example of improved consistency using SOrT. The Pythia model answers its sub-question incorrectly. Our approach ranks the relevant sub-question higher than the irrelevant ones and answers it correctly – thus improving consistency.
These results illustrate a common trade-off among multiple concurrently desirable characteristics of VQA models: accuracy, consistency, interpretability. Building models that maximize all these characteristics presents a challenging problem for future work.
Does enforcing language-based alignment lead to better visual grounding? To evaluate this, we compute visual grounding through Grad-CAM applied on the final convolutional layer. We then compute the correlation of Grad-CAM heatmaps with the validation split of the VQA-Human ATtenion (VQA-HAT) dataset Das et al. (2016), comprising 4,122 attention maps. This dataset contains human-annotated ‘ground truth’ attention maps which indicate the regions humans chose to look at while answering questions about images in the VQAv1 dataset. The proposed method to compare human and model-based attention maps in this work was to rank their pixels according to their spatial attention, and then compute the correlation between these two ranked lists.
We find that our approach gets a Spearman rank correlation of , versus for Pythia and for SQuINT. These statistically significant improvements indicate that enforcing language-based alignment during training improves visual grounding on an unseen dataset.
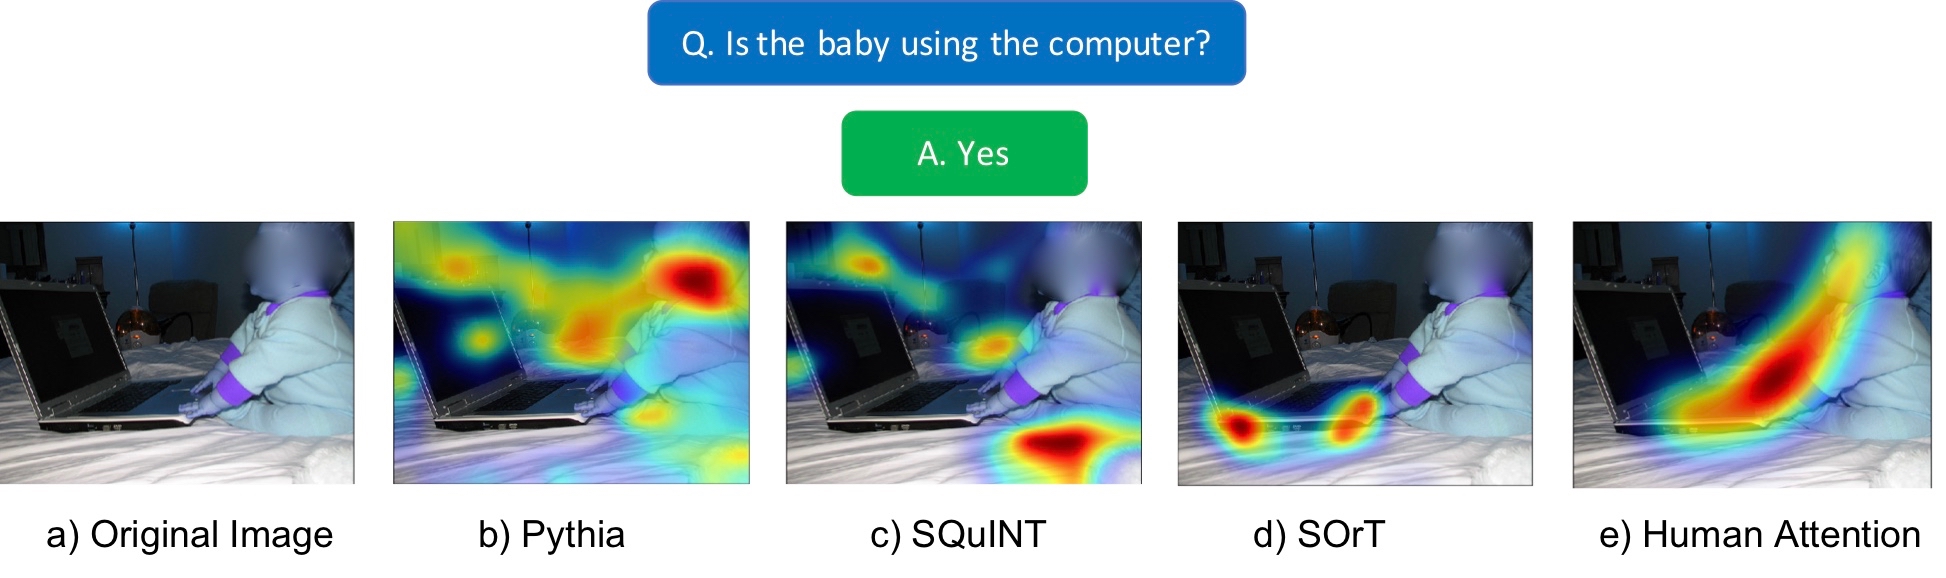
A qualitative example that demonstrates the superior visual grounding of SOrT compared to its baselines is shown in Fig 3. For the question Is the baby using the computer? and its corresponding answer Yes, we see that the Grad-CAM heatmap generated by SOrT is closest to that of the human attention map. It is also the only heatmap in this example that actually points to the fingers of the child, which is the essential visual component for answering the question.
5 Discussion
In this work, we seek to improve consistency in VQA. We first develop language-based interpretability metrics that measure the relevance of a lower-level perception question while answering a higher-level reasoning question. Evaluating state-of-the-art VQA models on these metrics reveals that these models often rank irrelevant questions higher than relevant ones. To remedy this, we present SOrT (Sub-question Oriented Tuning), a contrastive gradient learning based approach for teaching VQA models to distinguish between relevant and irrelevant perceptual concepts while answering a reasoning question. SOrT aligns Grad-CAM vectors of reasoning questions with those of sub-questions, while distancing them from those of irrelevant questions. We demonstrate SOrT’s effectiveness at making VQA models more consistent without majorly affecting accuracy, while also improving visual grounding.
6 Acknowledgements
The Georgia Tech effort was supported in part by NSF, AFRL, DARPA, ONR YIPs, ARO PECASE, Amazon. The views and conclusions contained herein are those of the authors and should not be interpreted as necessarily representing the official policies or endorsements, either expressed or implied, of the U.S. Government, or any sponsor.
References
- Agrawal et al. (2017) Aishwarya Agrawal, Dhruv Batra, Devi Parikh, and Aniruddha Kembhavi. 2017. Don’t just assume; look and answer: Overcoming priors for visual question answering.
- Agrawal et al. (2015) Aishwarya Agrawal, Jiasen Lu, Stanislaw Antol, Margaret Mitchell, C. Lawrence Zitnick, Dhruv Batra, and Devi Parikh. 2015. Vqa: Visual question answering.
- Das et al. (2016) Abhishek Das, Harsh Agrawal, C. Lawrence Zitnick, Devi Parikh, and Dhruv Batra. 2016. Human Attention in Visual Question Answering: Do Humans and Deep Networks Look at the Same Regions? In Conference on Empirical Methods in Natural Language Processing (EMNLP).
- Goyal et al. (2016) Yash Goyal, Akrit Mohapatra, Devi Parikh, and Dhruv Batra. 2016. Towards transparent ai systems: Interpreting visual question answering models.
- Guo et al. (2019) Yangyang Guo, Zhiyong Cheng, Liqiang Nie, Yibing Liu, Yinglong Wang, and Mohan Kankanhalli. 2019. Quantifying and alleviating the language prior problem in visual question answering.
- Hu et al. (2017) Ronghang Hu, Jacob Andreas, Marcus Rohrbach, Trevor Darrell, and Kate Saenko. 2017. Learning to reason: End-to-end module networks for visual question answering. In The IEEE International Conference on Computer Vision (ICCV).
- Liang et al. (2019) Junwei Liang, Lu Jiang, Liangliang Cao, Yannis Kalantidis, Li-Jia Li, and Alexander G. Hauptmann. 2019. Focal visual-text attention for memex question answering. IEEE Transactions on Pattern Analysis and Machine Intelligence, 41(8):1893–1908.
- Manjunatha et al. (2018) Varun Manjunatha, Nirat Saini, and Larry S. Davis. 2018. Explicit bias discovery in visual question answering models.
- Park et al. (2018) Dong Huk Park, Lisa Anne Hendricks, Zeynep Akata, Anna Rohrbach, Bernt Schiele, Trevor Darrell, and Marcus Rohrbach. 2018. Multimodal explanations: Justifying decisions and pointing to the evidence.
- Qiao et al. (2017) Tingting Qiao, Jianfeng Dong, and Duanqing Xu. 2017. Exploring human-like attention supervision in visual question answering.
- Ramakrishnan et al. (2018) Sainandan Ramakrishnan, Aishwarya Agrawal, and Stefan Lee. 2018. Overcoming language priors in visual question answering with adversarial regularization.
- Selvaraju et al. (2019a) Ramprasaath R. Selvaraju, Michael Cogswell, Abhishek Das, Ramakrishna Vedantam, Devi Parikh, and Dhruv Batra. 2019a. Grad-cam: Visual explanations from deep networks via gradient-based localization. International Journal of Computer Vision, 128(2):336–359.
- Selvaraju et al. (2019b) Ramprasaath R. Selvaraju, Stefan Lee, Yilin Shen, Hongxia Jin, Shalini Ghosh, Larry Heck, Dhruv Batra, and Devi Parikh. 2019b. Taking a hint: Leveraging explanations to make vision and language models more grounded.
- Selvaraju et al. (2020) Ramprasaath R. Selvaraju, Purva Tendulkar, Devi Parikh, Eric Horvitz, Marco Ribeiro, Besmira Nushi, and Ece Kamar. 2020. Squinting at vqa models: Interrogating vqa models with sub-questions.
- Wu and Mooney (2019) Jialin Wu and Raymond J. Mooney. 2019. Faithful multimodal explanation for visual question answering. In Proceedings of the Second BlackboxNLP Workshop at ACL, pages 103–112, Florence, Italy.
- Zhang et al. (2015) Peng Zhang, Yash Goyal, Douglas Summers-Stay, Dhruv Batra, and Devi Parikh. 2015. Yin and yang: Balancing and answering binary visual questions.
Appendix A Appendices
A.1 Experimental Details
A.1.1 Algorithms
We use the Pythia model for our experiments. Specifically, for our SOrT approach, we compute Grad-CAM vectors for the reasoning question, sub-questions and irrelevant questions on each image at the layer where the vision and language modalities are combined. We then use customized losses described in Sec 3.2 of the paper. The mathematical computation of consistency is described in Sec 4.1, while the ranking metrics are described below.
Mean Precision@1 (MP@1). For a given ordering of related questions (based on 1 of the 3 similarity scores), we compute the fraction of pairs in which a relevant perception sub-question was ranked the highest, i.e, had the highest similarity score with that of the reasoning question. This is equivalent to setting a bare-bones expectation of reasoning ability for the model - “Among all the related questions for a pair, was atleast the highest ranked related question a relevant perception sub-question?”
This is illustrated in an example below across two sets.
Example Query 1 : “What is the capital of the USA?”
Predicted Ranking 1 : [“New York”, “Washington DC”, “San Francisco”]
Ground Truth Answers 1 : [0, 1, 0]
Example Query 2 : “Where is the Golden Gate Bridge located?”
Predicted Ranking 2 : [“San Francisco”, “Atlanta”, “Los Angeles”]
Ground Truth Answers 2 : [1, 0, 0]
Across these two examples, the Mean Precision@1 value would be since only one of them has its highest ranked item as a correct answer.
Ranking Accuracy. This computes the proportion of pairs in which all the relevant perception sub-questions are ranked higher than the irrelevant questions. This would represent a perfect ranking capability of the model.
Example Query 1 : “Cities in Asia.”
Predicted Ranking 1 : [“Stockholm”, “Beijing”, “New Delhi”]
Ground Truth Answers 1 : [0, 1, 1]
Example Query 2 : “Planets in the solar system.”
Predicted Ranking 2 : [“Neptune”, “Jupiter”, “Phobos”]
Ground Truth Answers 2 : [1, 1, 0]
The combined Ranking Accuracy across these two examples would be since all the correct answers are ranked higher than the incorrect ones only in the second set.
Mean Reciprocal Rate (MRR). This is a variation of MP@1 which captures the highest rank of a relevant item in a list. In our case, the reciprocal rank is concerned with the highest rank of a relevant perception sub-question among all the ranked related questions for a pair. The reciprocal of this highest relevant rank is averaged across the entire dataset. This is represented in the example below.
Example Query 1 : “What is the capital of the USA?”
Predicted Ranking 1 : [“New York”, “Washington DC”, “San Francisco”]
Ground Truth Answers 1 : [0, 1, 0]
Example Query 2 : “Where is the Golden Gate Bridge located?”
Predicted Ranking 2 : [“San Francisco”, “Atlanta”, “Los Angeles”]
Ground Truth Answers 2 : [1, 0, 0]
Across these two examples, the MRR could be calculated as follows :
| (5) |
Weight Pairwise Rank (WPR) Loss. All the above metrics only account for the ranking of the candidate questions for a given pair, but do not consider the extent by which these questions differ in their rankings. Concretely, to have a comprehensive understanding of the relevance of each question, we need to account for the magnitude of their similarity scores with the reasoning question in our overall metric.
For a pair, we create a parallel list of ranked questions in which all the relevant perception sub-questions are higher than the other questions, while retaining the same similarity scores as computed for the originally ranked list. We then compare these two lists pair-wise, i.e, in each index, and sum up the differences of the similarity scores if the rankings are different between the two lists. This provides us a way to measure not just the deviation from the desired order of rankings but also the magnitude of the differences in similarity scores which are responsible for the erroneous rankings. If could be represented as the set of size containing all such incorrectly ranked pairs with scores (, ), we could compute the WPR loss for each set as the sum of the absolute values of the differences between each and .
| (6) |
This is then averaged across the entire dataset.
We illustrate an example for a single set.
Query : ”Which of these is a national capital?”
Predicted Ranking With Scores : [(“Mexico City”, 0.9), (“Miami”, 0.8), (“Copenhagen”, 0.7)]
Ground Truth Answers : [1, 0, 1]
Parallel List w.r.t Ground Truth Answers : [(“Mexico City”, 0.9), (“Copenhagen”, 0.7), (“Miami”, 0.8)]
| (7) |
A.1.2 Source Code
Our source code is publicly accessible at https://github.com/sameerdharur/sorting-vqa.
A.1.3 Computing Infrastructure
The computing infrastructure used for training and running the models described in the paper was 1 NVIDIA TITAN Xp GPU.
A.1.4 Runtime
The average training time for the model on each combination of hyperparameters was roughly 12 hours.
A.1.5 Parameters
The details on the parameters of the model can be found in the Pythia paper referenced in the main section.
A.1.6 Validation Performance
The results of the validation performance on each of the different metrics have been included in Sec 4.2 of the main section. The metrics have been explained above, with the source code linked above.
A.1.7 Hyperparameter Search
For the best performing models, the values of described in the losses of Sec 3.2 are . These values were selected based on the differing scales of the loss components and chosen from running hyperparameter sweeps. The rest of the hyperparameters were unchanged from those reported for the best performing Pythia model.
A total of hyperparameter trial runs were conducted with and ranging from 0.025 to 25, and ranging from - to .
These values were picked by a combination of uniform sampling and random tuning, and were optimized on a combination of consistency and accuracy. As mentioned in Sec 4.2, the expected validation results fall within the statistical range of the results defined by a standard deviation of 0.3 and 0.41 for Pythia and SQuINT/SOrT.
A.1.8 Datasets
As detailed in Sec 4, our dataset is a combination of the VQA-Introspect and VQAv2 datasets. In total, our train/val splits contain 54,345/20,256 image, reasoning question pairs with an average of 2.58/2.81 sub-questions and 7.63/5.80 irrelevant questions for each pair respectively. Subsets of this data have been attached in a zip file with this submission to serve as representative examples. The details on the VQA-Introspect and VQAv2 datasets, which are publicly available, can be found in the corresponding papers cited in the main section. The VQA-HAT dataset used in the visual grounding analysis is also publicly accessible at this link.