What breach? Measuring online awareness of security incidents by studying real-world browsing behavior
Abstract
Awareness about security and privacy risks is important for developing good security habits. Learning about real-world security incidents and data breaches can alert people to the ways in which their information is vulnerable online, thus playing a significant role in encouraging safe security behavior. This paper examines 1) how often people read about security incidents online, 2) of those people, whether and to what extent they follow up with an action, e.g., by trying to read more about the incident, and 3) what influences the likelihood that they will read about an incident and take some action. We study this by quantitatively examining real-world internet-browsing data from 303 participants.
Our findings present a bleak view of awareness of security incidents. Only 16% of participants visited any web pages related to six widely publicized large-scale security incidents; few read about one even when an incident was likely to have affected them (e.g., the Equifax breach almost universally affected people with Equifax credit reports). We further found that more severe incidents as well as articles that constructively spoke about the incident inspired more action. We conclude with recommendations for specific future research and for enabling useful security incident information to reach more people.
1 Introduction
Security awareness is crucial for people to have the tools and know-how for keeping their computers, accounts, and data safe [40]. With the rise of security incidents and data breaches, it is especially important that people are aware of such incidents and their implications, whether or not they were directly affected. Learning about past incidents informs people about the kinds of threats they may encounter and as a result people are more likely to implement better security practices [40]. There have been almost 1,300 publicly reported breaches in 2018 [49, 3, 82, 17, 5]. High-profile cyber attacks in the past decade such as WannaCry, Heartbleed, Petya, and NotPetya have compromised over 300,000 systems worldwide [31, 42, 68]. The data compromised in breaches has ranged from passwords to personally identifiable information like names, email addresses, credit card numbers, and social security numbers. In addition to the need for affected people to become aware of incidents and take action, it is also important for people to generally be aware of the extent and effects of security incidents as a stepping stone towards preemptive security practices [44].
To this end, research about awareness of security incidents has started to examine these issues through surveys and interviews, and has found that people learn about breaches from a variety of sources and that some breaches are more likely to be talked about than others [21]. A survey found that almost half the respondents had heard about a breach from a source other than the breached company [1]. People’s reported willingness to take action was shown to be correlated with the source of information about remediation steps [84], which people were more likely to take if they perceived a tangible security benefit [46]. Overall, these studies provide an important step towards understanding how people learn about and react to breaches. However, research thus far has relied largely on participants’ recollection of historical behavior or hypothetical situations, and so is constrained by common limitations of self-reported methodologies [78, 36, 80, 72, 27, 39].
In this paper, we take a significant step toward a more detailed understanding of how people learn about and take action after incidents, specifically through online browsing. For a set of six national-scale security incidents of potentially varying relevance to people, we use longitudinal, real-world browsing data to examine to what extent people become aware of these incidents and the subsequent actions they take (e.g., by trying to learn more about the incident or generally about security and privacy). Keeping in mind an underlying goal of improving the spread of incident information through online media, we specifically study these problems in the context of online browsing, without considering other channels through which which this information may be shared. Our dataset was collected from the home computers of 303 participants between October 2014 and August 2018 and includes, among other types of data, all URLs visited and passwords used to log onto online services from participants’ home computers. We further conducted a follow-up survey of 109 participants asking about their device usage and knowledge of security incidents to confirm that our longitudinal measurements contain enough data to support our conclusions. The results of this follow-up survey suggest that the browsing data in our dataset represent more than half of participants’ overall browsing (57%). We discuss the results of this follow-up study in Sec. 6 and address the limitations of our data set in Sec. 7.
We explore two main topics: First, we examine how often people read about incidents on the web and whether the likelihood of reading about incidents is associated with demographics, browsing habits, or self-reported security behaviors. Second, we seek to understand how people come to read about incidents, how they react to finding out about them, and how the different ways of finding out about incidents are related to how people take action. For example, we examine whether the type of web content (e.g., news vs. social media) on which we first observe people reading about incidents affects whether they take constructive action, such as further investigating an incident or searching for instructional articles.
We found that only 16% of our 303 participants visited an incident-related web page about any of six major security incidents between 2014 and 2017. For example, only 15 of 59 likely Equifax credit-report holders read about the breach online in our dataset. Furthermore, these number remain alarmingly low even after accounting (through our confirmatory survey) for mobile browsing not captured in our data set. Overall, we found that older and more tech-savvy participants were more likely to read about security incidents on the internet, as were participants with higher self-reported proactive awareness about their security [25] and participants who browse more technical or technology-related web pages.
73% of the participants whom we observed reading about an incident subsequently visited additional web pages with information about the incident or about security and privacy in general. Reasonably, the higher the severity of the data compromised, the more likely participants were to visit related web pages. Participants’ likelihood of taking action was higher if the content through which they found out about the incident had a positive sentiment; no other property of the breach-related content seemed to be associated with taking action, even though our power analyses showed we had a sufficient sample size to show medium-sized effects.
Overall, our results suggest remarkably low awareness of, or inclination to follow up on, security incidents. Our results also suggest that information about security incidents does not reach online populations evenly and that for those whom it reaches, the presentation of the information can play a role in inducing action. However, much work remains both to help people become aware of security incidents and to help guide them towards improved security and privacy hygiene.
We next survey related work (Sec. 2) and describe our dataset (Sec. 3). We then describe the methodology and results for the two main questions we investigate: how many and which people read about incidents (Sec. 4) and how people learn about incidents online and how this affects their actions (Sec. 5). We then briefly describe a follow-up study that substantiates our main results using self-reported data (Sec. 6). Finally, we discuss the limitations and implications of our research (Sections 7 and 8).
2 Related work
We survey three categories of related work: security incidents and how people perceive them or react; the dissemination of security and privacy information or advice and its influence; and methodologies for measuring security behavior.
2.1 Awareness and perceptions of security incidents
Much of the existing work about security incidents studies how people interact with incidents such as data breaches, e.g., how people perceive data breaches and notifications and the risks involved [46, 84], what influences people to take action after a breach [84, 46], and how people hear about data breaches [21, 46, 84, 1].
Recent work found, for example, that people reported to be more willing to take remediation actions if they perceived a tangible security benefit [46]. Research that focused on the Equifax breach found that people reported that the source of advice about steps to take after the breach played a role in their willingness to take action [84]. Researchers also measured customers’ spending habits before and after a breach announcement, and found that spending was significantly reduced after an announcement of a breach of a retailer’s site [43]. Other researchers found that only a small minority of survey participants would stop business with a company after the company suffered a breach [1] and that almost half learned about breaches from a source other than the affected company. Previous work has also studied people’s general awareness of breaches and how breach information comes to people’s attention and found that social media accounted for almost a third of their participants’ information sources. [21]. More recent work surveyed people’s reactions to notifications of password compromise. When advised or required to change their passwords by the notification, less than a third of respondents reported any intention to change their passwords [35]. Other recent work has shown that when a security incident occurs that involves accounts on a major social network, people exhibit a variety of responses, from doing nothing to actively seeking out information [69].
Our work draws inspiration from previous work that examines how people come across incident information and suggests that the source of information is important for taking action in response to a security incident. We focus on incident information on web pages and base our analyses on participants’ real browsing behavior.
2.2 Information dissemination and influence
Related work also studied the mechanisms and sources from which people learn about security and privacy, often finding that social media and other web-based methods are good channels for this task. For example, prior work found that people use Twitter as a medium to complain or share opinions regarding security incidents [24]. Researchers have also found that people receive security and privacy information through informal stories from friends and acquaintances and that conversations about security and privacy drive people to share with and advise others [67, 19]. Recent qualitative work found that older adults, in contrast to their younger counterparts, tend not to rely on internet sources but rather on social resources such as advice from friends and family [60]. Prior work has also studied themes in security and privacy advice across three different sources—news articles, web pages with security advice, and informal stories from family or peers—and found that each source presents information in a differently constructive way [66]. Research also found that the sources of security and privacy advice were important factors for people’s digital security habits [71] (as also described in Sec. 2.1), and that the amount of advice that people reported receiving was not distributed evenly among economic classes [70]. Researchers have also looked at the ways in which presenting people with security information may help convince them to adopt good security practices. One such work proposed interfaces for filesystems that show people how others implement security [22]. Similar work found that showing people that their friends use security-enhancing features on social networks increases the uptake of these features [20].
Our work is motivated by the findings that web-based media are useful mechanisms for spreading computer security and privacy information. With a long-term of goal of sharing such information and advice more effectively, our work specifically aims to understand empirically how relevant information is consumed via web browsing.
2.3 Measuring security behavior
Two main approaches have been used to measure security behavior: collecting self-reported data though surveys, interviews, or controlled experiments—e.g., people’s behaviors when exposed to internet attacks [61], password updating habits [37], and willingness to take remediation measures after a breach [46, 84]—and instrumenting users’ computers to observe security behaviors—e.g., measuring password reuse [28, 63, 18] or the presence of malware on people’s computers [30]. Since self-reported data can be prone to biases and may not be representative of the reality of peoples’ security and privacy [78, 80, 4, 72, 27, 36, 39], we focus, unlike most prior research on security incidents, on empirical measurement of actual behavior.
Previous work has measured how often people update their computer systems [30, 14, 80], what security settings they use on their computers [30, 14], whether they are infected with malware [30, 14], and the presence of third-party applications [80]. Prior work has also measured how often people click on unsafe links [73, 14], their private-browsing [36] and password-reuse habits [63, 28, 80], and whether they install security-enhancing extensions [80]. We focus on security behaviors related to web usage, as we are specifically studying the use of web-based media in spreading information.
Previous work that extracted security behaviors from real data has collected data in multiple ways. One set of researchers partnered with an internet service provider that recorded all HTTP traffic of consenting participants [73]. Others asked study participants to install a tool that collected their system logs and information about the passwords they entered on web pages [80].
We leverage a data-collection infrastructure called the Security Behavior Observatory (SBO) (described next, in Sec. 3), which captures detailed, real-world behavior of home computer users through instrumenting their operating systems and web browsers [29, 30]. Data gathered by the SBO has been used to study password reuse [63], private browsing [36], and people’s maintenance of their systems for security [30, 14].
3 Data collection and dataset
Data collection
We obtained data collected as part of the Security Behavior Observatory (SBO) project, a longitudinal study of the security behaviors of Windows computer users [29, 30, 63] from October 2014 to July 2019. Data collected by the SBO includes information about system configuration, system events, operating system updates, installed software, and browser-related data such as browsing history, browser settings, and the presence of browser extensions. To collect this information, participants’ home computers were instrumented with software that collects data via system-level processes and browser extensions. Additional data related to passwords entered into web pages was collected starting January 2017 and only in the Google Chrome and Mozilla Firefox browsers.
The SBO is approved by the ethics review board at Carnegie Mellon University. Data collected by the SBO has been used to study, for example, private-browsing habits [36], people’s ability to detect phishing attacks [14] and password reuse habits [63, 9].
Our study is based on longitudinal data that was collected by the browser extensions. In particular, we use the following two sets of data.
Browsing history: The browsing data we analyze spans a subset of the whole SBO dataset from October 2014 to June 2018, encompasses participants, and covers participants’ browsing using Google Chrome, Mozilla Firefox, and Internet Explorer. Participants enrolled in the SBO study on different dates and for different durations. We study a subset of participants who were active in the study at the time of when each of several security incidents was publicly announced (see Sec. 4). The average duration for which the 303 participants were enrolled was 505 days. This dataset includes information about every URL visited in the web browser, along with page titles and timestamps.
Password data: This dataset spans from January 2017 to August 2018 and includes of the participants. The data includes information about every entry made into a password field in a web page, as determined by a browser extension, including: a salted one-way hash of the password and the URL of the form in which the password was submitted. We filter this dataset to exclude passwords used during failed login attempts or entered by a user other than the main computer user by replicating the filtering process used by prior work that examined passwords collected through the SBO [9].
This browsing data is retrieved from participants’ main computers. We assess the accuracy of our results in the context of participants’ overall browsing across multiple devices through a follow-up study of 109 SBO participants. Sec. 6 shows that this confirmatory study appears to support our main findings.
We further discuss the limitations of this dataset in Sec. 7.
4 Who reads about security incidents
Here we examine how many and which people visit security-incident-related web pages, as well as what factors are associated with their likelihood of visiting such a page.
We focus on a selected set of security incidents (Sec. 4.1.1) and model participants by their demographics and technical backgrounds, self-reported security intentions, and internet browsing behavior (Sec. 4.1.2). We then report on the relationship between these features and the likelihood that participants visited pages related to security incidents (Sec. 4.2).
4.1 Methodology
4.1.1 Identifying who read about security incidents
We examine six security incidents that occurred between 2013 and 2017 [49, 3, 82] such that we would expect most people to have read about at least one incident. We selected these security incidents because they 1) were large-scale incidents (not affecting only a local population), 2) spanned a variety of incident types from personal financial data losses to company document leaks to cyber attacks on home computers, and 3) were represented in our browsing history dataset. These incidents are:
-
•
Equifax breach: September 2017 breach of the credit reporting site that compromised the personal information of almost million customers [12].
-
•
Uber hack: Late 2016 breach that compromised the personal information of million Uber users [51].
-
•
Ashley Madison breach: Data breach on the affair-centric dating site in July 2015 and compromised around 33 million users’ private information [53].
- •
- •
- •
Each incident we study may be relevant to users in different ways, e.g., they could have been affected by it, they could be users of the compromised service and may want to be more cautious in the future, or they could learn about security and privacy dangers in a broader context based on the incident. For example, although Panama Papers may not be directly relevant to most users, we included it because awareness about it could indirectly encourage users to be cautious about the safety of their own private records (e.g., medical records) and maybe be selective in trusting institutions with their data.
To study who reads about these incidents, we focus on the participants who were active in the study before the incident became public and for three months after.
For each incident, we identified participants who visited an incident-related page (henceforth we may call this reading about a breach). This web-page visit could be the first exposure to the incident or an attempt to learn more about the incident online after hearing about it elsewhere. Since we seek to study how often people actually signal the intent to learn more about an incident rather than simply “hearing about it,” we do not consider a participant to have read about an incident if it was mentioned on some web page, e.g., on social media, but the participant did not click on the article.
To determine whether a participant read about an incident, we performed a keyword search over the URLs and titles of all the pages in their browsing history. For each incident we manually selected a set of keywords that we believed would identify web pages that focus on that incident. For example, we searched for various combinations of “Yahoo” and one of the following: “compromise”, “attack”, “breach”, “hack”. To confirm that our keyword lists were inclusive enough, we also performed multiple Google searches using a variety of search terms to find web pages about the incidents and then confirmed that each of the top 100 Google search results about each incident would be identified by our keyword lists. We then manually verified that each page visit that matched a keyword actually corresponded to a page about the incident. For example, a page on the domain of yahoo.com with the path containing the word “hack”, referring to a page about life hacks would not be considered an incident-related page.
Equifax and Yahoo! users
To provide further context for our observations of how many participants read about an incident, we observed for people who were likely to have been affected by an incident, how many of them read about the incident as part of our analysis. Equifax and Yahoo! are the two breaches for which we were able to relatively accurately estimate how many participants were actually affected by examining whether they logged in to certain web sites. In both cases, the number of affected people was all or almost all users or consumers [50, 38, 12].
We determined people who were likely to have had an Equifax credit report by those who entered passwords on credit-card reporting sites that reported on Equifax credit ratings. To determine which participants were likely to have a credit report with Equifax (and were hence likely to be affected by the breach [12]), we searched for participants who had entered a password on annualcreditreport.com, creditkarma.com, equifax.com, or identityguard.com before September 7, 2017, which is when the breach became public. We picked these domains because they were on a list of six popular credit-report sites reporting Equifax scores [15] and appeared as domains on which participants entered passwords in our dataset. While most Americans were likely to have been affected [38, 12] regardless of whether they had an account with a credit-reporting site, for this analysis, we considered this set of participants that were very likely to have been affected according to the above criteria.
Similarly, to determine which participants had a Yahoo! account, we searched for participants who had entered a password on the yahoo.com domain before February 15, 2017—when the breach had first become public. We repeated this search for participants who had a Yahoo! account before the second 2017 breach announcement, October 3, 2017.
Since we had access to passwords only for Chrome and Firefox users, these are the only participants that we can judge were affected by the Yahoo! or the Equifax breach.
4.1.2 Studying which people read about incidents
After determining which participants read about at least one of the incidents, we study what characteristics of participants are correlated with participants visiting pages related to the security incidents. We model participants and their behavior using three distinct feature sets and then perform a logistic regression for each feature set, where the outcome variable in each regression is a binary variable indicating whether a participant read about an incident.
Feature set 1: Demographic characteristics
Based on findings from previous work showing that demographics were correlated with how people share security and privacy news and their comfort with uses of breached data [21, 46], we hypothesized that certain demographics would also be correlated with whether they read about a security incident. Therefore, the first feature set contains demographic information about the participant: age, gender, income, highest education level, whether the participant is a student, whether the participant’s primary profession involves programming, and whether the participant knows at least one programming language.
Feature set 2: Self-reported security intentions
Prior work found self-reported security intentions (as measured by the SeBIS scale) to be correlated with how people heard about and shared security and privacy news [21]. Hence, our second feature set comprises the four continuous feature values of the SeBIS scale [25], which participants optionally filled out upon enrollment in the SBO. The four values represent the extent to which participants a) secure their devices, b) generate strong and varied passwords across accounts, c) demonstrate proactive awareness of security issues or safety of websites and links, and d) update the software on their computers.
Feature set 3: Participants’ observed internet behavior
We hypothesized that the types of web pages people browse would be correlated with people’s likelihood to encounter information about a security incident. For example, we hypothesized that people who browse more technology-related news articles may be more likely to come across web pages about security incidents. To test these hypotheses, we examined two types of internet behaviors: the kinds of topics of web pages that participants typically visited and the amount of their web browsing that involved visiting web pages on technical topics. We describe each of these next.
Characterization of browsing behavior: We used a topic-modeling algorithm to generate a set of topics that categorize participants’ browsing. To generate the set of topics (which was the same for all participants), we looked up the category of the domain of every web-page visit in Alexa Web Information Services, resulting in a multiset (i.e., bag) of words. We performed topic modeling using the Non-negative Matrix Factorization (NMF) algorithm [52] on that multiset, which identified two topics as the most coherent for modeling participants’ browsing (by determining the number of topics with the highest intra-topic cosine similarities [76]). One topic appeared to correspond to browsing that was professional or work-related; the other topic related to browsing that was leisure- or entertainment-related. (See App. A.1 for more details.) The output of NMF also includes, for each topic and participant, a value that describes how much of that participant’s web browsing matches the topic. Hence, each participant’s browsing behavior is characterized with two features (corresponding to two topics).
Amount of technical content browsed: We further characterize people’s browsing according to how many of the web pages they visit are technical or technology-related. We again use the NMF algorithm to build a topic model with two distinct topics: one topic covering technical or technology-related content and the other comprising all other types of content. This topic model is computed over the content of web pages visited by the participants. We consider a web page to be technical or technology-related if the AWIS category for the domain of the web page contains the word “technical” or “technology”; otherwise we consider it not technical or technology-related. For a sample of each participant’s browsing history, we download the content of the web pages in the sample using the newspaper library [62] and train a topic modeling algorithm to learn two topics based on two documents: the content of downloaded web pages with a technical AWIS category and the downloaded content of all other web-pages with a non-technical AWIS category. We then apply this topic model trained for two topics on the multiset of tokens of downloaded content for each participant’s browsing sample. Similarly to when characterizing browsing behavior, the NMF algorithm outputs, for each topic and participant, a weight for the topic within the sample of the participant’s browsing history. We characterize the amount of technical content a participant browses by the weight corresponding to technical content. (See App. A.2 for more details.)
4.2 Results
Our filtered set of participants includes participants who were active in the study around the time of at least one incident announcement. Their ages ranged from 20 to 83 years, with a median of 29 and a mean of 36. 59% of participants identified as female, 41% as male, and one did not provide their gender. 63% of participants completed a Bachelors degree or higher. 48% of participants were students. 30% of participants had an income above 50,000 USD, 50% below 50,000 USD, and the rest did not provide their income.
We were surprised to discover that only 48 of the 303 (16%) visited a web page that discussed any of the security incidents that we studied.111While we do not expect all participants to be interested in every incident, it was likely that the majority of participants would find at least one incident relevant to them in some way. Henceforth, we may say that these participants “read about the breach,” even though we cannot confirm they understood the content of the pages they visited. In three additional instances participants searched for incident-related keywords but did not visit any of the search results or any other incident-related page. Table 1 shows how many participants visited a page about each security incident.
This fraction of participants is computed based on browsing history from participants’ home computers; our confirmatory study suggests this accounts for the majority of participants’ web browsing (see Sec. 6).
We also examined a subset of participants that we hypothesized were particularly likely to have been affected by the Equifax or Yahoo! breaches (see Sec. 4.1.1). Of the 59 participants who entered passwords on credit-card reporting sites that reported on Equifax credit ratings, 15 (25%) read about the Equifax breach. In contrast, of the 48 participants who entered a Yahoo! password in the relevant time periods—and hence were definitely affected by the breach [50]—only one (2%) read about the breach. We substantiate these numbers through a follow-up study related to people reading about the Yahoo! and Equifax breaches online (Sec. 6).
We analyzed the relationship between the binary outcome of whether a participant read about any of the incidents and each of the three feature sets described in Sec. 4.1.1 by computing three logistic regression models. When interpreting results, we used a significance level of .
First, we computed a model exploring the effect of demographic characteristics over the 303 participants (Table 2). We found that participants’ ages and whether they know a programming language were
| Incident | # participants |
|---|---|
| Equifax | 26 |
| Yahoo! | 6 |
| Uber | 4 |
| Ashley Madison | 6 |
| WannaCry | 14 |
| Panama Papers | 10 |
significant factors. Specifically, older and more technology-savvy participants were more likely to read about incidents. The effect of age was only marginal—the odds of reading about an incident increased by () for each additional year of age—but the odds of reading about an incident increased by () if a participant knew a programming language.
Our second model examines the relationship between whether participants read about an incident and their self-reported SeBIS scale values (Table 3). This model was computed over 247 participants who provided SeBIS data to the SBO at the time of enrollment. Only one of the values of the four SeBIS score categories was statistically significant, which we model by its Z-score for easier interpretation; the odds of reading about an incident were increased by a factor of () for each standard deviation increase in the SeBIS proactive awareness score of a participant (a value in ).
Our third model examines the relationship between whether participants read about an incident and their internet browsing behavior (i.e., browsing topics and amount of technical browsing; see Sec. 4.1.2). This model was computed over 302 participants who had enough browsing data from which a sample sufficient for computing the technical browsing descriptor could be drawn (see App. A.2). Of the factors examined by this model, only the amount of technical or technology-related browsing was a significant factor (again modeled by its Z-score). The odds of reading about an incident are increased by a factor of () for every standard deviation increase in the technical browsing score. Table 4 contains the results of this logistic regression model.
| baseline | coef. | exp(coef.) | std.err. | t | p | |
|---|---|---|---|---|---|---|
| (Intercept) | -0.070 | 0.933 | 0.074 | -0.953 | 0.341 | |
| age | 0.003 | 1.003 | 0.001 | 2.311 | 0.021 | |
| gender: male | female | 0.025 | 1.026 | 0.035 | 0.715 | 0.475 |
| Education: ugrad | <ugrad | 0.026 | 1.027 | 0.035 | 0.748 | 0.455 |
| Income: >$25k | <$25k | 0.002 | 1.002 | 0.040 | 0.053 | 0.957 |
| Income: declined to answer | <$25k | -0.031 | 0.969 | 0.056 | -0.562 | 0.574 |
| knows_prog_lang: yes | no | 0.139 | 1.149 | 0.045 | 3.084 | 0.002 |
| is_programmer: yes | no | -0.028 | 0.972 | 0.049 | -0.583 | 0.560 |
| is_student: yes | no | 0.050 | 1.052 | 0.047 | 1.078 | 0.282 |
| coef. | exp(coef.) | std.err. | t | p | |
|---|---|---|---|---|---|
| (Intercept) | -0.180 | 0.835 | 0.178 | -1.013 | 0.312 |
| Device Securement | 0.000 | 1.000 | 0.018 | 0.009 | 0.993 |
| Password Generalization | 0.020 | 1.021 | 0.039 | 0.535 | 0.593 |
| Proactive Awareness | 0.075 | 1.078 | 0.038 | 1.990 | 0.047 |
| Updating | 0.002 | 1.023 | 0.023 | 0.969 | 0.333 |
| coef. | exp(coef.) | std.err. | t | p | |
|---|---|---|---|---|---|
| (Intercept) | 0.060 | 1.062 | 0.073 | 0.823 | 0.411 |
| Browsing: leisure | 0.401 | 1.493 | 0.354 | 1.132 | 0.258 |
| Browsing: professional | 0.635 | 1.887 | 0.420 | 1.510 | 0.132 |
| Z(Browsing: technical) | 0.066 | 1.068 | 0.024 | 2.690 | 0.008 |
4.3 Summary of findings
Overall, participants who were older, exhibited a higher proactive awareness about computer security, and who were more technology-inclined were more likely to come across information about security incidents online. This indicates an imbalance in the dissemination of important security and privacy information to different demographics and user populations.
5 How people learn about incidents and take action
We now study how the 48 participants who read about security incidents came to visit incident-related web pages and what behavior they exhibit in response. We first explain how we characterize reading about (discovery) and taking action after an incident (Sec. 5.1); we then examine how the characteristics of discovery or of the incident relate to participants’ reactions (Sec. 5.2).
5.1 Methodology
We define features that characterize the process of discovery of web pages about incidents (Sec. 5.1.1) and we characterize participants’ actions after discovery (Sec. 5.1.2).
5.1.1 Learning about incidents
We examine the browsing trajectories—sequences of page visits that surround the visit of an incident-related web page—of each participant for each incident. We then measure the characteristics of the page visits that were part of the trajectory before the visit to a incident-related web page, and, separately, the characteristics of page visits after the first visit to the incident-related web page. We analyze how the actions people take—as observed by examining the part of the trajectory after first visiting the incident-related web page—are related to characteristics of the incident, characteristics of the browsing path up to reading about the incident, the participants’ demographics, and internet browsing behavior.
We constructed the browsing trajectories by the following steps: We first identify each participant’s visits (if any) to web pages related to any of the incidents as described in Sec. 4.1.1. For each first occurrence—the first visit to any incident-related page about a specific incident—we define a trajectory to be composed of the 20 page visits immediately preceding this first visit to a incident-related page, the actual first visit to the incident-related page, and the 20 page visits that immediately followed.
In this manner, we construct one trajectory per incident for each participant who visited any page about that incident.
To study how people read about incidents through browsing and their subsequent actions, we define and analytically examine several features:
Precursor web page type (precursor_type) This feature describes the type of web page on which the participant clicked on a link that took them to the first occurrence of a page about the incident. This is commonly called the “referrer” page; we call it the precursor page because we identify these pages manually instead of via referrer headers, which are often not available. To create this feature, we manually categorized all the precursor pages as follows:
-
•
Social media: A social media site (e.g., Facebook) home page or a social media page related to the topic.
-
•
Message boards: A message forum such as 4chan message boards, reddit, or a Charles Schwab online forum.
-
•
News page: The page was on a news website.
-
•
Purposeful: Search engine results about the incident.
-
•
General browsing: The page did not fall into one of the above categories, but contained a link to the first-occurrence page. E.g., a stackexchange page with a sidebar link to an incident-related page.
-
•
Unknown: No pages in the trajectory preceding the first occurrence of an incident-related page appeared to have a link to that page. This could happen if the participant entered the URL of the incident-related page manually or clicked on a link in an external tool.
In some cases there was an automatic URL redirect between the precursor page and the first occurrence of a page about the incident. Our analysis correctly identifies the page that generated the redirect link as the precursor page.
Whether the precursor page was a home page (precursor_is_homepage) This feature captures whether the precursor page was the home page of a domain or whether the participant had to have browsed more deeply into a website before encountering the precursor page. We examine this feature to determine whether the link to the first-occurrence page was easily visible to anyone (i.e., on a home page) or would be seen only by some visitors to that site (i.e., those who had navigated to a specific section).
First-occurrence page type (1st_occur_type) This feature categorizes the first-occurrence page according to whether it is specifically about the incident, and, if so, whether it is descriptive or prescriptive. We used the newspaper library [62] to extract the main content of each page; we then manually examined the content, and developed the following three categories, using which we then classified each page: (1) general information about this specific incident, e.g., what caused it; (2) advice about this specific incident, e.g., what to do in response or how to find out if one is affected; (3) not specifically about this incident, but mentions the incident, e.g., a political article that mentions the incident.
First-occurrence page sentiment (1st_occur_sentiment) Inspired by research on how the sentiment of social media posts influences the sentiments of the poster’s followers [6], we hypothesized that people’s reactions to web pages about incidents might be related to the sentiment of the pages, in particular, that positive sentiment might correlate with more constructive action.
We computed the sentiment for the main content of each first-occurrence page (collected as described above) using the NLTK Vader library [33]. This feature has values in the range ; lower values indicate more negative sentiment, higher more positive sentiment, and 0 neutral sentiment.
Incidents previously read about (incident_num) We hypothesized that people react to incidents differently depending on how many incidents they have come across through web browsing. Hence, for each incident that a participant read about, we counted how many other incidents of the six incidents they had read about previously (i.e., the number of trajectories previously constructed for this participant for other incidents) and exposed this as a feature in our analyses.
Type of data compromised (data_compromised) This feature represents the type of data compromised in the incident. We broadly group the data types and incidents as follows.
-
•
PII: names, phone numbers, partial credit card numbers, email or physical addresses (Ashley Madison, Uber);
-
•
PII++: as above, and credit card information or social security numbers (Equifax)
-
•
Passwords (Yahoo!)
-
•
Miscellaneous (WannaCry, Panama Papers)
Although passwords for many Ashley Madison users were eventually cracked and leaked, this did not happen until months after the original leak became public [53]; hence, we categorize the Ashley Madison breach as only including PII and not passwords.
5.1.2 Actions after reading about incidents
We first describe how we determined the actions participants took after they read about an incident, which we use as the outcome variables in statistical analyses (Sec. 5.2.2).
We manually examined the 20 page visits in each trajectory immediately following the first occurrence, as well as any visits to incident-related web pages after the first visit. We call one of these page visits an action taken in response to reading about the incident if it falls into at least one of the following categories:
-
•
Educating themselves about the incident: e.g., reading additional articles about how the incident occurred, who is responsible, or implications of the incident.
-
•
Educating themselves about general security: e.g., reading articles about how to secure their network or whether using personal emails for work is safe.
-
•
Taking action to make themselves more secure: e.g., attempting to freeze their credit reports, visiting a website to download patches after a cyber attack, or reading “what you need to do” articles.
We then counted the number of actions after reading about an incident. If a participant’s browsing history included multiple page visits within 30 seconds whose titles and URLs were identical, we counted them as one page visit. We use this raw count of actions as the outcome variable in our analyses (see Sec. 5.2.2). For example, if a participant visited two more pages that discussed the breach as well as one page with a “what you need to do” article, this would count as having taken three actions after reading about the breach.
So as to treat incidents uniformly, we do not consider actions tailored to any specific incident (e.g., changing passwords after a password breach).
5.2 Results
In Sec. 5.2.1, we describe how participants came to read about incidents and their actions after reading. In Sec. 5.2.2, we report on analyses that model the amount of action participants take in relation to how they come across incident-related pages, the type of incident, characteristics of participants, and their web-browsing behaviors.
5.2.1 Descriptive results
Using the methodology described in Sec. 5.1.1, we identified 66 distinct trajectories across the 48 participants (out of 303) who visited an incident-related web page. About twice as many trajectories described a participant reading about a PII++ breach (26) than a PII breach (10), and about four times as many described a participant reading about a PII++ breach than about a password breach (6). The remaining trajectories (24) were about WannaCry and Panama Papers.
The types of web pages that led participants to visit the first incident-related page (precursor_type) were relatively evenly distributed across social media (11), message boards (9), news pages (13), searching for the breach (9), and general browsing (10). For 14 trajectories we could not identify the page that led participants to their first visit of an incident-related page. For the 52 trajectories for which we could determine the precursor page, approximately half (24) the precursor pages were home pages (precursor_is_homepage); the others (28) were pages deeper in a website.
When we categorized the first incident-related page visits according to their content (1st_occur_type), we found that 10 were advice articles, 35 were pages with general information about the incident, and 21 had content related to the incident (e.g., a story about a woman’s identity stolen 15 times after the Equifax breach) without specific information about the incident. The sentiment of the content of the first-visited incident-related pages (1st_occur_sentiment) was slightly positively skewed, with a mean of and a standard deviation of . (Values above 0 indicate positive sentiment; below 0 negative sentiment; and 0 is neutral.) [33]).
Most participants (73%) visited pages about only one of the six breaches we focused on. Only 10 visited pages about two breaches, one about three breaches, and two participants visited pages about four distinct breaches.
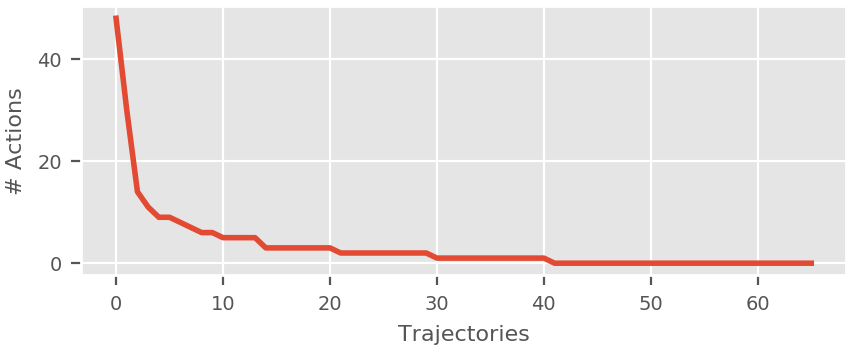
Most participants (73%) who visited a breach-related web page afterward took at least one action (i.e., visited another page about the breach, a page about security in general, or a page describing how to react to a breach). The mean number of actions taken across the trajectories was with a standard deviation of , the median , and the maximum . Figure 1 shows how the number of actions is distributed across the trajectories.
5.2.2 Relating actions to features
We now examine the relationships between how much action participants took and four groups of features—features relating to the trajectory, the demographics of the participants, the type of incident, and the participant’s internet browsing behavior—via four statistical models. We consider a feature to be statistically significant if the significance level () is less than .
Three of the analyses are over the participants (and trajectories) who read about an incident. The analysis of participants’ reactions relative to what led them to visit an incident-related web page is over 52 trajectories, since we removed trajectories for which we could not determine what led the participant to visit an incident-related page (i.e., precursor_type was “Unknown”; see Sec. 5.1.1).
Actions in relation to trajectories
The first analysis looks at the number of actions participants take in relation to the following features of the browsing trajectories: precursor_type, precursor_is_homepage, 1st_occur_type, incident_num, and 1st_occur_sentiment.
We modeled this relationship by a linear regression model, where each trajectory (not each participant) is one data item. We use the raw action count as the outcome variable, represented by its Z-score with respect to the mean number of actions out of all trajectories. We model each of the three categorical features (with levels) with indicator variables compared to a baseline level. For precursor_type, we group the five levels into two buckets: “purposeful,” for page visits suggestive of purposeful browsing (message boards and search results), and “general,” for social media, news sites, and general browsing. We also represent the 1st_occur_sentiment feature as the Z-score of the 1st_occur_sentiment in each trajectory with respect to the average sentiment value over all trajectories.
The only factor that was correlated with the number of actions participants took after visiting an incident-related page was the sentiment of the content on this first visited page. A more positive sentiment was associated with taking more actions. Specifically, the number of actions increased by 1.153 standard deviations away from the mean for every standard deviation increase in the value of 1st_occur_sentiment from its mean (). Table 5 shows the results of the linear regression model.
We conducted a power analysis to understand whether our sample was large enougg to reveal effects of a particular size. Following previous work [16, 26, 2, 77, 55, 59] in aiming for an experimental power of , a p-value () of , and a medium effect size, we calculated that a sample size of 34 trajectories was the minimum to see the desired effects with our model, a criteria which our sample size of 52 trajectories meets. This suggests that if our model did not show a factor to be statistically significant, that factor is likely to not have had a “medium” or greater effect.
| baseline | coef. | exp(coef.) | std.err. | t | p | |
|---|---|---|---|---|---|---|
| (Intercept) | -0.240 | 0.787 | 0.173 | -1.385 | 0.172 | |
| precursor_type: purposeful | general | 0.054 | 1.060 | 0.132 | 0.411 | 0.683 |
| precursor_is_homepage: yes | no | -0.025 | 0.975 | 0.124 | -0.206 | 0.838 |
| 1st_occur_type: advice | info | -0.117 | 0.890 | 0.172 | -0.678 | 0.501 |
| 1st_occur_type: related | info | -0.167 | 0.846 | 0.137 | -1.226 | 0.226 |
| incident_num | 0.103 | 1.109 | 0.086 | 1.196 | 0.237 | |
| Z(1st_occur_sentiment) | 0.142 | 1.153 | 0.060 | 2.353 | 0.022 |
Actions in relation to participant demographics
The second analysis examines the likelihood that participants will take action (and how many actions they will take) relative to participants’ demographics, again via a linear regression model. The demographic features examined are described in Sec. 4.1.2.
If a participant had several trajectories (i.e., visited pages related to more than one breach), we average their actions across their trajectories. As before, we model categorical variables as multiple indicator variables.
No participant descriptors were statistically significant in relation to the actions participants took. A power analysis similar to the one we performed for the previous model showed that the minimum sample size needed to obtain statistically significant, medium-sized effects was 36, which our sample of 48 participants exceeded.
Actions in relation to the type of breach
We examine the relationship between the number of actions taken per trajectory and the type of data compromised (data_compromised) using the Kruskal-Wallis one-way test of variance [48].
The amount of action differed significantly between categories of the data compromised (, , ). To understand which groups were statistically different from each other and in what direction, we conducted a post-hoc analysis with pairwise comparisons using Dunn’s test between each group, applying the Bonferroni correction for each comparison [23, 10].
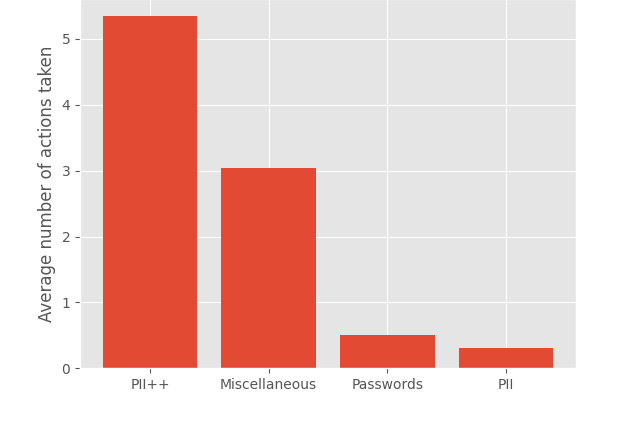
Participants took an average of 5.35 actions after a PII++-compromised incident, 3.04 after a miscellaneous incident, but only 0.5 and 0.3 after reading about a passwords or PII incident, respectively. The greater number of actions taken for PII++ was statistically significantly higher than for passwords () or just PII (). Figure 2 shows a ranking of the average number of actions taken for the trajectories of each category.
Actions in relation to participants’ browsing behavior
Finally, we tested for relationships between the number of actions people took and the types of pages they visited on the web and the amount of technical browsing (as described in Sec. 4.1.2).
The linear regression model did not reveal any statistically significant relationships, although, as before, a power analysis showed that we had sufficient power to see medium-sized or larger effects.
5.3 Summary of findings
In summary, participants came across pages about security incidents through a variety of media in similar proportions. Most of the times participants came across the page about the incident after browsing deeper through a website, suggesting that such pages about incidents are not easily accessible (e.g., from a homepage). Participants were likely to read more about the incident or take an action when the page exhibited a positive sentiment but no other features were correlated with taking action, implying that the lack of action is nearly universal across our dataset.
6 Confirming dataset validity
Our findings (Sec. 4–5) are based on the browsing activity collected from one home computer of each participant. However, participants could have read about incidents or taken action on other devices, data about which is not captured in our dataset.
To shed light on how representative our dataset is of participants’ overall browsing behavior, we collected additional self-reported data to supplement our main dataset. We conducted a survey of 109 SBO participants who were active in May 2019, in which we asked about their familiarity with, and any reactions in response to, several security incidents, as well as about how much web browsing they perform on which devices. This study was approved by our institution’s review board and the review board of the SBO’s home institution. The survey took between one and five minutes and participants were compensated with $5. Many participants in our main dataset were not active when we conducted this follow-up survey and vice versa; hence, we use this survey as a measure of the self-reported behavior of SBO participants in general, rather than focusing on specific individuals who were in both datasets.
When asked to report the fraction of browsing they performed on their SBO computers, participants indicated that these were used, on average, for 57% of their web browsing. As the amount of browsing on desktop and laptop computers may have decreased over time in favor of browsing on mobile devices [57], this 57% is likely a lower bound; participants earlier in the study likely performed a higher fraction of their overall browsing on their SBO computers.
We also asked participants how often (on a 5-point Likert scale [79]) they read about security incidents on (1) their SBO computer and (2) on any other devices. We found no statistically significant difference between the two distributions (Kolmogorov-Smirnov [47]: ). We also examined whether the distribution of browsing on SBO computers vs. other devices varied by participant age, but found no statistically significant indication that it did (Spearman’s correlation test: ). Finally, to gauge the accuracy of the self-reported data, we asked participants how familiar they were (on a 5-point Likert scale) with five security incidents, four non-incident-related events, and one fictitious security incident (an Airbnb social security number breach). 8% of respondents indicated moderate or extreme familiarity with the fake Airbnb breach, suggesting that the self-reported results may slightly exaggerate the participants’ actual familiarity with incidents.
Our results from Sec. 4 indicate that 25% of the participants in our main dataset who were likely to have an Equifax credit report (and therefore, likely to have been affected) read about the Equifax breach, a surprisingly small percentage. If we assume that this percentage is computed based on 57% of all browsing, then the actual percentage of people who read about the breach—if our data included 100% of all browsing—could be as high as 36%, which is still low considering the significance of the breach. When asked what action they took following the Equifax breach, 41 participants (38%) responded that they read about the breach online and/or visited the Equifax website, with the majority of the rest answering “didn’t do much/didn’t do anything”. Five of the 41 respondents additionally replied that they “can’t remember” and/or “didn’t do much/didn’t do anything”, implying that the actual number of participants who read about the incident online or visited the website might be even lower than reported.
Similarly, our results from Sec. 4 indicate that 2% of participants in our main dataset who had a compromised Yahoo! password [50] read about the Yahoo! breach online. Self-reported data also suggests very low awareness: when asked about reading and reacting to the Yahoo! breach, only nine (8%) participants answered that they read about the breach online. Two respondents answered “can’t remember” and/or “didn’t do much/didn’t do anything” in addition to reading online, again indicating that a lower number of participants than self-reported may have actually read about the incident.
Overall, our results suggest that the browsing data that we use for our analyses (Sec. 4–5) covers the majority (with a lower bound of approximately 57%) of the browsing performed by our participants. While the additional browsing participants performed on non-SBO devices may dilute some of our findings about how often people read about incidents, the self-reported data supports the big picture: a surprisingly small subset of users reads about incidents and takes action or tries to learn more about the incidents.
7 Limitations
Although our work provides valuable insights into how, and the extent to which, people attempt to make themselves secure after an incident, it is subject to a few limitations, including those due to the nature of the data collection.
Our dataset contains data about (relatively) few participants due to the difficulty of recruiting participants to the SBO. However, the SBO data is a tradeoff: it offers rich browsing and password data that is typically infeasible to obtain, at the cost of a limited participant pool and concerns about generalizability. We believe it’s the big picture that our results reveal that matters – that a very small fraction of people seem to read about or try to learn more about security incidents – rather than the specific percentages involved. Similarly, the browsing history may not be representative of all the browsing users do. Hence the confirmatory study, which suggests that the high-level results of the original SBO analysis hold: participants were rarely familiar with or read about major security incidents regardless of the devices on which they browsed the internet.
Since browsing history was represented via URLs and page titles, we could not include analyses that depended on the content of pages that are dynamic (e.g., social network pages). We also could not distinguish between content that participants actually consumed and content they loaded but did not read. Finally, since participants might open multiple pages in parallel and click on links in pages opened much earlier, we are limited in our ability to accurately determine the precursors to the first incident-related pages participants visited; although in practice we found only a small number of instances where this was a problem.
The data we analyzed is collected only from Windows computer users. Users of non-Windows operating systems might exhibit behaviors different from the behaviors of the participants in our dataset. However, as Windows is the dominant OS for personal computers [13], we do not believe this is likely to fundamentally affect our findings.
Although data from SBO participants has been used for several security- or privacy-related studies [63, 36, 14, 30], the SBO participants may be biased towards less privacy- and security-aware people, given the nature of the SBO data collection infrastructure.
Finally, the subsets of participants we used in various specific analyses were of sufficient size to make uncovering medium-sized effects likely, but not so large as to reliably discover small-sized effects.
8 Discussion
Our dataset allows a comprehensive view of the browsing behaviors of 303 participants across 44 months. Whereas much previous work that investigates people’s awareness of and behavior in response to security breaches and incidents relies on participants’ recollections or reactions to hypothetical scenarios (e.g., [56, 30, 36])—and so can be prone to the observer effect, among others—our dataset permits investigation of people’s actual awareness of and interactions with incident-related content on the web.
Our findings show that for the people in our dataset, the consumption of security and privacy incident information is not as prevalent in people’s online activities as is ideal. Even when information was presented and consumed, people often did not attempt to learn more about the incident or show further interest in reading about it. Further research is needed to study how this information can be disseminated more widely and studied in the context of a general population. To elicit and encourage interest, websites should better highlight problems, the implications and risks, and suggestions for staying secure or maintaining privacy in light of the incident [85, 81, 83].
Improving dissemination of security incident information
We were surprised to find that only 48 participants had visited a web page related to any of the six largely publicized security incidents.
A majority of the links to the incident-related pages people viewed were encountered on news sites, social media, and online message boards; and about a third of the articles were related to the Equifax breach.
Our results highlight the challenges of increasing awareness of security incidents and how such information might be disseminated. Although the Equifax breach affected more than half of US residents over 18, and hence likely affected the majority of our participants, only 15% of participants (who were in the study before the breach and in the study for at least three months afterward) actually visited an article with information about the breach. Without adequate awareness of such incidents, people are unlikely to understand the importance of safe security behavior or understand that the implications of the incident may be relevant to them even if they were not directly affected [44]. Although these incidents were highly publicized one might wonder why people are unlikely to read or learn about them.
Recent work by Wash et al. [67] examines what kinds of “stories” are more likely to make an impact on the security behaviors of people, and which are more likely to be shared. We found that a number of the incident-related articles participants first discovered were stories about the impacts of the incident, and not about the incident itself. Additionally, we found that articles or stories with a more positive sentiment, e.g., constructive advice and information as opposed to only warning readers about future risks, is associated with people exhibiting security-enhancing behaviors. Taking more action was also correlated with reading about an incident in which sensitive personal information was disclosed (as with SSNs and financial information in the Equifax breach), in line with previous findings about taking action when people perceive a tangible benefit [46].
Thus, news organizations reporting on security incidents could benefit from research on what kinds of stories and content are most likely to influence security behaviors and the further sharing of such content. Furthermore, while it is expected that people will be more engaged when they have more at stake, challenges remain with improving their engagement in the context of everyday services [74].
Demographic factors related to dissemination and action
Most of the demographic factors that we examined were not significantly associated with the likelihood to come across incident-related articles or with the number of remedial actions. However, more technology savvy participants were much more likely to have read about incidents. This could be because information about incidents is disseminated more towards technical audiences, perhaps because of the challenges of disseminating incident information (which may be seen as more technical) on non-technical outlets. For example, prior work found that such information is disseminated unevenly based on socio-economic status [70], which could be linked to technical savviness. Another potential explanation is that technologically savvy people are more receptive to such information, and so it remains an open challenge to convince less technologically savvy people about the importance of security incidents and effectively communicate online risks to them. Recent work found that video communication can raise the saliency of risk for people as compared to text and concluded that risk communication through videos might be a more effective way to reach such populations compared to text [32]. Thus in addition to exploring what types of “stories” are more effective, further work is needed to explore the medium of delivering such stories for different populations. For example, research could investigate how different demographic groups interact with different information dissemination channels or properties of shared content.
9 Conclusion
Using the actual browsing histories of 303 participants over four years, we measured how often people read web pages about security incidents, what actions they take after reading, and what factors are associated with how likely they are to read about an incident or take action. Our findings are bleak: Only a small minority (16%) of participants visited an incident-related web page about one of six large-scale security incidents. Furthermore, few participants who read about an incident showed further interest in the incident or took some action by reading more about it.
Our results highlight the challenges of increasing awareness of security incidents and of disseminating information about them. Even when an incident was highly publicized and participants were likely to have been affected, few showed engagement or awareness of the incident, e.g., only 14% read about the Equifax breach. Without adequate awareness, it is unlikely that people will act to improve their security. We found the low rate of discovery, and of constructive action after discovery, to be nearly universal across participants. Participants with an affinity for technology were more likely to read about incidents; but demographic and other factors that we explored either had minor (e.g., age) or no impact. When reading web pages that spoke about the incident in a positive and constructive way, participants were more likely to try and learn more about the incident or take more action; but no other factors correlated with taking action. Even though our results are based on a relatively small population, our results highlight the need for higher awareness or effective dissemination of security incident information and advice.
Future work should examine how incident communications are featured in media frequented by more technology-savvy people and how their appearance in media with a more general audience could be modified to improve uptake. Future work should also study content-sharing platforms used by different demographic groups (e.g., social media) and understand how the spread of news about incidents can be improved by using such platforms.
Acknowledgements
This work was supported in part by the Carnegie Mellon University CyLab Security and Privacy Institute. Parts of the dataset we used were created through work supported by the National Security Agency under Award No. H9823018D0008. We would also like to thank Jeremy Thomas and Sarah Pearman for help with working with the SBO data.
References
- [1] L. Ablon, P. Heaton, D. C. Lavery, and S. Romanosky, Consumer attitudes toward data breach notifications and loss of personal information. Rand Corporation, 2016.
- [2] E. Al Qahtani, M. Shehab, and A. Aljohani, “The effectiveness of fear appeals in increasing smartphone locking behavior among Saudi Arabians,” in Symposium on Usable Privacy and Security, SOUPS, 2018.
- [3] T. Armerding, “The 17 biggest data breaches of the 21st century,” CSO Online, 2018. [Online]. Available: https://www.csoonline.com/article/2130877/data-breach/the-biggest-data-breaches-of-the-21st-century.html
- [4] F. Asgharpour, D. Liu, and L. J. Camp, “Mental models of security risks,” in International Conference on Financial Cryptography and Data Security. Springer, 2007.
- [5] Axel, “Enough is enough: 2018 has seen 600 too many data breaches,” Medium, Jul 2018. [Online]. Available: https://medium.com/@AxelUnlimited/enough-is-enough-2018-has-seen-600-too-many-data-breaches-9e3e5cd8ff78
- [6] Y. Bae and H. Lee, “A sentiment analysis of audiences on twitter: who is the positive or negative audience of popular twitterers?” in International Conference on Hybrid Information Technology. Springer, 2011.
- [7] “Panama papers Q & A: What is the scandal about?” BBC News, Apr 2016. [Online]. Available: https://www.bbc.com/news/world-35954224
- [8] “Cyber-attack: Europol says it was unprecedented in scale,” BBC News, May 2017. [Online]. Available: https://www.bbc.com/news/world-europe-39907965
- [9] S. Bhagavatula, L. Bauer, and A. Kapadia, “(How) Do people change their passwords after a breach?” in Workshop on Technology and Consumer Protection, May 2020. [Online]. Available: https://www.ece.cmu.edu/~lbauer/papers/2020/breaches-conpro2020.pdf
- [10] J. M. Bland and D. G. Altman, “Multiple significance tests: the bonferroni method,” The BMJ: leading general medical journal, 1995.
- [11] D. M. Blei, A. Y. Ng, and M. I. Jordan, “Latent dirichlet allocation,” Journal of machine Learning research, 2003.
- [12] D. Borak and K. Vasel, “The Equifax hack could be worse than we thought,” CNNMoney, 2018. [Online]. Available: https://money.cnn.com/2018/02/09/pf/equifax-hack-senate-disclosure/index.html
- [13] E. Bott, “Latest OS share data shows Windows still dominating in PCs,” ZDNet, Apr 2013. [Online]. Available: https://www.zdnet.com/article/latest-os-share-data-shows-windows-still-dominating-in-pcs/
- [14] C. Canfield, A. Davis, B. Fischhoff, A. Forget, S. Pearman, and J. Thomas, “Replication: Challenges in using data logs to validate phishing detection ability metrics,” in Symposium on Usable Privacy and Security, SOUPS, vol. 12, 2017.
- [15] H. Catalano, “Best free credit report site of 2018,” The Simple Dollar, Dec 2018. [Online]. Available: https://www.thesimpledollar.com/best-free-credit-report-site/
- [16] S. Champely, pwr: Basic Functions for Power Analysis, 2018, r package version 1.2-2. [Online]. Available: https://CRAN.R-project.org/package=pwr
- [17] H. Daitch, “2017 data breaches - the worst breaches, so far,” IdentityForce, Dec 2017. [Online]. Available: https://www.identityforce.com/blog/2017-data-breaches
- [18] A. Das, J. Bonneau, M. Caesar, N. Borisov, and X. Wang, “The tangled web of password reuse,” in Network and Distributed System Security Symposium, NDSS, 2014.
- [19] S. Das, T. H. Kim, L. A. Dabbish, and J. I. Hong, “The effect of social influence on security sensitivity,” in Symposium on Usable Privacy and Security, SOUPS, 2014.
- [20] S. Das, A. D. I. Kramer, L. A. Dabbish, and J. I. Hong, “Increasing security sensitivity with social proof: A large-scale experimental confirmation,” in ACM SIGSAC Conference on Computer and Communications Security, CCS, 2014.
- [21] S. Das, J. Lo, L. Dabbish, and J. I. Hong, “Breaking! A typology of security and privacy news and how it’s shared,” in Proceedings of the CHI Conference on Human Factors in Computing Systems, CHI, 2018.
- [22] P. DiGioia and P. Dourish, “Social navigation as a model for usable security,” in Symposium on Usable Privacy and Security, SOUPS, 2005.
- [23] O. J. Dunn, “Multiple comparisons among means,” Journal of the American statistical association, 1961.
- [24] P. Dunphy, V. Vlachokyriakos, A. Thieme, J. Nicholson, J. C. McCarthy, and P. Olivier, “Social media as a resource for understanding security experiences: A qualitative analysis of #password tweets,” in Symposium On Usable Privacy and Security, SOUPS, 2015.
- [25] S. Egelman and E. Peer, “Scaling the security wall: Developing a security behavior intentions scale (sebis),” in Proceedings of the CHI Conference on Human Factors in Computing Systems, CHI. ACM, 2015.
- [26] P. D. Ellis, The essential guide to effect sizes: Statistical power, meta-analysis, and the interpretation of research results. Cambridge University Press, 2010.
- [27] X. Fan, B. C. Miller, K.-E. Park, B. W. Winward, M. Christensen, H. D. Grotevant, and R. H. Tai, “An exploratory study about inaccuracy and invalidity in adolescent self-report surveys,” Field Methods, 2006.
- [28] D. Florencio and C. Herley, “A large-scale study of web password habits,” in Proceedings of the international conference on World Wide Web, WWW. ACM, 2007.
- [29] A. Forget, S. Komanduri, A. Acquisti, N. Christin, L. F. Cranor, and R. Telang, “Building the security behavior observatory: an infrastructure for long-term monitoring of client machines,” in Symposium and Bootcamp on the Science of Security, HotSoS, 2014.
- [30] A. Forget, S. Pearman, J. Thomas, A. Acquisti, N. Christin, L. F. Cranor, S. Egelman, M. Harbach, and R. Telang, “Do or do not, there is no try: user engagement may not improve security outcomes,” in Symposium on Usable Privacy and Security, SOUPS, 2016.
- [31] J. Fruhlinger, “The 6 biggest ransomware attacks of the last 5 years,” CSO, 2019. [Online]. Available: https://www.csoonline.com/article/3212260/the-5-biggest-ransomware-attacks-of-the-last-5-years.html
- [32] V. Garg, L. J. Camp, K. Connelly, and L. Lorenzen-Huber, “Risk communication design: Video vs. text,” in Privacy Enhancing Technologies, S. Fischer-Hübner and M. Wright, Eds. Springer Berlin Heidelberg, 2012.
- [33] C. H. E. Gilbert, “Vader: A parsimonious rule-based model for sentiment analysis of social media text,” in Eighth International Conference on Weblogs and Social Media, 2014.
- [34] V. Goel and N. Perlroth, “Yahoo says 1 billion user accounts were hacked,” The New York Times, Dec 2016. [Online]. Available: https://www.nytimes.com/2016/12/14/technology/yahoo-hack.html
- [35] M. Golla, M. Wei, J. Hainline, L. Filipe, M. Dürmuth, E. Redmiles, and B. Ur, “What was that site doing with my facebook password?: Designing password-reuse notifications,” in Proceedings of the ACM SIGSAC Conference on Computer and Communications Security, CCS. ACM, 2018.
- [36] H. Habib, J. Colnago, V. Gopalakrishnan, S. Pearman, J. Thomas, A. Acquisti, N. Christin, and L. F. Cranor, “Away from prying eyes: analyzing usage and understanding of private browsing,” in Symposium on Usable Privacy and Security, SOUPS, 2018.
- [37] H. Habib, P. E. Naeini, S. Devlin, M. Oates, C. Swoopes, L. Bauer, N. Christin, and L. F. Cranor, “User behaviors and attitudes under password expiration policies,” in Symposium on Usable Privacy and Security, SOUPS, 2018.
- [38] R. Hackett, “Equifax underestimated by 2.5 million the number of potential breach victims,” Fortune, 10 2017. [Online]. Available: http://fortune.com/2017/10/02/equifax-credit-breach-total/
- [39] A. Hanamsagar, S. S. Woo, C. Kanich, and J. Mirkovic, “Leveraging semantic transformation to investigate password habits and their causes,” in Proceedings of the CHI Conference on Human Factors in Computing Systems, CHI, 2018.
- [40] B. Hanus and Y. A. Wu, “Impact of users’ security awareness on desktop security behavior: A protection motivation theory perspective,” Information Systems Management, 2016.
- [41] L. Harding, “What are the panama papers? A guide to history’s biggest data leak,” The Guardian, Apr 2016. [Online]. Available: https://www.theguardian.com/news/2016/apr/03/what-you-need-to-know-about-the-panama-papers
- [42] R. Horev, “The top 7 vulnerabilities of the decade,” Vulcan, 2018. [Online]. Available: https://blog.vulcan.io/top-7-vulnerabilities
- [43] R. Janakiraman, J. H. Lim, and R. Rishika, “The effect of a data breach announcement on customer behavior: Evidence from a multichannel retailer,” Journal of Marketing, 2018.
- [44] H. B. Janine L. Spears, “User participation in information systems security risk management,” MIS Quarterly, 2010.
- [45] B. Ju, M. Ye, Y. Qian, R. Ni, and C. Zhu, “Modeling behaviors of browsing and buying for alidata discovery using joint non-negative matrix factorization,” in International Conference on Computational Intelligence and Security. IEEE, 2014.
- [46] S. Karunakaran, K. Thomas, E. Bursztein, and O. Comanescu, “Data breaches: User comprehension, expectations, and concerns with handling exposed data,” in Symposium on Usable Privacy and Security, SOUPS, 2018.
- [47] A. Kolmogorov, “Sulla determinazione empirica di una lgge di distribuzione,” Inst. Ital. Attuari, Giorn., 1933.
- [48] W. H. Kruskal and W. A. Wallis, “Use of ranks in one-criterion variance analysis,” Journal of the American statistical Association, 1952.
- [49] S. Larson, “10 biggest hacks of 2017,” CNNMoney, 2017. [Online]. Available: https://money.cnn.com/2017/12/18/technology/biggest-cyberattacks-of-the-year/index.html
- [50] ——, “Every single Yahoo account was hacked,” CNNMoney, 2017. [Online]. Available: https://money.cnn.com/2017/10/03/technology/business/yahoo-breach-3-billion-accounts/index.html
- [51] ——, “Uber’s massive hack: What we know,” CNNMoney, 2017. [Online]. Available: https://money.cnn.com/2017/11/22/technology/uber-hack-consequences-cover-up/index.html
- [52] D. D. Lee and H. S. Seung, “Learning the parts of objects by non-negative matrix factorization,” Nature, 1999.
- [53] N. Lord, “A timeline of the Ashley Madison hack,” Digital Guardian, Jul 2017. [Online]. Available: https://digitalguardian.com/blog/timeline-ashley-madison-hack
- [54] C. D. Manning, P. Raghavan, and H. Schütze, Introduction to information retrieval. Cambridge University Press, 2008.
- [55] A. Mathur and M. Chetty, “Impact of user characteristics on attitudes towards automatic mobile application updates,” in Symposium on Usable Privacy and Security, SOUPS, 2017.
- [56] R. McCarney, J. Warner, S. Iliffe, R. Van Haselen, M. Griffin, and P. Fisher, “The hawthorne effect: a randomised, controlled trial,” BMC medical research methodology, 2007.
- [57] M. Meeker, “Internet trends report 2018,” Kleiner Perkins, 2018. [Online]. Available: https://www.kleinerperkins.com/perspectives/internet-trends-report-2018/
- [58] T. Mikolov, K. Chen, G. Corrado, and J. Dean, “Efficient estimation of word representations in vector space,” arXiv preprint arXiv:1301.3781, 2013.
- [59] J. Nicholson, L. Coventry, and P. Briggs, “Can we fight social engineering attacks by social means? Assessing social salience as a means to improve phish detection,” in Symposium on Usable Privacy and Security, SOUPS, 2017.
- [60] ——, “If it’s important it will be a headline: Cybersecurity information seeking in older adults,” in Proceedings of the CHI Conference on Human Factors in Computing Systems, CHI, 2019.
- [61] K. Onarlioglu, U. O. Yilmaz, E. Kirda, and D. Balzarotti, “Insights into user behavior in dealing with internet attacks,” in Network and Distributed System Security Symposium, NDSS, 2012.
- [62] L. Ou-Yang, “Newspaper3k: Article scraping & curation: http://newspaper.readthedocs.io/en/latest/,” Python Software Foundation, 2013. [Online]. Available: http://newspaper.readthedocs.io/en/latest/
- [63] S. Pearman, J. Thomas, P. E. Naeini, H. Habib, L. Bauer, N. Christin, L. F. Cranor, S. Egelman, and A. Forget, “Let’s go in for a closer look: Observing passwords in their natural habitat,” in ACM SIGSAC Conference on Computer and Communications Security, CCS, 2017.
- [64] M. Pennacchiotti and S. Gurumurthy, “Investigating topic models for social media user recommendation,” in Proceedings of the international conference companion on World Wide Web, WWW. ACM, 2011.
- [65] N. Perlroth, “Yahoo says hackers stole data on 500 million users in 2014,” The New York Times, Sep 2016. [Online]. Available: https://www.nytimes.com/2016/09/23/technology/yahoo-hackers.html
- [66] E. Rader and R. Wash, “Identifying patterns in informal sources of security information,” Journal of Cybersecurity, 2015.
- [67] E. J. Rader, R. Wash, and B. Brooks, “Stories as informal lessons about security,” in Symposium On Usable Privacy and Security, SOUPS, 2012.
- [68] S. Ranger, “Ransomware attack: The clean-up continues after WannaCry chaos,” ZDNet, 2017. [Online]. Available: https://www.zdnet.com/article/ransomware-attack-the-clean-up-continues-after-wannacry-chaos/
- [69] E. M. Redmiles, ““Should I worry?” A cross-cultural examination of account security incident response,” in IEEE Symposium on Security and Privacy (S&P). IEEE, 2019.
- [70] E. M. Redmiles, S. Kross, and M. L. Mazurek, “How I learned to be secure: a census-representative survey of security advice sources and behavior,” in ACM SIGSAC Conference on Computer and Communications Security, CCS, 2016.
- [71] E. M. Redmiles, A. R. Malone, and M. L. Mazurek, “I think they’re trying to tell me something: Advice sources and selection for digital security,” in IEEE Symposium on Security and Privacy, S&P, 2016.
- [72] R. Rosenman, V. Tennekoon, and L. G. Hill, “Measuring bias in self-reported data,” International journal of behavioural & healthcare research, 2011.
- [73] M. Sharif, J. Urakawa, N. Christin, A. Kubota, and A. Yamada, “Predicting impending exposure to malicious content from user behavior,” in Proceedings of the ACM SIGSAC Conference on Computer and Communications Security, CCS. ACM, 2018.
- [74] R. Shillair, S. R. Cotten, H.-Y. S. Tsai, S. Alhabash, R. LaRose, and N. J. Rifon, “Online safety begins with you and me: Convincing internet users to protect themselves,” Computers in Human Behavior, 2015.
- [75] A. Shimada, F. Okubo, and H. Ogata, “Browsing-pattern mining from e-book logs with non-negative matrix factorization.” in EDM, 2016.
- [76] K. Stevens, P. Kegelmeyer, D. Andrzejewski, and D. Buttler, “Exploring topic coherence over many models and many topics,” in Proceedings of the Joint Conference on Empirical Methods in Natural Language Processing and Computational Natural Language Learning. Association for Computational Linguistics, 2012.
- [77] L. Tsai, P. Wijesekera, J. Reardon, I. Reyes, S. Egelman, D. Wagner, N. Good, and J.-W. Chen, “Turtle Guard: Helping android users apply contextual privacy preferences,” in Symposium on Usable Privacy and Security, SOUPS, 2017.
- [78] B. Ur, J. Bees, S. M. Segreti, L. Bauer, N. Christin, and L. F. Cranor, “Do users’ perceptions of password security match reality?” in Proceedings of the CHI Conference on Human Factors in Computing Systems, CHI. ACM, 2016.
- [79] W. M. Vagias, “Likert-type scale response anchors. clemson international institute for tourism,” & Research Development, Department of Parks, Recreation and Tourism Management, Clemson University, 2006.
- [80] R. Wash, E. Rader, and C. Fennell, “Can people self-report security accurately?: Agreement between self-report and behavioral measures,” in Proceedings of the CHI Conference on Human Factors in Computing Systems, CHI. ACM, 2017.
- [81] J. K. Winn, “Are better security breach notification laws possible,” Berkeley tech. LJ, 2009.
- [82] K. Zetter, “The year’s 11 biggest hacks, from Ashley Madison to OPM,” Wired, 2015. [Online]. Available: https://www.wired.com/2015/12/the-years-11-biggest-hacks-from-ashley-madison-to-opm/
- [83] Y. Zou, S. Danino, K. Sun, and F. Schaub, “You ‘might’ be affected: An empirical analysis of readability and usability issues in data breach notifications,” in Proceedings of the CHI Conference on Human Factors in Computing Systems, CHI. ACM, 2019, p. 194.
- [84] Y. Zou, A. H. Mhaidli, A. McCall, and F. Schaub, ““I’ve got nothing to lose”: Consumers’ risk perceptions and protective actions after the equifax data breach,” in Symposium on Usable Privacy and Security, SOUPS. USENIX Association, 2018.
- [85] Y. Zou and F. Schaub, “Beyond mandatory: Making data breach notifications useful for consumers,” IEEE Security & Privacy, 2019.
Appendix A Appendix
A.1 Characterizing browsing behavior
To identify topics that characterize participants’ browsing, we apply the Non-negative Matrix Factorization (NMF) topic-modeling algorithm [52] to participants’ browsing histories. NMF has been used in prior work for mining browsing behavior patterns [75, 45].
To build a topic model, we created one document per participant, each consisting of the tokens of the Alexa Web Information Services (AWIS) categories of the participant’s web-page visits. For example, the category for google.com is Top/Computers/internet/Searching/Search_Engines/Google.
For each participant, we tokenized the AWIS categories of the domain of each page visit and discarded the “Top” token to create a multiset of tokenized categories. If a domain appeared multiple times in a participant’s browsing history, the tokenized AWIS categories appeared an equal number of times. We then computed the term frequency-inverse document frequency (TF-IDF) score [54] for each token to produce the document-token matrix to be used as input by the NMF algorithm.
We applied the NMF topic modeling algorithm to this matrix. We varied the number of topics from two to and identified the optimal number of topics by observing when the most-frequently occurring tokens in a topic were on average most similar to each other [76, 64]. To determine this similarity, we computed the average of the pairwise cosine similarities of the top 20 tokens within each topic, using a Word2Vec model [58] trained on the same documents used to train the topic model, and then averaged these average similarities. The average within-topic cosine similarity was highest when the number of topics was two.
We examined the top 20 tokens in each topic to determine the themes of the topics. The words in one topic seemed to represent more leisure-oriented browsing (“Social_Networking”, “Shopping”, etc.) and the other professional-oriented (“Education”, “Business”, “E-mail”, etc.). As mentioned above, we used the weights of topics in the resulting document-topic matrix computed over each participant’s AWIS multiset as two features.
We also experimented with Latent Dirichlet Allocation (LDA) [11] but we observed the resulting topic clusters to not be as coherent as the ones derived with NMF.
A.2 Characterizing of browsing behavior of technical or technology-related content
To identify how much of a participant’s browsing is technology-related, we again used the NMF topic modeling algorithm to build a topic model that has two topics: 1) technical or technology-related content and 2) all other content.
We trained this model using a 1% sample of each of the participants’ browsing histories and Alexa categories described in App. A.1. Here the input only contains two documents: one for the technical webpages and one for the non-technical pages. We built each document to be a representation of the content that is categorized as technical or non-technical by its domain’s AWIS category, i.e., the technical document contains content about web pages that have the word “Technology” or “Technical” in its AWIS category and the non-technical document contains all other content. We downloaded the content of each web page in the sample with the newspaper library [62], tokenized each page’s content, and concatenated the tokens from all technical web pages to construct the technical document and from all other web pages to construct the non-technical document (from a sample of web pages of the same length as the set of pages in the technical category). When computing the TF-IDF scores for tokens in each document, we only include tokens that appear in one document but not the other. This way we are able to construct topics with tokens that are unique to either the technical or non-technical category.
After training the two-topic topic model, we determine the index of the column in the resulting document-topic matrix that corresponds to the technical document and therefore to the technical topic. We apply the trained model on the sample of each participant’s browsing history (a multiset of tokens of the page content of web pages with a defined AWIS category). The model computes two weights for each participant, of which we use the weight of the technical topic as the feature characterizing the amount of a participant’s browsing related to technical content.