An evidence-based assumption that helps to reduce the discrepancy between the observed and predicted 7Be abundances in novae
Abstract
Recent spectroscopic measurements of the equivalent widths of the resonant Be II doublet and Ca II K lines and their ratios in expanding nova ejecta indicate surprisingly high abundances of 7Be with a typical mass fraction . This is an order of magnitude larger than theoretically predicted values of for novae. We use an analytical solution of the 7Be production equations to demonstrate that is proportional to the 4He mass fraction in the nova accreted envelope and then we perform computations of 1D hydrostatic evolution of the CO nova model that confirm our conclusion based on the analytical solution. Our assumption of enhanced 4He abundances helps to reduce, although not completely eliminate, the discrepancy between and . It is supported by UV, optical and IR spectroscopy data that reveal unusually high values of in nova ejecta. We also show that a significantly increased abundance of 3He in nova accreted envelopes does not lead to higher values of because this assumption affects the evolution of nova models resulting in a decrease of both their peak temperatures and accreted masses and, as a consequence, in a reduced production of 7Be.
keywords:
nuclear reactions, nucleosynthesis, abundances, stars: abundances, stars: novae, cataclysmic variables1 Introduction
It had been suggested a long time ago that novae could produce significant amounts of 7Li (Starrfield et al., 1978). This hypothesis has recently been supported by direct spectroscopic detection and measurement of high abundances of 7Be in expanding ejecta of seven novae, taking into account that 7Li is a decay product (100% electron capture) of 7Be whose terrestrial half-life is 53.2 days (Tajitsu et al., 2015, 2016; Molaro et al., 2016; Selvelli et al., 2018; Izzo et al., 2018; Molaro et al., 2020). However, a problem arises when we compare the observed 7Be mass fractions in the novae with their theoretically predicted values and find that, on average, the former, (Molaro et al., 2020), exceed the latter, (e.g., Hernanz et al., 1996; José & Hernanz, 1998; Starrfield et al., 2020), by an order of magnitude.
The discrepancy between the observed and predicted 7Be abundances in novae can obviously be reduced either by casting doubt on the spectroscopically derived 7Be abundances, showing that they were overestimated, or by tuning up nova models under reasonable assumptions, so that they can predict higher 7Be abundances. Chugai & Kudryashov (2020) have explored the first possibility criticizing the assumption made in the cited observational works that the ionic number density ratio , obtained by comparing equivalent widths of the resonant Be II doublet and Ca II K lines to derive , is equal to the total number ratio . Chugai & Kudryashov (2020) have used observational data of Molaro et al. (2016) for the nova V5668 Sgr to construct a simple model of its expanding photosphere and atmosphere with which they have demonstrated that it was a wrong assumption. According to their model, the ionization fraction is 10 to 100 times larger than , which should decrease the abundance of 7Be in this nova, , by the corresponding factors, bringing it into an agreement with theoretical predictions.
It is beyond the scope of our paper to discuss if the conclusion about a significant overestimate of the 7Be abundance in V5668 Sgr and possibly in other novae made by Chugai & Kudryashov (2020) is true or not. We can only add that the assumption that most of the 7Be and Ca atoms are in the singly ionized state is supported, according to Tajitsu et al. (2016), by the fact that they failed to detect doubly ionized states of Fe-peak elements with second ionization potentials intermediate to those of Be II (18.21 eV) and Ca II (11.87 eV) in the spectra of novae V5668 Sgr and V2944 Oph. Also, Selvelli et al. (2018) obtained very close estimates of the 7Be abundance in the nova V838 Her using four different methods, one of which was based on the assumption that and used an equivalent width of Mg II whose ionization potential 15.03 eV is closer to that of Be II. We leave a further discussion of the veracity of the reported anomalously high abundances of 7Be in novae to stellar spectroscopists and proceed to a brief summary of previously proposed tuning-ups of nova models that result in an increase of their predicted 7Be abundances.
There are three types of models that follow in detail thermonuclear runaway (TNR) and convective nucleosynthesis in novae: 1D hydrodynamic models, 1D hydrostatic stellar evolution models, and one- or two-zone parametric models, the last ones being only used for simple estimates. For the frequently modelled CO nova with the white-dwarf (WD) mass , the largest value of has been obtained by Starrfield et al. (2020) in their 1D hydrodynamic simulation in which the solar composition of accreted envelope was switched to a mixture of 25% of the WD and 75% of the solar compositions immediately after a start of the TNR, when convective mixing had begun, to mimic the dredge-up of the WD material by convection, as revealed by 3D hydro simulations of Casanova et al. (2016). Our nova evolutionary model with 50% pre-mixed WD composition in the accreted envelope computed using the MESA code implemented in the Nova Framework (Denissenkov et al., 2014) predicts the same value of as the one obtained by Starrfield et al. (2020) for their second considered case of a mixture of equal amounts of the WD and solar compositions. This is larger than the value of reported by José & Hernanz (1998) for their 1D hydrodynamic nova model with the similar parameters. The two-zone parametric model of Chugai & Kudryashov (2020) has an upper limit of .
Because 7Be is produced in the reaction 3He(Be, it has been suggested many times, but, as far as we know, has not been verified in nova simulations yet, that a higher 3He mass fraction in accreted matter could help to reduce the discrepancy between the observed and predicted 7Be abundances in novae. In this Letter, we will show that, instead of 3He, it is rather an assumed enhanced abundance of 4He, which is indeed observed in nova envelopes (Gehrz et al., 1998; Downen et al., 2013), that can help to push the predicted abundance of 7Be in novae closer to its observed values, that will be represented here by the value of considered as a typical 7Be yield for novae by Molaro et al. (2020), thus reducing the discrepancy between observations and theory.
2 Equations of the 7Be production and their analytical solution
The rates of the reactions that affect the production of 7Be in novae have negligible uncertainties, which leaves us with a few parameters whose variations within their reasonable limits may lead to a significant increase of this production. The surprisingly good agreement between the 7Be yields provided for the similar nova models by different simulations means that it is probably not details of the physics of nova explosion that mainly determine the predicted 7Be abundance in its ejecta. Therefore, we have decided to vary the initial abundance of 3He, as was previously proposed, and also that of 4He, because these parameters can still be considered as relatively free (their possible variation ranges will be discussed later) and because their values are expected to directly affect the 7Be production in the reaction 3He(Be. The fruitful consumption of 3He by this reaction is accompanied by its waste in the competing reaction 3He(3He,2p)4He whose cross section is five orders of magnitude larger. At given temperature , density , and constant 4He mass fraction , this competition is described by the following 7Be production equations:
where and are -dependent rates ( is the product of the Maxwellian-averaged cross section and Avogadro number) of the reactions 3He(3He,2p)4He and 3He(Be, respectively. The analytical solution of these equations is
| (1) |
where , and is the initial mass fraction of 3He.
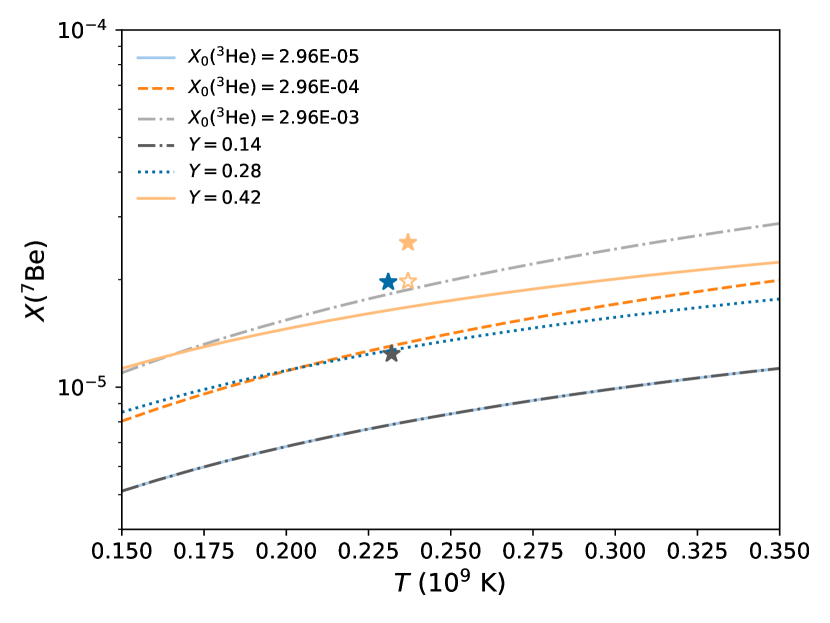
Taking a half-solar value of , for the density and temperature that are achieved near the maxima of energy generation rates in both the CNO cycle and the pp chains at the bottom of the accreted envelope in our CO nova model (Section 3), we find the timescale that is comparable to the timescale of very fast changes of the nova and profiles during a time interval of around its peak temperature. By the end of this period, has already attained its maximum value. Therefore, when estimating the final values of predicted by our analytical solution, we ignore the exponent in Equation (1), assuming that . These values are plotted in Figure 1 for a range of and for different values of the parameters and , keeping one of them fixed at its half-solar value, i.e. and for the 50% WD pre-mixed accreted matter, and assuming that all 2H was transformed into 3He in the donor star, when changing the other.
From Figure 1 we see that increases with , which agrees with its increase with the WD mass found by Starrfield et al. (2020). The range of the 7Be yield predicted for novae by our analytical solution for the half-solar values of both and encompasses almost all the values of predicted by the corresponding 1D nova models. It is clear from Equation (1) that the persistent prediction of by nova models is simply caused by the fact that and this ratio weakly depends on .
Given that the predicted value of , Equation (1) can also be written as
| (2) |
where , and is the abundance of 7Li for the case of . This equation assumes that and again that . It has been derived by Boffin et al. (1993) with the value of constrained by results of their parametric one-zone nova model calculations. For their preferred value of , our analytical solution provides . The logarithmic dependence of on is clearly seen in Figure 1.
The maximum enhancement of the initial 3He abundance relative to its solar value, assumed in Figure 1 for the accreted matter, could potentially come from the so-called 3He bump inside the donor star, formed as a result of incomplete H burning in the pp I branch, like in all solar-type stars. Then, given that the WD companion is most likely to be tidally locked, its rapid rotation and tidal deformation should drive meridional circulation that may reach the bump and bring the abundant 3He to the surface from where it will be donated to the WD. It is also possible that the companion has lost enough mass to expose the 3He bump at its surface (Shen & Bildsten, 2009).
Equation (1) and Figure 1 also show that the amount of 7Be produced in novae is proportional to , hence its increase by the factors of 2 and 3 should result in the enhancements of comparable to those obtained for . Table 2 of Gehrz et al. (1998) and Table 1 of Downen et al. (2013) summarize UV, optical and IR spectroscopy data on mass fractions of H, He and heavy elements in nova ejecta. Most of the values presented in this table exceed the half-solar value of used in our and other similar nova models with the 50% pre-mixed WD composition, nearly 30% of them being larger than with six stars having . Therefore, the assumption of in the nova envelope that we make in this work is supported by observations.
Because 3He burning starts at the bottom of the accreted envelope before the TNR is triggered by the reaction 12C(p,N (e.g., Shen & Bildsten, 2009, and references therein), the impact of a significant increase of its initial abundance on the 7Be production in novae can only be studied using full nova models, since neither simple one- or two-zone parametric models nor even multi-zone post-processing nucleosynthesis models, like the one of the Nova Framework that uses the NuGrid mppnp code (Denissenkov et al., 2014), take into account a feedback of this assumption on nova properties. Therefore, we have employed the MESA code setup of the Nova Framework to perform 1D hydrostatic evolutionary computations of our CO nova model with increased abundances of 4He and 3He in its accreted envelope, results of which are presented in the next section.
3 Results of CO nova evolutionary computations with increased abundances of 4He and 3He in the accreted envelope
Our Nova Framework has been using the revision 5329 of the MESA stellar evolution code (Paxton et al., 2011; Paxton et al., 2013) with a content of its inlist file set up to model CO and ONe nova evolution (Denissenkov et al., 2014). In this work, we have chosen the largest of the nuclear reaction networks available in the Nova Framework nova.net with 77 species from 1H to 40Ca coupled by 442 reactions for which we have used the rates from the JINA Reaclib v1.1 database (Cyburt et al., 2010). This network includes most of the reactions affecting the 7Be production in novae discussed by Boffin et al. (1993) and Hernanz et al. (1996), except 7Be(C and the chain 8B(p,C(eHe because these are much slower than their competing reactions 7Be(p,B and 8B(eHe.
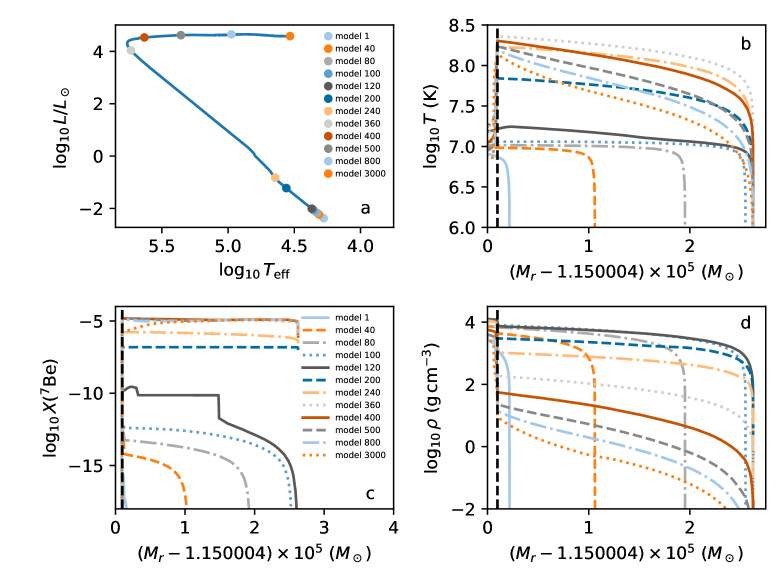
Results of our computations of the evolution of the CO nova model with the WD central temperature K and accretion rate are presented in Figure 2 for the 50% WD pre-mixed composition of the accreted envelope, including the 4He and 3He mass fractions, i.e. for and . As already mentioned, we see that the 7Be abundance attains its maximum value of (panel c) around the peak temperature (panel b), when the star approaches the knee of its evolutionary track (between the models 360 and 400 in panel a). By this moment, the density at the bottom of the convective envelope has already dropped to from its maximum value of . The model has accreted by the beginning of its TNR, and its evolution was followed for 71 minutes after the peak temperature.
After the 4He mass fraction in the accreted envelope was increased to the values of and , that are within the limits of measured in nova ejecta (Gehrz et al., 1998; Downen et al., 2013), at the expense of the 16O abundance to keep the sum of all mass fractions equal to one, the maximum 7Be abundances in our nova model have reached the values of and , respectively. The other nova properties have essentially remained unchanged. All the three values of predicted by the nova model are displayed in Figure 1 as star symbols of the same colours that we used to plot the analytical solution curves for the corresponding values of . Although resulting in slightly different values, unsurprisingly because we compare the simple one-zone and detailed multi-zone evolutionary nova models, the two sets of computations show the same trend of the predicted 7Be abundance increasing with . It is interesting that our value of obtained for agrees very well with the value of reported by Starrfield et al. (2020) for their 1D hydrodynamic CO nova model with a mixture of 25% WD and 75% solar compositions in the envelope that has a close value of .
The results change drastically when we assume a significantly increased initial abundance of 3He in the accreted envelope. For and our nova model yields which is 22% lower than for the nova model with the same value of and the half-solar mass fraction of 3He (the filled and open star symbols of the same colour in Figure 1). The other nova properties also undergo considerable changes, e.g. the peak temperature and the accreted mass are reduced to and . These changes are caused by the substantially increased heating of the bottom of the accreted envelope by the energy released in the reaction 3He(3He,2p)4He whose value MeV is much larger than MeV for the TNR triggering reaction 12C(p,N. As a result, the TNR starts earlier, with the lower peak and . Thus, taking into account the feedback of the increased value of on the nova properties leads to a decrease, rather than to the previously expected increase, of the maximum 7Be abundance predicted with the evolutionary nova model. Therefore, Equations (1) and (2) derived for the one-zone parametric model do not provide correct dependencies of the 7Be and 7Li nova yields on the initial abundance of 3He.
4 Conclusion
We have done 1D stellar evolution computations of the popular CO nova model to demonstrate that the 7Be production in novae increases proportionally to the 4He mass fraction in their accreted envelopes, as predicted by the analytical solution (1). Therefore, the assumption of a 2 to 3 times enhanced value of , as compared to the half-solar value of used in nova models accreting a mixture of equal amounts of the WD and solar compositions, helps to reduce, although not completely eliminate, the discrepancy between the observed and theoretically predicted 7Be mass fractions in novae, and . This assumption is supported by the surprisingly high values of , with the maximum value of , reported in nova ejecta by Gehrz et al. (1998) and Downen et al. (2013) that have not been explained or refuted yet. The high 4He abundances in nova ejecta could come from a 4He layer atop of the accreting white WD that is formed as a result of H afterburning during the post-nova supersoft X-ray phase (Iben et al., 1992; Starrfield et al., 1998; Wolf et al., 2013).
We have also shown for the first time that the previously proposed hypothesis of a significantly enhanced, up to , mass fraction of 3He in the nova accreted envelope does not raise closer to . Instead, it results in a decrease of because of the feedback of this assumption on nova properties — the increased release of heat in the highly energetic reaction 3He(3He,2p)4He at the bottom of the accreted envelope leads to an earlier TNR with lower both peak temperature and accreted mass.
If we extrapolate our result obtained for (the orange star symbol in Figure 1) to the peak temperature of the ONe nova model (e.g., see Table 1 of Denissenkov et al., 2014) we will get an estimate of that is only times smaller than the average mass fraction of 7Be observed in novae, although a slight decrease of the latter is still required for a better match.
Of note for future work, the higher 7Be mass fraction calculated here would lead to a higher yield of the characteristic 478 keV gamma ray via the 10% 7Be() branch to the 1st excited state of 7Li, as calculated in e.g. Gomez-Gomar et al. (1998), in which the terrestrial value of the 7Be EC lifetime is adopted under the assumption that full Be ionization is not substantial. Applying the formalism of Iben et al. (1967) to the conditions at the end of our nova trajectory (71 minutes) implies a very small free electron capture rate, as expected due to the low density. Furthermore, the occupation probabilities for K-shell electrons under these conditions are very small, implying that most of the 7Be is fully-ionized at this stage and will not convert at the terrestrial rate to 7Li until conditions are met such that bound state captures occur frequently again. Thus the effective lifetime, considering only the small K-shell capture rate, is on the order of days. Due to the timescales involved in the nova trajectory, it is not clear that this variation in lifetime will affect the temporal evolution of the 478 keV line, and requires careful consideration of the conditions in the hot expanding ejecta.
Acknowledgements
FH acknowledges funding from NSERC through a Discovery Grant. This research is supported by the National Science Foundation (USA) under Grant No. PHY-1430152 (JINA Center for the Evolution of the Elements).
Data availability
The data underlying this article will be shared on reasonable request to the corresponding author.
References
- Boffin et al. (1993) Boffin H. M. J., Paulus G., Arnould M., Mowlavi N., 1993, A&A, 279, 173
- Casanova et al. (2016) Casanova J., José J., García-Berro E., Shore S. N., 2016, A&A, 595, A28
- Chugai & Kudryashov (2020) Chugai N. N., Kudryashov A. D., 2020, arXiv e-prints, p. arXiv:2007.07044
- Cyburt et al. (2010) Cyburt R. H., et al., 2010, ApJS, 189, 240
- Denissenkov et al. (2014) Denissenkov P. A., et al., 2014, MNRAS, 442, 2058
- Downen et al. (2013) Downen L. N., Iliadis C., José J., Starrfield S., 2013, ApJ, 762, 105
- Gehrz et al. (1998) Gehrz R. D., Truran J. W., Williams R. E., Starrfield S., 1998, PASP, 110, 3
- Gomez-Gomar et al. (1998) Gomez-Gomar J., Hernanz M., Jose J., Isern J., 1998, MNRAS, 296, 913
- Hernanz et al. (1996) Hernanz M., Jose J., Coc A., Isern J., 1996, ApJ, 465, L27
- Iben et al. (1967) Iben Icko J., Kalata K., Schwartz J., 1967, ApJ, 150, 1001
- Iben et al. (1992) Iben Icko J., Fujimoto M. Y., MacDonald J., 1992, ApJ, 388, 521
- Izzo et al. (2018) Izzo L., et al., 2018, MNRAS, 478, 1601
- José & Hernanz (1998) José J., Hernanz M., 1998, ApJ, 494, 680
- Molaro et al. (2016) Molaro P., Izzo L., Mason E., Bonifacio P., Della Valle M., 2016, MNRAS, 463, L117
- Molaro et al. (2020) Molaro P., Izzo L., Bonifacio P., Hernanz M., Selvelli P., della Valle M., 2020, MNRAS, 492, 4975
- Paxton et al. (2011) Paxton B., Bildsten L., Dotter A., Herwig F., Lesaffre P., Timmes F., 2011, ApJS, 192, 3
- Paxton et al. (2013) Paxton B., et al., 2013, ApJS, 208, 4
- Selvelli et al. (2018) Selvelli P., Molaro P., Izzo L., 2018, MNRAS, 481, 2261
- Shen & Bildsten (2009) Shen K. J., Bildsten L., 2009, ApJ, 692, 324
- Starrfield et al. (1978) Starrfield S., Truran J. W., Sparks W. M., Arnould M., 1978, ApJ, 222, 600
- Starrfield et al. (1998) Starrfield S., Truran J. W., Wiescher M. C., Sparks W. M., 1998, MNRAS, 296, 502
- Starrfield et al. (2020) Starrfield S., Bose M., Iliadis C., Hix W. R., Woodward C. E., Wagner R. M., 2020, ApJ, 895, 70
- Tajitsu et al. (2015) Tajitsu A., Sadakane K., Naito H., Arai A., Aoki W., 2015, Nature, 518, 381
- Tajitsu et al. (2016) Tajitsu A., Sadakane K., Naito H., Arai A., Kawakita H., Aoki W., 2016, ApJ, 818, 191
- Wolf et al. (2013) Wolf W. M., Bildsten L., Brooks J., Paxton B., 2013, ApJ, 777, 136