GASNet: Weakly-supervised Framework for COVID-19 Lesion Segmentation
Abstract
Segmentation of infected areas in chest CT volumes is of great significance for further diagnosis and treatment of COVID-19 patients. Due to the complex shapes and varied appearances of lesions, a large number of voxel-level labeled samples are generally required to train a lesion segmentation network, which is a main bottleneck for developing deep learning based medical image segmentation algorithms. In this paper, we propose a weakly-supervised lesion segmentation framework by embedding the Generative Adversarial training process into the Segmentation Network, which is called GASNet. GASNet is optimized to segment the lesion areas of a COVID-19 CT by the segmenter, and to replace the ‘abnormal’ appearance with a generated ‘normal’ appearance by the generator, so that the ‘restored’ CT volumes are indistinguishable from healthy CT volumes by the discriminator. GASNet is supervised by chest CT volumes of many healthy and COVID-19 subjects without voxel-level annotations. Experiments on three public databases show that when using as few as one voxel-level labeled sample, the performance of GASNet is comparable to fully-supervised segmentation algorithms trained on dozens of voxel-level labeled samples.
Convolution Neural Network, COVID-19, GAN, Weakly-supervised Segmentation
1 Introduction
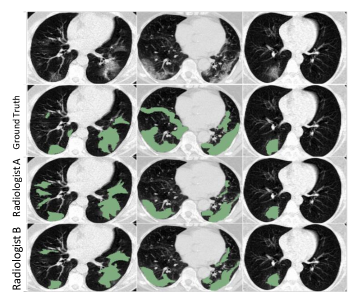
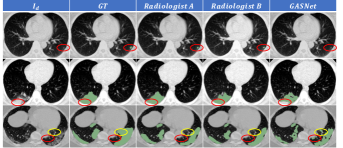
The epidemic of coronavirus disease 2019 (COVID-19) is raging around the world. Chest CT can detect small lesion areas due to its high spatial resolution and therefore is an effective imaging tool for monitoring the disease [1][2]. Automatic segmentation of lesion areas of a COVID-19 CT can facilitate medical experts in diagnosing by focusing on the Region of Interest (RoI) instead of the whole volume. Besides, statistics related to the lesion area are part of the criteria for determining the severity [3][4]. However, this task is challenging as the lesion areas are extremely varied. Three typical COVID-19 CT scans from a public dataset [5] are shown in Fig. 1. It can be seen that the lesions range from small to large, and the appearance may be of ground glass opacity, consolidation, or mixed type. Due to blurry and indistinguishable boundaries between infected and healthy areas, voxel-level labeling of lesions is not only time-consuming, but also tends to contain inconsistency between different annotators. Fig. 1 also shows the infectious annotation as ground truth (GT) along with the dataset and the manual segmentation results by two other radiologists. Since the boundary of the infected area is very fuzzy, even the segmentation results given by two experienced radiologists have obvious inconsistencies with GT.
Deep learning shown encouraging performance for lesion segmentation of COVID-19 CT, but only when a sufficient amount of labeled data such as thousands of slices is available [6][7][8][9]. It takes more than 200 minutes on average to annotate the lesion area of one COVID-19 CT volume [8]. The high cost of collecting expert annotations is a big obstacle to the development of medical image segmentation algorithms for new diseases like COVID-19.
Data augmentation [10][11] and image synthesis [12][13] may alleviate the lack of pixel/voxel-level annotations to a varying degree. Self-learning or active learning [14][15][16] updates the segmentation model by iteratively providing pseudo label to the unlabeled data, and hopes to gradually improve the precision. Other methods try to make up for the lack of pixel/voxel-level supervision information by using image/volume-level labels, such as Class Activation Maps (CAMs) [17], Generative Adversarial Network (GAN) [18], and Multiple Instance Learning (MIL) [19]. However, these methods have more or less the following problems: (1) a certain number of samples with pixel/voxel-level annotations are still necessary; (2) using pseudo-label data may introduce noise; and (3) the mapping from volume-level annotation information to voxel-level segmentation is usually not accurate enough. Detailed comment on related medical image segmentation methods is provided in section 2.
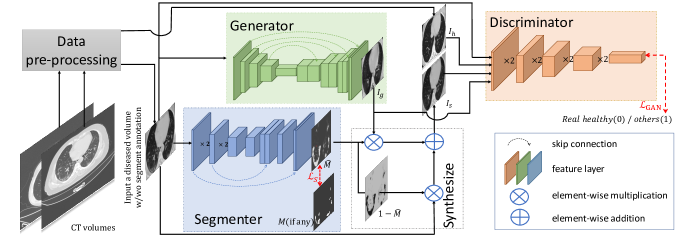
Our idea is to ‘restore’ the CT volume of a COVID-19 patients to the status when he/she is healthy by combining a segmentation network and a generative network. Restoration performance is supervised by a discriminator that is trained using CT scans of many healthy people and COVID-19 patients (without voxel-level labeling of lesion areas). This scheme is feasible since a large number of volume-level labels, indicating whether a CT volume is COVID-19 positive or not, are directly available from diagnosis results in COVID-19 designated hospitals and more reliable [20] than voxel-level annotations obtained manually. The proposed framework is designed to mine the potential knowledge contained in many COVID-19 positive and negative CT volumes by embedding Generative Adversarial training in a standard Segmentation Network, referred to as GASNet, and hence its demand for voxel-level annotations is very small. Fig. 2 shows the pipeline of GASNet. Both the generator and the segmenter take a COVID-19 CT volume as input, and the two outputs together with the original CT volume are fused to form a synthetic healthy volume. Both real and synthetic healthy volumes are fed to the discriminator. In the training process, the goal of the discriminator is to distinguish between the synthetic healthy volume and the real healthy volume, while the goal of the generator and the segmenter is to deceive the discriminator. Such an adversarial training strategy will push the segmenter to segment the lesion areas of a COVID-19 CT as precisely as possible. We also propose a simple but effective strategy of synthesizing COVID-19 CT volumes with voxel-level pseudo-labels during the adversarial training process, which further improves the segmentation performance of GASNet. A detailed description of the algorithm will be given in section 3.
Compared with other weakly-supervised methods, a major advantage of GASNet lies in utilizing volume-level labels in an adversarial learning way, alleviating the burden of voxel-level annotation and maintaining a good segmentation performance at the same time. When using only one voxel-level labeled sample in training, GASNet obtains a 70% Dice score on a public COVID-19 lesion segmentation dataset [5], comparable to representative fully-supervised algorithms (U-Net [21], V-Net [22], and UNet++ [23]) requiring a large number of voxel-level annotated samples. Code of GASNet is available at https://github.com/xzwthu/GASNet. Details of the experiments are in section 4 and section 5.
2 Related Work
In this section, we first introduce existing public COVID-19 CT databases containing lesion annotation, then review current COVID-19 lesion segmentation methods both in fully-supervised and weakly-supervised way, and finally describe recent weakly-supervised methods and GAN methods in general medical image segmentation.
2.1 Public COVID-19 CT segmentation datasets
Performance evaluation using public datasets is very important for comparing different image segmentation algorithms. Being an emerging research direction, most COVID-19 studies are conducted independently [6][7][8], using non-public data. Very recently, a few public databases are available [5][24][25]. Giving a brief description of these databases is necessary before we discuss performance of different algorithms. We summarize the current public COVID-19 CT segmentation datasets in Table 1. Detailed descriptions are in section 4.
|
|
|
||||
|---|---|---|---|---|---|---|
|
|
|
||||
|
|
|
||||
|
|
|
2.2 Fully-supervised COVID-19 lesion segmentation
Most of the COVID-19 lesion segmentation methods [6][7][8] are based on U-Net [21] structure or its modifications, containing an encoding path and a decoding path, which are connected by skip connection at the corresponding resolution. Zhang et al. [6] adopt a two-stage segmentation framework for segmenting lung lesions into five classes. They train on a total of 4,695 CT slice images with voxel-level annotations and obtain an mDICE score of 58.7%. Wu et al. [7] jointly train a segmentation network and a classification network, using over 144K slices including 3,855 voxel-level labeled CT scan slices from 200 COVID-19 patients. They obtain a 78.3% Dice score on their dataset. Shan et al. [8] use a 3D VB-Net as the backbone and employ a Human-In-The-Loop (HITL) strategy to train the network on 400 CT volumes. The HITL strategy reduces the annotation time and improves the accuracy. The net time spent on labeling data is still more than 176 hours, and they report a 91% Dice score on their own dataset. However, [7][8] have not published their codes, neither did they report their performance on public datasets. We reproduce the network structures of these works and test their performance on Dataset-A [5] following a 5-fold cross-validation strategy. The performance is slightly improved compared with a normal U-Net network, with Dice scores of 64% and 63%, while the performance of U-Net is 62%. For more details, please refer to section 5.
Besides U-Net, other deep models have also been used for COVID-19 lesion segmentation. Fan et al. [27] propose modules named Parallel Partial Decoder and Reverse Attention Module to improve lesion segmentation performance. They also conduct a test with semi-supervised strategy, collecting an unlabeled dataset and giving pseudo values iteratively, and gain a Dice score of 59.7% on Dataset-B [24]. Qiu et al. [9] propose a lightweight 2D model pre-trained on ImageNet dataset [28] and obtain performance comparable to heavy models like the fully convolutional network (FCN) [29] structure (77% VS 75%) on a dataset consisting of 110 axial CT slices from 60 patients with COVID-19 [30].
2.3 Weakly-supervised COVID-19 lesion segmentation
The latest research begins to explore lesion segmentation of COVID-19 volumes in weakly-supervised scenarios. Laradji et al. [31] propose to train a neural network with active learning on a point-level annotation scenario. Yao et al. [32] design a set of simple operations to synthesize lesion-like appearances, generate paired training datasets by superimposing synthesized lesions on the lung regions of healthy images, and train a model to predict the healthy lung part of the input. A set of specially designed methods combining threshold selection, morphological processing, and region growth are used to determine the lesion segmentation during the test. Zhang et al. [33] also use the GAN network as we do, but the purpose of GAN in their method is to perform data augmentation based on existing voxel-level labeled samples, so as to generate more paired samples with pseudo labels. Two segmentation networks, ENet [34] and U-Net, are trained to verify the effectiveness of the proposed data augmentation.
|
Dataset |
|
|
|
|||||||||||
|---|---|---|---|---|---|---|---|---|---|---|---|---|---|---|---|
|
A [5] |
|
|
|
|||||||||||
|
B [24] |
|
|
|
|||||||||||
|
A [5] |
|
|
|
|||||||||||
|
A [5] |
|
|
|
Different from the above methods, we focus on designing a weakly-supervised segmentation framework under volume-level label supervision. Our framework simultaneously trains the GAN and the segmentation network and dynamically extracts the volume-level annotation information through adversarial learning, thus minimizing the requirement for voxel-level annotations. The comparison of GASNet with the above methods on the division of dataset, the number of annotations, and performance of segmentation are given in Table 2, and a more detailed comparison will be given in section 4.
2.4 Weakly-supervised medical image segmentation
Various methods of using weak annotations have been proposed in medical image segmentation area. Several works are devoted to the use of extra but sparse annotations, including scribbles [35], points [36][37], and bounding boxes [38][39]. Scribbles and points require labeling at least one scribble or point for each RoI and the labeled areas will be used to calculate the segmentation loss directly. As for the unlabeled part, Wang et al. [36] propose generating initial segments via a random walker algorithm [40], and then train a fully-supervised segmentation network. Qu et al. [37] propose a similar pipeline using a different method for label generation, combining K-means clustering results and Voronoi partition diagram. Instead of generating a pseudo label for the unlabeled areas, Valvano et al. [35] directly predict the segmentation results by adding shape constraints through multi-GAN to make the segmentation results look realistic at multi-scales. Bounding boxes provide a more well-refined position constraint for segmentation but are more time-consuming for annotation [38][39].
The major limitation of the aforementioned approaches is relying on additional dataset annotations, which can be time-consuming and is prone to errors (for example, not all voxels in the bounding box should be positive; scribbles and points annotation can miss challenging labeled samples), and the errors can be propagated to the models during training. Methods using GAN, such as [35] even need unpaired real segmentation masks, which are voxel-level labeled, as the real samples for the discriminator.
Weakly-supervised learning under volume-level label supervision earns increasing interest in medical image segmentation because it adds no annotation burden. Xu et al. [41] enrich the volume-level labels to instance-level labels by multiple instance learning (MIL) and segment histopathology images using only volume-level labels. However, MIL shows unsatisfactory performance on lesion segmentation of COVID-19 as shown in section 4. Feng et al. [42] propose a method especially for pulmonary nodules segmentation that learns discriminative regions from the activation maps of convolution units (CAM) in an image classification model. Ouyang et al. [43] employ the attention masks derived from a volume-level classification model as the voxel-level masks for weakly-annotated data. Because the attention masks are rough and inaccurate, hundreds of voxel-level annotations are still necessary for accurate lesion segmentation like pneumothorax segmentation in chest X-ray [43].
2.5 GAN for medical image segmentation
GAN is increasingly adopted as an assistance to medical image segmentation task. The mainstream directions of GAN based methods include: (1) synthesizing more available training sample pairs [12][13][44], where GAN is a tool for data augmentation, and the training of segmentation network has no feedback on the quality of synthetic data. (2) Adapting domain to leverage external labeled datasets [45][46][35]. The external dataset is required to contain enough pixel/voxel-level labeled training samples. And (3) considering the segmentation network as a generator and designing the discriminator as a structure of FCN [29] to obtain a confidence map of segmentation prediction, and thus helping the optimization of the segmentation network based on it [15][47][48]. Such methods do not use volume-level annotation, and their requirement for voxel-level labeled samples is considerable.
3 Proposed Method
In this section, we first illustrate the pipeline of GASNet. Then, we describe the auxiliary constraint terms in the form of loss functions used to make the training more stable and GASNet perform better. We will also detail a simple but effective method of generating COVID-19 positive CT volumes with voxel-level pseudo-label to improve the segmentation performance of GASNet. Finally, we provide the implementation details, including the specific structure, data preprocessing, and the training hyperparameters.
3.1 GASNet
GASNet consists of three modules: the generator (G), the discriminator (D), and the segmenter (S). The data input to GASNet includes a small amount of voxel-level labeled data , and a large amount of volume-level labeled data and , where is the diseased volume data and is the healthy volume data. Our method is based on a simple fact: the appearance of a lesion area contains the most obvious feature to distinguish COVID-19 CT from healthy CT. We train a segmenter that can provide segmentation masks and utilize a generator to replace the predicted lesion area with a generated one whose appearance is close to the uninfected area while maintaining the uninfected area. If the synthetic healthy volumes successfully deceive the binary classifier, which is the discriminator in GASNet, we can obtain an accurate enough segmentation result. The synthetic volume is fomulated by:
| (1) |
where is the probabilistic segmentation mask predicted by S, is the generated volume, and , are the learnable parameters of S and G respectively.
To fully deceive the discriminator, the segmenter needs to segment all infected areas and the generator needs to generate confusing volumes at the predicted lesion area of the segmentation. In contrast, the discriminator will try to distinguish the synthetic volume from the real healthy one. We label the synthetic volume as 1 and the real healthy volume as 0, and train the GASNet in an adversarial way via the following minimax game:
| (2) |
where the objective function 111 We denote , and for simplicity. is given by
where is the prediction of the D, is fomulated by Eq 1, and represents the learnable parameters of D.
As the formation of the synthetic volume is related to the prediction mask and the generated volume, gradient of can feed back to both the S and G. Also, we add a basic segmentation loss measuring the difference between the output of S and the GT of a small number of voxel-level labeled samples: 222 We denote and CEL(·,·) CrossEntropyLoss(·,·) for simplicity. , where , is the ground truth of the voxel-level labeled data .
3.2 Auxiliary constraints in the form of loss functions
Logically and theoretically, provided that we carefully train G, D, and S, the synthesized volume will be nearly close to the healthy volume. However, frameworks with GAN are generally difficult to train [48][49][50][51]. The quality of the generator and the discriminator is the crux for our ultimate goal of segmenting infected areas accurately. Several auxiliary constraints are added to the loss functions to make the adversarial training more stable, leading to better performance.
First, the naive GASNet contains defects of the bias of the input. The segmenter is fed with only diseased volumes in the original GASNet. This brings sample bias and leads to false-positive predictions on healthy samples during testing. For healthy CT volumes, we expect the predicted segmentation maps are all zero, and the output of the generator is a reconstructed volume of the original input. Therefore, the healthy volumes are also inputted into the segmenter and the generator. The cross entropy loss between and , where are all zero, is added to .
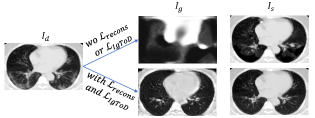
Second, no supervision constrains the parts of the generated volume where the segmentation values are close to zero because they are not used to form the synthetic volume, and the quality of the generated volume is uncontrollable due to the lack of the supervision signal. It becomes the bottleneck of improving the final performance of the segmenter. A reconstruction loss constrains the output of the generator: , where MSE(·,·) is the mean square error function, alleviates the problem. We also introduce an additional loss to for further improvement by feeding the generated volume of into the D. Fig. 3 shows the comparison of the generated volumes before and after adding and . We can see that the quality of the generated volume and the synthetic volume are significantly improved, so as to the performance of the segmenter, which will be detailed in section 5. When the input of the S are healthy volumes, the forward propagation process of synthesis and discrimination is not needed, and will not be calculated.
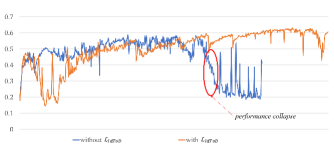
As the training proceeds and the synthetic volume gets closer to the real healthy volume, the lesion signal that can be captured by the D becomes weaker and weaker. The D will tend to learn the noise signal between the data and rather than the pathological signals, which leads to the performance collapse of the GASNet. Fig. 4 gives an example where performance collapse happens during training. The segmenter not only segmented the lesion area but also the healthy area, modifying both the pathological signals and the noise signals of the synthetic volume to confuse the discriminator. This leads to an extremely low segmentation performance.
Inspired by the idea of dropout in the field of weakly supervised localization [52][53][54], where a dropout layer randomly determines whether to block the distinguishing features coming into the next layer of the classification network, we also feed the original diseased volume to the D in order to maintain the sensitivity and discriminability of the discriminator to the lesion signal during the training, meaning the dropout ratio is fixed at 0.5. A constraint loss is added to , hoping that the D can always distinguish between volumes of the patients and the healthy people. Fig. 5 compares the training curves with and without the auxiliary constraint from and shows that alleviates the performance collapse of GASNet markedly.
Finally, as the data has no voxel-level annotations, the final S may segment any lesion areas for some mild infected CT volumes. Inspired by MIL [19], we add a MIL loss to : , meaning at least one voxel of an diseased volume should be predicted as positive.
To sum up, we extend loss functions and by adding four new losses as auxiliary constraints. The final objective function is defined as follow:
3.3 Synthesize COVID-19 positive CT volumes with voxel-level pseudo-label
With the losses detailed in subsection 3.2, GASNet can be trained stably and achieve good performance. We can further improve the segmentation performance by synthesizing COVID-19 positive CT volumes with voxel-level pseudo-label during the training process. Given an unlabeled COVID-19 data and its predicted lesion segmentation mask , a healthy data and its predicted lung mask where can be obtained by existing automatic algorithms [55], we can synthesize a COVID-19 positive volume and its corresponding pseudo-label as follows:
where label 2 means voxels whose labels are not considered. We set as in our experiment.
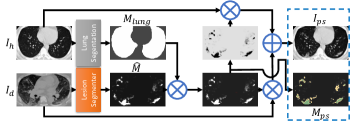
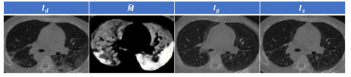
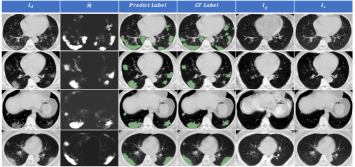
Different from the synthesis method in [32], in which the distribution and shpae of lesions added to the healthy volumes are artificailly defined, the lesion area of our synthetic data is dynamically extracted from the real COVID-19 positive volumes. Different from [33], in which the synthetic volume is generated through complex cascade generative networks given a label map of lesion and lung, our synthetic data is formed by simple linear weighted fusion of real infectious areas and real health volumes. Fig. 7 gives three examples of and corresponding . The synthetic COVID-19 volumes look very natural and diverse. Relying on the generated paired data and , we can alleviate the problem of insufficient voxel-level labeled samples by adding corresponding voxel-level cross entropy loss to during the training. boosts the segmentation performance of GASNet by 5.5% in our experiments, as shown in section 5.
3.4 Implementations
Data pre-processing
The 3D volume sample of each CT is cropped along the lung mask. The cropped volume is then resized into . Following the advice from [5], we clipped the value of CT volumes into [-1250,250]. As the tanh operation is used as the output of the generated volume, and the value of the output after a tanh operation ranges from - 1 to 1, we normalized the input volume into the same range. The automatic lung segmentation algorithm is based on an open-source pre-trained U-Net model [55]. This lung segmentation algorithm may not be perfect in some cases, but we just use it to get an approximate bounding box around the lung area. Lung segmentation of COVID-19 volumes are never used after pre-processing.
The structure of GASNet
Without loss of generality, we adopt the standard U-Net structure as the segmenter of GASNet. Regarding the memory usage of the 3D volume, the number of the basic channel is reduced to 16 from 64 in the original paper. The generator and discriminator follows the structure of CycleGAN [56]. Following the advice in [57], we add the spectral normalization operation to the discriminator.
Training strategy and hyperparameters
Four datasets are required in order to train GASNet and get the best model, as shown in Algorithm 1. Since the target between training the S and the G and training the D is adversarial, we iteratively update their parameters using the corresponding loss in each step. Both and have contributions to the optimization of the segmenter, so there exists a hyperparameter to balance the two losses: . As G and D are trained alternately, a hyperparameter controls the ratio of the number of times G and D are trained in each alternation. Validation is carried out every and only the parameters with the best performance on the validation dataset will be saved.
4 Experiments
4.1 Dataset
We test the performance of our method on three public COVID-19 CT segmentation datasets [24][25][5]. Another public dataset with only slice-level annotations [30] used in [27][9] is not suitable for GASNet for two reasons: (1) GASNet takes 3D CT volumes, rather than 2D slices as input; (2) annotations on slice-level, indicating whether a slice contains lesion area, are not directly available from diagnosis results.
Dataset-A [5] consists of 20 CT volumes. Lungs and areas of infection were labeled by two radiologists and verified by an experienced radiologist. CT values of 10 volumes have been transformed to the range of [0,255]. Considering original CT values are unavailable, some work [32] did not test the performances on these volumes. We divide the dataset into (original CTs) and (10 transformed CTs), like [32][33], and report the separate and overall performances.
Dataset-B [24] consists of 9 COVID-19 CT volumes with voxel-level annotations by a radiologist.
Dataset-C and Dataset-D (Volume-level annotation) are from MosMed [25], which consists of 856 CT volumes with COVID-19 related findings as well as 254 CT volumes without such findings. 50 COVID-19 cases have voxel-level annotations of lesions by experts, which forms Dataset-C. The rest of the data, consisting of 254 healthy volumes and 806 COVID-19 volumes excluding 50 voxel-level labeled samples, forms Dataset-D. The diagnosis results of the CT volumes can be used as volume-level labels directly.
Dataset-E (Volume-level annotation) is a large dataset with volume-level annotation we collected, in which 1,678 COVID-19 CT volumes come from the Wuhan Union Hospital, whose patients have been diagnosed as COVID-19 positive by nucleic acid testing, and 1,031 healthy CT volumes come from the routine physical examination.
4.2 Experimental settings
For training, all volume-level labeled data in Dataset-E is used to optimize GASNet. As for voxel-level labeled data, one volume randomly selected from Dataset-A is used for training and all of the rest, including 19 cases of Dataset-A and all volumes from Dataset-B and Dataset-C, are used for the test. Since Dataset-D comes from the same source as Dataset-C, we finetune GASNet using the volume-level Dataset-D when testing the performance on Dataset-C. The finetuned model is marked as .
As for the hyperparameters, is set to 100; is set to 5, meaning GASNet optimizes D 5 times each time it optimizes S and G. GASNet is trained jointly from scratch (without pre-training), with a batch size of 4, learning ratio of 1e-5 for the D and the S and 1e-4 for the S. is not calculated in the first 7,000 iterations as we found the predicted mask for is prone to errors at first. Simple data augmentation techniques, including random cropping, Gaussian noise, and rotation lead to slight improvement on the test dataset. It takes about 24 hours (14,000 iterations) for training using a Titan RTX GPU with a 24G memory. During the test, voxels greater than 0.5 in the probabilistic segmentation mask are predicted to be lesion (1), and those smaller than 0.5 are predicted to be healthy (0).
4.3 Results
We adopt typical metrics in COVID-19 lung infection quantification [58][8], i.e. the Dice Score, Sensitivity, and Specificity for evaluation.
Dice Score measures the overlap between the prediction and the ground truth: , where TP, FP, and FN are the number of true positive, false positive, and false negative voxels of one CT volume.
Sensitivity measures the fraction of real positive samples that are predicted correctly: .
Specificity measures the fraction of real negative samples that are predicted correctly: .
Quantitative results of GASNet and other small sample learning work on COVID-19 segmentation testing on three public datasets are shown in Table 3 and 4. We also reproduce the MIL strategy to represent the mainstream weakly-supervised methods in general medical image segmentation, together with a standard segmentation network, which is a U-Net structure in our experiment. Because different methods used inconsistent division strategies for datasets, the tables also show the number of training samples and testing samples used by each method on each dataset. In order to understand the difficulty of COVID-19 lesion segmentation, two radiologists from Wuhan Union Hospital annotated cases of Dataset-A in voxel level independently and their performances are measured by comparing with the ground truth of Dataset-A. The Dice scores of two radiologists are and , while GASNet achieves . Comparing with other existing works, only LabelFree [32] and CoSinGAN [33] use less voxel-level labeled samples in training (zero and one slice from one sample) than GASNet, but GASNet exceeds their performance with a large margin. Other methods including [31][59] and 3D nnU-Net [60] from the SegBenchmark [5] use more training samples and their performance can not match that of GASNet.
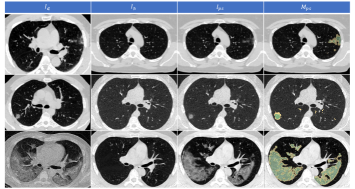
Qualitatively, visualization of the output of GASNet on four samples from the test datasets is shown in Fig. 8. The generated volume looks like a blurry version of the original input, except for the predicted lesion areas. The appearance in the predicted lesion areas changes a lot, making the generated volume look closer to a real healthy volume. Therefore, GASNet replaces the lesion areas of the original diseased volume with the corresponding parts of the generated volume, which makes the synthetic volume look quite similar to real healthy volumes. These examples show that GASNet does optimize its parameters to reach the goal of restoring original healthy CT volumes as we expect.
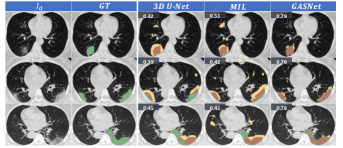
The segmentation results of three samples using different methods are shown in Fig. 9. Compared with the standard 3D U-Net baseline and Multi-Instance Learning method, GASNet holds obvious advantages in eliminating both false positive and false negative. Fig. 10 shows three cases where GASNet has relatively poor performance. The first CT volume contains a small lesion, while GASNet missed it. In the second case, the lesion segmentation of GASNet is partially missing near the edge of lung. In the third case, the lesion area is so complex that annotations of the two radiologists and the ground truth are inconsistent, while the segmentation of GASNet is closer to those of radiologists.
| Method | Training cases | Testing cases | whole | ||||||||
| ActiveLearning[31] | 16 (point-label) | 4 | - | - | - | - | - | - | 44 | - | - |
| 3D nnU-Net[60] | 4 | 16 | - | - | - | - | - | - | - | - | |
| CoSinGAN[33] | 1 | 19 | - | - | 48.4 | - | - | 54.8 | - | - | |
| LabelFree[32] | 0 | 20 | - | - | - | - | - | - | - | ||
| MIL[41] | 1 | 19 | |||||||||
| MIL[41] | 4 | 16 | |||||||||
| GASNet | 1 | 19 | |||||||||
| radiologist A | - | 20 | - | - | - | - | - | - | |||
| radiologist B | - | 20 | - | - | - | - | - | - | |||
5 Ablation Study
5.1 Number of the voxel-level labeled samples
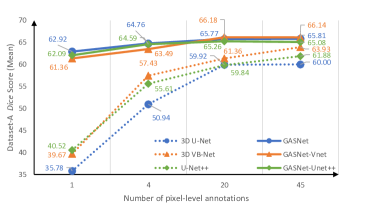
To understand the impact of the number of training samples with voxel-level annotations, we use 1 sample, 4 samples, 20 samples and 45 samples respectively from Dataset-C as voxel-level labeled samples, use Dataset-D as volume-level labeled samples to train GASNet, and test the performance their performance on Dataset-A. We also train the baseline, i. e., using only a corresponding number of voxel-level labeled samples to train the standard U-Net network.
Besides of 3D U-Net, we also adopt 3D VB-Net [22] and U-Net++ [23] as the segmenter of GASNet and test the performance following the same experimental scenario. The Dice scores on the test dataset of all the experiments are shown in Fig. 11. Note that 3D VB-Net is also the network used in [8]. The performance of GASNet, no matter which segmentation model is used as the segmenter of GASNet, is always better than that of the corresponding baseline, which demonstrates the robustness of the framework.
5.2 Improvement for segmentation performance by different auxiliary loss functions and
As demonstrated in subsection 3.2, auxiliary constraints added as loss functions benefit the training of GASNet and the final performance. We quantitatively analyzed the ability of different constraints to improve the final segmentation performance by gradually adding the constraint losses to the framework. The quantitative results are shown in Table 5. Each auxiliary constraint benefits the performance, with and benefiting the most. As shown in Fig. 3 and Fig. 5, improves the quality of the generated volume and alleviates the performance collapse of GASNet. Compared with the original GASNet without any auxiliary constraints, the Dice score has cumulatively risen more than 10 percent, proving the great impact of auxiliary constraints on network training. further improves the segmentation performance of GASNet from 64.75% to 70.3%, by adding reliable supervision signal in voxel-level to the segmenter of GASNet.
| 54.13 | |||||
| ✓ | 56.47 (+2.34) | ||||
| ✓ | ✓ | 60.67 () | |||
| ✓ | ✓ | ✓ | 64.05 (+3.38) | ||
| ✓ | ✓ | ✓ | ✓ | (+0.70) | |
| ✓ | ✓ | ✓ | ✓ | ✓ | () |
6 Conclusion
We propose a weakly-supervised framework for COVID-19 infection segmentation, named GASNet. Utilizing volume-level annotation information, GASNet needs only a single voxel-level labeled sample to obtain performance comparable to fully-supervised methods. Several auxiliary constraint losses benefit the training of GASNet, improving the segmentation performance and the quality of the synthetic volumes. Extensive experiments demonstrate the robustness of the algorithm. Given that volume-level labels are directly available as diagnosis results, GASNet is valuable in medical practice.
However, more research on explaining and improving the framework is necessary, including embedding state-of-the-art segmentation structure to pull up the performance and relaxing some constraints used in this study. In the future, we will try to extend GASNet to handle multi-class segmentation tasks. Experiments on segmenting lesions of other diseases will also be carried out to valid the generalization of GASNet.
References
- [1] Y. Fang et al., “Sensitivity of Chest CT for COVID-19: Comparison to RT-PCR,” Radiology, vol. 296, no. 2, pp. E115–E117, 2020.
- [2] J. P. Kanne, “Chest CT Findings in 2019 Novel Coronavirus (2019-nCoV) Infections from Wuhan, China: Key Points for The Radiologist,” Radiology, vol. 295, no. 1, pp. 16–17, 2020.
- [3] M. Chung et al., “CT Imaging Features of 2019 Novel Coronavirus (2019-nCoV),” Radiology, vol. 295, no. 1, pp. 202–207, 2020.
- [4] H. Shi et al., “Radiological Findings from 81 Patients with COVID-19 Pneumonia in Wuhan, China: A Descriptive Study,” The Lancet Infectious Diseases, vol. 20, no. 4, pp. 425 – 434, 2020.
- [5] M. Jun et al., “Towards Efficient COVID-19 CT Annotation: A Benchmark for Lung and Infection Segmentation,” arXiv Preprint ArXiv:2004.12537, 2020.
- [6] K. Zhang et al., “Clinically Applicable AI System for Accurate Diagnosis, Quantitative Measurements, and Prognosis of COVID-19 Pneumonia Using Computed Tomography,” Cell, vol. 181, no. 6, pp. 1423 – 1433.e11, 2020.
- [7] Y.-H. Wu et al., “JCS: An Explainable COVID-19 Diagnosis System by Joint Classification and Segmentation,” arXiv Preprint ArXiv:2004.07054, 2020.
- [8] F. Shan et al., “Lung Infection Quantification of COVID-19 in CT Images with Deep Learning,” arXiv Preprint ArXiv:2003.04655, 2020.
- [9] Y. Qiu, Y. Liu, and J. Xu, “MiniSeg: An Extremely Minimum Network for Efficient COVID-19 Segmentation,” arXiv Preprint ArXiv:2004.09750, 2020.
- [10] Ö. Çiçek et al., “3D U-Net: Learning Dense Volumetric Segmentation from Sparse Annotation,” in Medical Image Computing and Computer-Assisted Intervention – MICCAI 2016. Springer, 2016, pp. 424–432.
- [11] L. Zhang et al., “When Unseen Domain Generalization is Unnecessary? Rethinking Data Augmentation,” arXiv Preprint ArXiv:1906.03347, 2019.
- [12] H.-C. Shin et al., “Medical Image Synthesis for Data Augmentation and Anonymization Using Generative Adversarial Networks,” in Simulation and Synthesis in Medical Imaging. Springer, 2018, pp. 1–11.
- [13] D. Jin, Z. Xu, Y. Tang, A. P. Harrison, and D. J. Mollura, “CT-realistic Lung Nodule Simulation from 3D Conditional Generative Adversarial Networks for Robust Lung Segmentation,” in Medical Image Computing and Computer Assisted Intervention – MICCAI 2018. Springer, 2018, pp. 732–740.
- [14] W. Bai et al., “Semi-supervised Learning for Network-based Cardiac MR Image Segmentation,” in Medical Image Computing and Computer Assisted Intervention – MICCAI 2017. Springer, 2017, pp. 253–260.
- [15] D. Nie, Y. Gao, L. Wang, and D. Shen, “ASDNet: Attention Based Semi-supervised Deep Networks for Medical Image Segmentation,” in Medical Image Computing and Computer Assisted Intervention – MICCAI 2018. Springer, 2018, pp. 370–378.
- [16] L. Zhang, V. Gopalakrishnan, L. Lu, R. M. Summers, J. Moss, and J. Yao, “Self-learning to Detect and Segment Cysts in Lung CT Images without Manual Annotation,” in 2018 IEEE 15th International Symposium on Biomedical Imaging. IEEE, 2018, pp. 1100–1103.
- [17] R. R. Selvaraju, M. Cogswell, A. Das, R. Vedantam, D. Parikh, and D. Batra, “Grad-cam: Visual Explanations from Deep Networks via Gradient-based Localization,” in 2017 IEEE International Conference on Computer Vision (ICCV), 2017, pp. 618–626.
- [18] A. Radford, L. Metz, and S. Chintala, “Unsupervised Representation Learning with Deep Convolutional Generative Adversarial Networks,” arXiv Preprint ArXiv:1511.06434, 2015.
- [19] Z.-H. Zhou, Y.-Y. Sun, and Y.-F. Li, “Multi-Instance Learning by Treating Instances As Non-I.I.D. Samples,” in Proceedings of The 26th Annual International Conference on Machine Learning. Association for Computing Machinery, 2009, p. 1249–1256.
- [20] C. Jin et al., “Development and Evaluation of An AI System for COVID-19 Diagnosis,” Nature Communications, vol. 11, no. 1, pp. 1–14, 2020.
- [21] O. Ronneberger, P. Fischer, and T. Brox, “U-net: Convolutional Networks for Biomedical Image Segmentation,” in Medical Image Computing and Computer Assisted Intervention – MICCAI 2015. Springer, 2015, pp. 234–241.
- [22] F. Milletari, N. Navab, and S.-A. Ahmadi, “V-net: Fully Convolutional Neural Networks for Volumetric Medical Image Segmentation,” in 2016 Fourth International Conference on 3D Vision (3DV). IEEE, 2016, pp. 565–571.
- [23] Z. Zhou, M. M. Rahman Siddiquee, N. Tajbakhsh, and J. Liang, “UNet++: A Nested U-Net Architecture for Medical Image Segmentation,” in Deep Learning in Medical Image Analysis and Multimodal Learning for Clinical Decision Support. Springer, 2018, pp. 3–11.
- [24] MedSeg, “Covid-19 CT Segmentation Dataset,” 2020. [Online]. Available: https://medicalsegmentation.com/covid19/
- [25] S. Morozov et al., “MosMedData: Chest CT Scans with COVID-19 Related Findings,” medRxiv, 2020.
- [26] “radiopaedia,” 2020. [Online]. Available: https://radiopaedia.org/articles/covid-19-4
- [27] D. P. Fan et al., “Inf-Net: Automatic COVID-19 Lung Infection Segmentation from CT Images,” IEEE Transactions on Medical Imaging, vol. 39, no. 8, pp. 2626–2637, 2020.
- [28] A. Krizhevsky, I. Sutskever, and G. E. Hinton, “ImageNet Classification with Deep Convolutional Neural Networks,” in Proceedings of The 25th International Conference on Neural Information Processing Systems - Volume 1, 2012, p. 1097–1105.
- [29] E. Shelhamer, J. Long, and T. Darrell, “Fully Convolutional Networks for Semantic Segmentation,” IEEE Transactions on Pattern Analysis and Machine Intelligence, vol. 39, no. 4, pp. 640–651, 2017.
- [30] SIRM., “Italian Society of Medical and Interventional Radiology COVID-19 Dataset,” 2020. [Online]. Available: https://www.sirm.org/category/senza-categoria/covid-19
- [31] I. Laradji et al., “A Weakly Supervised Region-Based Active Learning Method for COVID-19 Segmentation in CT Images,” arXiv Preprint ArXiv:2007.07012, 2020.
- [32] Q. Yao, L. Xiao, P. Liu, and S. K. Zhou, “Label-Free Segmentation of COVID-19 Lesions in Lung CT,” arXiv Preprint ArXiv:2009.06456, 2020.
- [33] P. Zhang, Y. Zhong, X. Tang, Y. Deng, and X. Li, “Learning Diagnosis of COVID-19 from A Single Radiological Image,” arXiv Preprint ArXiv:2006.12220, 2020.
- [34] A. Paszke, A. Chaurasia, S. Kim, and E. Culurciello, “Enet: A Deep Neural Network Architecture for Real-time Semantic Segmentation,” arXiv Preprint ArXiv:1606.02147, 2016.
- [35] G. Valvano, A. Leo, and S. A. Tsaftaris, “Weakly Supervised Segmentation with Multi-scale Adversarial Attention Gates,” arXiv Preprint ArXiv:2007.01152, 2020.
- [36] X. Wang and D. Xu, “Weakly Supervised Segmentation from Extreme Points,” in Large-Scale Annotation of Biomedical Data and Expert Label Synthesis and Hardware Aware Learning for Medical Imaging and Computer Assisted Intervention. Springer, 2019, pp. 42–50.
- [37] H. Qu et al., “Weakly Supervised Deep Nuclei Segmentation Using Partial Points Annotation in Histopathology Images,” IEEE Transactions on Medical Imaging, pp. 1–1, 2020.
- [38] H. Kervadec, J. Dolz, S. Wang, E. Granger, and I. B. Ayed, “Bounding Boxes for Weakly Supervised Segmentation: Global Constraints Get Close to Full Supervision,” arXiv Preprint ArXiv:2004.06816, 2020.
- [39] M. Rajchl et al., “DeepCut: Object Segmentation from Bounding Box Annotations Using Convolutional Neural Networks,” IEEE Transactions on Medical Imaging, vol. 36, no. 2, pp. 674–683, 2016.
- [40] L. Grady, “Random Walks for Image Segmentation,” IEEE Transactions on Pattern Analysis and Machine Intelligence, vol. 28, pp. 1768–1783, 2006.
- [41] G. Xu et al., “CAMEL: A Weakly Supervised Learning Framework for Histopathology Image Segmentation,” in 2019 IEEE/CVF International Conference on Computer Vision (ICCV), 2019, pp. 10 681–10 690.
- [42] X. Feng, J. Yang, A. F. Laine, and E. D. Angelini, “Discriminative Localization in CNNs for Weakly-Supervised Segmentation of Pulmonary Nodules,” in Medical Image Computing and Computer Assisted Intervention – MICCAI 2017. Springer, 2017, pp. 568–576.
- [43] X. Ouyang et al., “Weakly Supervised Segmentation Framework with Uncertainty: A Study on Pneumothorax Segmentation in Chest X-ray,” in Medical Image Computing and Computer Assisted Intervention – MICCAI 2019. Springer, 2019, pp. 613–621.
- [44] D. Mahapatra, B. Bozorgtabar, J.-P. Thiran, and M. Reyes, “Efficient Active Learning for Image Classification and Segmentation Using A Sample Selection and Conditional Generative Adversarial Network,” in Medical Image Computing and Computer Assisted Intervention – MICCAI 2018. Springer, 2018, pp. 580–588.
- [45] Y. Zhang, S. Miao, T. Mansi, and R. Liao, “Task Driven Generative Modeling for Unsupervised Domain Adaptation: Application to X-ray Image Segmentation,” in Medical Image Computing and Computer Assisted Intervention – MICCAI 2018. Springer, 2018, pp. 599–607.
- [46] A. Chartsias, T. Joyce, R. Dharmakumar, and S. A. Tsaftaris, “Adversarial Image Synthesis for Unpaired Multi-modal Cardiac Data,” in Simulation and Synthesis in Medical Imaging. Springer, 2017, pp. 3–13.
- [47] Z. Mirikharaji, Y. Yan, and G. Hamarneh, “Learning to Segment Skin Lesions from Noisy Annotations,” in Domain Adaptation and Representation Transfer and Medical Image Learning with Less Labels and Imperfect Data. Springer, 2019, pp. 207–215.
- [48] D. Nie and D. Shen, “Adversarial Confidence Learning for Medical Image Segmentation and Synthesis,” International Journal of Computer Vision, pp. 1–20, 2020.
- [49] T. Salimans, I. Goodfellow, W. Zaremba, V. Cheung, A. Radford, and X. Chen, “Improved Techniques for Training Gans,” in Advances in Neural Information Processing Systems, 2016, pp. 2234–2242.
- [50] Y. Yu, Z. Gong, P. Zhong, and J. Shan, “Unsupervised Representation Learning with Deep Convolutional Neural Network for Remote Sensing Images,” in International Conference on Image and Graphics. Springer, 2017, pp. 97–108.
- [51] A. Brock, J. Donahue, and K. Simonyan, “Large Scale Gan Training for High Fidelity Natural Image Synthesis,” arXiv Preprint ArXiv:1809.11096, 2018.
- [52] J. Choe and H. Shim, “Attention-Based Dropout Layer for Weakly Supervised Object Localization,” in 2019 IEEE/CVF Conference on Computer Vision and Pattern Recognition (CVPR), 2019, pp. 2214–2223.
- [53] J. Choe, S. Lee, and H. Shim, “Attention-based Dropout Layer for Weakly Supervised Single Object Localization and Semantic Segmentation,” IEEE Transactions on Pattern Analysis and Machine Intelligence, pp. 1–1, 2020.
- [54] Z. Liu, J. Du, M. Wang, and S. S. Ge, “ADCM: Attention Dropout Convolutional Module,” Neurocomputing, vol. 394, pp. 95–104, 2020.
- [55] J. Hofmanninger, F. Prayer, J. Pan, S. Rohrich, H. Prosch, and G. Langs, “Automatic Lung Segmentation in Routine Imaging is A Data Diversity Problem, Not A Methodology Problem,” arXiv Preprint ArXiv:2001.11767, 2020.
- [56] J. Zhu, T. Park, P. Isola, and A. A. Efros, “Unpaired Image-to-Image Translation Using Cycle-Consistent Adversarial Networks,” in 2017 IEEE International Conference on Computer Vision (ICCV), 2017, pp. 2242–2251.
- [57] T. Miyato, T. Kataoka, M. Koyama, and Y. Yoshida, “Spectral Normalization for Generative Adversarial Networks,” arXiv Preprint ArXiv:1802.05957, 2018.
- [58] F. Shi et al., “Large-scale Screening of COVID-19 from Community Acquired Pneumonia Using Infection Size-aware Classification,” arXiv Preprint ArXiv:2003.09860, 2020.
- [59] I. Laradji and othres, “A Weakly Supervised Consistency-based Learning Method for COVID-19 Segmentation in CT Images,” arXiv Preprint ArXiv:2007.02180, 2020.
- [60] F. Isensee et al., “nnu-net: Self-adapting Framework for U-net-based Medical Image Segmentation,” arXiv Preprint ArXiv:1809.10486, 2018.