Do cavities matter? Hollow microgels resist crystallization
Abstract
Solutions of microgels have been widely used as model systems to gain insight into atomic condensed matter and complex fluids. We explore the thermodynamic phase behavior of hollow microgels, which are distinguished from conventional colloids by possessing a central cavity. Small-angle neutron and X-ray scattering are used to probe hollow microgels in crowded environments. These measurements reveal an interplay between interpenetration and deswelling, and an unusual absence of crystals. Monte Carlo simulations of hollow microgel solutions confirm that, due to the cavity, they form a supercooled liquid more stable than in the case of microgels with a crosslinked core.
Colloidal suspensions provide important insights into phase transitions in condensed matter, e.g., crystallization and glass formation, since they offer a versatile model for studying fundamental processes in atomic systems on length and time scales accessible with conventional techniques (confocal microscopy, dynamic light scattering) Pusey and van Megen (1986); Kim et al. (2013); Rosenbaum et al. (1996); Gasser et al. (2001). A particular class of colloids is represented by solutions of soft, deformable microgels, polymeric crosslinked networks swollen in a good solvent that respond to external stimuli, e.g., changes in temperature Stieger et al. (2004) or pH Iyer and Lyon (2009). Microgels have helped to address questions regarding the formation of soft and strong glasses Mattsson et al. (2009); van der Scheer et al. (2017); Ma et al. (2019a) and the crystallization of spherical particles interacting via soft pair potentials Senff and Richtering (1999); Alsayed et al. (2005); Pelaez-Fernandez et al. (2015); Scotti et al. (2017); Ma et al. (2019b), in both two Han et al. (2008); Rey et al. (2016); Peng et al. (2017) and three dimensions Zhang et al. (2009); Paloli et al. (2013).
Microgels synthesized by precipitation polymerization typically comprise a dense polymeric core surrounded by a periphery (fuzzy shell) with lower polymer density (henceforth termed “regular” microgels). Improved synthesis protocols allow creating microgels with internal structures substantially different from those of regular microgels, such as hollow microgels – polymeric networks with central, solvent-filled cavities Nayak et al. (2005); Dubbert et al. (2014). Studies of microgels with diverse architectures have revealed that the particle “softness” depends on more than the concentration of crosslinking agent used during synthesis Scotti et al. (2019a). The central cavity allows a hollow microgel to respond to the compression of a matrix of regular microgels of comparable size and softness by rearranging its polymer chains into the cavity Scotti et al. (2018a). Hollow microgels, having no atomic counterpart, represent a new class of materials that show unique and unexplored properties.
In this work, we investigate the phase behavior of solutions of hollow poly(N-isopropylacrylamide)-based (pNIPAM) microgels as a function of concentration, crosslinker density, and cavity size. We address two main questions: (i) How do hollow microgels respond to crowding? (ii) Does the internal structure of single microgels affect colloidal phase behavior?
The thermodynamic quantity that determines the phase behavior of microgel solutions, at fixed temperature and pressure, is the generalized volume fraction, Stieger et al. (2004); Scotti et al. (2017), defined as the fraction of the sample volume occupied by the microgels in their fully swollen state. The capability of microgels to deform Bouhid de Aguiar et al. (2017); Conley et al. (2017), compress Iyer and Lyon (2009); Scotti et al. (2016), or interpenetrate each other Mohanty et al. (2017); Conley et al. (2019) is reflected by values of ranging above 0.74, the close-packed limit for hard spheres Gasser (2009). For all microgels studied here, is linked to the weight concentration, , by a conversion constant, , obtained via viscosimetry (Fig. S1).
Our solutions of hollow microgels cover a range between and , allowing the possibility of observing transitions from fluid to crystalline phases Debord and Lyon (2003); Stieger et al. (2004); Scotti et al. (2017, 2019b). We stress that a crystalline phase has been observed for regular microgels and core-shell particles with a rigid, incompressible core surrounded by either polymers Crassous et al. (2006, 2008) or DNA Cheng et al. (2010); Zhang et al. (2014). Thus, the presence of a fuzzy shell per se does not suppress crystallization. All of the above-mentioned colloids possess a hard-sphere-like dense core. Thermodynamic phase behavior of colloidal suspensions relies on the fact that the equilibrium state minimizes the Helmholtz free energy, , where and are the internal energy and entropy of the system, respectively. For a suspension of hard-sphere colloids, is independent of configuration and simply proportional to the temperature Scotti et al. (2018b). For certain concentrations, the entropy is maximized (i.e., is minimized) when hard spheres self-assemble on an ordered lattice. Indeed the loss of global configurational entropy due to collective ordering of particles is overcome by the gain in local configurational entropy deriving from the increased free volume around particles due to crystallization Baus (1987).
In contrast to colloids and microgels with a dense core, the hollow microgels studied here do not form crystals in the concentration range studied. Four different types of microgels were synthesized using either 5 or 2.5 mol% of crosslinker (Table S1). We prepared these solutions following standard procedures to favor crystal formation, e.g., heating/cooling cycles, and letting rest at constant for longer than one year (Supplemental Material).
The capability of microgels to spontaneously deswell Iyer and Lyon (2009); Frenkel (2009); Scotti et al. (2016) significantly decreases the size polydispersity of the solution with increasing Denton and Tang (2016); Scotti et al. (2017); Gasser et al. (2019). Consequently, crystals can form well above the polydispersity limit known for hard spheres (%) Gasser (2009), as is the case for the regular microgels with outer radius nm and % (Fig. S3).
In contrast, none of the hollow microgel solutions studied here crystallized. As seen in Table S2, at least two of the hollow microgels have %, well below the value suppressing crystallization, not only for regular microgels, but also for hard spheres Scotti et al. (2017); Frenkel (2009). Therefore, polydispersity per se cannot explain the absence of crystals in the phase behavior of hollow microgels.
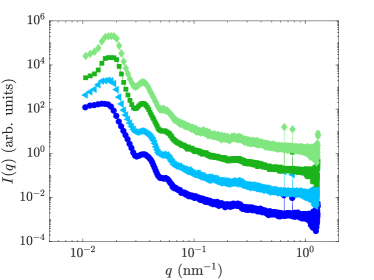
The SAXS intensities in Fig. 1 are relative to hollow 5 mol% crosslinked microgels with outer radius nm and internal cavity radius nm. The absence of Bragg peaks indicates a disordered arrangement of microgels Gasser et al. (2013); Scotti et al. (2017). The shift of the peaks to higher -values with increasing reflects a decrease of the microgel center-to-center separation.
To probe the response of these hollow 5 mol% crosslinked microgels in crowded environments, we used SANS with contrast variation Gasser et al. (2014); Scotti et al. (2016); Mohanty et al. (2017); Scotti et al. (2018a). Relatively few hollow microgels made of pNIPAM ([C6H11NO]n) are dispersed in a matrix of 5 mol% crosslinked D7-pNIPAM-based hollow microgels ([C6D7H4NO]n) of comparable size (Table S2 and Fig. S11). The solvent is a mixture of water and heavy water matching the neutron scattering length density of the deuterated microgels. Consequently, the form factor and, therefore, the shape and architecture of the protonated hollow microgels can be directly detected Scotti et al. (2018b).
The generalized volume fraction of the protonated hollow microgels is kept constant at in all SANS measurements. In contrast, for the matrix of hollow deuterated microgels, ranges between 0 and . Therefore, spans minimum and maximum values of 0.08 and 1.19, respectively.
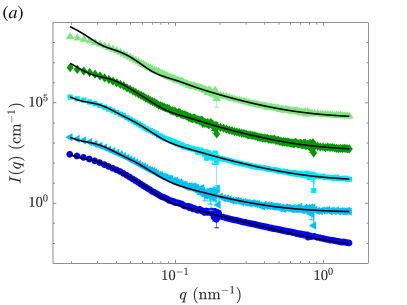
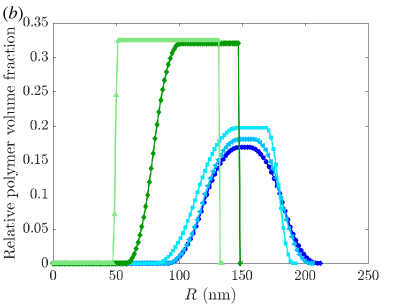
Figure 2(a) shows the measured form factors of the protonated hollow 5 mol% crosslinked microgels at different at 20 ∘C. The data are fitted (solid lines) with a core-fuzzy-shell model (Supplemental Material and Fig. S7 Scotti et al. (2018b)) previously used to fit SANS data obtained from similar systems Dubbert et al. (2014); Schmid et al. (2016); Scotti et al. (2018a). From the fits, the radial profiles of the relative polymer volume fraction within the microgels are obtained and plotted in Figs. 2(b) and S8.
Below the volume phase transition temperature (VPTT), the radial profile of the hollow protonated microgels (circles) shows an internal cavity of radius nm. The hollow microgels display fuzziness toward both the cavity and the outer periphery. Between these two regions, we observe a region of constant polymer concentration. The outer radius of the microgels is nm with %. The fit of static light scattering intensity confirms the radial profile obtained from the SANS data (Fig. S9) Scotti et al. (2018b). The cavity is maintained even above the VPTT (Fig. S8), as expected Dubbert et al. (2014, 2015); Schmid et al. (2016); Brugnoni et al. (2018); Scotti et al. (2018a).
Figure 2(b) shows that at the radial profile of the hollow protonated microgels (left-side-triangles) virtually coincides with the radial profile at (circles). The outer radius is nm, %, and the internal cavity radius is nm.
At , the radial profile of the hollow protonated microgels shows a decrease of the external fuzziness (squares) and partial occupation of the cavity by the polymer. From the fit, we obtain nm, %, and a cavity radius of nm.
In Fig. 2(b), the diamonds correspond to , well above the limit where hard spheres make contact in a random close-packed state (). A significant compression is observed: nm. The external fuzziness disappears and the internal cavity radius decreases to nm. At the highest concentration measured, , the outer radius further decreases to and the cavity radius equals nm. Notably, the cavity is preserved throughout the entire -range probed (Fig. S10).
The size polydispersity increases with increasing and reaches % for (Fig. S10). This trend can be explained by the faceting observed for microgels with increasing Scotti et al. (2018a); Conley et al. (2019); van der Scheer et al. (2017). Indeed, in our simple form factor model of spherical microgels, the only way to account for deformation or faceting results in an increase of the polydispersity fitting parameter, now seen as an apparent polydispersity, which reflects deformations. An increase of the apparent polydispersity has been observed also for nanoemulsion droplets Scheffold and Mason (2009). Together with faceting, the presence of anisotropic deformation seems to play a role for very high packing fractions (see Supplemental Material, Fig. S12).
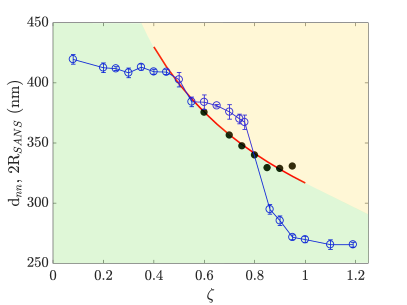
Figure 3 summarizes how the outer diameter of the hollow protonated microgels, , varies with (empty blue circles). Four regimes can be identified: (i) for , the hollow protonated microgels maintain their size; (ii) for , the size first decreases; (iii) for , the size further steeply decreases; and (iv) for , the size remains constant.
The onset of deswelling in regime (ii) occurs at concentrations below that at which the microgels make contact. This phenomenon has been reported also for regular microgels Iyer and Lyon (2009); Frenkel (2009); Scotti et al. (2017, 2018a) and attributed to overlapping of counterion clouds surrounding the microgels, significantly increasing the osmotic pressure of the solution Scotti et al. (2016); Gasser et al. (2019). In contrast, the second stage of deswelling in regime (iii) is due to a collapse of the external fuzzy shell and rearrangement of polymer within the cavity.
To understand whether microgel deswelling is sufficient to forestall interpenetration, the diameter of the hollow microgels obtained by SANS is compared to the nearest-neighbor distance, (black circles in Fig. 3). The latter is obtained from the structure factor (Fig. S13) of the solutions shown in Fig. S2(a), measured with SAXS. The red curve in Fig. 3 represents a fit of the data with the power law , being the value of at . This curve divides the graphs in two areas, indicated in yellow and in green in the figure. If a the microgel diameter (blue circles) lies above the red curve, in the yellow area, its dimension is larger than the microgel-to-microgel distance and, therefore, interpenetration is dominant. In contrast, if the diameter of a microgel (blue circles) lies below the red curve, in the green area, it has been deformed/deswollen and its dimension is smaller than the microgel-to-microgel distance and, therefore, interpenetration is negligible. For , the blue circles lies in the yellow area, indicating interpenetration of the hollow microgels with their neighbors. In contrast, for values of , a stronger deswelling/deformation is observed and interpenetration is negligible, as indicated by being consistently smaller than .
This deswelling behavior can be explained by the absence of a polymeric core, making the hollow microgels more compressible and interpenetrable than regular microgels with a dense core surrounded by a fuzzy shell. The hollow protonated microgels embedded in a matrix of hollow deuterated microgels collapse, at , to a size that is % of their fully swollen size (Fig. S6). In contrast, regular microgels embedded in the very same matrix of hollow deuterated microgels deswell to a size that is, at , only 90 % of the fully swollen size (Figs. S5 and S6), implying that regular microgels are much less compressible than hollow microgels. The presence of a dense core limits the rearrangement of polymeric chains inside the microgels, while hindering interpenetration.
To complement our experiments, we performed Monte Carlo (MC) simulations of microgel solutions modeled by the Flory-Rehner single-particle free energy and the Hertz pair potential (Eqs. S10 and S11 in Supplemental Material). For solutions of particles with typical system parameters (Fig. 4), we performed runs over a range of concentrations. Each MC step comprises a trial displacement and independent trial changes in size and internal structure – outer and inner (cavity) radii – of every microgel. After equilibrating for steps, we collected statistics for single-particle and collective properties at intervals of 100 steps for steps.
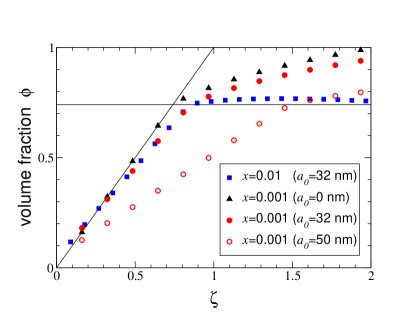
First, we map onto the actual volume fraction , which represents the real fraction of the volume occupied by the collapsed/deformed/interpenetrated microgels. Figure 4 presents our simulation data for vs. . At low concentrations (), where interparticle interactions are weak, the microgels are barely compressed and .
With increasing , however, the data progressively deviate from the line , demonstrating both compression and faceting of the particles. With increasing , the volume fraction of stiffer microgels () plateaus just above the hard-sphere close-packing limit of . In contrast, softer microgels () both deswell and facet, as reflected by steady increase of . We verified that this trend continues as is further lowered. These data show that the higher the crosslink density, the stronger the tendency for microgels to deswell rather than facet in response to mutual crowding. Furthermore, enlarging the cavity from a collapsed inner radius of nm to nm results in a much more gradual increase of with increasing .
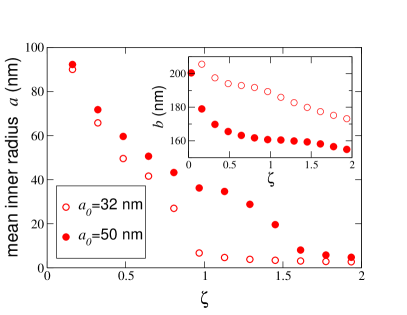
The tendency for the volume fraction of hollow microgels with larger cavities to rise more gradually with increasing concentration is correlated with a weaker contraction of the cavity and stronger compression of the particles. These correlations are illustrated in Fig. 5, which shows that the mean outer radius progressively decreases with increasing and , while the mean inner radius levels off when reaches close packing ( for nm and for nm).
Beyond single-particle structure, we also computed collective thermodynamic and structural properties. As detailed in the Supplemental Material, our analyses of the bulk osmotic pressure, mean pair interaction energy, pair distribution function, and static structure factor consistently indicate that a microgel solution freezes into either a close-packed crystal or an amorphous solid when its volume fraction exceeds , i.e., roughly the freezing density of a hard-sphere fluid. The key new insight from our modeling is that hollow microgels, because of their additional internal degrees of freedom, can delay the increase of with by collapsing their cavities, and thus remain stable in the fluid phase up to considerably higher concentrations, more so the larger the cavity, consistent with experimental observations.
To summarize, we presented the phase behavior of solutions of hollow microgels, soft colloidal particles composed of crosslinked polymeric networks swollen in a good solvent and distinguished by central solvent-filled cavities. Crystals were not observed, regardless of cavity size and amount of crosslinker agent used during synthesis. From SANS and SAXS experiments, we observed that at intermediate concentrations interpenetration between microgels is dominant. In contrast, at higher concentrations, in overcrowded conditions, the data indicate both faceting and anisotropic deformation of the microgels, in agreement with recent studies Scotti et al. (2018a); Conley et al. (2019); van der Scheer et al. (2017). Monte Carlo simulations support our experimental findings on deswelling of hollow microgels and the inferences that cavities enhance stability of the fluid phase and are progressively occupied by polymer with increasing concentration. For the same concentration, a supercooled fluid is more stable for hollow microgels than for regular microgels.
The absence of a dense core must be considered to rationalize the unique phase behavior of hollow microgels compared with that of both hard and soft spheres Auer and Frenkel (2001); Pàmies et al. (2009). With increasing concentration, conventional colloids form crystals, the only way to increase their configurational entropy Frenkel (1994, 1999), as observed not only for hard-sphere-like systems (e.g., pMMA particles Pusey (1987); Pusey and van Megen (1986)), but also for regular microgels, core-polymer, and DNA-coated particles, which resemble hard spheres once the external soft shell is compressed and the dense, rigid core is reached Crassous et al. (2006, 2008); Cheng et al. (2010); Zhang et al. (2014); Scotti et al. (2017, 2019b).
In contrast, hollow microgels can deswell/deform with lower energetic cost due to fewer internal constraints. Furthermore, the polymer chains can rearrange within the empty cores. These two mechanisms offer an alternative pathway to increase configurational entropy without the need to crystallize. For sufficiently high concentrations, however, the collapsed chains may completely occupy the cavity. In this case, if the microgels are not jammed, crystals might form.
The absence of a crystalline phase for solutions of hollow microgels allows studying glass formers or complex fluids without significant size disparities, making clear whether the unique properties of glasses, e.g., storage and loss moduli, depend on colloidal size disparities. Furthermore, it has been reported that relatively few hollow microgels embedded in a matrix of regular microgels of like size do not hinder crystallization Scotti et al. (2019a). Therefore, the role of hollow microgels as defects that suppress crystallization can be studied in binary mixtures of hollow and regular microgels. This study would open a path to a new kind of defect that suppresses crystallization because of its internal structure, i.e., the absence of the core, and not because of a size mismatch, as is usually observed Pusey and van Megen (1986); Auer and Frenkel (2001). Pure solutions of only hollow microgels, or binary mixtures in which hollow microgels act as defects, offer the possibility to study the glass and jamming transitions without introducing large size mismatches to hinder crystallization Mattsson et al. (2009). Finally, solutions of hollow microgels can be used to test some recent findings of simulations on the roles of deformation, interpenetration, and deswelling in the dynamics of soft colloids Gnan and Zaccarelli (2019).
Acknowledgements.
Financial support from the Alexander von Humboldt Foundation, SFB 985 - Functional Microgels and Microgel Systems and from the International Helmholtz Research School of Biophysics and Soft Matter (IHRS BioSoft) is gratefully acknowledged. All SANS experiments were performed on D11 at the Institut Laue-Langevin (ILL), Grenoble, France.Data availability All the data used for this study are available under request at: https://hdl.handle.net/21.11102/74326e3e-1b59-11ea-9a63-e41f1366df48. SANS data are available at DOI: 10.5291/ILL-DATA.9-11-1855.
References
- Pusey and van Megen (1986) P. N. Pusey and W. van Megen, Nature 320, 340 (1986).
- Kim et al. (2013) J. M. Kim, J. Fang, A. P. R. Eberle, R. Castaneda-Priego, and N. J. Wagner, Phys. Rev. Lett. 110 (2013).
- Rosenbaum et al. (1996) D. Rosenbaum, P. C. Zamora, and C. Zukoski, Phys. Rev. Lett. 76, 150 (1996).
- Gasser et al. (2001) U. Gasser, E. R. Weeks, A. Schofield, P. N. Pusey, and D. A. Weitz, Science 292, 2580 (2001).
- Stieger et al. (2004) M. Stieger, J. S. Pedersen, P. Lindner, and W. Richtering, Langmuir 20, 7283 (2004).
- Iyer and Lyon (2009) A. S. J. Iyer and L. A. Lyon, Angew. Chem. Int. Ed. 48, 4562 (2009).
- Mattsson et al. (2009) J. Mattsson, H. M. Wyss, A. Fernandez-Nieves, K. Miyazaki, Z. Hu, D. R. Reichman, and D. A. Weitz, Nature 462, 83 (2009).
- van der Scheer et al. (2017) P. van der Scheer, T. van de Laar, J. van der Gucht, D. Vlassopoulos, and J. Sprakel, ACS Nano 11, 6755 (2017), pMID: 28658568.
- Ma et al. (2019a) X. Ma, Z. S. Davidson, T. Still, R. J. S. Ivancic, S. S. Schoenholz, A. J. Liu, and A. G. Yodh, Phys. Rev. Lett. 122, 028001 (2019a).
- Senff and Richtering (1999) H. Senff and W. Richtering, J. Chem. Phys. 111, 1705 (1999).
- Alsayed et al. (2005) A. M. Alsayed, M. F. Islam, J. Zhang, P. J. Collings, and A. G. Yodh, Science 309, 1207 (2005).
- Pelaez-Fernandez et al. (2015) M. Pelaez-Fernandez, A. Souslov, L. A. Lyon, P. M. Goldbart, and A. Fernandez-Nieves, Phys. Rev. Lett. 114, 098303 (2015).
- Scotti et al. (2017) A. Scotti, U. Gasser, E. S. Herman, J. Han, A. Menzel, L. A. Lyon, and A. Fernandez-Nieves, Phys. Rev. E 96, 032609 (2017).
- Ma et al. (2019b) X. Ma, Z. S. Davidson, T. Still, R. J. S. Ivancic, S. S. Schoenholz, A. J. Liu, and A. G. Yodh, Phys. Rev. Lett. 122, 028001 (2019b).
- Han et al. (2008) Y. Han, N. Y. Ha, A. M. Alsayed, and A. G. Yodh, Phys. Rev. E 77, 041406 (2008).
- Rey et al. (2016) M. Rey, M. A. Fernandez-Rodriguez, M. Steinacher, L. Scheidegger, K. Geisel, W. Richtering, T. M. Squires, and L. Isa, Soft Matter 12, 3545 (2016).
- Peng et al. (2017) Y. Peng, W. Li, F. Wang, T. Still, A. G. Yodh, and Y. Han, Nature Communications 8, 14978 (2017).
- Zhang et al. (2009) Z. Zhang, N. Xu, D. T. N. Chen, P. Yunker, A. M. Alsayed, K. B. Aptowicz, P. Habdas, S. R. N. A. J. Liu, and A. G. Yodh, Nature 459, 230 (2009).
- Paloli et al. (2013) D. Paloli, P. S. Mohanty, J. J. Crassous, E. Zaccarelli, and P. Schurtenberger, Soft Matter 9, 2927 (2013).
- Nayak et al. (2005) S. Nayak, D. Gan, M. Serpe, and L. Lyon, Small 1, 416 (2005).
- Dubbert et al. (2014) J. Dubbert, T. Honold, J. S. Pedersen, A. Radulescu, M. Drechsler, M. Krag, and W. Richtering, Macromolecules 47, 8700 (2014).
- Scotti et al. (2019a) A. Scotti, A. R. Denton, M. Brugnoni, J. E. Houston, R. Schweins, I. I. Potemkin, and W. Richtering, Macromolecules 52, 3995 (2019a).
- Scotti et al. (2018a) A. Scotti, M. Brugnoni, A. A. Rudov, J. E. Houston, I. I. Potemkin, and W. Richtering, The Journal of Chemical Physics 148, 174903 (2018a).
- Bouhid de Aguiar et al. (2017) I. Bouhid de Aguiar, T. van de Laar, M. Meireles, A. Bouchoux, J. Sprakel, and K. Schroën, Scientific Reports 7, 10223 (2017).
- Conley et al. (2017) G. M. Conley, P. Aebischer, S. Nöjd, P. Schurtenberger, and F. Scheffold, Science Advances 3 (2017), 10.1126/sciadv.1700969.
- Scotti et al. (2016) A. Scotti, U. Gasser, E. S. Herman, M. Pelaez-Fernandez, L. A. Lyon, and A. Fernandez-Nieves, Proc. Natl. Acad. Sci. USA 113, 5576 (2016).
- Mohanty et al. (2017) P. S. Mohanty, S. Nöjd, K. v. Gruijthuijsen, J. J. Crassous, M. Obiols-Rabasa, R. Schweins, A. Stradner, and P. Schurtenberger, Scientific Reports 7, 1487 (2017).
- Conley et al. (2019) G. M. Conley, C. Zhang, P. Aebischer, J. L. Harden, and F. Scheffold, Nature communications 10, 2436 (2019).
- Gasser (2009) U. Gasser, Journal of Physics: Condensed Matter 21, 203101 (2009).
- Debord and Lyon (2003) S. B. Debord and L. A. Lyon, J. Phys. Chem. B 107, 2927 (2003).
- Scotti et al. (2019b) A. Scotti, S. Bochenek, M. Brugnoni, M. A. Fernandez-Rodriguez, M. F. Schulte, J. E. Houston, A. P. H. Gelissen, I. I. Potemkin, L. Isa, and W. Richtering, Nature Communications 10, 1418 (2019b).
- Crassous et al. (2006) J. J. Crassous, M. Siebenbürger, M. Ballauff, M. Drechsler, O. Henrich, and M. Fuchs, The Journal of chemical physics 125, 204906 (2006).
- Crassous et al. (2008) J. J. Crassous, A. Wittemann, M. Siebenbürger, M. Schrinner, M. Drechsler, and M. Ballauff, Colloid and Polymer Science 286, 805 (2008).
- Cheng et al. (2010) W. Cheng, M. R. Hartman, D.-M. Smilgies, R. Long, M. J. Campolongo, R. Li, K. Sekar, C.-Y. Hui, and D. Luo, Angewandte Chemie International Edition 49, 380 (2010).
- Zhang et al. (2014) J. Zhang, P. M. Lettinga, J. K. Dhont, and E. Stiakakis, Physical review letters 113, 268303 (2014).
- Scotti et al. (2018b) A. Scotti, M. Brugnoni, A. A. Rudov, R. Schweins, I. I. Potemkin, and W. Richtering, Supporting Information (2018b).
- Baus (1987) M. Baus, Journal of statistical physics 48, 1129 (1987).
- Frenkel (2009) D. Frenkel, Nature 460, 465 (2009).
- Denton and Tang (2016) A. R. Denton and Q. Tang, The Journal of chemical physics 145, 164901 (2016).
- Gasser et al. (2019) U. Gasser, A. Scotti, and A. Fernandez-Nieves, Physical Review E 99, 042602 (2019).
- Gasser et al. (2013) U. Gasser, J.-J. Lietor-Santos, A. Scotti, O. Bunk, A. Menzel, and A. Fernandez-Nieves, Phys. Rev. E 88 (2013).
- Gasser et al. (2014) U. Gasser, J. S. Hyatt, J.-J. Lietor-Santos, E. S. Herman, L. A. Lyon, and A. Fernandez-Nieves, J. Chem. Phys. 141 (2014).
- Schmid et al. (2016) A. J. Schmid, J. Dubbert, A. A. Rudov, J. S. Pedersen, P. Lindner, M. Karg, I. I. Potemkin, and W. Richtering, Sci. Rep. 6, 22736 (2016).
- Dubbert et al. (2015) J. Dubbert, K. Nothdurft, M. Krag, and W. Richtering, Macromolecules Rapid Commun. 36, 159 (2015).
- Brugnoni et al. (2018) M. Brugnoni, A. Scotti, A. A. Rudov, A. P. H. Gelissen, T. Caumanns, A. Radulescu, T. Eckert, A. Pich, I. I. Potemkin, and W. Richtering, Macromolecules 51, 2662 (2018).
- Scheffold and Mason (2009) F. Scheffold and T. Mason, Journal of Physics: Condensed Matter 21, 332102 (2009).
- Auer and Frenkel (2001) S. Auer and D. Frenkel, Nature 409, 1020 (2001).
- Pàmies et al. (2009) J. C. Pàmies, A. Cacciuto, and D. Frenkel, J. Chem. Phys. 131, 044514 (2009).
- Frenkel (1994) D. Frenkel, Journal of Physics: Condensed Matter 6, A71 (1994).
- Frenkel (1999) D. Frenkel, Physica A: statistical mechanics and its applications 263, 26 (1999).
- Pusey (1987) P. Pusey, Journal de physique 48, 709 (1987).
- Gnan and Zaccarelli (2019) N. Gnan and E. Zaccarelli, Nat. Phys. 15, 683 (2019).