High level ab initio binding energy distribution of molecules on interstellar ices: Hydrogen fluoride
Abstract
The knowledge of the binding energy of molecules on astrophysically relevant ices can help to obtain an estimate of the desorption rate, i.e. the molecules residence time on the surface. This represents an important parameter for astrochemical models, and it is crucial to determine the chemical fate of interstellar complex organic molecules formed on the surface of dust grains and observed in the densest regions of the interstellar medium through rich rotational lines. In this work, we propose a new robust procedure to study the interaction of atoms and molecules with interstellar ices, based on ab initio molecular dynamics and density functional theory, validated by high-level ab initio methods at a CCSD(T)/CBS level. We have applied this procedure to a simple but astronomically relevant molecule, hydrogen fluoride (HF), a promising tracer of the molecular content of galaxies. In total we found 13 unique equilibrium structures of HF binding to small water clusters of up to 4 molecules, with binding energies ranging from 1208 to 7162 K (2.4 to 14.23 kcal ). We computed a 22-molecules model of amorphous solid water (ASW) surface using ab initio molecular dynamics simulations and carried out a systematic analysis of the binding sites of HF, in terms of binding modes and binding energies. Considering 10 different water clusters configurations, we found a binding energy distribution with an average value of K ( kcal ), and a dispersion of K ( kcal ). Finally, the effect of the electrostatic field of the 22 water molecules on the binding energies was investigated incrementally by symmetry adapted perturbation theory, in order to gauge the effect of the water environment on the binding energies. The results indicate that the extent of the electrostatic interaction of HF with ASW depends strongly on the properties of the binding site on the water cluster. We expect that this work will provide a solid foundation for a systematic development of a binding energy distribution database of small molecules on astrophysically relevant surfaces.
keywords:
Hydrogen fluoride, astrochemistry, ISM, ab initio quantum chemistry, binding energy1 Introduction
Dust is a key element for the formation and destruction of interstellar molecules,
due to its catalytic nature (Charnley et al., 2001; Caselli and Ceccarelli, 2012). In the dense and cold regions
of the interstellar medium (ISM), dust grains are covered with ice mantles, formed by the
accretion of gas-phase atomic and molecular material onto the surface of bare grains (mainly
carbonaceous and silicates). Observational data provide a number of constraints both on their chemical composition and physical structure,
although precise
information is still lacking (Bartels-Rausch et al., 2012). Water is the primary
ice component, along with significant quantities of other molecules – mainly CO, NH3,
and \ceCO2 (Garrod and Pauly, 2011; Boogert et al., 2015). Species adsorbed on the surface of these icy mantles are
supposed to diffuse and lead to the formation of new molecules via thermal hopping or
tunneling between different sites. This has been so far suggested to be one of the main
paths leading to the formation of interstellar complex organic molecules (iCOMs)
(Charnley and Rodgers, 2006; Sewiło et al., 2019; Simons et al., 2020). Thermal or cosmic-rays induced desorption of
the new species allows to observe them in gas-phase via rich rotational lines. Most of the parameters
causing species desorption from grains are directly or indirectly related to their binding
energy () and, in addition, experiments have shown that is
heavily dependent on the type of grain surface and other morphological parameters
(e.g. coverage, He et al., 2016). An accurate knowledge of the binding energy is therefore of
central importance for the understanding of key chemical processes leading to the formation of Solar-type systems and life-precursor species.
Binding energies can be experimentally measured using Temperature Programmed Desorption (TPD)
– a list can be found in the review by Cuppen et al. (2017) – but current facilities are affected
by sensitivity problems, identification of volatiles with the same mass and, more important, by
the incapability to study radicals species. It is then necessary to complement experimental
studies with high-accuracy theoretical calculations.
A reasonable choice for the theoretical description of the substrate is vapor-deposited amorphous
solid water (ASW), since at the typical temperatures of the interstellar cold regions, water is assumed
to be amorphous (Bartels-Rausch et al., 2012; Hama and Watanabe, 2013) and partly porous (Palumbo, 2006).
It should be kept in mind, though, that the simulations of this kind of structures
present challenges related to the computational method and the model employed to describe the
surface. Recently, there have been efforts to consider more sophisticated ASW models which
take into account a variety of sites available for the adsorbate to bind to the surface.
Among them, Shimonishi et al. (2018) proposed a mixed approach, where a large
amorphous surface is generated through molecular dynamic annealing simulations, followed by
quantum chemistry binding energies evaluation, in order to provide a new sets of values
for the system C, N, \ceO -ASW. In addition, several reactivity studies have been carried
out by using a QM/MM ASW
simulated surface, including binding sites and binding energies analysis (Song and Kästner, 2016; Lamberts et al., 2019; Molpeceres and Kästner, 2020). The efforts to
obtain a binding energy extensive catalogue for small molecules on ice surfaces
have been so far limited to Density Functional Theory (DFT) calculations on small water
clusters (up to 6 molecules, Sil et al., 2017; Das et al., 2018, see) or interaction with water monomer by
linear semi-empirical models (Wakelam et al., 2017), which do not capture the complete
statistical nature of the interaction on ASW. Furthermore, closed shell molecules interact
with water molecules through non-covalent interactions, which on average are just of the order
of a millionth of the total molecular energy. Therefore, it is paramount to carefully validate
any DFT methods through more accurate wavefunction approaches, in order to obtain reliable
binding energies.
In this paper we present a new pipeline for the accurate computation of atomic and molecular binding energies on astrophysically relevant surfaces, by employing ab initio molecular dynamics and DFT, validated by high-level wavefunction methods. We apply this procedure to a simple but astrophysically relevant species, hydrogen fluoride (HF), a reliable tracer of the molecular gas in galaxies (Neufeld et al., 2005). Fluorine is one of the few atoms which can undergo exothermic reaction with \ceH2 to form a diatomic hydride, a reaction that has been proven to be a uniquely efficient pathway to HF formation. Astronomical HF constitutes the main reservoir of interstellar fluorine, carrying almost the totality of the elemental fluorine (Neufeld et al., 2005). In fact, the paths leading to HF destruction are not particularly efficient and the next most abundant molecule containing fluorine, \ceCF^+, is expected to show an abundance of two orders of magnitude smaller than that of HF (Liszt et al., 2015; van der Wiel et al., 2016; Muller et al., 2016). Thus, the constant \ceHF/H2 ratio, together with a high probability that HF molecules are in the rotational ground state, results in a direct connection between HF absorption depth and \ceH2 column density. The observational data, however, suggest that in cold clouds, where temperatures are low ( 20 K), HF may condense onto dust grains. Although freeze-out effects might reduce the effectiveness of HF as a diagnostic tool, the density and temperature conditions needed for its adsorption, and desorption, have been studied in astrophysical context only qualitatively (Neufeld et al., 2005; van der Wiel et al., 2016). Here we report the first high level ab initio binding energy calculations of the system HF – water (W) cluster up to 4 water molecules. These values are used as reference for the subsequent calculations involving larger ASW clusters consisting of 22 water molecules. Our ASW surface model has been obtained starting from ab initio molecular dynamics (AIMD) and our procedure is designed to be applicable to other systems. This paper is organised as follow: The computational methods are presented in Section 2, the computed structures and energies are presented in Section 3 and discussed in Section 4. We then summarise and present our conclusions in Section 5.
2 Computational Methods
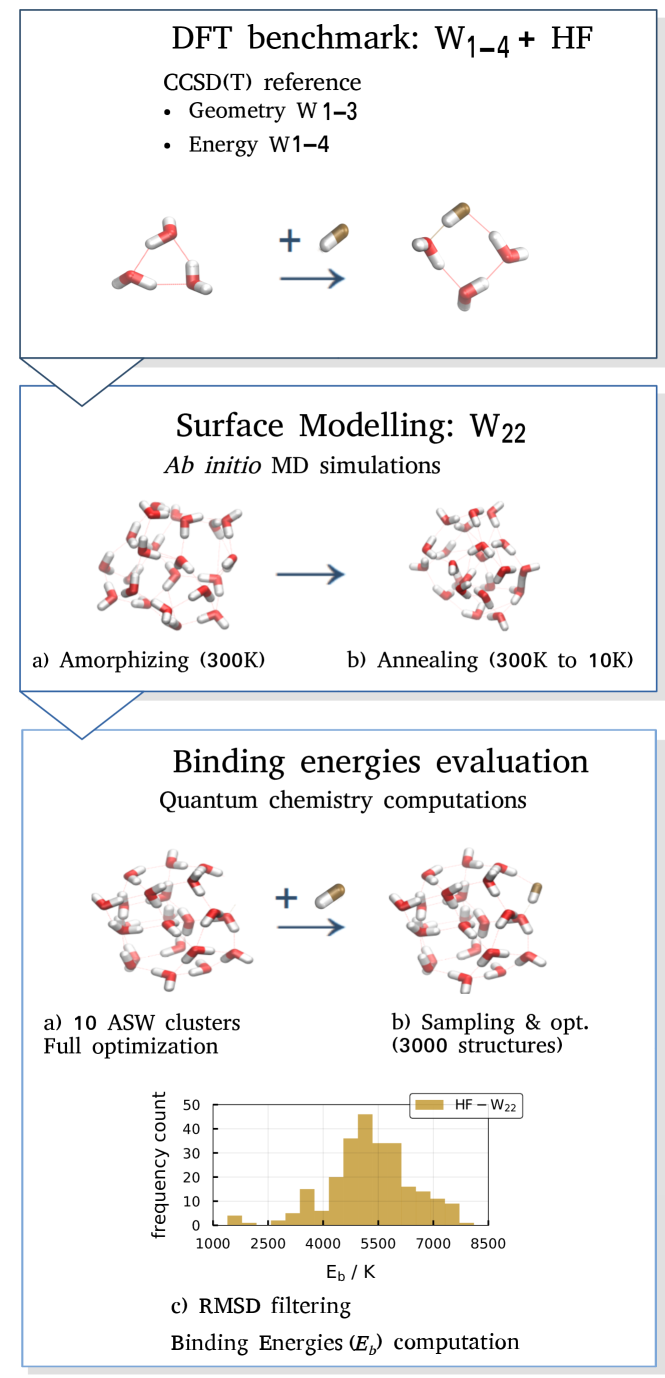
The computational pipeline used in this work is displayed in Fig. 1. After a first benchmark step (1), aimed at predicting suitable DFT methods for the different phases of the procedure, the amorphous water cluster is modelled (2) and finally the binding sites of HF on the surface are identified and the corresponding binding energies computed (3).
2.1 DFT benchmark
We carried out geometry and energy benchmarks considering 45 different DFT levels of theory, dividing them in three tiers of computational cost and accuracy: 1) Generalized Gradient Approximation (GGA)/def2-SVP; 2) Hybrid-GGA/def2-TZVP; and 3) Meta-GGA/def2-TZVP (Weigend and Ahlrichs, 2005). Since DFT alone fails to correctly describe dispersion interactions, the D3BJ (Grimme et al., 2010, 2011) dispersion correction was included in the geometry optimizations and single point computations. All benchmark computations were done using the Psi4 program package (Parrish et al., 2017).
Geometries
The water clusters equilibrium structures, \ceW_1-3, are obtained by geometry optimizations using a wavefunction at the CCSD(T) level (Raghavachari et al., 1989), together with the correlation consistent valence polarized aug-cc-pVTZ basis (Dunning and Dunning Jr, 1989; Kendall et al., 1992). To find the reference structures for the interacting \ceHF-W_1-3 systems, we employ a random minima search. The initial exploration is done at the BLYP/def2-SVP level of theory and the resulting equilibrium structures are optimized using first MP2/cc-pVTZ followed by DF-CCSD(T)/aug-cc-PVTZ method and basis (Bozkaya and Sherrill, 2017). HF – \ceW_4 equilibrium geometries, used in the energy benchmark, have been computed at DFT revPBE0/def2-TZVP level, due to computational cost, and are not part of the geometry reference structures.
Energies
The binding energies of the reference water cluster model systems, HF – \ceW_1-4, are computed with the CCSD(T) method at the complete basis set (CBS) limit (Klopper and Kutzelnigg, 1986; Feller, 1992; Helgaker et al., 1997; Karton and Martin, 2006), by employing the following equation:
| (1) |
where stands for the energy of the HF – \ceW_n supermolecule, is referred to the \ceW_n cluster energy and is the energy of the adsorbate. The zero point vibrational energy (ZPVE) corrections to the binding energies are obtained at the CCSD(T)/aug-cc-pVTZ level of theory. Furthermore, to correct for basis set superposition error (BSSE) of the def2-SVP and def2-TZVP basis sets used at the DFT level of theory, the counterpoise correction (Boys and Bernardi, 1970) is added to both the and the computations. Further details and benchmark tables can be found in Supplementary Material (Fig. S1-S12).
2.2 Surface Modelling: Ab initio molecular dynamics simulations
The modelling procedure aims at generating an amorphous water surface. To build the ASW ice model we use the cluster approach (Zamirri et al., 2019) by selecting a suitable cluster size (22 water molecules), in order to guarantee a reasonable number of available binding sites on the surface, while at the same time being able to use high-level model chemistry. The steps to obtain the ASW ice model are the following:
1) First, we perform a high temperature ab initio molecular dynamics (AIMD) simulation of 100 ps on the initial system in order to amorphyze it. We preferred AIMD over classical dynamics for ice simulations, since the former generates interaction potentials using quantum-chemical methods, while common empirical water force fields are parameterized using properties of liquid water (Szalewicz et al., 2009; Chen et al., 2017). (AIMD parameters: 1 fs for the time-step, Langevin thermostat at 300 K, spherical periodic boundary conditions applied in order to avoid evaporation effects);
2) We extract 100 independent structures ( 1 ps) from the resulting trajectory, which undergo temperature annealing of 3 ps to reach the target interstellar conditions (10 K);
3) Among the structures obtained, the first 10 more representative are selected using geometrical criteria (we assumed a similarity threshold of root-mean-square deviation of atomic positions (RMSD) 0.4 Å to group the obtained structures and selected the 10 most populated clusters). All AIMD simulations are performed at the BLYP/def2-SVP level, adding D3 Grimme (Grimme et al., 2010) correction for dispersion interactions, as implemented in Terachem (Ufimtsev and Martinez, 2009; Titov et al., 2013).
2.3 Binding sites and binding energies evaluation
The previously selected 10 ASW clusters, fully optimized at BLYP/def2-SVP level,
present an amorphous spheroidal structure with an approximate size of
) Å3. The target molecule is added to each cluster using a random
surface sampling procedure. 3000 structures (300 per cluster) are generated and optimized at
BLYP/def2-SVP level of theory. Subsequently, the unique resulting structures are filtered using
geometrical criteria (RMSD = 0.6 Å) , and serve as initial candidates for molecule HF – ASW binding sites.
We refine the geometry at the revPBE0/def2-TZVP (Zhang and Yang, 1998) level of theory,
leading to the generation of 255 equilibrium structures in which the molecule is bound to
the ASW surface through different sites. Finally, the binding energies are obtained using the
same level of theory. Given the high variety of binding sites on the amorphous surface,
we collect a set of energies for each of the 10 clusters. Assuming that the clusters share
the same morphological characteristics, since they have been generated from a unique AIMD
trajectory and annealed in the same way, the binding energies collected are considered to
constitute a single binding energy distribution of the target molecule on ASW.
The Terachem program was used for the initial minima search DFT optimizations at the
lower GGA level of theory and Psi4 was used for the hybrid GGA computations.
2.4 Binding energy analysis
The binding energy can further be decomposed into two components: deformation energy () and interaction energy (), such that:
| (2) |
The interaction energy accounts for the non-covalent interaction of the two molecular fragments in the bound conformation. The deformation energy quantitatively characterises the structural changes of the adsorbate and the water cluster with respect to the isolated molecules and is defined by:
| (3) |
where and is the energy of the isolated molecules and and the energy of the adsorbate and water cluster in the supermolecular configuration.
Finally, we perform a zeroth order Symmetry Adapted Perturbation Theory (SAPT0) analysis (Jeziorski et al., 1994), by using a jun-cc-pVDZ (Papajak et al., 2011) basis set on a few selected structures. This SAPT0 energy decomposition allows to further decompose the interaction energy into electrostatic, induction, dispersion and exchange-repulsion, which is a useful tool for identifying the effects that drive the non-covalent interaction between the adsorbate and the ASW surface. Within this decomposition analysis, the total interaction energy is given by:
| (4) |
3 Results
In the first part of this section, we report the results of the highly accurate HF – \ceW_1-3 geometries and HF – \ceW_1-4 binding energies used as a reference in the DFT benchmark (see Sec. 3.1). Additionally, we computed DFT binding energies for the systems \ceHF - W_5-6 (Sec. 3.2). Finally (Sec. 3.3), we report the structures and the binding energies of HF on ASW model surface, \ceHF - W_22.
3.1 DFT benchmark
3.1.1 CCSD(T) equilibrium geometries
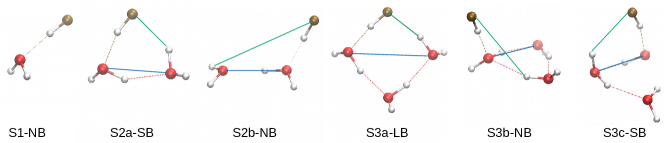
Fig. 2 shows the CCSD(T) \ceHF - W_1-3 equilibrium geometries employed as references for the DFT benchmark. We found one isomer for the system of HF interacting with the water monomer, two for the water dimer, and three for the trimer. These structures differ on how HF is bound to the clusters: through two hydrogen bonds, where HF binds to two different water molecules forming a bridge-type interaction (e.g. S2a-SB, short bridge abv. SB, or S3a-LB, long bridge abv. LB, depending on the oxygen-oxygen length), or through a single hydrogen bond with only one water molecule (e.g. S2b-NB, non-bridged abv. NB). This classification, albeit evident in the small water clusters, is very helpful when analyzing the \ceHF - ASW system, since it allows for automatic identification and a separate energetic analysis of the different binding modes. We explain the classification procedure in detail in section 3. In terms of geometry, the global best DFT functional is the Hybrid-revPBE0 coupled with def2-TZVP basis set, with an average RMSD of only 0.020. The complete set of benchmark tables is reported in the Supplementary Material (Fig. S1-S12). Since the performance of BLYP is similar (average RMSD 0.175) to HCTH120 (average RMSD 0.157), we preferred to rely on it for the computations carried out at GGA level, due to its more widespread implementation in electronic structure programs. It is worth mentioning that the CCSD(T)/aug-cc-pVTZ minima search of the S3b-NB structure was an onerous endeavour, which indicates a very flat potential energy surface around this equilibrium geometry. Furthermore, not surprisingly, several DFT functionals failed to correctly optimize this structure.
3.1.2 CCSD(T) binding energies
| \ceHF - W_n | CCSD(T)/CBS | revPBE0/def2-TZVP | |||||||
| n | Name | + | + | / Å | / Å | ||||
| 1 | S1-NB | 4479 | 3090 | 4390 | 3074 | 9 | 4399 | - | - |
| 2 | Avg | 4684 | - | 4622 | 3420 | 294 | 3714 | 2.39 | 2.83 |
| S2a-SB | 6799 | 5003 | 6667 | 4925 | 343 | 7010 | 2.08 | 2.76 | |
| S2b-NB | 5355 | 4131 | 5286 | 4118 | 507 | 5793 | 5.16 | 2.85 | |
| S2c-NB | 1898 | - | 1913 | 1372 | 31 | 1944 | 4.06 | 2.89 | |
| 3 | Avg | 5414 | - | 5234 | 4185 | 1423 | 6657 | 2.54 | 3.12 |
| S3a-LB | 7162 | 5764 | 7172 | 5907 | 2402 | 9574 | 1.82 | 3.76 | |
| S3b-NB | 4786 | - | 4031 | 3184 | 938 | 4969 | 4.50 | 2.91 | |
| S3c-SB | 4580 | - | 4500 | 3440 | 928 | 5427 | 2.61 | 2.68 | |
| 4 | Avg | 4957 | - | 4886 | 3805 | 1861 | 6747 | 2.30 | 2.98 |
| S4a-LB | 6211 | - | 6103 | 4974 | 4507 | 10610 | 1.76 | 4.26 | |
| S4b-LB | 6208 | - | 5989 | 4575 | 2927 | 8915 | 1.86 | 3.52 | |
| S4c-SBY | 5646 | - | 5671 | 4416 | 1799 | 7471 | 2.38 | 3.01 | |
| S4d-SB | 5338 | - | 5229 | 4052 | 1841 | 7070 | 2.10 | 3.03 | |
| S4e-NB | 5132 | - | 5116 | 4004 | 19 | 5134 | 3.70 | 2.64 | |
| S4f-NB | 1208 | - | 1211 | 806 | 74 | 1285 | 4.08 | 2.72 | |
| HF – \ceW_n | revPBE0/def2-TZVP | |||||||
| n | Type | num | + | / Å | / Å | |||
| 5 | Tot | 13 | 5579 | 4333 | 1739 | 7317 | 2.40 | 3.12 |
| LBY | 1 | 6899 | 5421 | 2319 | 9217 | 2.14 | 3.87 | |
| LB | 4 | 6107 | 4836 | 2848 | 8955 | 1.95 | 3.61 | |
| SBY | 1 | 5962 | 4764 | 2756 | 8718 | 2.13 | 3.08 | |
| SB | 6 | 4983 | 3774 | 968 | 5952 | 2.54 | 2.82 | |
| NB | 1 | 5333 | 4154 | 326 | 5660 | 3.84 | 2.77 | |
| 6 | Tot | 30 | 6073 | 4609 | 1749 | 7822 | 2.21 | 3.49 |
| LBY | 2 | 7753 | 5833 | 1477 | 9231 | 2.19 | 3.91 | |
| LB | 15 | 6420 | 4956 | 2197 | 8617 | 1.97 | 3.99 | |
| SBY | 1 | 6121 | 4300 | 751 | 6873 | 2.41 | 2.80 | |
| SB | 9 | 5525 | 4056 | 1581 | 7106 | 2.29 | 2.93 | |
| NB | 3 | 4851 | 3819 | 525 | 5377 | 4.59 | 2.68 | |
In Table 1 we present the binding energy values obtained for
the HF – \ceW_1-4 systems. For the energy benchmark, we considered the CCSD(T)
structures previously mentioned (Fig. 2), together with the 6 energy
minima of the HF – \ceW_4 system, optimized at the revPBE0/def2-TZVP level of theory.
Furthermore, we included a dimer equilibrium structure (S2c-NB) that we found only at DFT level.
The equilibrium structure with the highest binding energy is S3a-LB, with a value of 7162 K, followed by
S2a-SB (6799 K) and two HF – tetramer minima (S4a-LB 6211 K and S4b-LB 6208 K), bridge-type as well. All high binding energy
equilibrium structures correspond to bridged type binding modes. The entire binding
energy range spreads from 1208 to 7162 K. The ZPVE correction have been computed at
CCSD(T)/aug-cc-pVTZ level only for four structures, due to computational cost, and it
reduces the binding energies by 1300-1800 K for all of them.
The energy benchmark result is the following.
Two Hybrid-GGA methods showed the best
performance: B97-2 (mean absolute deviation, MAD, 61 K) and revPBE0 (MAD 74 K). The complete set of benchmark tables is in Fig. S1-S12. It is worth mentioning that,
due to the very flat potential energy surface (PES) around the S3b-NB minimum, this structure is the one
with the highest deviation from the CCSD(T) reference, especially when computing the
binding energy on the DFT optimized structures (see Table1), which
otherwise yields results in excellent agreement with the high level reference.
The DFT model chemistry that shows the highest fidelity with respect
to the CCSD(T) reference in terms of energy and geometry is revPBE0/def2-TZVP.
Therefore, we used this level of theory for the evaluation of binding sites and energies
in the HF – \ceW_5-6 and the HF – ASW22 systems, in which high level coupled cluster
methods are prohibitively expensive. The ZPVE correction, computed
at DFT revPBE0/def2-TZVP level, reduces the binding energies by around 1300-1600 K for all the
structures and maintains the good quality of the benchmark results.
| HF – \ceASW_22 | revPBE0/def2-TZVP | |||||||||
| Highest values | Average values | |||||||||
| Type | + | + | / Å | / Å | ||||||
| Tot | 100.00 | 7841 | 6479 | 5263 | 3461 | 2012 | 7502 | 1181 | 2.15 | 3.52 |
| LBY | 2.40 | 7418 | 6304 | 6534 | - | 3286 | 9820 | 902 | 1.96 | 4.0 |
| LB | 47.06 | 7841 | 6479 | 5888 | 4898 | 2340 | 8228 | 967 | 1.97 | 3.94 |
| SB | 43.10 | 6425 | 5008 | 4659 | 3709 | 1151 | 5810 | 818 | 2.72 | 2.83 |
| NB | 7.44 | 5611 | 4491 | 4340 | 3957 | 504 | 4844 | 1575 | 4.68 | 2.75 |
3.2 HF – \ceW_5-6
We studied the HF binding sites for the intermediate sized W5-6 water
clusters in order to obtain a more complete census of possible binding modes.
We found 13 equilibrium structures for \ceHF-W_5 and 30 for \ceHF-W_6.
The computed average for each binding mode (Table 2)
ranges from 4851 to 7753 K (reduced by 1000-1500 K with ZPVE correction).
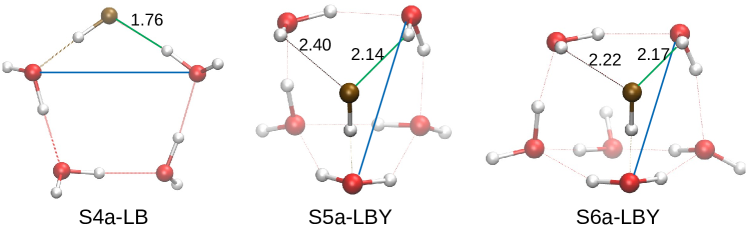
Interestingly, in the global minimum structures depicted in Fig. 3, fluorine
forms a double hydrogen bond with two water molecules, with a distance of around
2.2 Å, resulting in a ”Y-like” shape.
As expected, the spread in binding energy is higher in the hexamer (4500-7000 K) than in
the pentamer (5300-6900 K). This can be attributed to a richer variety of binding
sites in the hexamer, which results in the emergence of a distribution (Fig. S16)
centered around 6000 K, with standard deviation of 1090 K.
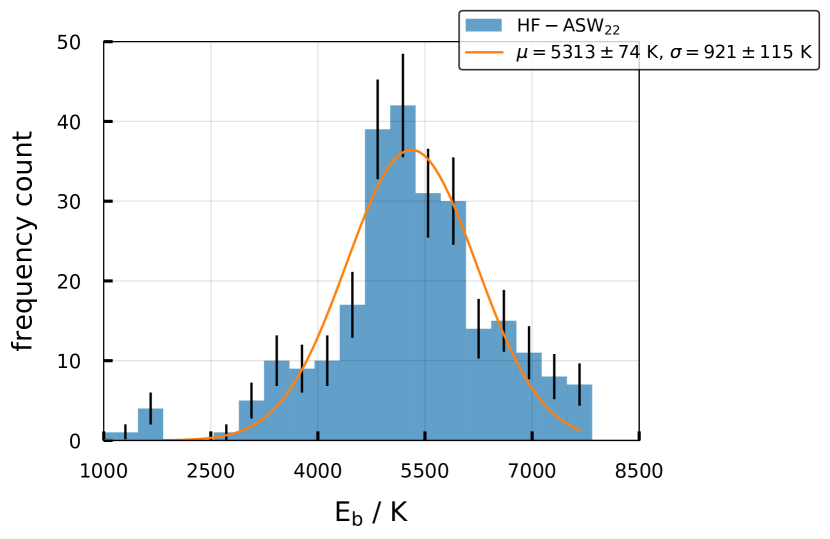
3.3 HF – ASW surface
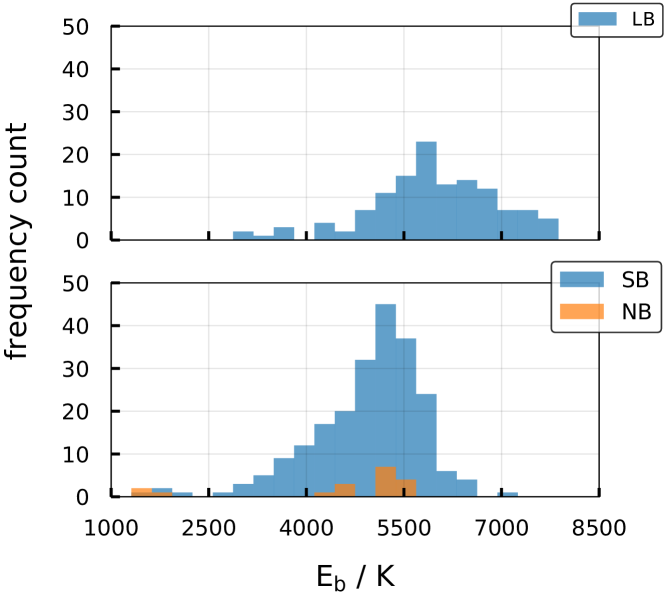
The procedure described in Section 2.2 and 2.3 provided a total of 255 unique minimum energy structures on 10 selected ASW clusters containing 22 water molecules (ASW22). These represent a wide range of structurally different binding sites and produce a binding energy distribution which ranges from 1400 K to 7841 K, with an average of 5263 K, reported in Fig. 4. Using the binding modes classification found for the small and intermediate-size clusters (see next section) we have been able to decompose the distribution in different contributions (Fig. 5). In Fig. 6, for each binding mode, we show the most energetically favorable structures. In Table 3 we report the percentage of binding sites found for each binding mode and the average , along with ZPVE corrected values.
Binding modes classification
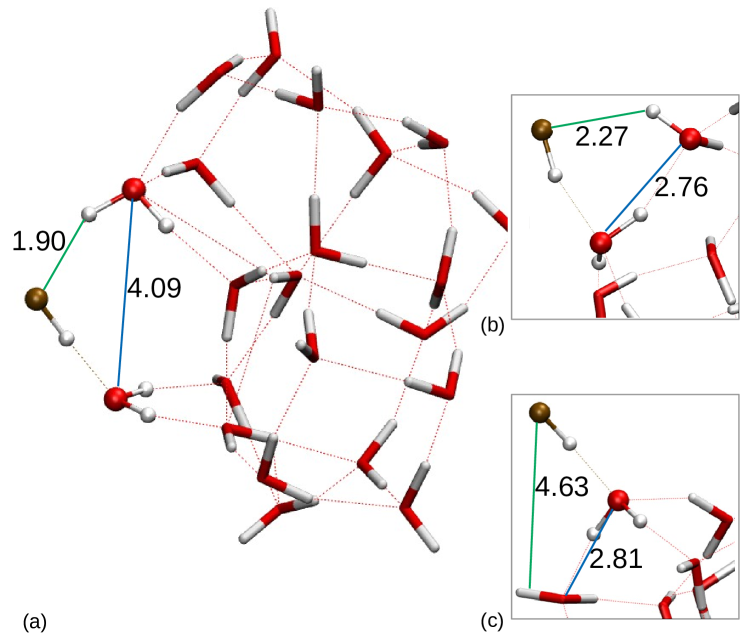
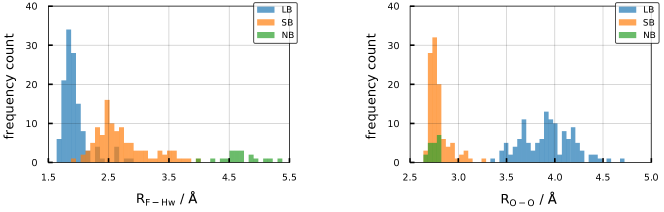
Three main different binding adsorption patterns have been found to be recurrent: two bridged modes where HF binds to the surface through two different hydrogen bonds, and a non-bridged one where a single hydrogen bond is formed. Here we explain the identification procedure we followed, applying it to the HF – \ceASW_22 system. For the first group of structures (bridged), it is possible to discriminate between the two different modes through the length of the distance between the two oxygen atoms closest to the binding site (, marked in blue in Fig. 6). First, a long bridge (abv. LB, Fig. 6a), in which is longer than 3.3 Å, and second a short bridge (abv. SB, Fig. 6b) with a shorter than that distance. This criterion has been established with the aid of the histogram obtained for the aforementioned distance reported in Fig. 7. The right panel shows the presence of two distributions, one centered around 3.8 Å which corresponds to the LB-type binding mode, while a second distribution appears at 2.7 Å, which can be associated with the SB- and the NB-type (the non-bridged, Fig. 6c). Furthermore, the NB-type structures can be separated from the SB- ones using : the distance of the fluorine-water hydrogen bond (Fig. 6, marked in green). As shown in the left panel of Fig. 7, two distinct distributions appear on the short distance region, belonging to the bridged types (LB and SB), thus confirming that they correspond to different binding modes. As expected, the NB-type binding mode presents a distribution centered at much larger distances, namely around 4.6 Å, consistent with the absence of a second hydrogen bond. Finally, there is a last category that is a sub-classification of the bridged type structures, in which there are 3 oxygen atoms within a 3 Å sphere range from the fluorine atom. The latter forms a double hydrogen bond with two different water molecules in a Y-shaped binding mode. An example of this pattern is constituted by the minimum energy structures of HF – \ceW_5-6 (S5a-LBY, S6a-LBY) reported in Fig. 3.
4 Discussion
4.1 Energetic considerations
Our analysis indicates that HF is adsorbed on the small water clusters and ASW via a non-covalent interaction. The global energy minima for the HF – \ceW_3-6 systems correspond to a long bridge-type bond ( between 6200 K and 7753 K). Hence, the LB adsorption configuration seems to be energetically very favorable. This occurs despite a significant stretching of the water oxygen framework to attain the bound configuration, which is reflected in high deformation energies (2976 K on average, see Table 1 and 2). However, the concurrent large interaction energies ( 9000 K) exceeds the deformation energy, making it an overall advantageous configuration. On the other hand, the deformation of the oxygen framework in the other binding modes is less pronounced, albeit at a cost of smaller interaction energies, resulting in lower binding energies. This trend is confirmed in the ASW system. The binding energy distributions found for LB and SB modes (Fig. 5) are centered at 5888 K and 4659 K respectively, thus confirming the stronger energetic interaction in the LB-type mode. It is worth mentioning that, although in the NB binding mode HF only forms one hydrogen bond with the ASW surface, the binding energy is, on average, only 300 K smaller than the short bridge-type. However, this binding mode is also less frequent representing the 8% of the equilibrium structures found. Finally, the Y-type variant seems to be energetically favorable (largest 9820 K), which can be attributed to the formation of a double hydrogen bond of fluorine with two water molecules.
4.2 Effect of the ASW environment on the binding energies
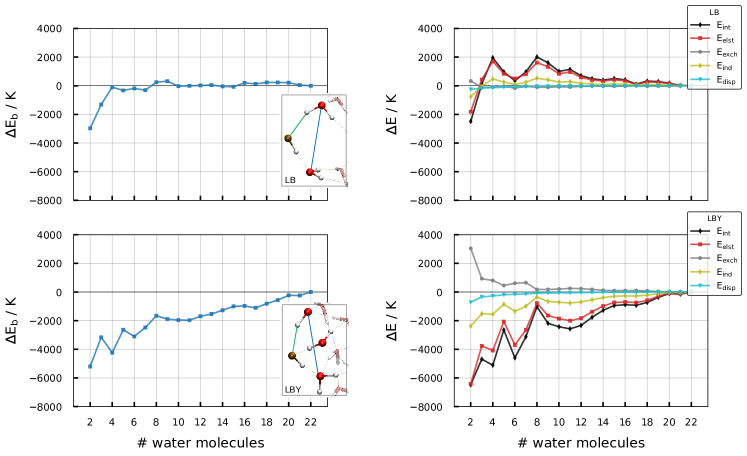
The results presented in the previous sections suggest that the surface properties of the ASW in the proximity of HF binding sites have a significant effect on the binding energies. However, there is no correlation between the binding energies and the or the distances (Fig. S18), thus pointing to a significant energetic influence of the electrostatic field produced by the water molecules. In order to investigate this point, we chose two structures (a LB and a LBY type, specifically the highest in binding energy for both groups) and followed the evolution of the binding energy with respect to the size of the cluster, by removing one water molecule at a time, starting from the optimized structure, and keeping the remaining molecules frozen. We repeated the process until all but the two nearest water molecules to the HF binding site are removed. The resulting values, computed for each frozen water cluster, are plotted in Fig. 8, left panel. The 0 K baseline corresponds to the original energy value for the HF – \ceASW_22 structures, such that the plotted energies represent the deviation from that binding energy at each cluster size. Although the two structures present a similar (Table 4), they show a different convergence to the HF – \ceASW_22 final value. When the water clusters consists only of two molecules (\ceW_2 cluster) both the LB and LBY structures significantly underestimate the final values. However, of the LB structure computed at \ceW_4 cluster is already converged, which indicates that, for this mode, only the local water environment has a strong effect on the binding energy. On the other hand, the LBY structure shows a slower convergence, and reaches values within 500 K of the ASW22 binding energy only when the water cluster grows to 18 molecules. Thus, in this case, the water environment seems to have an important impact on the binding energy, as it accounts for approximately 60% of the target value.
| revPBE0/ | SAPT0/ | |||||
|---|---|---|---|---|---|---|
| def2-TZVP | jun-cc-pVDZ | |||||
| Type | - | |||||
| LB | 7841 | 10975 | 15433 | 14962 | 6988 | 2129 |
| LBY | 7418 | 12950 | 20221 | 19954 | 9858 | 2823 |
To further analyze the environment effect on the interaction energy, we decomposed it into electrostatic (), exchange (), induction () and dispersion () energy, using SAPT0. The values for each contribution to the interaction energy are shown in Table 4. As expected, the largest attractive contribution to the interaction energy comes from the electrostatic, followed by induction and dispersion energy. The only repulsive interaction corresponds to the exchange energy. All contributions to the interaction energy are larger in the LBY structure, which is consistent with a HF molecule further embedded into the oxygen framework compared to the LB structure. Fig. 8, right panel, shows the evolution of the different contributions with respect to the number of molecules in the ASW cluster. In the LB-type binding mode, the , , and contributions converge rapidly, not showing any major variations after the third water molecule. The contributions fluctuates within a range of -2000 and 2000 K, and reaches a value within 500 K of the final value at \ceW_10 cluster size. Therefore, only the nearest 10 water molecules affect the interaction energy and mostly the electrostatic term. The other contributions are almost exclusively determined by the two closest water molecules bound to HF. On the other hand, in the LBY binding mode, both and show changes up to \ceW_6 cluster size, especially when adding the third water molecule. This is in line with the observation that, in this mode, HF interacts strongly with the three water molecules closest to the binding site. For the the variance with respect to the water environment is even more dramatic, since at \ceW_2 it is 6000 K lower than the final value and the convergence is very slow: it gets within 500 K of the \ceASW_22 value only at \ceW_18. Thus, in this LBY sample, even distant water molecules play a paramount role in an accurate determination of the binding energy value.
4.3 Effect of the surface topology on the binding energies
In order to assess whether the binding energy values obtained for the \ceASW_22 system are dependent on the cluster size, we applied our simulation procedure (Sec. 2.2 and 2.3) to two clusters of 37 water molecules. The resulting structures are amorphous and oval-like shaped ( , see Fig. S19 in the Supplementary material. We performed both the initial minima search and the binding site optimizations at BLYP/def2-SVP level, while the energies have been computed at revPBE0/def2-TZVP. The procedure provided a total of 126 unique binding sites. In Table 5 we report the average binding energies, as well as the percentage of each binding mode. As for the \ceASW_22 cluster, the most frequent structure type is the LB (), followed by the SB () while the NB-type is completely absent. Noticeably, the LBY variant is particularly common in this system (), which constitutes the main difference with respect to the \ceASW_22 cluster. Since the geometry for HF – \ceASW_37 were computed using a GGA level functional and a double zeta basis set, in order to estimate the error in energy, and being able to compare to the \ceASW_22 system results, we refined the optimization of 15 structures at the higher revPBE0/def2-TZVP level of theory, and computed new binding energies. We used these values to construct a linear fit to correct all the energies. The resulting fitted binding energy values are displayed in Table 5. The fitted binding energies of the HF – \ceASW_37 system are in good agreement with the values obtained for HF – \ceASW_22. The average value is only 100 K higher in energy and the highest binding energy value is about 330 K above the ones found for the 22 water molecules cluster. Therefore, it seems that increasing the cluster size has only a minor effect on the computed binding energy distribution. In conclusion, the \ceASW_22 model is a good compromise between maximizing the number of different binding sites, while still employing a high level of theory.
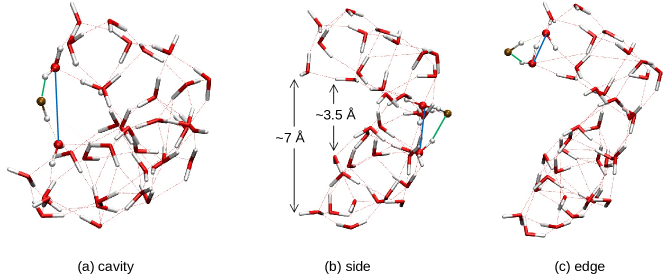
Finally, motivated by recent works, pointing to an increase of the binding energy induced by the presence of cavities on the surface (see Rimola et al., 2018; Enrique-Romero et al., 2019), we decided to further investigate the influence of the shape of the ASW surface considered. We constructed an ad hoc \ceASW_37 system (see Fig. 9) incorporating a wedge-like cavity, by putting together two of the 22 molecule clusters222Note that seven molecules have been removed to made the junction modelling easier; the cavity is of around 10 Å length, 3.5 Å average width and a maximum width of 7 Å reached at the edges level.. After the surface sampling procedure, we computed the binding energy for some representative structures.
| HF – \ceASW_37 | revPBE0/def2-TZVP | |||
|---|---|---|---|---|
| Highest | Average | |||
| Type | % | |||
| Tot | 100 | 8170 | 5369 | 1283 |
| LBY | 30.16 | 8170 | 5326 | 1546 |
| LB | 39.68 | 7903 | 5772 | 1128 |
| SBY | 5.55 | 7641 | 5548 | 1488 |
| SB | 24.60 | 5968 | 4680 | 720 |
| HF – \ceASW_37 / cavity | revPBE0/def2-TZVP | |
|---|---|---|
| cavity LB | 9196 | 490 |
| side LBY | 7044 | 3201 |
| edge LB | 6943 | 968 |
We explored three different spatial situations for the HF molecule: inside the cavity, outside of it and on the edge (panels a, b, and c in Fig. 9, respectively). In Table 6 we report the computed values, applying the fitting correction previously described in order to account for the geometry error. In line with the results by Enrique-Romero et al. (2019), we find larger values in the cavity, compared to the sites on the side and on the cavity’s edge (energy difference around 2000 K); even though the number of samples considered is not sufficient to establish a proper statistical analysis. The reason for the higher values seems to be a low cluster deformation energy (see Table 6), such that energetically favourable binding sites are more readily available to the HF molecule, compared to an ASW surface without cavities. It is therefore likely that a rugged ASW surface might shift the distribution to higher energies, but a more detailed investigation is needed to confirm this trend.
4.4 Comparison with previous works
Despite its diagnostic potential as interstellar gas tracer, HF molecule had not been theoretically studied in a extensive way heretofore. Binding energy values with respect to the interaction of HF with different type of grain surface can be found in literature: hydrogenated crystalline silica grain surface (van der Wiel et al., 2016), and amorphous silica surface covered by different types of ices, specifically \ceH2O (van der Wiel et al., 2016), \ceCO (Rivera-Rivera et al., 2012), \ceCO2 (Chen et al., 2006)). To the best of our knowledge, Das et al. (2018) binding energy relatively to the system HF – \ceW_4 is the only one provided for a water cluster. They computed a value of 5540 K at MP2/aug-cc-pVDZ (counterpoise correction and ZPVE correction not included), that falls within the range of energies we found for the same system (6211-1208 K). Specifically, their structure corresponds to our S4d-SB minimum (5338 K) that is not the global minimum on that potential energy surface. It is also worth pointing out, that the value has been obtained without performing a previous minima search, therefore, apart from the low level of model chemistry in Das et al. (2018), the existence of multiple binding sites is not considered. The other value for HF on water surfaces that has hitherto been used in astrochemical models, is the one obtained from the semi-empirical approach by Wakelam et al. (2017). The model consists of a linear fit between the binding energies on water monomers and experimental values on ASW surfaces. The binding energy estimated using this model is 7500 K, which significantly overestimates the average value of 5490 K at the peak of our Gaussian distribution. Nonetheless it falls within the binding energy range, being slightly lower than the global minimum (7841 K) on ASW22.
4.5 Impact on astrochemical models
The desorption process in astrochemical models is usually treated by following a classic Polanyi-Wigner approach, with an exponential dependence on the binding energy. This means that a difference of a few tens of Kelvins in the binding energy can dramatically affect the fate of the molecule in gas-phase and its final abundance. More importantly, in line with the results of this work, experimental studies (Amiaud et al., 2006; He et al., 2011; Noble et al., 2012) have found a distributions exploring the relationship between desorption energy and degree of surface coverage (i.e the number of molecule presents on a surface respect to the monolayer deposition). Even the analysis carried out at low coverage, resembling ISM conditions of very low density, leads to the presence of a binding energy distribution, thus, it seems to be required to reconsider the use of a single binding energy value, employed in current astrochemical models (Grassi et al., 2020). We expect a high impact on the surface chemistry, relevant for studies related to the formation of complex organic molecules in star-forming regions. The presence of a binding energy distribution, in fact, will allow a richer set of available sites with a variety of desorption energies, which will increase the reactivity between different molecules (via thermal hopping or tunneling) due the longer residence time of the molecules on the surface. The consequence might have a dramatic effect on the amount of species returning to gas phase, capable to be observed through their rotational lines.
5 Conclusions
In summary, in this paper we presented a new procedure to compute binding energy distributions on ASW model surface. The pipeline consists of three steps: 1) An extensive DFT benchmark on small water clusters, using high-level wave-function methods as a reference, to obtain an adequate DFT functional. 2) Ab initio MD simulation of water to obtain an ASW surface model. 3) Sampling of the binding sites on the surface with the target molecule and computation of the binding energies. Applying the simulation procedure to the hydrogen fluoride molecule, we found 255 unique structures corresponding to 3 different binding modes. The center of the distribution is located at K ( kcal ). The binding mode that exhibits the highest energy values, corresponds to HF bound to the ASW surface through two different hydrogen bonds. The extended water environment (beyond the two nearest water molecules) seems to have a significant impact on the binding energy for some of the equilibrium structures, especially on the electrostatic component of the interaction energy. In the future we plan to use this pipeline to build a binding energy distribution database of many relatively small molecules on ASW and other astrophysically relevant surfaces.
Acknowledgements
GB gratefully acknowledges support from Sapienza Università di Roma fellowship D.R. 1053/2018 Prot. n. 0030665; Beca de Doctorado UCO 1866 and Beca de Doctorado Nacional ANID n. 21200180. SB is financially supported by ANID Fondecyt Iniciación (project 11170268), and BASAL Centro de Astrofisica y Tecnologias Afines (CATA) AFB-17002. SVG is financially supported by ANID Fondecyt Iniciación (project 11170949) .
Supplementary materials
Supplementary material associated with this article, including all optimized xyz geometries, can be found, in the online version.
References
- Amiaud et al. (2006) Amiaud, L., Fillion, J.H., Baouche, S., Dulieu, F., Momeni, A., Lemaire, J.L., 2006. Interaction of D2 with H2O amorphous ice studied by temperature-programed desorption experiments. The Journal of Chemical Physics 124, 094702. doi:10/dtcbbc.
- Bartels-Rausch et al. (2012) Bartels-Rausch, T., Bergeron, V., Cartwright, J.H.E., Escribano, R., Finney, J.L., Grothe, H., Gutiérrez, P.J., Haapala, J., Kuhs, W.F., Pettersson, J.B.C., Price, S.D., Sainz-Díaz, C.I., Stokes, D.J., Strazzulla, G., Thomson, E.S., Trinks, H., Uras-Aytemiz, N., 2012. Ice structures, patterns, and processes: A view across the ice-fields. Reviews of Modern Physics 84, 885–944. doi:10/gf4w7j, arXiv:1207.3738.
- Boogert et al. (2015) Boogert, A.A., Gerakines, P.A., Whittet, D.C., 2015. Observations of the Icy Universe. Annual Review of Astronomy and Astrophysics 53, 541--581. doi:10/ggrs2p.
- Boys and Bernardi (1970) Boys, S.F., Bernardi, F., 1970. The calculation of small molecular interactions by the differences of separate total energies. Some procedures with reduced errors. Molecular Physics 19, 553--566. doi:10.1080/00268977000101561.
- Bozkaya and Sherrill (2017) Bozkaya, U., Sherrill, C.D., 2017. Analytic energy gradients for the coupled-cluster singles and doubles with perturbative triples method with the density-fitting approximation. The Journal of Chemical Physics 147, 044104. doi:10.1063/1.4994918.
- Caselli and Ceccarelli (2012) Caselli, P., Ceccarelli, C., 2012. Our astrochemical heritage. The Astronomy and Astrophysics Review 20, 56. doi:10/gg3t79, arXiv:1210.6368.
- Charnley et al. (2001) Charnley, S., Ehrenfreund, P., Kuan, Y.J., 2001. Spectroscopic diagnostics of organic chemistry in the protostellar environment. Spectrochimica Acta Part A: Molecular and Biomolecular Spectroscopy 57, 685--704. doi:10/dwmzpk.
- Charnley and Rodgers (2006) Charnley, S.B., Rodgers, S.D., 2006. Pathways to Molecular Complexity. Proceedings of the International Astronomical Union 1, 237. doi:10/cbd2fh.
- Chen et al. (2017) Chen, M., Ko, H.Y., Remsing, R.C., Andrade, M.F.C., Santra, B., Sun, Z., Selloni, A., Car, R., Klein, M.L., Perdew, J.P., Wu, X., 2017. Ab initio theory and modeling of water. Proceedings of the National Academy of Sciences 114, 10846--10851. doi:10/gdj4js, arXiv:1709.10493.
- Chen et al. (2006) Chen, S.J., Chen, C., Hong, Y.S., 2006. Theoretical influence of third molecule on reaction channels of weakly bound complex CO2… HF systems. International Journal of Quantum Chemistry 106, 1640--1652. doi:10/bjwjdb.
- Cuppen et al. (2017) Cuppen, H.M., Walsh, C., Lamberts, T., Semenov, D., Garrod, R.T., Penteado, E.M., Ioppolo, S., 2017. Grain Surface Models and Data for Astrochemistry. Space Science Reviews 212, 1--58. doi:10/gcgpdq.
- Das et al. (2018) Das, A., Sil, M., Gorai, P., Chakrabarti, S.K., Loison, J.C., 2018. An Approach to Estimate the Binding energy of Interstellar Species. The Astrophysical Journal Supplement Series 237, 9. doi:10.3847/1538-4365/aac886, arXiv:1805.08075.
- Dunning and Dunning Jr (1989) Dunning, T.H., Dunning Jr, T.H., 1989. Gaussian basis sets for use in correlated molecular calculations. I. The atoms boron through neon and hydrogen. J. Chem. Phys. 90, 1007. doi:10.1063/1.456153, arXiv:1011.1669v3.
- Enrique-Romero et al. (2019) Enrique-Romero, J., Rimola, A., Ceccarelli, C., Ugliengo, P., Balucani, N., Skouteris, D., 2019. Reactivity of HCO with CH3 and NH2 on Water Ice Surfaces. A Comprehensive Accurate Quantum Chemistry Study. ACS Earth and Space Chemistry 3, 2158--2170. doi:10/ggtpwm.
- Feller (1992) Feller, D., 1992. Application of systematic sequences of wave functions to the water dimer. The Journal of Chemical Physics 96, 6104--6114. doi:10.1063/1.462652.
- Garrod and Pauly (2011) Garrod, R.T., Pauly, T., 2011. ON THE FORMATION OF CO2AND OTHER INTERStelLAR ICES. The Astrophysical Journal 735, 15. doi:10/c355zp.
- Grassi et al. (2020) Grassi, T., Bovino, S., Caselli, P., Bovolenta, G., Vogt-Geisse, S., Ercolano, B., 2020. A novel framework for studying the impact of binding energy distributions on the chemistry of dust grains. Astronomy & Astrophysics doi:10.1051/0004-6361/202039087.
- Grimme et al. (2010) Grimme, S., Antony, J., Ehrlich, S., Krieg, H., 2010. A consistent and accurate ab initio parametrization of density functional dispersion correction (DFT-D) for the 94 elements H-Pu. The Journal of Chemical Physics 132, 154104. doi:10.1063/1.3382344.
- Grimme et al. (2011) Grimme, S., Ehrlich, S., Goerigk, L., 2011. Effect of the damping function in dispersion corrected density functional theory. Journal of Computational Chemistry 32, 1456--1465. doi:10.1002/jcc.21759.
- Hama and Watanabe (2013) Hama, T., Watanabe, N., 2013. Surface Processes on Interstellar Amorphous Solid Water: Adsorption, Diffusion, Tunneling Reactions, and Nuclear-Spin Conversion. Chemical Reviews 113, 8783--8839. doi:10/ggrswt.
- He et al. (2016) He, J., Acharyya, K., Vidali, G., 2016. BINDING ENERGY OF MOLECULES ON WATER ICE: LABORATORY MEASUREMENTS AND MODELING. The Astrophysical Journal 825, 89. doi:10/gg3xb7.
- He et al. (2011) He, J., Frank, P., Vidali, G., 2011. Interaction of hydrogen with surfaces of silicates: Single crystal vs. amorphous. Physical Chemistry Chemical Physics 13, 15803. doi:10/fvcdjg.
- Helgaker et al. (1997) Helgaker, T., Klopper, W., Koch, H., Noga, J., 1997. Basis-set convergence of correlated calculations on water. The Journal of Chemical Physics 106, 9639--9646. doi:10.1063/1.473863.
- Hohenstein et al. (2011) Hohenstein, E.G., Parrish, R.M., Sherrill, C.D., Turney, J.M., Schaefer, H.F., 2011. Large-scale symmetry-adapted perturbation theory computations via density fitting and Laplace transformation techniques: Investigating the fundamental forces of DNA-intercalator interactions. The Journal of Chemical Physics 135, 174107. doi:10/bp7qz7.
- Hohenstein and Sherrill (2010) Hohenstein, E.G., Sherrill, C.D., 2010. Density fitting of intramonomer correlation effects in symmetry-adapted perturbation theory. The Journal of Chemical Physics 133, 014101. doi:10/d2zqdc.
- Jeziorski et al. (1994) Jeziorski, B., Moszynski, R., Szalewicz, K., 1994. Perturbation Theory Approach to Intermolecular Potential Energy Surfaces of van der Waals Complexes. Chemical Reviews 94, 1887--1930. doi:10/dmb4kd.
- Karton and Martin (2006) Karton, A., Martin, J.M.L., 2006. Comment on: ‘‘Estimating the Hartree–Fock limit from finite basis set calculations’’ [Jensen F (2005) Theor Chem Acc 113:267]. Theoretical Chemistry Accounts 115, 330--333. doi:10.1007/s00214-005-0028-6.
- Kendall et al. (1992) Kendall, R.A., Dunning, T.H., Harrison, R.J., 1992. Electron affinities of the first-row atoms revisited. Systematic basis sets and wave functions. The Journal of Chemical Physics 96, 6796--6806. doi:10.1063/1.462569.
- Klopper and Kutzelnigg (1986) Klopper, W., Kutzelnigg, W., 1986. Gaussian basis sets and the nuclear cusp problem. Journal of Molecular Structure: THEOCHEM 135, 339--356. doi:10.1016/0166-1280(86)80068-9.
- Lamberts et al. (2019) Lamberts, T., Markmeyer, M.N., Kolb, F.J., Kästner, J., 2019. Formation of Acetaldehyde on CO-Rich Ices. ACS Earth and Space Chemistry 3, 958--963. doi:10/gg3k62.
- Liszt et al. (2015) Liszt, H.S., Guzmán, V.V., Pety, J., Gerin, M., Neufeld, D.A., Gratier, P., 2015. Widespread galactic CF+ absorption: Detection toward W49 with the Plateau de Bure Interferometer. Astronomy & Astrophysics 579, A12. doi:10/gg3xpm.
- Molpeceres and Kästner (2020) Molpeceres, G., Kästner, J., 2020. Adsorption of H 2 on amorphous solid water studied with molecular dynamics simulations. Physical Chemistry Chemical Physics 22, 7552--7563. doi:10/ggsp9b.
- Muller et al. (2016) Muller, S., Kawaguchi, K., Black, J.H., Amano, T., 2016. Detection of extragalactic CF+ toward PKS 1830-211. Chemical differentiation in the absorbing gas. Astronomy and Astrophysics 589, L5. doi:10/f3r34r.
- Neufeld et al. (2005) Neufeld, D.A., Wolfire, M.G., Schilke, P., 2005. The Chemistry of Fluorine-bearing Molecules in Diffuse and Dense Interstellar Gas Clouds. The Astrophysical Journal 628, 260. doi:10/cd3f94.
- Noble et al. (2012) Noble, J.A., Congiu, E., Dulieu, F., Fraser, H.J., 2012. Thermal desorption characteristics of CO, O2 and CO2 on non-porous water, crystalline water and silicate surfaces at submonolayer and multilayer coverages. Monthly Notices of the Royal Astronomical Society 421, 768--779. doi:10/gg3xb8.
- Palumbo (2006) Palumbo, M.E., 2006. Formation of compact solid water after ion irradiation at 15 K. Astronomy & Astrophysics 453, 903--909. doi:10/b34tw4.
- Papajak et al. (2011) Papajak, E., Zheng, J., Xu, X., Leverentz, H.R., Truhlar, D.G., 2011. Perspectives on Basis Sets Beautiful: Seasonal Plantings of Diffuse Basis Functions. Journal of Chemical Theory and Computation 7, 3027--3034. doi:10/fshpw6.
- Parrish et al. (2017) Parrish, R.M., Burns, L.A., Smith, D.G.A., Simmonett, A.C., DePrince, A.E., Hohenstein, E.G., Bozkaya, U., Sokolov, A.Y., Di Remigio, R., Richard, R.M., Gonthier, J.F., James, A.M., McAlexander, H.R., Kumar, A., Saitow, M., Wang, X., Pritchard, B.P., Verma, P., Schaefer, H.F., Patkowski, K., King, R.A., Valeev, E.F., Evangelista, F.A., Turney, J.M., Crawford, T.D., Sherrill, C.D., 2017. Psi4 1.1: An Open-Source Electronic Structure Program Emphasizing Automation, Advanced Libraries, and Interoperability. Journal of Chemical Theory and Computation 13, 3185--3197. doi:10/gcz64j.
- Raghavachari et al. (1989) Raghavachari, K., Trucks, G.W., Pople, J.A., Head-Gordon, M., 1989. A fifth-order perturbation comparison of electron correlation theories. Chemical Physics Letters 157, 479--483. doi:10.1016/S0009-2614(89)87395-6.
- Rimola et al. (2018) Rimola, A., Skouteris, D., Balucani, N., Ceccarelli, C., Enrique-Romero, J., Taquet, V., Ugliengo, P., 2018. Can Formamide Be Formed on Interstellar Ice? An Atomistic Perspective. ACS Earth and Space Chemistry 2, 720--734. doi:10/gdzs9h.
- Rivera-Rivera et al. (2012) Rivera-Rivera, L.A., McElmurry, B.A., Lucchese, R.R., Bevan, J.W., 2012. Predicted properties of the CO–HF isomer using a six-dimensional morphed potential. Journal of Molecular Structure 1023, 43--48. doi:10/f39z58.
- Sewiło et al. (2019) Sewiło, M., Charnley, S.B., Schilke, P., Taquet, V., Oliveira, J.M., Shimonishi, T., Wirström, E., Indebetouw, R., Ward, J.L., van Loon, J.T., Wiseman, J., Zahorecz, S., Onishi, T., Kawamura, A., Chen, C.H.R., Fukui, Y., Hamedani Golshan, R., 2019. Complex Organic Molecules in Star-Forming Regions of the Magellanic Clouds. ACS Earth and Space Chemistry 3, 2088--2109. doi:10/gg3vdv.
- Shimonishi et al. (2018) Shimonishi, T., Nakatani, N., Furuya, K., Hama, T., 2018. Adsorption energies of carbon, nitrogen, and oxygen atoms on the low-temperature amorphous water ice: A systematic estimation from quantum chemistry calculations. The Astrophysical Journal 855, 27. doi:10.3847/1538-4357/aaaa6a, arXiv:1801.08716.
- Sil et al. (2017) Sil, M., Gorai, P., Das, A., Sahu, D., Chakrabarti, S., 2017. Adsorption energies of H and H2: A Quantum-Chemical Study. The European Physical Journal D 71, 45. doi:10/gg3w7q.
- Simons et al. (2020) Simons, M.A.J., Lamberts, T., Cuppen, H.M., 2020. Formation of COMs through CO hydrogenation on interstellar grains. Astronomy & Astrophysics 634, A52. doi:10/ggsr6r.
- Song and Kästner (2016) Song, L., Kästner, J., 2016. Formation of the prebiotic molecule NH2CHO on astronomical amorphous solid water surfaces: Accurate tunneling rate calculations. Physical Chemistry Chemical Physics 18, 29278--29285. doi:10/ggsr6k.
- Szalewicz et al. (2009) Szalewicz, K., Leforestier, C., van der Avoird, A., 2009. Towards the complete understanding of water by a first-principles computational approach. Chemical Physics Letters 482, 1--14. doi:10/fw5kpk.
- Titov et al. (2013) Titov, A.V., Ufimtsev, I.S., Luehr, N., Martinez, T.J., 2013. Generating Efficient Quantum Chemistry Codes for Novel Architectures. Journal of Chemical Theory and Computation 9, 213--221. doi:10/f4m53f.
- Ufimtsev and Martinez (2009) Ufimtsev, I.S., Martinez, T.J., 2009. Quantum Chemistry on Graphical Processing Units. 3. Analytical Energy Gradients, Geometry Optimization, and First Principles Molecular Dynamics. Journal of Chemical Theory and Computation 5, 2619--2628. doi:10/bf3qt3.
- van der Wiel et al. (2016) van der Wiel, M.H.D., Naylor, D.A., Makiwa, G., Satta, M., Abergel, A., 2016. Three-dimensional distribution of hydrogen fluoride gas toward NGC 6334 I and I(N). Astronomy & Astrophysics 593, A37. doi:10.1051/0004-6361/201628512.
- Wakelam et al. (2017) Wakelam, V., Loison, J.C., Mereau, R., Ruaud, M., 2017. Binding energies: New values and impact on the efficiency of chemical desorption. Molecular Astrophysics 6, 22--35. doi:10.1016/j.molap.2017.01.002, arXiv:1701.06492.
- Weigend and Ahlrichs (2005) Weigend, F., Ahlrichs, R., 2005. Balanced basis sets of split valence, triple zeta valence and quadruple zeta valence quality for H to Rn: Design and assessment of accuracy. Phys. Chem. Chem. Phys. 7. doi:10.1039/b508541a.
- Zamirri et al. (2019) Zamirri, L., Ugliengo, P., Ceccarelli, C., Rimola, A., 2019. Quantum Mechanical Investigations on the Formation of Complex Organic Molecules on Interstellar Ice Mantles. Review and Perspectives. ACS Earth and Space Chemistry 3, 1499--1523. doi:10/ggr367.
- Zhang and Yang (1998) Zhang, Y., Yang, W., 1998. Comment on ‘‘Generalized Gradient Approximation Made Simple’’. Physical Review Letters 80, 890--890. doi:10/ckvnv3.