Evidence for Periodic Accretion-Ejection in LS I +61∘303
Abstract
The stellar binary system LS I +61∘303, composed of a compact object in an eccentric orbit around a B0 Ve star, emits from radio up to -ray energies. The orbital modulation of radio spectral index, X-ray, and GeV -ray data suggests the presence of two peaks. This two-peaked profile is in line with the accretion theory predicting two accretion-ejection events for LS I +61∘303 along the 26.5 days orbit. However, the existing multiwavelength data are not simultaneous. In this paper we report the results of a campaign covering radio, X-ray, and -ray observations of the system along one single orbit. Our results confirm the two predicted events along the orbit and in addition show that the positions of radio and -ray peaks are coincident with X-ray dips as expected for radio and -ray emitting ejections depleting the X-ray emitting accretion flow. We discuss future observing strategies for a systematic study of the accretion-ejection physical processes in LS I +61∘303.
keywords:
Physical data and processes: accretion - Stars: jets - Stars: black holes - X-rays: binaries - X-rays: individual (LS I +61∘303 ) - Gamma-rays: stars1 Introduction
The stellar binary system LS I +61∘303 consists of a compact object in an eccentric orbit () around a B0 Ve star (Casares et al., 2005) with orbital period days (Gregory, 2002). It has been proposed that the compact object in the system could be a black hole (e.g., Punsly, 1999) or a neutron star (e.g., Maraschi & Treves, 1981). On the other hand, the correlation between the X-ray luminosity and the X-ray spectral slope in LS I +61∘303 agrees with that of black holes (Massi, Migliari & Chernyakova, 2017; Massi, 2017). Dubus (2006) investigated if, in analogy to the pulsar binary PSR B1259-63, the relativistic wind of a fast rotating young pulsar interacting with the Be wind could explain the radio emission in LS I +61∘303. However, the radio characteristics of the periodic () outburst in LS I +61∘303 are different from the simple optically thin outburst of PSR B1259-63 (Connors et al., 2002) but are consistent with a microquasar scenario, i.e., the scenario of accreting objects with associated jets established for several black holes. The outburst in LS I +61∘303 has in fact the same complex structure as outbursts of the microquasars XTE J1752-223 and Cygnus X-3 (Zimmermann, Fuhrmann & Massi, 2015): After a flat or inverted outburst (radio spectral index , i.e. same flux density for all frequencies or dominating at higher frequencies), there is an optically thin outburst (i.e. , low frequencies dominating the higher ones, Massi & Kaufman Bernadó 2009; Massi 2011).
Dubus (2006) analysed how the shocked material in the pulsar scenario expands all along the orbit, creating a radio nebula with a “comma shape” reminiscent of a one-sided jet. In particular, Dubus performed simulations for the system LS I +61∘303 and predicts, at a scale larger than the orbital size, that the nebula should look like a one-sided jet with very stable position angle, reflecting the projection of the major axis of the orbit. Same conclusions are given in Moldón, Ribó & Paredes (2012), modelling the flow of electrons accelerated in a pulsar wind/stellar wind interaction. They find that the orientation of the resulting structures, that extend to size scales much larger than the orbital size, depend in fact on the orbital inclination. Several VLBI observations of LS I +61∘303 are available, all of them with a beam larger than the orbital size. The VLBI images show a radio jet with fast variations: A MERLIN map of LS I +61∘303 shows a two-sided structure, with an S-shape as the precessing jet of SS433 (Hjellming & Johnston, 1988), one day later a second MERLIN map shows a significantly rotated one-sided structure (Massi, et al., 2004). Also VLBA observations show changes from one-sided to double-sided jet, compatible with variable Doppler boosting due to changes of the jet orientation with respect to the line of sight (Massi, Ros & Zimmermann, 2012). VLBA astrometry indicates that the variations are periodic: the jet core traces a closed path with a period of days (Wu et al., 2018). Simulations of the young pulsar model predict a stability in the orientation of the nebula contradicted by the obervations of LS I +61∘303, whereas the microquasar model explains the variations with a precessing jet (e.g., see Fig. 7 in Massi & Torricelli-Ciamponi, 2014). SS433 (Rasul et al., 2019) and LS I +61∘303 (Jaron & Massi, 2014; Jaron, Torricelli-Ciamponi & Massi, 2016; Jaron et al., 2018) are the two microquasars where jet precession can be traced up to the GeV band.
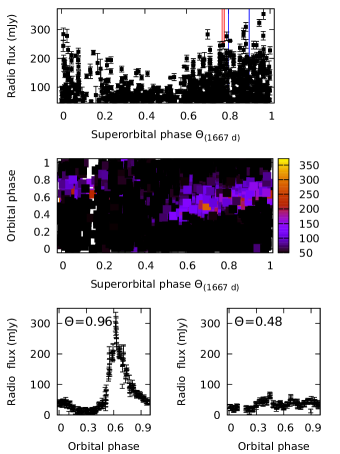
The two periodicities, and , are the two dominant spectral features in the radio power spectrum (37 yrs of observations see Massi & Torricelli-Ciamponi, 2016) whereas their beat frequencies and dominate the observed emission. Ray, et al. (1997) were the first to observe that the radio outbursts in LS I +61∘303 occur with a period of 26.7 days and not with the orbital one. The radio outburst periodicity is equal to (e.g., Jaron & Massi, 2013) which results in an orbital phase shift (center panel of Fig. 1) of the radio outburst when it is plotted versus the orbital phase (Massi & Jaron, 2013; Massi & Torricelli-Ciamponi, 2014). Moreover, the amplitude of the outburst changes periodically with a long-term periodic modulation days (Gregory, 2002) (top panel of Fig. 1) equal to (Massi & Jaron, 2013). In the precessing microquasar scenario the explanation of the beat between and is straightforward: The maximum of the long-term modulation is reproduced when the jet gets refilled along the orbit () when forming its minimum angle with respect to the line of sight, i.e., maximum Doppler boosting. Because of precession (), one orbital cycle () later the angle is slightly different and the Doppler boosting is reduced. Only after the system comes back to the conditions that give again maximum flux density during the radio outburst (e.g., Massi & Torricelli-Ciamponi, 2014).
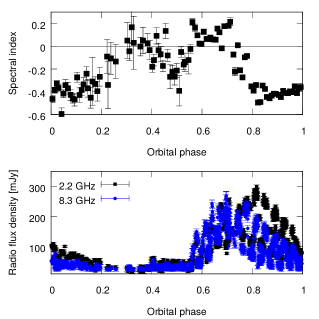
Massi & Kaufman Bernadó (2009) using 6.7 years of Green Bank Interferometer (GBI) radio data at two frequencies analysed the spectral index, function of the ratio of the two flux densities. They demonstrated that twice along the orbit, during the large outburst and closer to periastron when there is only a low radio emission level, the radio emission attains the same spectral characteristics, resulting in a double-peaked shape of the orbital modulation of the radio spectral index. Two peaks are also evident at high energy. The folded light curve of 5 years of Fermi-LAT data shows two peaks along the orbit (Jaron, Torricelli-Ciamponi & Massi, 2016). X-ray and -ray data covering the interval between the two blue lines in the upper panel of Fig. 1, i.e., seven orbital cycles, again hint for two peaks (Fig. 2), where the -ray peak at orbital phase 0.60.8 seems to be in the dip between the two X-ray peaks. Taylor et al. (1992) were the first to note that if the compact object in LS I +61∘303 is accreting, then the accretion rate might develop two peaks along the eccentric orbit. The accretion rate is given by
| (1) |
where is the density of the stratified wind of the B0 Ve star at the position of the accretor, and is the relative velocity between the wind and the orbiting accretor (Bondi, 1952). The accretion rate peaks around periastron, where the density is the highest. At high eccentricities, however, there exists a second accretion rate maximum along the orbit when the compact object is traveling slower and thus the decrease of its velocity relative to the wind particles compensates for the drop in the wind density. Flares at periastron and apastron, as observed in Circinus X-1, were explained in a similar way (Tudose et al., 2008). This hypothesis for LS I +61∘303 was further corroborated and modeled by other groups (Martí & Paredes, 1995; Bosch-Ramon et al., 2006). With an independent approach, Romero et al. (2007) using a Smoothed Particle Hydrodynamics code, found two peaks in the accretion rate of LS I +61∘303. Each peak in accretion rate should be followed by an ejection of particles forming a jet, radiating radio emission (via synchrotron process) and -rays (via inverse Compton, IC, process) (Bosch-Ramon et al., 2006; Jaron, Torricelli-Ciamponi & Massi, 2016). IC losses are stronger close to periastron, leading to the weaker radio emission, in agreement with the results of 5 years of OVRO radio monitoring (Jaron, Torricelli-Ciamponi & Massi, 2016). The second ejection occurs at a later orbital phase, when accretor and donor star are more displaced from each other. Under this condition relativistic electrons can propagate to a region out of the orbital plane and produce a large radio outburst (Bosch-Ramon et al., 2006; Jaron, Torricelli-Ciamponi & Massi, 2016). From the two-accretion peak model with IC losses the large radio outburst results to be associated with a synchrotron emitting jet one order of magnitude larger than the synchrotron emitting jet produced around periastron (Jaron, Torricelli-Ciamponi & Massi, 2016). Nevertheless, the radio spectral characteristics of the two jets are the same as proven by GBI observations (Massi & Kaufman Bernadó, 2009).
Thus existing data support the two-peak accretion model already. However, archival radio, X-ray, and -ray observations are not simultaneous and sparse sampling forces one to fold and average several orbital cycles together. Aimed to determine coincidence or possible offsets between different energy bands in the orbital occurrence of the two outbursts predicted in the accretion scenario, we performed a multiwavelength campaign along one orbit (see Table 1). The details of the campaign are given in Sect. 2, and in Sect. 3 we present our results. The conclusions are given in Sect. 4.
2 Data
2.1 Radio observations: 100-m Effelsberg radio telescope and OVRO
The observations with the 100-m radio telescope at Effelsberg were performed with the receivers at 11 cm, 6 cm, and 2.8 cm wavelength (S110, S60, S28). All three systems are located in the Gregorian focus of the telescope (see Table 2 for receiver properties). As LS I +61∘303 as well as the calibrators are point-like for the telescope, the measurements could be done as cross-scans in azimuth and elevation (with a various number of subscans) over the source positions. At 11 cm the scanning was done in the equatorial system to avoid confusion with nearby sources. For the data analysis, a Gaussian function was fitted to the antenna temperature measurement of each subscan (representing the convolution of the telescope beam with a delta function). The amplitudes of all subscans were corrected for the pointing deviation and averaged, resulting in a single antenna temperature per scan. Further corrections were applied for the atmospheric attenuation of the signal and for the gain-elevation effect (loss of sensitivity due to gravitational deformation of the antenna when being tilted). Finally, the conversion factor from antenna temperature into flux density (in Jy) was determined by the observations of NGC 7027, 3C 286, 3C 295 and 3C 48, 3C 286 and DR 21 (Baars et al., 1977), this factor was applied to all observations (on a day-by-day basis). Typical values for these corrections are given in Table 2. Typical rms deviations for calibrators are 2 and for LS I +61∘303 of 5.
| Start | Stop | Energy/Frequency | |
| [MJD] | [MJD] | ||
| 100-m Effelsberg | 57981.7 | 58008.7 | (2.64, 4.85, 10.45) GHz |
| radio telescope | |||
| OVRO | 57981.7 | 58008.7 | 15 GHz |
| Fermi-LAT | 57978.7 | 58005.2 | 0.1-300 GeV |
| Swift-XRT | 57918.5 | 58050.3 | 0.310 keV |
| XMM-Newton | 57984.0 | 57984.3 | 0.2-15 keV |
| NuSTAR | 57980.0 | 57980.6 | 3-78 keV |
| RX | 11 cm | 6 cm | 2.8 cm |
| center freq. | 2.675 GHz | 4.85 GHz | 10.45 GHz |
| bandwidth | 10 MHz | 500 MHz | 300 MHz |
| Tsys (zenith) | 29.3 | 25.8 | 28.9 |
| typical opacity | 0.01 | 0.015 | 0.022 |
| gain-loss∗ | 1.2 % | 1.5 % | 2.5 % |
| sensitivity | 1.5 K/Jy | 1.5 K/Jy | 1.35 K/Jy |
| ∗ due to gravitational deformation (elevation dependent) | |||
The Owens Valley Radio Observatory (OVRO) 40-Meter Telescope uses off-axis dual-beam optics and a cryogenic receiver with 2 GHz equivalent noise bandwidth centered at 15 GHz. Atmospheric and ground contributions, as well as gain fluctuations, are removed with the double switching technique (see references in Richards et al., 2011), where the observations are conducted in an ON-ON fashion so that one of the beams is always pointed onto the source. Until May 2014 the two beams were rapidly alternated using a Dicke switch. Since May 2014, when a new pseudo-correlation receiver replaced the old receiver, a 180 degree phase switch was used. Relative calibration is obtained with a temperature-stable noise diode to compensate for gain drifts. The primary flux density calibrator is 3C 286, with an assumed value of 3.44 Jy (Baars et al., 1977), DR 21 is used as secondary calibrator source with an assumed value of 19.04 Jy based on the first four years of OVRO monitoring. Details of the observation and data reduction schemes are given in Richards et al. (2011).
In order to compute the spectral index from the four radio light curves (three from Effelsberg, one from OVRO), we divided these data into one day time bins and performed an error-weighted least-squares fit of a straight line of the form: , to all of the data in --space within each time bin. We define the reference time for the spectral index value as the center of the time-bin. The uncertainties in result from formal error propagation. Figure 3 shows the radio data and the fitted spectrum for each time bin.

2.2 X-ray data: Swift-XRT, NuSTAR and XMM-Newton
Publicly available Swift-XRT data on LS I +61∘303 have been taken between MJD 57918 and MJD 58050. The data were reprocessed with xrtpipeline v.0.13.4 as suggested by the Swift-XRT team111See e.g., Swift-XRT User’s Guide https://swift.gsfc.nasa.gov/analysis/xrtswguidev12.pdf. Spectra were extracted with xselect from a -radius circle around LS I +61∘303 for source counts and an annulus also centered at the source position with inner (outer) radii of () for background counts. The analysis of the TOO XMM-Newton observation of LS I +61∘303 (taken on July 19, 2017) was performed with the XMM-Newton Science Analysis software 222https://www.cosmos.esa.int/web/xmm-newton/what-is-sas v.15.0.0. Known hot pixels and electronic noise were removed, and data were filtered to exclude soft proton flares episodes. The total exposure is ksec. The spectrum and lightcurve (100 sec time bins) were extracted from a radius circle centered at the position of LS I +61∘303 and the background was extracted from a nearby source-free region of radius. The RMFs and ARFs were extracted using the RMFGEN and ARFGEN tools, respectively. NuSTAR TOO observation was performed on LS I +61∘303, on July, 14th, 2017. The raw data were processed with standard pipeline processing (HEASOFT v.6.22 with the NuSTAR subpackage v.1.8.0). We applied strict criteria for the exclusion of data taken in the South Atlantic Anomaly (SAA) and in the “tentacle”-like region of higher background activity near part of the SAA. Level-two data products were produced with the nupipeline tool with the flags SAAMODE=STRICT and TENTACLE=yes. The lightcurves (100 sec time bins) were extracted for a point source with the nuproducts routine. The corresponding background flux was derived from a ring-like (inner/outer radii of /) region surrounding the source. The analysis was performed in the energy range of keV.
We model the data with an absorbed power law model (phabs*po Xspec model) with a free hydrogen column density (), slope and model normalization. This model describes all considered data sets well, with the reduced . Similar to Chernyakova et al. (2017) we did not find any clear dependence on the orbital phase. We also performed the search for an additional black body component in high-statistic XMM-Newton TOO observation. We did not find any firm evidence for this component, although please note that the best-fit with black body temperature of keV formally improves the fit by , which corresponds to detection significance.
We performed three fits of the X-ray light curve: a fit with a constant, a constant plus one Gaussian, and two Gaussians, that result in a reduced of 8.0, 6.1 and 4.2 respectively. To decide whether the model 3 fits the data better than the other models, the difference- test was performed between models 1 and 3, and between models 2 and 3. In both cases we found a less than 10-5, where the difference is significant for . The model with the two Gaussians (Table 3 and red line in Fig. 5 A) is:
| (2) |
As discussed in Sect. 4 (items 17) a physical model of X-ray emission should take into account the two-peak accretion model, viscousity timescales, the accretion flow emission and likely a weak jet emission. This will be done in future investigations.
2.3 Fermi-LAT -ray data
For the GeV data analysis we use Pass 8 Fermi-LAT photon data downloaded from the Fermi-LAT data server333https://fermi.gsfc.nasa.gov/ssc/data/access/. We analyze the data using version v11r5p3 of the Fermi ScienceTools444https://fermi.gsfc.nasa.gov/ssc/data/analysis/software/. We include all photon data from 10∘ around the position of LS I +61∘303. We fit LS I +61∘303 with a log-parabola of the form: , with normalization factor , , and left free for the fit, and the scale parameter fixed to its catalog value. All parameters of sources from the 3FGL catalog within around LS I +61∘303 were left free for the fit as well. Sources between and were included in the analysis with their parameters fixed to their catalog values. In order to limit contamination from Earth limb photons we excluded time epochs when the target source was observed at a zenith angle greater than . The Galactic diffuse emission was modeled with gll_iem_v06.fits and the template iso_P8R2_SOURCE_V6_v06.txt. We divide the time interval of Table 1 into 12 hours time bins, and perform an unbinned likelihood analysis 555https://fermi.gsfc.nasa.gov/ssc/data/analysis/scitools/likelihood_tutorial.html in each one of these time bins.
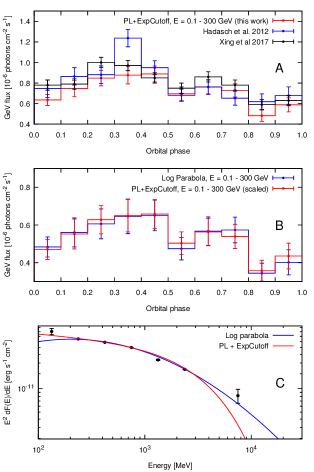
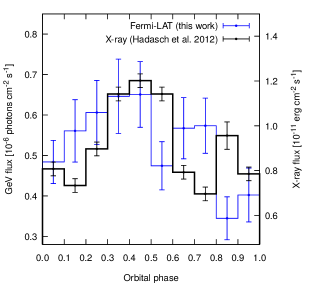
We compared our results with ones that were previously published by Hadasch et al. (2012) and Xing, Wang & Takata (2017). Figure 4 A shows three curves obtained by us, Hadasch et al. (2012), and Xing, Wang & Takata (2017), all three using the same data set (MJD 54683-54863) and model (power law with exponential cutoff). As one can see, in the orbital phase bin 0.3-0.4, the value of Fig. 11 in Hadasch et al. (2012) is at about 2 displaced from the values of the other two curves (ours and from Xing, Wang & Takata, 2017), otherwise the three curves all agree within the errors. Since 2012 the recommended model for LS I +61∘303 in the Fermi-LAT catalog is the log-parabola 666Table 4 in https://fermi.gsfc.nasa.gov/ssc/data/access/lat/4yr_catalog/. We therefore checked whether two different models give rise to significant differences, and found that the resulting orbital lightcurves have the same shape, but differ by a factor 1.35, see Fig. 4 B. The PL plus exponential cut-off better describes data around 100 MeV, as shown in the Fig. 4 C. The global fit is however better for the Log parabola model (with of 18 with respect to that of 21 for the PL+ExpCutoff).
| Parameter | Value |
|---|---|
| Orbital phase | Orbital phase | |
| First event (I) | Second event (II) | |
| X-ray dip | 0.5-0.7 | 0.0-0.2 |
| -ray onset | 0.5-0.6 | 0.0-0.15 |
| radio onset | 0.5-0.7 | 0.15 |
| 0 | 0.5-0.55 | 0.2 |
3 RESULTS
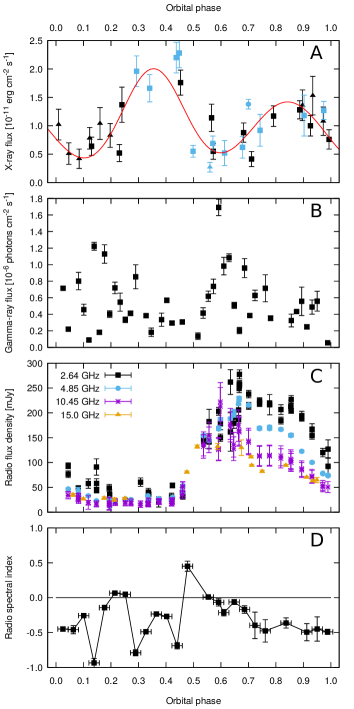
In Fig. 5 we present radio, X-ray and -ray results. Figure 5 A shows two X-ray peaks. One X-ray peak is at with a dip at . The X-ray emission rises again, peaks at and drops again at . The X-ray data of Fig. 5 A confirm the prediction of the accretion theory in LS I +61∘303 (Taylor et al., 1992; Martí & Paredes, 1995; Bosch-Ramon et al., 2006; Romero et al., 2007). In fact the accretion flow emits in X-ray (e.g., Yang et al., 2015, 2015b), therefore the predicted increase in the accretion rate implies an increase in the X-ray emission twice along the orbit.
Figure 5 B shows two -ray peaks rising above a scattered level of about photons cm-2 s-1. This is not the first observation of two -ray peaks along the orbit of LS I +61∘303. In the folded curve of 5 yr of -ray data (left panel of Fig. 7 in Jaron, Torricelli-Ciamponi & Massi, 2016) two peaks arise above an offset of cm-2 s-1. The two peaks were modeled with two ejections of particles emitting -ray emission due to IC process (Jaron, Torricelli-Ciamponi & Massi, 2016) and the offset explained as a contribution from the accretion flow population (see Sect. 5 in Jaron, Torricelli-Ciamponi & Massi, 2016). The new information coming from Fig. 5 B is about the misalignment between the -ray peaks associated to the ejection of particles with respect to the X-ray peaks. As summarized in Table 4, it is during the X-ray dip at that occurs the -ray onset, and it is during the X-ray dip at that occurs the -ray onset, . The result of the campaign of -ray peaks during the X-ray dips, probes and gives a better understanding of the misalignment suggested from archived data folding and averaging all together seven orbital cycles affected by different Doppler boosting effects (Sect. 1). One can compare these results of archived data – taken 9 years before our campaign – with our present results. The curve in Fig. 2 hints for two X-ray peaks and two -ray peaks, these two emerging from an offset of photons cm-2 s-1. The first X-ray peak in Fig. 2 occurs at (campaign peak at ), with the associated -ray peak at (campaign peak at ). The second X-ray peak occurs at (campaign peak at ), with the associated -ray peak at (campaign peak at ).
Figure 5 C shows a large radio outburst with onset (Table 4) during the X-ray dip at . As discussed in Sect. 1 the accretion theory for LS I +61∘303 predicts that the two peaks in the accretion rate are followed by ejections of electrons experiencing strong energetic losses when ejected close to periastron passage, because of IC interactions with UV stellar photons. As a result there is only one large radio outburst, associated to the ejection more displaced from periastron (e.g., Jaron, Torricelli-Ciamponi & Massi, 2016). The new result of our Fig. 5 is the discovery that the onset of the radio outburst, as that of the associated -ray peak, occurs in the dip of the X-ray emission.
The result of Jaron, Torricelli-Ciamponi & Massi (2016) is that electrons ejected closer to periastron, because of their strong energetic losses, produce a short radio jet, i.e., more than one order of magnitude shorter than that produced in the second ejection, more displaced from the B0 star, and responsible for the large radio outburst. Different in their flux density, still the two jets present both the typical spectral characteristics of jets in microquasars of a flattish or inverted spectrum. In Fig. 6 we show 5 cycles of LS I +61∘303 GBI data folded with the orbital phase. The spectral index changes from negative to positive at the onset of the large outburst and also around orbital phase 0.3, even if there only low emission is present. The campaign allows us to analyse for the first time the radio spectral index along one complete orbit at three to four radio frequencies instead of the two frequencies used in the GBI observations. The multiwavelength radio spectra show indeed that the radio spectral index becomes at and .
In microquasars after the flat spectrum phase a shock-related transient, giving an optically thin outburst (Sect. 1), might develop. Figure 5 D shows that the self-absorbed jet, i.e., , clearly persists until , after that the radio spectral index oscillates and stabilizes to for an optically thin outburst. Figure 7 compares the campaign with other two epochs: in the campaign (top panel of Fig. 7) the optically thin outburst forms just a bump during the decay of the radio light curve, in Figs 7 B and C the onset of the optically thin outburst, and likely onset of the shock, is at a later phase during the decay of the flat-inverted spectrum outburst. A systematic study of the system LS I +61∘303 will bring a deeper understanding of the physical conditions triggering the transient.
4 CONCLUSIONS AND DISCUSSION
Theory predicts two events of accretionejection along the orbit of LS I +61∘303. From archival data, showing the two predicted events, one can only draw broad conclusions because the observations at the various energy bands are not simultaneous. We performed a multiwavelength campaign to establish their relative orbital occurrence. Our results are:
-
1.
X-ray emission rises twice along the orbit, as predicted by the model. After reaching the maximum the emission drops and two dips are noticeable along the orbit.
-
2.
It is during the two X-ray dips that -ray emission increases.
-
3.
The radio spectral index becomes greater or equal to zero twice along the orbit, revealing that a self-absorbed jet is generated twice. The large radio outburst is displaced from periastron passage and happens during the X-ray dip.
X-ray dips associated to radio emission peaks were observed in the stellar mass black hole system GRS 1915+105 (Mirabel & Rodríguez, 1999; Klein-Wolt et al., 2002) and explained (Klein-Wolt et al., 2002, and references therein) as disappearance of matter from the accretion flow (the X-ray dip), part of it passing through the event horizon and part of it ejected into a radio emitting jet (the radio peak). Marscher, et al. (2002) interprete in a similar way four radio ejections appearing after four X-ray dips in the AGN 3C 120, i.e., as observational evidence for their accretion-disk origin. It is worth of note that in our multiwavelength campaign, we also see a -ray peak together with the radio peak.
Although jets are ubiquitous in the Universe,
common to a number of different accreting systems, the mechanism of jet production
and the details of the accretion-ejection processes are still poorly constrained.
LS I +61∘303 could become the laboratory
for understanding
the accretion-ejection coupling:
periodic, detected at all wavelengths from the radio band to very high-energy -rays
and
a jet well traceable
with radio interferometers.
Several investigations will be possible:
1. By means of X-ray observations of LS I +61∘303, it becomes
possible for the theoretical models to include and estimate viscous timescales.
The accretion models, based on Eq. 1, predict the accretion peaks only.
From the delay between predicted peaks in accretion rate and X-ray peaks from the accretion flow,
a quantitative analysis of the viscous processes will be possible.
2. By studing the relationship between
X-ray dip and
radio onset
in LS I +61∘303 it will be possible to study the coupling between accretion and ejection.
3. Optical depth effects along the jet, as done in Cygnus X-1 (Tetarenko et al., 2019),
can be well analysed in the flat-inverted phase of the outburst.
4. A better understanding of shock propagation along the jet will
be possible analysing the delays between self-absorbed jet and transient jet.
5. The possible relationship between transient jet and emission at very high energy can be studied.
In fact TeV emission is thought to be produced by shocks (e.g., Williamson, 2019)
and in microquasars shocks are associated with the transient jet
(Fender, Belloni & Gallo, 2004).
It is therefore during a transient jet that TeV emission could be expected.
The system Cygnus X-1,
which with a jet angle of 27 degrees
(Orosz et al., 2011) and jet velocity (Tetarenko et al., 2019) corresponds to a Doppler boosting
of about 5,
shows mostly the self-absorbed radio jet (Stirling et al., 2001).
Indeed, in a set of several MERLIN observations Fender et al. (2006) were able at only one epoch to pick
up the system during a transient. Worth of note, in Cygnus X-1 TeV emission was detected (4.0 ) (Albert et al., 2007)
coinciding with a flare seen by RXTE, Swift, and INTEGRAL.
The system LS I +61∘303 shows several episodes of a transient jet (e.g., Massi, 2014)
and emission at TeV energies were in fact detected several times in LS I +61∘303 (Archambault et al., 2016, and references therein).
The systems Cyg X-1 and LS I +61∘303 are both high mass X-ray binaries (HMXBs),
suggesting that the stellar wind and/or the radiation field of the companion star play an important
role, along with transient jet and Doppler boosting, in producing the TeV high-energy photons. In leptonic
models these photons may be produced by inverse Compton scattering of
the UV stellar radiation or wind X-ray emission off the electrons of the transient jet, whereas in hadronic
models -rays may be produced by the decay of neutral pions associated to
the interactions of relativistic protons in the jets with protons of the
stellar wind (Romero, et al., 2017, and references therein).
6. The HMXB LSI +61 303 is radio overluminous compared to what is seen in typical black hole LMXBs in their hard states (when the radio spectra are flat) in the same luminosity range.
The X-ray luminosity of LS I +61∘303,
erg/sec (Massi, Migliari & Chernyakova, 2017),
is nearly at the boundary between the low/hard X-ray state and
the quiescent state.
The quiescent state,
where, e.g., is located the only other known microquasar accreting from a Be star, MWC 656 (Dzib, Massi & Jaron, 2015),
starts in fact at about (McClintock & Remillard, 2006).
The models of the low/hard state give a geometrically thin,
optically thick accretion disk truncated at (McClintock & Remillard, 2006).
Observed oscillations at 2 Hz by Ray & Hartman (2008) imply in LS I +61∘303 a larger truncated value,
(Massi & Zimmermann, 2010) in agreement with the low luminosity.
Close to the quiescent state, the emission from the electrons of the
accretion flow drops to low values and
an open issue is if jet electrons contribute to the X-ray emission
(Yang et al., 2015; Plotkin et al., 2017).
The favourable case of LS I +61∘303 is that this jet component can be in fact observed, as discussed in Sect. 1,
either with the direct detection in the
timing analysis of the precession period of the jet or by
observing related phenomena as the orbital shift and the long-term modulation.
Indeed,
the long-term modulation of the X-ray emission was observed (Chernyakova et al., 2012)
and the precession period detected by timing analysis of X-ray observations (D’Aì et al., 2016).
Planning future observations one has to take into account that from the accretion theory the sequence of accretion-ejection along the orbit of LS I +61∘303 is a periodic feature, but on the other hand, in the observer frame the variable Doppler boosting induced by jet precession changes the observed emission (Massi & Torricelli-Ciamponi, 2014). Observations show that the precession brings the jet close to the line of sight (bottom panel of Fig. 10 in Wu et al., 2018), inducing maximum Doppler boosting of the emission (Massi & Torricelli-Ciamponi, 2014). The result of beating between precession and periodic ejection (e.g., Fig. 4 in Massi & Torricelli-Ciamponi, 2014) is that the radio peak does not only change its amplitude along the 1667 d period but also shifts in orbital phase (center panel of Fig. 1). As shown in the bottom panel of Fig. 1, around the minimum of the 1667 d modulation there is only low broad radio emission formed by several small peaks. Therefore, future observations focused to the study of the accretion-ejection coupling should avoid the minimum of this long-term modulation and observe towards the maximum, as we did in our campaign.
Acknowledgements
FJ thanks Walter Alef and Helge Rottmann for providing computer power at the MPIfR high performance computer cluster. We thank Eduardo Ros for reading the manuscript and providing helpful comments. This research has made use of observations with the 100-m telescope of the MPIfR (Max-Planck-Institut für Radioastronomie) at Effelsberg, Fermi-LAT data obtained from the High Energy Astrophysics Science Archive Research Center (HEASARC), provided by National Aeronautics and Space Administration (NASA) Goddard Space Flight Center, XMM-Newton data, an ESA science mission with instruments and contributions directly funded by ESA Member States and NASA, OVRO 40-m monitoring program supported in part by NASA grants NNX08AW31G, NNX11A043G, and NNX14AQ89G and NSF grants AST-0808050 and AST-1109911. The authors acknowledge support by the state of Baden-Württemberg through bwHPC. This work was supported in part by DFG through the grant MA 7807/2-1.
Data availability
The data underlying this article will be shared on reasonable request to the
corresponding author.
References
- Albert et al. (2007) Albert J., et al., 2007, ApJL, 665, L51
- Archambault et al. (2016) Archambault S., et al., 2016, ApJL, 817, L7
- Baars et al. (1977) Baars J. W. M., Genzel R., Pauliny-Toth I. I. K., Witzel A., 1977, A&A, 500, 135
- Bondi (1952) Bondi,H., 1952,MNRAS,112,195
- Bosch-Ramon et al. (2006) Bosch-Ramon V., Paredes J. M., Romero G. E., Ribó M., 2006, A&A, 459, L25
- Casares et al. (2005) Casares J., Ribas I., Paredes J. M., Martí J., Allende Prieto C., 2005, MNRAS, 360, 1105
- Chernyakova et al. (2012) Chernyakova, M., Neronov, A., Molkov, S., Malyshev, D., Lutovinov, A., Pooley, G., 2012, ApJ 747, L29.
- Chernyakova et al. (2017) Chernyakova, M., Babyk, I., Malyshev, D., et al. 2017, MNRAS, 470, 1718
- Connors et al. (2002) Connors, T. W., Johnston, S., Manchester, R. N., & McConnell, D. 2002, MNRAS, 336, 1201
- D’Aì et al. (2016) D’Aì A., Cusumano G., La Parola V., Segreto A., Mineo T., 2016, MNRAS, 456, 1955
- Dubus (2006) Dubus, G. 2006, A&A, 456, 801
- Fender (2001) Fender R. P., 2001, MNRAS, 322, 31
- Fender, Belloni & Gallo (2004) Fender R. P., Belloni T. M., Gallo E., 2004, MNRAS, 355, 1105
- Fender et al. (2006) Fender R. P., Stirling A. M., Spencer R. E., Brown I., Pooley G. G., Muxlow T. W. B., Miller-Jones J. C. A., 2006, MNRAS, 369, 603
- Gregory (2002) Gregory P.C., 2002, ApJ, 575, 427
- Hadasch et al. (2012) Hadasch D., et al., 2012, ApJ, 749, 54
- Hjellming & Johnston (1988) Hjellming R. M., Johnston K. J., 1988, ApJ, 328, 600
- Jaron & Massi (2013) Jaron F., Massi M., 2013, A&A, 559, A129
- Jaron & Massi (2014) Jaron F., Massi M., 2014, A&A, 572, A105
- Jaron, Torricelli-Ciamponi & Massi (2016) Jaron F., Torricelli-Ciamponi G., Massi M., 2016, A&A, 595, A92
- Jaron et al. (2018) Jaron F., Massi M., Kiehlmann S., Hovatta T., 2018, MNRAS, 478, 440 Kaufman Bernadó M. M., Romero G. E., Mirabel I. F., 2002, A&A, 385, L10
- Klein-Wolt et al. (2002) Klein-Wolt M., Fender R. P., Pooley G. G., Belloni T., Migliari S., Morgan E. H., van der Klis M., 2002, MNRAS, 331, 745
- Lasota (2001) Lasota J.-P., 2001, NewAR, 45, 449
- McClintock & Remillard (2006) McClintock, J. E., & Remillard, R. A. 2006, Compact stellar X-ray sources, Cambridge University Press
- Maraschi & Treves (1981) Maraschi L., Treves A., 1981, MNRAS, 194, 1P
- Marscher, et al. (2002) Marscher A. P., Jorstad S. G., Gómez J.-L., Aller M. F., Teräsranta H., Lister M. L., Stirling A. M., 2002, Natur, 417, 625
- Martí & Paredes (1995) Martí J., Paredes J. M., 1995, A&A, 298, 151
- Massi, et al. (2004) Massi M., Ribó M., Paredes J. M., Garrington S. T., Peracaula M., Martí J., 2004, A&A, 414, L1
- Massi & Kaufman Bernadó (2009) Massi M., Kaufman Bernadó M., 2009, ApJ, 702, 1179
- Massi & Zimmermann (2010) Massi M., Zimmermann L., 2010, A&A, 515, A82
- Massi (2011) Massi M., 2011, MmSAI, 82, 24
- Massi, Ros & Zimmermann (2012) Massi M., Ros E., Zimmermann L., 2012, A&A, 540, A142
- Massi & Jaron (2013) Massi M., Jaron F., 2013, A&A, 554, A105
- Massi (2014) Massi M., 2014, evn..conf, 62
- Massi & Torricelli-Ciamponi (2014) Massi M., Torricelli-Ciamponi G., 2014, A&A, 564, A23
- Massi & Torricelli-Ciamponi (2016) Massi M., Torricelli-Ciamponi G., 2016, A&A, 585, A123
- Massi (2017) Massi 2017, presentation at "Variable Galactic Gamma-Ray Sources (IV)", Rikkyo University, Tokyo, July 4-7 2017.
- Massi, Migliari & Chernyakova (2017) Massi M., Migliari S., Chernyakova M., 2017, MNRAS, 468, 3689
- Mendelson & Mazeh (1989) Mendelson, H. & Mazeh, T. 1989, MNRAS, 239, 733
- Mirabel & Rodríguez (1999) Mirabel I. F., Rodríguez L. F., 1999, ARA&A, 37, 409
- Moldón, Ribó & Paredes (2012) Moldón J., Ribó M., Paredes J. M., 2012, A&A, 548, A103
- Nösel, et al. (2018) Nösel S., Sharma R., Massi M., Cimò G., Chernyakova M., 2018, MNRAS, 476, 2516
- Oskinova, Ignace & Huenemoerder (2017) Oskinova L. M., Ignace R., Huenemoerder D. P., 2017, IAUS, 329, 151, IAUS..329
- Orosz et al. (2011) Orosz J. A., McClintock J. E., Aufdenberg J. P., Remillard R. A., Reid M. J., Narayan R., Gou L., 2011, ApJ, 742, 84
- Paredes-Fortuny et al. (2015) Paredes-Fortuny, X., Bosch-Ramon, V., Perucho, M., & Ribo, M. 2015, A&A,1808574, A77
- Plotkin et al. (2017) Plotkin, R. M., Miller-Jones, J. C. A., Gallo, E., et al. 2017, Apj, 834, 104
- Punsly (1999) Punsly, B. 1999, ApJ, 519, 336
- Rasul et al. (2019) Rasul K., Chadwick P. M., Graham J. A., Brown A. M., 2019, MNRAS, 485, 2970
- Ray & Hartman (2008) Ray P. S., Hartman J. M., 2008, ATel, 1730, 1
- Ray, et al. (1997) Ray P. S., Foster R. S., Waltman E. B., Tavani M., Ghigo F. D., 1997, ApJ, 491, 381
- Ribó, et al. (2017) Ribó M., et al., 2017, ApJL, 835, L33
- Richards et al. (2011) Richards J. L., et al., 2011, ApJS, 194, 29
- Romero, et al. (2017) Romero G. E., Boettcher M., Markoff S., Tavecchio F., 2017, SSRv, 207, 5
- Romero et al. (2007) Romero G. E., Okazaki A. T., Orellana M., Owocki S. P., 2007, A&A, 474, 15
- Seaquist, et al. (1982) Seaquist E. R., Gilmore W. S., Johnston K. J., Grindlay J. E., 1982, ApJ, 260, 220
- Stadtler (2018) Stadtler S., 2018, Master thesis, Univ. Bonn, Germany
- Stirling et al. (2001) Stirling A. M., Spencer R. E., de la Force C. J., Garrett M. A., Fender R. P., Ogley R. N., 2001, MNRAS, 327, 1273
- Dzib, Massi & Jaron (2015) Dzib S. A., Massi M., Jaron F., 2015, A&A, 580, L6
- Taylor et al. (1992) Taylor A. R., Kenny H. T., Spencer R. E., Tzioumis A., 1992, ApJ, 395, 268
- Tetarenko et al. (2019) Tetarenko A. J., Casella P., Miller-Jones J. C. A., et al. 2019, MNRAS, 484, 2987
- Tudose et al. (2008) Tudose V., Fender R. P., Tzioumis A. K., Spencer R. E., van der Klis M., 2008, MNRAS, 390, 447
- Williamson (2019) Williamson T., 2019, ICRC, 824, ICRC36
- Wu et al. (2018) Wu Y. W., Torricelli-Ciamponi G., Massi M., Reid M. J., Zhang B., Shao L., Zheng X. W., 2018, MNRAS, 474, 4245
- Xing, Wang & Takata (2017) Xing Y., Wang Z., Takata J., 2017, ApJ, 851, 92
- Yang et al. (2015) Yang, Q.-X., Xie, F.-G., Yuan, F., et al. 2015, MNRAS, 447, 1692
- Yang et al. (2015b) Yang, Q.-X., Xie, F.-G., Yuan, F., et al. 2015, Publication of Korean Astronomical Society, 30, 565
- Zimmermann, Fuhrmann & Massi (2015) Zimmermann L., Fuhrmann L., Massi M., 2015, A&A, 580, L2