Isoscalar monopole and dipole transitions in 24Mg, 26Mg and 28Si
Abstract
- Background
-
Nuclei in the -shell demonstrate a remarkable interplay of cluster and mean-field phenomena. The nuclei, such as 24Mg and 28Si, have been the focus of the theoretical study of both phenomena in the past. A variety of different cluster structures in these nuclei are predicted, characterized by isoscalar dipole and monopole transitions. For example, low-energy isoscalar vortical dipole states were predicted in 24Mg.
The cluster and vortical mean-field phenomena can be probed by excitation of isoscalar monopole and dipole states in scattering of isoscalar particles such as deuterons or particles.
- Purpose
-
To investigate, both experimentally and theoretically, the isoscalar dipole and monopole strengths in three essentially different light nuclei with different properties: stiff prolate 24Mg, soft prolate 26Mg and soft oblate 28Si. To analyze possible manifestations of clustering and vorticity in these nuclei.
- Methods
-
Inelastically scattered particles were momentum-analysed in the K600 magnetic spectrometer at iThemba LABS, Cape Town, South Africa. The scattered particles were detected in two multi-wire drift chambers and two plastic scintillators placed at the focal plane of the K600. In the heoretical discussion, the Skyrme Quasiparticle Random-Phase Approximation (QRPA) and Antisymmetrized Molecular Dynamics + Generator Coordinate Method (AMD+GCM) were used.
- Results
-
A number of isoscalar monopole and dipole transitions were observed in the nuclei studied. Using this information, suggested structural assignments have been made for the various excited states. and strengths obtained within QRPA and AMD+GCM are compared with the experimental data. The QRPAcalculations lead us to conclude that: i) the mean-field vorticity appears mainly in dipole states with , ii) the dipole (monopole) states should have strong deformation-induced octupole (quadrupole) admixtures, and iii) that near the -particle threshold there should exist a collective state with for prolate nuclei and for oblate nuclei) with an impressive octupole strength. The results of the AMD+GCM calculations suggest that some observed states may have a mixed (mean-field + cluster) character or correspond to particular cluster configurations.
- Conclusion
-
A tentative correspondence between observed states and theoretical states from QRPA and AMD+GCM was established. The QRPA and AMD+GCM analysis shows that low-energy isoscalar dipole states combine cluster and mean-field properties. The QRPAcalculations show that the low-energy vorticity is well localized in 24Mg, fragmented in 26Mg, and absent in 28Si.
I Background
Light nuclei demonstrate a remarkable interplay of cluster and mean-field degrees of freedom, see e.g. the reviews of Refs. [von Oertzen] et al. (2006); Horiuchi et al. (2012a); Hornberger et al. (2012); Kanada-En’yo and Horiuchi (2018). The exploration of this interplay is a demanding problem which is additionally complicated by the softness of these nuclei and related shape coexistence Kanada-En’yo and Horiuchi (2018). The low-energy isoscalar monopole () and dipole () states in light nuclei can serve as fingerprints of clustering Chiba and Kimura (2015); Chiba et al. (2017) one of the basic features of light nuclei. states can also deliver important information on some mean-field features, such as vorticity Nesterenko et al. (2018); Nesterenko, Valentin et al. (2018); Nesterenko et al. (2019); Kanada-En’yo and Shikata (2017); Shikata et al. (2019); Kanada-En’yo et al. (2018); Kanada-En’yo and Shikata (2019); Chiba et al. (2019). Note that vortical currents do not contribute to the continuity equation and this flow represents an important (and, as yet, poorly explored) form of nuclear dynamics beyond the familiar irrotational motion, see the discussion in Refs. Kvasil et al. (2011); Reinhard et al. (2014). Since dipole vortical excitations are mainly located near the particle-emission thresholds they can affect reactions rates of importance to nucleosynthesis. The exploration of low-energy and transitions in light nuclei can significantly improve our knowledge of cluster and vortical features of low-energy nuclear states.
Clustering in light nuclei can manifest itself in low-lying transitions to states Kawabata et al. (2007); Chiba et al. (2017); Adsley et al. (2017a). Recent theoretical work has suggested that excitations may also be used to explore cluster configurations, i.e. the low-lying states caused by asymmetric clusters may have partner states, thus forming inversion doublets which indicate the symmetry of the cluster configuration Chiba et al. (2017). In nuclei, the asymmetric clustering may result in enhanced electric dipole transitions between isoscalar states.
In addition to this clustering behaviour, mean-field structures may also exist. Individual low-lying vortical states were predicted within the Quasiparticle Random-Phase-Approximation (QRPA) Nesterenko et al. (2018); Nesterenko, Valentin et al. (2018); Nesterenko et al. (2019) and the Antisymmetrized Molecular Dynamics + Generator Coordinate Method (AMD+GCM) Kanada-En’yo and Shikata (2017); Shikata et al. (2019); Kanada-En’yo et al. (2018); Kanada-En’yo and Shikata (2019); Chiba et al. (2019). These states should exist in 10Be Kanada-En’yo and Shikata (2017); Shikata et al. (2019), 12C Kanada-En’yo et al. (2018), 16O Kanada-En’yo and Shikata (2019), 20Ne Nesterenko, Valentin et al. (2018), and 24Mg Nesterenko et al. (2018); Nesterenko, Valentin et al. (2018); Nesterenko et al. (2019); Chiba et al. (2019).
Such individual low-lying vortical states can be differentiated from the neighbouring excitations and so much more easily resolved in experiment. Note that the intrinsic electric vortical flow of nucleons, though widely discussed in recent decades, is still very poorly understood Semenko (1981); Kvasil et al. (2011); Repko et al. (2013); Reinhard et al. (2014); Nesterenko et al. (2016); Repko, A. et al. (2019). The experimental observation and identification of vortical states remains a challenge for the modern experimentalist Nesterenko et al. (2019). In this respect, exploration of individual low-lying vortical states in light nuclei could be used as a promising guide in the experimental design. The () reaction has been recently suggested as a possible method of probing the vortical response of nuclei Nesterenko et al. (2019). The complementary reaction may be used to locate candidates for the vortical states for these () measurements.
The light nuclei 24Mg, 26Mg, and 28Si have essentially different properties and thus represent a useful set for the comparative investigation of the interplay between the mean-field and cluster degrees of freedom. These nuclei differ by ratio, softness to deformation (stiff 24Mg and soft 28Si and 26Mg), and sign of deformation (prolate 24Mg and oblate 28Si). Therefore, it is interesting to compare the origin and behavior of low-lying and strengths in these nuclei, from the perspectives of clustering and vorticity. Many investigations have been performed for each of these nuclei separately (see e.g. Refs. Kawabata et al. (2007); Harakeh and Woude (2001); Garg and Colò (2018) for a general view and Refs. Gupta et al. (2016); Youngblood et al. (1999); Van Der Borg et al. (1979); Bertrand et al. (1978); Gupta et al. (2015); Lu et al. (1986); Soga et al. (1978); Morsch et al. (1975); Kamermans et al. (1979); Morsch and Ellis (1976) (24Mg), Adsley et al. (2018); Longland et al. (2012, 2009); Schwengner et al. (2009); Adsley et al. (2017b); Talwar et al. (2016); Bertrand et al. (1978); Wühr et al. (1974) (26Mg), Adsley et al. (2017b); Van der Borg et al. (1977); Toba et al. (1990); Youngblood et al. (1998); Wühr et al. (1974); Youngblood et al. (2002); Roy et al. (1992); Morsch et al. (1975); Kamermans et al. (1979); Morsch (1976); Morsch and Ellis (1976) (28Si) for particular studies). We now provide comparative experimental and theoretical analyses of these nuclei.
In this paper, we report and strengths in 24Mg, 26Mg and 28Si, determined from -particle inelastic scattering at very forward scattering angles (including zero degrees). The data were obtained with the K600 magnetic spectrometer at iThemba LABS (Cape Town, South Africa). The data are limited to excitation energy MeV so as to avoid the regions dominated by giant resonances, where identification of individual states is difficult without observation of charged-particle decays.
The theoretical analysis is performed within the QRPA model for axially deformed nuclei Bender et al. (2003); Repko et al. (2015, 2017, 2019); Kvasil et al. (2016) and the AMD+GCM model Kanada-En’yo and Shikata (2017); Shikata et al. (2019); Kanada-En’yo et al. (2018); Kanada-En’yo and Shikata (2019); Chiba et al. (2019) which can take into account both axial and triaxial quadrupole deformations and describe the evolution of the nuclear shape with excitation energy. Moreover, AMD+GCM includes the ability to describe the interplay between mean-field and cluster degrees of freedom. Despite some overlap of QRPA and AMD+GCM, the models basically describe different information on nuclear properties. QRPA treats excited states with a mean-field approach and is therefore suitable for investigation of the nuclear vorticity. Meanwhile, AMD+GCM highlights cluster properties. Altogether, QRPA and AMD+GCM supplement one another and comparison of their results is vital for light nuclei. Our analysis mainly focuses on possible manifestations of clustering and vorticity in and states.
The paper is organized as follows. In Secs. II and III, the experimental method and data analysis are outlined. In Sec. IV, the obtained experimental results are reported. In Sec. V, the experimental and strengths are compared with QRPA calculations. The vortical and irrotational characters of states are scrutinized. In Sec. VI, the experimental data are compared with AMD+GCM results. The cluster features of and states are inspected. In Sec. VII, the conclusions are offered.
II Experimental Details
A detailed description of this experiment has been given in two previous papersAdsley et al. (2017a, b). A brief summary of the experimental method is given here.
A dispersion-matched beam of 200-MeV particles was incident on a target and the reaction products were momentum-analysed by the K600 magnetic spectrometer. The focal-plane detectors consisted of two wire chambers giving horizontal and vertical position information, and two plastic scintillating paddles which measured energy deposited at the focal plane.
The spectrometer was used in two different modes to acquire the data: the zero-degree mode in which scattering angles of less than 2 degrees were measured, and the small-angle mode in which the spectrometer aperture covered scattering angles from 2 to 6 degrees.
For the zero-degree measurement, the background resulting from target-induced Coulomb scattering from the target necessitated running the spectrometer in a focus mode in which the scattered particles were focussed onto a vertically narrow horizontal band on the focal plane. In order to obtain a spectrum free from instrumental background a standard technique used with the iThemba K600 Neveling et al. (2011) and the RCNP Grand Raiden Tamii et al. (2009) magnetic spectrometers was used, in which background spectra are constructed from the regions of the focal plane above and below the focussed band. These background components are then subtracted from the signal spectrum. The vertical focussing required for this technique resulted in the loss of all vertical scattering information and limited the differential cross section for the zero-degree experiment to one point for scattering angles of less than 2 degrees.
For the small-angle measurement, the target-induced Coulomb scattering background was much lower and the spectrometer could be operated in under-focus mode, in which the vertical position on the focal plane corresponds to the vertical scattering angle into the spectrometer aperture. In this case, the scattering angle could be reconstructed from the angle with which the scattered particle traversed the focal plane, and its vertical position. The angular resolution was around 0.5 degrees (FWHM) for the small-angle data. Four points were extracted for the differential cross section between 2 and 6 degrees in the laboratory frame. The procedure to calibrate the scattering angles is described in Refs. Adsley et al. (2017a); Neveling et al. (2011).
III Data Analysis
The techniques used for the analysis of the data have been described in more detail in Ref. Adsley et al. (2017a). In summary, the horizontal focal-plane position was corrected for kinematic and optical aberrations according to the scattering angle into the spectrometer and the vertical focal-plane position.
The scattering angles into the spectrometer were calculated from the vertical position and the angle with which the scattered particle traverses the focal plane; these quantities were calibrated to known scattering trajectories into the spectrometer using a multi-hole collimator at the spectrometer aperture.
Horizontal focal-plane position spectra were generated for each angular region. The calibration of the focal-plane position to excitation energy used well-known states in 24Mg, 26Mg and 28Si Kawabata (2013); Borg et al. (1981). Corrections were made according to the thickness of the relevant targets using energy losses from SRIM Ziegler et al. (2010).
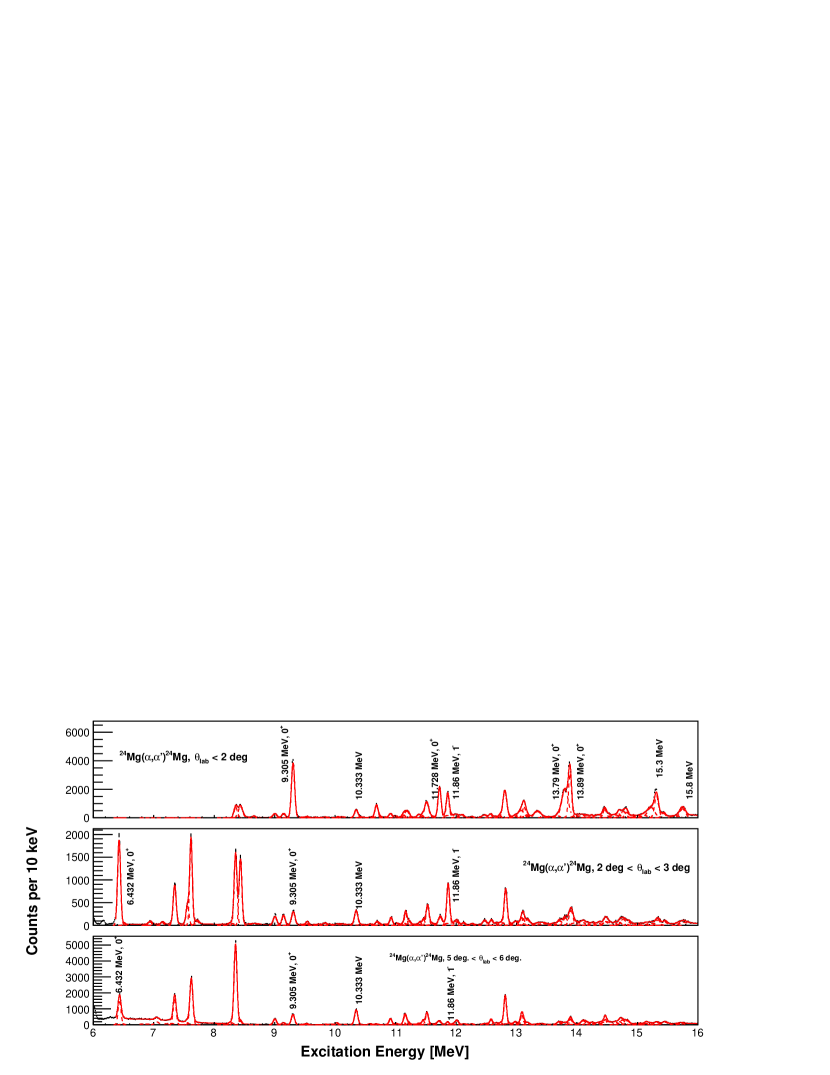
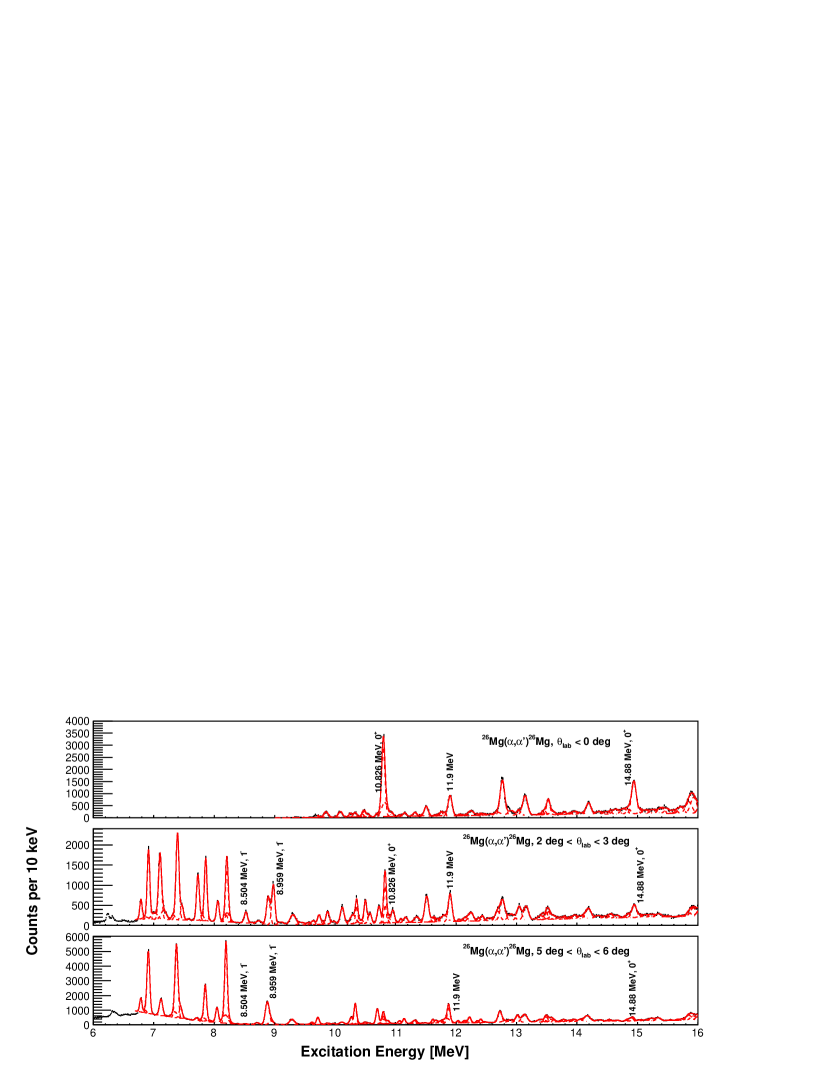
The spectra were fitted using a number of Gaussians with a first-order polynomial used to represent background and continuum. The resolution was around 75 (65) keV (FWHM) for the zero-degree (finite-angle) data. An additional quadratic term was used at MeV for the background from elastic-scattering reactions from target contaminants. The fitted spectra for 24Mg and 26Mg at some angles are shown in Figures 1 and 2. The 28Si spectra along with a description of the associated fitting procedures can be found in Ref. Adsley et al. (2017a).
To quantify contamination in the targets, elastic-scattering data were taken in the small-angle mode.Population of low-lying states in nuclei contained in the target was observed. For the natural silicon target, small quantities of hydrogen, 12C, 16O and 29,30Si were observed. For the 24Mg and 26Mg targets, hydrogen, 12C and 16O were again observed but at much lower levels than for the silicon target. From previous experimental studies with the K600 (see e.g. Ref. Li et al. (2017)), the locations of the 12C and 16O states are well known and excluded from further analysis.
IV Experimental Results
The focus of this paper is on the location and strength of cluster and vortical states. We report monopole () and dipole () states in 24,26Mg and 28Si. In addition, we discuss stateswhich have received firm or tentative monopole or dipole assignments in previous experimental studies but have not been observed in the present measurement.
The differential cross sections were extracted from the fitted spectra using:
| (1) |
where is the areal density of target ions, is the integrated charge as given by the current integrator (including the livetime fraction of the data-acquisition system), is the focal plane efficiency and is the solid angle of the spectrometer aperture at that scattering angle. The total efficiency, , is the product of the efficiencies for each wire plane per Ref. Adsley et al. (2017a). The uncertainties in the differential cross sections are a combination of the fitting error and Poissonian statistics.
By comparing the experimental differential cross sections to DWBA calculations performed using the code CHUCK3 P.D. Kunz and Endres (2009),
| (2) |
the transition factors were extracted for each dipole and monopole state. The contribution of the states to the isoscalar dipole and monopole energy-weighted sum rules (EWSRs) were computed. The calculations were performed in accordance with Refs. Harakeh and Woude (2001); Borg et al. (1981), more details are given in Appendix A.
There is a systematic 20% uncertainty due to the choice of the optical-model potentials. In the present analysis, we find that the well-known -MeV state in 24Mg exhausts % of the EWSR which is within the expected systematic deviation when compared with previous results of % Gupta et al. (2015) and % Youngblood et al. (1999).
For some of the states contamination or background in the differential cross sections is problematic. This can occur when the level density is high e.g. around the states in 24Mg in the region of MeV, where a third state lies between the two states, or at the minima of the differential cross section where the background is similar in size to the cross section from the state of interest. In these cases, to avoid biasing the extracted transition strengths, a subset of points from the angular distributions has been used for comparison to the DWBA calculation.
Below, in Tables I-V and Figs. 3-4, the monopole and dipole spectra for in 24Mg, 26Mg, and 28Si are reported. Some states are discussed in separate subsections; this is done where assignments have been updated or known states have not been observed.
IV.1 24Mg
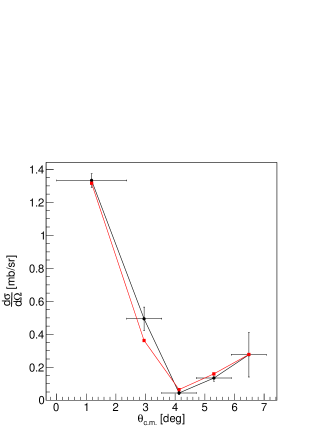
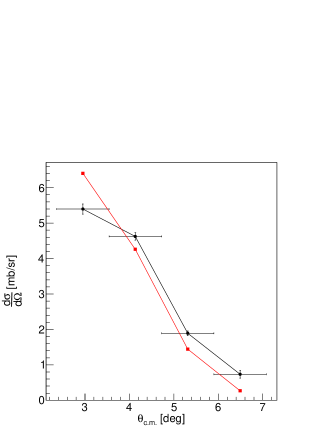
A typical differential cross section for a state in 24Mg is shown in Figure 3 and for a state in 24Mg in Figure 4. Similar shapes were used to identify other monopole and dipole states. The and levels are summarized in Tables 1 and 2, respectively; states with the corresponding listed in the ENSDF database ENS (2015) are included even when not observed.
IV.1.1 The 10.161-MeV state
A state with has been reported at 10.161 MeV in 24Mg()24Mg, 23Na(3He,)24Mg, 25Mg(3He,4He)24Mg and 12C(16O,)24Mg reactions (see Ref. ENS (2015) and references therein). This state is not observed in the present experiment.
IV.1.2 The 13.044/13.13-MeV state
A state is listed at MeV in Ref. ENS (2015). In the present data, a state is observed at MeV. The cause of this shift is not clea; it is possible that these are the same state and the energy has been incorrectly determined in the past or that this is an additional state.
| [MeV]111From Ref. ENS (2015) unless stated otherwise | Comments | ||
| Not on focal plane at 0° | |||
| Not observed. | |||
| 222Strength extracted from 0° data alone. | |||
| Not observed | |||
| 333Present experiment | |||
| ENS (2015), not observed | |||
| [MeV]444From Ref. ENS (2015) unless stated otherwise | Comments | ||
| Not observed | |||
| 555Present experiment |
IV.2 26Mg
Table 3 summarizes known states in 26Mg either listed in the ENSDF database ENS (2015) or observed during the present experiment.
| [MeV]666From Ref. ENS (2015) unless stated otherwise | Comments | ||
| Not on focal plane at 0° | |||
| Not on focal plane at 0° | |||
| Not on focal plane at 0° Not observed ENS (2015) | |||
| Not on focal plane at 0° Not observed ENS (2015) | |||
| Not observed | |||
| 777From Ref. Borg et al. (1981) | Not observed or | ||
| 888See Ref. Adsley et al. (2020) for a discussion of the energy of this level. | Part of a multiplet: see text, Refs. Adsley et al. (2017b, 2018, 2020). | ||
| Not observed , parity unknown | |||
| New | |||
| New | |||
| 999Present experiment |
Table 4 summarizes known states along with electrical s from Refs. Schwengner et al. (2009) and deBoer et al. (2010). For the data of Ref. deBoer et al. (2010), the partial widths of the ground-state decay are given and are converted to the reduced matrix element using the relation:
| (3) |
for a radiation of multipolarity and type (electric/magnetic) . is the energy of the -ray transition.
| [MeV]101010From Ref. ENS (2015) unless stated otherwise | Schwengner et al. (2009) | deBoer et al. (2010) | Comments | ||
| Not observed. Parity uncertain Schwengner et al. (2009) | |||||
| Not observed. Parity is tentatively negative Schwengner et al. (2009) | |||||
| New | |||||
| Not cleanly observed due to -MeV state | |||||
| From 25Mg Massimi et al. (2012) | |||||
| From 25Mg Massimi et al. (2012) | |||||
| 111111Present experiment | Possible multiplet see Ref. Adsley et al. (2017b) |
IV.2.1 The 7.062-MeV state
IV.2.2 The 10.159-MeV state
The state at MeV in 26Mg listed in Ref. ENS (2015) is not observed in the present experiment. The state has been previously observed in 24Mg()26Mg with Alford et al. (1986) and in 26Mg()26Mg (see Ref. ENS (2015) and references therein). We assume that the state has if it is populated in 24Mg()26Mg reactions. Therefore, population of this state in 26Mg()26Mg is unlikely to be isospin-forbidden. The reason why this state is not populated remains unclear.
IV.2.3 The 10.74-MeV tate
Ref. Borg et al. (1981) lists a tentative state at MeV. In the present experiment, a state is observed at around MeV but the differential cross section is consistent with .
IV.2.4 States in the region of 10.80 to 10.83 MeV
A state with has been identified at 10.805 MeV in 26Mg()26Mg experiments Longland et al. (2009). In a preceding paper focussing on a narrow subset of astrophysically important states in 26Mg, we demonstrated that the strong state observed in the 26Mg()26Mg reaction has and is, therefore, evidently a different state from the state Adsley et al. (2017b). The existence of multiple states was confirmed by a high-resolution experiment using the Munich Q3D Adsley et al. (2018).
In the present case, the extraction of the dipole strength is hindered by the close proximity of the strong state. A higher-resolution inclusive measurement or a coincidence measurement of 26Mg()26Mg is necessary for the extraction of the isoscalar dipole transition strength for this state.
IV.2.5 The -MeV state
Notably, one -particle cluster state in 26Mg has been identified through direct reactions. The resonance at MeV observed in 22Ne()26Mg Hunt et al. (2019); Wolke et al. (1989) and 22Ne()25Mg Giesen et al. (1993); Drotleff et al. (1993); Jaeger et al. (2001) reactions clearly has a 22Ne cluster structure. However, the spin and parity of this state were not clearly assigned in previous 26Mg()26Mg reactions including our prior publication Adsley et al. (2017b); Talwar et al. (2016). Based on direct measurements of the resonance strengths and the inferred -particle width, the state almost certainly has or Jayatissa et al. (2020); Ota et al. (2020).
We do not observe any strong candidate for this state in our present experimental work and, therefore, cannot provide a monopole or dipole transition for the state.
IV.2.6 The - and -MeV states
Both of these states have been identified as using the reactions of neutrons with 25Mg. While -ray partial widths are available, the branching of these states is not, and, therefore, the for the ground-state transition cannot be determined.
IV.2.7 The 12.345-MeV State
A state is listed in Ref. ENS (2015) as having with unknown parity and keV. This state is not observed in the present experiment.
IV.3 28Si
Data on the states observed in 28Si have been previously reported in Ref. Adsley et al. (2017a). In the present paper, we have extended the analysis up to 16 MeV to cover the same range as for the magnesium isotopes. Additional states are observed at 15.02 and 15.76 MeV. A number of states have been observed.
The natural silicon target contains some carbon and oxygen contamination. Carbon and oxygen states which are strongly populated in -particle inelastic scattering at MeV are known from previous studies with the K600 Li et al. (2017) and are excluded from the reported states.
| [MeV]121212From Ref. ENS (2015) unless stated otherwise | Comments | ||
| Not on focal plane at 0° | |||
| Not on focal plane at 0° | |||
| 131313From Ref. Adsley et al. (2017a) | |||
| 141414From Ref. Adsley et al. (2019) | See Refs. Adsley et al. (2017a, 2019). | ||
| Unresolved multiplet. ENS (2015); Adsley et al. (2017a). | |||
| Newly observed. | |||
| 151515Present experiment | May correspond to a tentative -MeV state Borg et al. (1981). |
| [MeV]161616From Ref. ENS (2015) unless stated otherwise | Comments | ||
| Confirms a tentative assignment Borg et al. (1981). | |||
| Ref. ENS (2015) gives | |||
| Confirms a tentative assignment Borg et al. (1981). | |||
| 171717Present experiment | |||
IV.3.1 The 11.142- and 11.148-MeV states
As explained in the previous K600 paper on 28Si()28Si, the literature lists two unresolved and states at 11.141 and 11.148 MeV, respectively Adsley et al. (2017a). Further investigation of the existing data on 28Si Adsley et al. (2019) has showed that there is, in fact, only one state with at this energy and so it is not necessary to include contributions from two states.
IV.3.2 The 11.65-MeV state
Ref. Borg et al. (1981) reports a tentative state at MeV corresponding to a state at MeV. This state is not observed in the present experiment.
V Comparison with QRPA calculations
V.1 Calculation Scheme
We use a fully self-consistent QRPA approach Repko et al. (2015, 2017) with the Skyrme force SLy6 Chabanat et al. (1998). This force was found to be optimal in the previous calculations of dipole excitations in medium-heavy nuclei Nesterenko et al. (2018); Kleinig et al. (2008). The nuclear mean field is computed by the code SKYAX P.-G. Reinhard (2021) using a two-dimensional mesh in cylindrical coordinates. The mesh spacing is 0.7 fm. The calculation box extends up to 3 nuclear radii. The equilibrium deformation of nuclei is obtained by minimization of the nuclear energy. The volume pairing is treated with the Bardeen-Cooper-Schrieffer (BCS) method Repko et al. (2017). The pairing was found to be weak (with a pairing gap about 1 MeV) in all the cases with the exception of the neutron system in 26Mg. The QRPA is implemented in the matrix form Repko et al. (2015). The particle-hole (1ph) configuration space extends up to 80 MeV, which allows the calculations to exhaust the isoscalar and energy-weighted sum rules Harakeh and Woude (2001). The center-of-mass and pairing-induced spurious admixtures are extracted following the prescription of Ref. Repko et al. (2019).
The obtained axial quadrupole deformations are and for 24,26Mg and 28Si, respectively, meaning that 24,26Mg are taken to be prolate nuclei while 28Si is treated as oblate. In the SLy6 calculations, 26Mg has comparable oblate and prolate energy minima. Following the experimental data of Stone Stone as well as AMD+GCM Watanabe et al. (2014) and Skyrme Horiuchi et al. (2012b) calculations, the ground-state deformation of 26Mg is prolate and we use the equilibrium deformation = 0.355 from the prolate minimum for 26Mg.
Note that the absolute values obtained for equilibrium deformations are smaller than the experimental ones ( for 24,26Mg, 28Si) bnl . This is a common situation for deformation-soft nuclei. Indeed, are obtained from the values for the transitions in the ground-state rotational bands. However, in soft nuclei, values include large dynamical correlations and so this leads to overestimation of the magnitude of the quadrupole deformation, . Therefore, the present observation that is reasonable.
The isoscalar reduced transition probabilities
| (4) |
for the transitions from the ground state with to the excited -th QRPA state with are calculated using the monopole and dipole transition operators:
| (5) | |||||
| (6) |
where . To investigate the deformation-induced monopole/quadrupole and dipole/octupole mixing, we also compute quadrupole and octupole transition probabilities for isoscalar transitions and using transition operators
| (7) | |||||
| (8) |
We now consider the vortical and compression isoscalar strengths, and , using current-dependent operators from Refs. Nesterenko et al. (2018, 2019). We need these strengths to estimate the relative vortical and irrorational compression contributions to the dipole states. The current-dependent compression operator includes divergence of the nuclear current and so can be reduced to Eq. (6) using the continuity equation. For the sake of simplicity, we will further omit the dependence on in rate notations.
V.2 strength distributions
V.2.1 24Mg
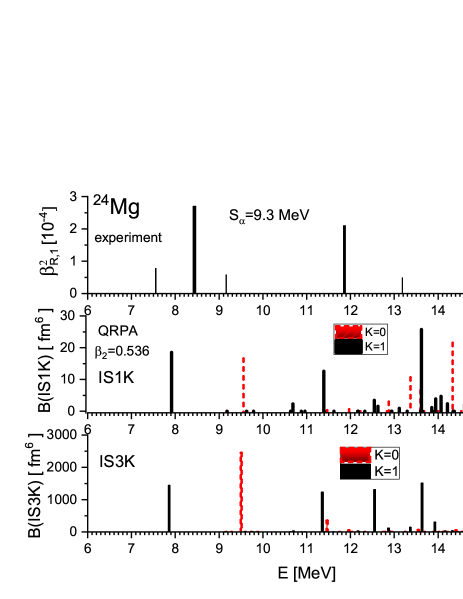
In Fig. 5, the experimental data (transition factors ) for 24Mg (upper plot) are compared with values (middle plot) for QRPA states with (red) and (black). We see that experiment and QRPA give the lowest dipole states at a similar energy, 7.56 and 7.92 MeV, respectively. In QRPA, the states 7.92-MeV () and 9.56-MeV () have large responses and so should be well populated in the reaction. However, it is still difficult to establish one-to-one correspondence between these QRPA states and observed excitations, see the discussion in Ref. Nesterenko et al. (2018). In general, QRPA gives many more dipole states between MeV than the observed spectrum. The calculated summed strength is given in Table 7.
The bottom panel of Figure 5 shows QRPA strengths for isoscalar octupole transitions . The dipole and octupole states belong to the same rotational band built on the band-head state . Thus, the represents the level of deformation-induced octupole correlations in the band-head . We see that the lowest states 7.92-MeV () and 9.56-MeV () exhibit fundamental octupole strengths: fm6 (21 W.u.) and fm6 (72 W.u.), respectively. Such large values originate from two sources: i) collectivity of the states and ii) that the dominant proton and neutron components of the states (, for 7.92-MeV K=1 state and , for 9.56-MeV K=0 state) fulfill the selection rules for transitions Nilsson (1965):
Here, the single-particle states are specified by Nilsson asymptotic quantum numbers Mottelson and Nilsson (1959), whilst the arrows indicate spin direction. The large values signify that 7.92-MeV K=1 and 9.56-MeV K=0 states are of a mixed octupole-dipole character. Their leading components correspond to transitions between the valence and upper quantum shells, so these states can belong to the Low-Energy Octupole Resonance (LEOR) Harakeh and Woude (2001); Malov et al. (1976).
As may be seen in Figure 5, both and distributions can be roughly separated into two groups, the first located below (7-10 MeV) and the second located above (11-14 MeV) the -particle threshold ( MeV). Moreover, at the energy close to , there is a -MeV state with a huge strength, which perhaps signals the octupole-deformation softness of the nucleus at this energy. It is reasonable to treat the states below as being of mean-field origin, while the states close to and above (including the -MeV near-threshold state) as those including cluster degrees of freedom. This is confirmed by recent AMD+GCM calculations for 24Mg Chiba et al. (2019), where similar results were obtained: the lowest mean-field 9.2-MeV state is of mean-field character and the -MeV state has cluster properties.
| Nucleus | QRPA | ||
| 24Mg | 80 | 82 | 162 |
| 26Mg | 90 | 141 | 230 |
| 28Si | 21 | 168 | 189 |
| Nucleus | ||||
| 24Mg | 0.010 | 0.0038 | 0.019 | 0.0033 |
| 26Mg | 0.012 | 0.0011 | 0.028 | 0.0074 |
| 28Si | 0.015 | 0.0011 | 0.029 | 0.0071 |
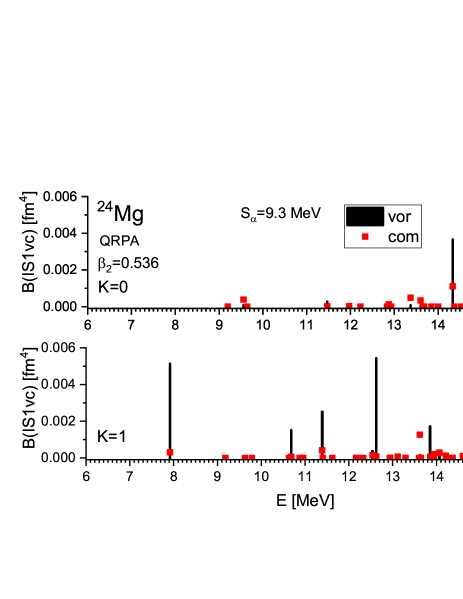
In Figure 6, the vortical and compression strengths for and dipole branches in 24Mg are compared. The states with should be considered as vortical in nature, see e.g. the -MeV state. Instead, the states with are basically of compressional irrotational character. Compressional states can be directly excited in the reaction Harakeh and Woude (2001). The vortical states usually have a minor irrotational admixture and, most probably, are weakly excited in the reaction through this admixture. Figure 6 shows that, in accordance with previous QRPA predictions Nesterenko et al. (2018, 2019), the lowest state at -MeV is mainly vortical. Moreover, for MeV, the branch exhibits much more vorticity than the branch. The summed and are reported in Table 8.
The vortical character of the lowest dipole state may be a unique peculiarity of 24Mg. At least, this is not the case in 26Mg and 28Si, as discussed below. As mentioned above, the vortical 7.92-MeV state in 24Mg is mainly formed by the proton and neutron configurations. Just these configurations produce the vortical flow Nesterenko, Valentin et al. (2018). The large prolate deformation in 24Mg downshifts the energy of these configurations, thus making the vortical dipole state the lowest in energy Nesterenko et al. (2018); Nesterenko, Valentin et al. (2018). It is remarkable that the previous AMD+GCM calculations Chiba et al. (2019) give a very similar result for 24Mg: that the lowest dipole state at MeV has vortical () character and a higher compressional () state at MeV.
V.2.2 26Mg
In Figure 7, we compare the calculated and responses with the data. In both experiment and theory, we see numerous dipole states above MeV. The fragmentation of the dipole and octupole strengths is somewhat larger than in 24Mg, which can be explained by the stronger neutron pairing in 26Mg (in contrast, the proton pairing in 26Mg and both proton and neutron pairings in 24Mg are weak).
Again we see rather large values, which means that many of the and excitations are of a mixed dipole-octupole character. As in 24Mg, the states can be separated into two groups, below and above the threshold ( MeV). We observe a near-threshold collective -MeV state with an impressive value.
As can be seen in Figure 7, the theory suggests another pattern for the lowest dipole states in 26Mg. Unlike 24Mg, where the lowest dipole state is well separated and exhibits a vortical character, the QRPA dipole spectrum in 26Mg starts with two almost degenerate and states at MeV. Moreover, as can be seen in Figure 8, these lowest QRPA states in 26Mg are not vortical.
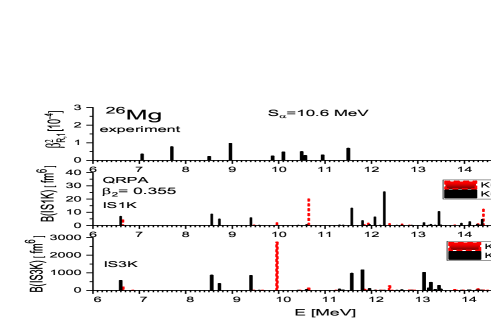
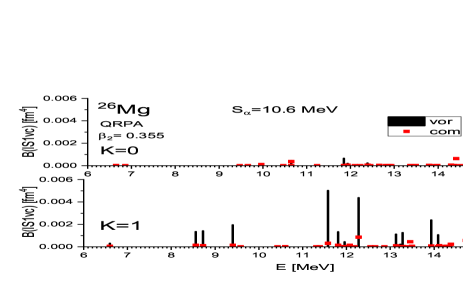
To understand these results, we should inspect the structure of the lowest 6.60-MeV K=1 and 6.64-MeV QRPA states in 26Mg. They are dominated by neutron configurations and , respectively. The same content explains the quasi-degeneracy of these states. These configurations have low values and are not vortical. The configurations correspond to transitions, where marks the Fermi level. Both single-particle levels involved in the transition lie above the Fermi level and the transition is active only because of the developed neutron pairing in 26Mg (but it is suppressed in 24Mg, where the calculated pairing is negligible).
Note that excitations and , which produce the vorticity in the lowest vortical dipole state in 24Mg, also exist in 26Mg, but they are located at a higher energy of MeV. Therefore, the distribution of the vorticity is mainly determined by the energy of vortical configurations. Besides, it is affected by pairing factors and residual interaction.
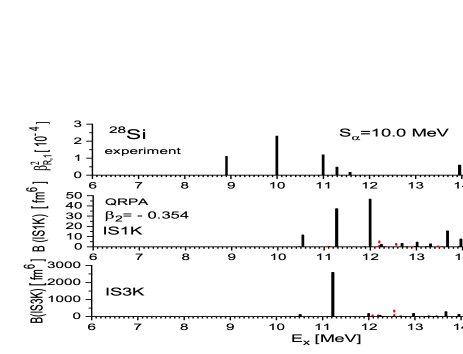
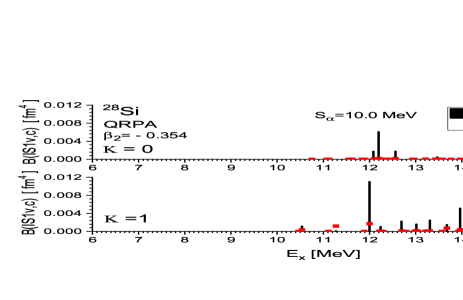
V.2.3 28Si
In Figure 9, we present the experimental data and QRPA results for and strengths in oblate 28Si. We see that the theory significantly overestimates the energy of the lowest state: it appears at 8.8 MeV in experiment and at 10.5 MeV in QRPA. So, unlike the experiment, the theory does not suggest any states below the threshold ( MeV). Perhaps this discrepancy is caused by a suboptimal oblate deformation used in our calculations. Further, Figure 9 and Table 7 show that the dipole and octupole strengths for are much larger than for . So, in this nucleus states should be more strongly populated in than states.
The bottom panel of Figure 9 shows that, with the exception of the -MeV state, the nucleus 28Si does not demonstrate any fundamental octupole strength. So, for most of its states, the dipole-octupole coupling is suppressed. The near-threshold state at 11.2 MeV with significant octupole strength has but not as in 24,26Mg. Perhaps all these peculiarities are caused by the oblate deformation of 28Si.
In our calculations, the pairing in 28Si is weak. As a result, the vortical configuration corresponding in this nucleus to the transition between particle states is suppressed. So, as seen from Figure 10, the lowest dipole states in 28Si are not vortical and vorticity appears only above 12 MeV. As in 24,26Mg, the vorticity is mainly concentrated in the branch.

V.3 Summary for QRPA results
QRPA calculations do not allow one to establish a direct correspondence between the calculated and observed states. Perhaps this is because the present QRPA scheme does not take into account such important factors as triaxiality, shape coexistence, clustering and complex configurations are omitted. Nevertheless, the QRPA calculations lead to some interesting and robust results.
-
1.
The strong deformation-induced mixture of the dipole and octupole modes is predicted for most of and states in 24,26Mg and in a few particular states in 28Si. Some mixed states demonstrate impressive octupole transition probabilities . Perhaps these states belong to the low-energy octupole resonance (LEOR)Harakeh and Woude (2001); Malov et al. (1976).
-
2.
In all three nuclei, the collective state with a large octupole strength is predicted near the -particle thresholds MeV. This state has in 24,26Mg and in 28Si. Most probably, the difference is caused by different signs of the axial deformation in these nuclei.
-
3.
Above the -particle thresholds, fragmented vorticity is found in states in all three nuclei. Below , the picture is different: the vorticity is concentrated in the lowest dipole state at MeV in 24Mg, fragmented between several states at MeV in 26Mg, and fully absent in 28Si. As was discussed, the vorticity is delivered by particular configurations which can have a different energy location depending on the nuclear deformation and other factors, e.g. the residual interaction. Moreover, these configurations are active only if they are of particle-hole character or supported by the pairing (like in 26Mg). A particular interplay of these factors in 24,26Mg and 28Si leads to the difference in their vorticity distribution.
V.4 strength distributions
In Figure 11, the data for states in 24,26Mg and 28Si (plots (a)-(c)) are compared with QRPA isoscalar monopole strengths () in the energy interval 0-16 MeV (plots (d)-(f)).
As mentioned above, because of the limitations of the experimental set up, the present data cover MeV. Low-energy states listed in Tables I, III and V of Section IV are omitted in Figure 11.
Figure 11 shows that in 24Mg the experimental and QRPA strength distributions look rather similar. The calcu- lated -MeV state perhaps corresponds to the observed -MeV state Gupta et al. (2016, 2015). In 26Mg, the situation is quite different since QRPA predicts states from around MeV. In 28Si, QRPA suggests the onset of states around MeV. In all three nuclei, QRPA predicts some states at 9-16 MeV, which is in general accord with the experimental data. The QRPA IS0 strengths summed over MeV are 26.1 fm4, 13.76 fm4, and 12.6 fm4 in 24Mg, 26Mg, and 28Si, respectively.
Note that, in the QRPA calculations, the actual number of states at MeV is much larger than might be seen in Figure 11. In fact, QRPA gives 48 (24Mg), 53 (26Mg), and 50 (28Si) states. However, most of these states are not seen in plots (d)-(f) because of their very small values.
Plots (g)-(i) in Figure 11 show QRPA strength in the larger energy interval 0-30 MeV including the IsoScalar Giant Monopole Resonance (ISGMR). In deformed nuclei, there is the coupling of monopole and quadrupole modes, see e.g. early studies Harakeh and Woude (2001); Abgrall et al. (1980); Jang (1983) and recent systematic studies Garg and Colò (2018); Kvasil et al. (2016). In particular, the ISGMR is coupled with the branch of the IsoScalar Giant Quadrupole Resonance, ISGQR(). Due to this coupling, a part of the strength is transferred from the energy region of the normal ISGMR to the energy region where the ISGQR() branch is located. Thus, we get the deformation-induced splitting of the ISGMR strength into two parts, the main ISGMR fraction, and additional strength located at the energy of the ISGQR() component. Since the ISGQR lies below the ISGMR, this strength also appears below the ISGMR. The larger the deformation, the more strength is transferred to this lower fragment from the main ISGMR, see Ref. Kvasil et al. (2016) for more detail. For light nuclei of our present interest, the deformation-induced coupling of monopole and quadrupole modes was earlier studied using () reaction for 24Mg Gupta et al. (2016, 2015) and 28Si Peach et al. (2016).
In our calculations, 24,26Mg and 28Si have large quadrupole deformations and so we should expect significant ISGMR splitting. Indeed, the plots (g)-(i) show that the ISGMR in these nuclei is split into two main sections: the narrow distribution between 15 and 19 MeV and the main, wider, ISGMR distribution between 20 and 30 MeV. The picture is similar in prolate 24,26Mg and oblate 28Si. Note that the obtained distributions of IS0 strength rather well reproduce the experimental data for Mg Gupta et al. (2016, 2015) and 28SiPeach et al. (2016).
The above treatment of ISGMR splitting is justified by the plots (j)-(l), where the strength of quadrupole isoscalar transitions from the ground state to the rotational quadrupole state built on the band-head is exhibited. We see that the ISGQR() branch is located at 15-19 MeV, i.e. at the same energy as the narrow hump. This confirms that the hump is just the ISGMR part arising due to the deformation-induced ISGMR/ISGQR coupling realized for states.
Plots (g)-(i) and (j)-(l) highlight some important points. First, the plots (g)-(i) show that the states in data lie just below the ISGMR peak, i.e. basically beyond the ISGMR. Only in 24Mg, these states perhaps cover the edge of the ISGMR hump. Second, from comparison of the plots (g)-(i) and (j)-(l), we learn that states at 0-16 MeV exhibit both strong and transitions. They should, therefore, not be treated as solely monopole states but rather as strong mixtures of monopole and quadrupole excitations.
VI Comparison with AMD+GCM calculations
In this section, we discuss the comparison between the present experimental results and the AMD+GCM calculations for and presented in Refs. Chiba and Kimura (2015); Chiba et al. (2017); Taniguchi and Kimura (2020). These calculations do not take into account all the degrees of freedom of the collective excitations. Therefore, they are not appropriate for the discussion of the global features of the observed strength distributions. However, AMD+GCM describes the clustering aspects which involves many-particle-many-hole excitations, and hence, can offer a different insight into the low-lying strengths than that from QPRA. From the mean-field side, AMD+GCM takes into account the interplay between axial and triaxial nuclear shapes, which is important for light nuclei.
In Ref. Chiba and Kimura (2015), using the AMD+GCM framework, the relationship between the monopole strengths in and clustering has been discussed. The +, 8BeO, 12CC and cluster configurations were investigated in addition to the single-particle excitations. It was concluded that several low-lying monopole transitions at energies below the giant monopole resonance can be attributed to the clustering as summarized in Table 9.
| Cluster | [MeV] | [fm2] | [MeV] | [MeV] | [fm2] | |
| 9.3 | 9.7 | 6.4 | 6.4 | 14.3 1.6 | ||
| (+) | 11.7 | 4.7 | 8.8 | 9.3 | ||
| + | 13.2 | 2.5 | 10.3 | |||
| + | 15.3 | 6.2 | 12.4 |
As already discussed in previous works on AMD+GCM and QPRA calculations Taniguchi and Kimura (2020); Péru and Goutte (2008); Péru, S. and Martini, M. (2014), the Gogny D1S interaction overestimates the energy of the non-yrast states of . Therefore, when we compare the AMD+GCM results listed in Table 9 with the experiment, it is better to shift down the calculated excitation energies to match with the well-known states. For this purpose, Table 9 also lists the calculated excitation energies shifted down by 2.9 MeV so as to reproduce the observed energy (=6.4 MeV) of the state. Note that this shift also changes the calculated excitation energy of the state (11.7 MeV 8.8 MeV) close to the observed value of MeV which is experimentally well established. For the higher excited states (the and states), as the observed level density is rather high, the experimental counterparts in the ENSDF database Firestone (2007) are ambiguous.
Table 9 should be compared with the present experimental data from Table 1 and Figure 11. We see that the state is out of the acceptance of the present experiment, but the state is clearly observed and has the enhanced monopole strengths as predicted by AMD+GCM. In Ref. Chiba and Kimura (2015), it was concluded that is a mixture of the collective and cluster excitations. Consequently, it is interesting to note that the also appears as a prominent peak in the QRPA result (Figure 11). In addition to the state, Table 1 reports a state at 11.7 MeV and a group of states at 13.0-13.9 MeV with the enhanced monopole strengths. These states are of particular interest because their energies are close to the corresponding cluster decay thresholds (9.3 MeV for +, 13.9 MeV for + , 14.047 MeV for 16O and 14.138 MeV for 16OBe as listed in the Ikeda diagram Ikeda et al. (1968). Furthermore, these states are also visible in the excitation function reported in another 24Mg()24Mg experiment and seem not be reproduced by RPA calculations Gupta et al. (2016); Péru and Goutte (2008). Therefore, they can be attributed to the cluster resonances. In the AMD+GCM calculations, the candidates of the + and + cluster configurations were predicted at 13.2 and 15.3 MeV (10.3 and 12.4 MeV with the 2.9-MeV shift), respectively. Of course, to firmly establish the assignments of these states, more detailed analysis is indispensable. For example, the differential cross sections of these states should be compared with theoretical predictions in the future. The present experiment probes only a small range of angles and is insufficient for thorough comparison with theory.
For , AMD+GCM calculations suggest pairs of and states pertinent to asymmetric cluster configurations, such as +, + and +12 Chiba et al. (2017). The predicted results are summarized in Table 10. Similar to the case, the Gogny D1S interaction systematically overestimates the energies of the non-yrast states, see Figure 6 in Ref. Chiba et al. (2017). Therefore, while comparing the AMD+GCM and experimental results, we again use the downshift of the calculated excitation energies, now by 3.3 MeV, to match the energy of the observed state. Note that this well-known prolate-deformed state should have a large contribution from the + cluster configuration Baye (1976); Baye and Heenen (1977); Taniguchi et al. (2009); Darai et al. (2012). The value of the energy downshift looks reasonable as it is similar to that introduced for . With this shift, the energies of other well-known states show the reasonable agreement between the AMD+GCM and experimental results. For example, the member of the SuperDeformed (SD) band, which has been experimentally identified at 9.8 MeV in Ref. Jenkins et al. (2012), agrees well with the shifted AMD+GCM state at 9.7 MeV. Furthermore, a couple of the + cluster resonances have been identified around 13 MeV in resonant scattering experiments Tanabe et al. (1983); et al. (1990), which are close to the shifted AMD state at 14.9 MeV.
| cluster | ||||||
| 5.8 | 16.0 | 2.5 | 4.98 | 14.7 | ||
| + | 13.8 | 9.3 | 10.5 | |||
| 14.9 | 90.3 | 11.6 | ||||
| + | 12.9 | 130.0 | 9.6 | |||
| 18.2 | 5.1 | 14.9 | 13.0 | |||
| 20.6 | 64.0 | 17.3 | ||||
| 21.5 | 1.7 | 18.2 | ||||
| 22.5 | 6.8 | 19.2 | ||||
| + | 10.0 | 0.0 | 6.7 | 6.69 | ||
| 15.8 | 0.0 | 12.5 | ||||
| + (SD) | 12.6 | 0.0 | 9.3 | 9.7 | ||
| 13.0 | 9.7 | 9.8 | ||||
| 17.6 | 0.0 | 14.3 | ||||
| 18.8 | 0.0 | 15.5 |
We now examine the cluster configurations listed in Table 10 and compare to the present experimental data. Since the monopole () and dipole transitions have a strong selectivity for the cluster states, the cluster configurations can be classified into two groups which are strongly populated/hindered in the reaction. For example, from a simple theoretical consideration, we can predict that the state that is the band head of the prolate band (the lowest + cluster band) should be hindered. See Ref. Kimura et al. (2017) for details of the hindrance mechanism. It is interesting that the hindrance of the state can also be seen in the QRPA results shown in Figure 11. Unfortunately, this state (which is important for validation of the relationship between the monopole transitions and clustering) is out of the acceptance of the present experiment but it should be experimentally confirmed to validate the discussion the hindrance of the transition.
For the same reason, the AMD+GCM predicts that the SD band head expected at 9.3 MeV should also be hindered. However, in the present experiment, the observed 9.7-MeV state is very close to the 9.8-MeV state and, following Table V, has the enhanced monopole strength in contradiction to the AMD+GCM prediction. This new result requires a more detailed analysis of the SD state in 28Si.
At the same time, AMD+GCM predicts an enhancement of the 20NeBe and 24Mg cluster configurations. The pair of the and states with the 20NeBe configuration is predicted at MeV, and some fractions of and strength are indeed experimentally observed in this energy region. This may be the first indication of the 20NeBe clustering in , which must be confirmed by a more detailed study, e.g. the transfer of to . Other states which are predicted to be strongly populated in the reaction are 24Mg cluster states. AMD+GCM calculations predict a state at MeV and and states at approximately and MeV. The states at 17-20 MeV are beyond the present experiment. Several states can be seen at 9.5 MeV and 15 MeV. It is worthwhile to note that the transfer and + resonant scattering experiments Tanabe et al. (1983); et al. (1990) also report a group of the + resonances with within the same energy region. Therefore, the data of the previous and present experiments as well as the AMD+GCM results look consistent. A more detailed comparison between AMD+GCM and experimental results may be conducted in the future.
VII Conclusions
The isoscalar dipole () and monopole () excitations of 24Mg, 26Mg and 28Si at the energy interval MeV have been measured using the () inelastic-scattering reaction at forward angles (including zero degrees). The experiment was performed using the K600 magnetic spectrometer at iThemba LABS (Cape Town, South Africa). New monopole and dipole states were reported.
The extracted and strength distributions were compared to the theoretical calculations performed within the Skyrme Quasiparticle Random-Phase-Approximation (QRPA) Bender et al. (2003); Repko et al. (2015, 2017, 2019) and Antisymmetrized Molecular Dynamics + Generator Coordinate Method (AMD+GCM) Kanada-En’yo and Shikata (2017); Shikata et al. (2019); Kanada-En’yo et al. (2018); Kanada-En’yo and Shikata (2019); Chiba et al. (2019) approaches. The correspondence, at least tentative, between some calculated and observed states was established. This theoretical analysis allows us to draw some important physical conclusions.
First of all, QRPA and AMD+GCM calculations suggest that low-lying states in light nuclei can have two origins: irrotational cluster (IC) Chiba et al. (2017) and mean-field (MF) Nesterenko et al. (2018); Nesterenko, Valentin et al. (2018); Chiba et al. (2019). The MF-states can be irrotational (IMF) and vortical (VMF) Nesterenko et al. (2018); Nesterenko, Valentin et al. (2018); Chiba et al. (2019).
The IC states produce negative-parity cluster bands, which are the doublets of the positive-parity bands based on the monopole states Chiba et al. (2017). Some traces of these doublets were found in the comparison of theoretical calculations and experimental data. IC states are irrotational dipole oscillations of the two clusters which constitute the nucleus relative to one other. These states originate from the reflection-asymmetric form of the nucleus exhibiting the clustering. The negative-parity bands produced by IC states usually have .
Instead, the VMF states in light nuclei were predicted in the papers of Nesterenko and Kanada-En’yo. They are vortical (not irrotational) toroidal states and are mainly of mean-field origin Nesterenko et al. (2018); Nesterenko, Valentin et al. (2018); Chiba et al. (2019). In general,they can take place in both light and heavy nuclei and can exist without clustering. They do not need the reflection-asymmetric nuclear shape and the associated the monopole doublets. Following previous studies Nesterenko et al. (2018); Nesterenko, Valentin et al. (2018); Chiba et al. (2019) and present QRPA calculations, these states produce negative-parity rotational bands, mainly with .
Both IC and IMF/VMF states exhibit enhanced transitions and are usually located near the alpha-particle threshold. In general, IC and IMF/VMF states can be mixed, especially in soft and triaxial nuclei exhibiting -mixing. Nevertheless, the relation to the or band is perhaps a reasonable indicator for an initial discrimination of IC and VMF states.
Being strongly deformed, 24,26Mg and 28Si should exhibit a strong coupling between dipole and octupole modes and between monopole and quadrupole modes. This coupling was confirmed by QRPA calculations where strong () and () transitions were found. So, theoretically explored states are actually dipole/octupole and monopole/quadrupole mixtures. Further, QRPA predicts that, near the -particle threshold, there should exist a specific collective state ( in prolate and in oblate nuclei) with an impressive octupole strength. This near-threshold state manifests the onset of states with cluster features.
Due to triaxiality and significant shape coexistence in 24,26Mg and 28Si, QRPA results obtained at the fixed axial deformation should be considered as approximate. In addition, QRPA calculations do not include all the dynamical correlations coupling with complex configurations. Nevertheless, the main QRPA prediction - of vortical dipole states with enhanced strength as an alternative to the cluster dipole states - remains robust. In our opinion, more involved calculations may change some details but not this general prediction.
Another interesting QRPA prediction is a change in dipole vorticity below the -particle thresholds in 24,26Mg and 28Si. Following our analysis, the vorticity is concentrated in the lowest dipole state in 24Mg at 8 MeV, is fragmented between several states at 8.5-9.5 MeV in 26Mg, and is fully absent in 28Si. The difference is explained by the different energies of configurations responsible for the vorticity. Our explorations confirm the suggestion made in Ref. Nesterenko et al. (2018) that 24Mg is perhaps the unique nucleus with a well-separated low-energy vortical state.
In some particular cases, the correspondence between the observed and calculated low-lying states was established. However neither QRPA nor AMD+GCM are still able to provide a systematic one-to-one correspondence of low-lying spectra and experimental data. This demanding task calls for more involved theories, e.g. taking into account the coupling with complex configurations.
The present () data do not yet allow confident assignment of the vortical or cluster character of the excitations. However, these data improve our knowledge of the isoscalar monopole and dipole states at the excitation energies where the clustering and vorticity are predicted. This is a necessary and important step in the right direction. The use of the () reaction at intermediate energies complements other suggested mechanisms for populating cluster and vortical states such as the () Iachello (1985); Spieker et al. (2015), () Nesterenko et al. (2019) and (Li) reactions Spieker et al. (2015) or (6/7Li,), although detailed information on the interior of nuclei and the vortical mode is likely only available from the reaction. It was recently shown that vortical states in 24Mg are characterized by the strong interference between the orbit and spin contributions to the experimentally accessible transversal form factors Nesterenko et al. (2019). This results in specific momentum distributions for (and in deformed nuclei) backward scattering, which in turn allows identification of vortical states Nesterenko et al. (2019). Branching ratios and transition strengths of -ray transitions from the observed dipole states would provide information on the assignment of the levels and should also be a focus of additional future experimental work.
Modern theoretical methods still cannot provide a comprehensive description of all the important aspects of light nuclei (clustering, softness, shape coexistence, mean-field features like vortricity, etc.) with an acceptable computational effort. Thus a comparative analysis with different theoretical methods, e.g. AMD + GCM and QRPA, is presently the best way to proceed. Additional methods taking into account the coupling with complex configurations, e.g. the shell-model approach, are also welcome. Between various models, AMD + GCM looks to be the most powerful and promising tool. Indeed, using a sufficiently large set of basis functions, this model can potentially describe both cluster and mean-field degrees of freedom and take into account the shape coexistence. In addition, the AMD + GCM results are physically transparent. However it is not yet easy to exploit the full potential of AMD + GCM calculations as then we need a large basis set and thus a huge computational effort. At present, the most realistic way is to combine AMD + GCM with other models as was done in our study.
Acknowledgements.
The authors thank the Accelerator Group at iThemba LABS for the high-quality dispersion-matched beam provided for this experiment. PA acknowledges support from the Claude Leon Foundation in the form of a postdoctoral fellowship, and thanks M. N. Harakeh for providing the belgen and fermden codes and helpful advice regarding the DWBA calculations, and Josef Cseh for useful discussions concerning 28Si . RN acknowledges support from the NRF through Grant No. 85509. VON and JK thank Dr. A. Repko for the QRPA code. The work was partly supported by Votruba - Blokhintsev (Czech Republic - BLTP JINR) grant (VON and JK) and a grant of the Czech Science Agency, Project No. 19-14048S (JK). VON and PGR appreciate the Heisenberg-Landau grant (Germany DLTP JINR).Appendix A Details of DWBA calculations
In past studies, e.g. Gupta et al. (2015, 2016); Youngblood et al. (1999), the real part of the potential has been calculated using a folding model, and the imaginary part of the potential has been determined by fitting to elastic-scattering data. Due to time limitations, especially in moving the detectors from the high-dispersion focal plane to the medium-dispersion focal plane of the K600, it was not possible to take elastic-scattering data for this purpose. Instead, the Nolte, Machner and Bojowald optical-model potential was used. For this potential, the reduced radii are fm and fm for the real and imaginary part of the potential, respectively. Other parameters, such as the diffuseness and the depths of the potentials are energy-dependent quantities, which are calculated separately for each entrance and exit channel.
For 24Mg, we employ the quadrupole deformation = 0.355 from Ref. Van Der Borg et al. (1979). Using this deformation and the reduced radius of the real potential, we compute (with the codes belgen and fermden Harakeh which have been made available at github.com/padsley/KVICodes) the using this deformation and the reduced radius of the real potential. This gives , which is in good agreement with the experimental value of . Using the measured values for 26Mg and 28Si, we obtain the quadrupole deformations of = 0.295 and = -0.255, respectively. The signs of these deformations (prolate in 26Mg and oblate in 28Si) were chosen following the discussion in Sec. V-A. Note that the above parameters of the quadrupole deformation are much smaller than the absolute values for those from the NNDC database bnl , , and for 24,26Mg and 28Si. This is because the NNDC quadrupole deformation parameters are determined assuming a uniform charge distribution, while we use the Fermi distribution for the mass.
Since the radii of the real and imaginary parts of the potential are different, we assumed that the deformation lengths for the real and imaginary parts of each of the potentials are the same:
| (9) |
where , , and is the mass number of the target Harakeh and Dieperink (1981). Additionally, following Refs. Borg et al. (1981); Harakeh and Woude (2001), we assume that the deformation lengths of the potential and the mass distribution are identical, i.e.
| (10) |
where the mass radius is and is determined from the reduced radius for the potential of Nolte, Machner and Bojowald Nolte et al. (1987). Using the description by Satchler Satchler (1987), the potential radius is where is the mass of the projectile. The relation (10) means that the potential and mass distributions evolve self-consistently.
For monopole transitions, we used the formf code Harakeh ; Ang to calculate the Satchler type-I form factor Satchler (1987). For dipole transitions, we employed the form factors from Ref. Harakeh and Dieperink (1981).
For each excitation state, the parameters were determined by comparing the corresponding experimental and DWBA differential cross sections, see Eq. (2). Then, using Eqs. (9) and (10), the values and were obtained.
The percentage of the monopole EWSR exhausted by a given state is given by Borg et al. (1981):
| (11) |
where is the monopole transition strength determined from Eq. (10) and
| (12) |
is the total transition strength for the state located at the excitation energy, and exhausting 100% of the monopole EWSR Borg et al. (1981). Here is the nucleon mass and is calculated from the Fermi mass distribution using the fermden code.
For dipole transitions, the fraction of the EWSR exhausted by a state is given by Borg et al. (1981):
| (13) |
where is the dipole transition strength, again from Eq. (10) and
| (14) |
is the total transition strength for the state lying at excitation energy, and exhausting 100% of the dipole EWSR Harakeh and Dieperink (1981). Here and are calculated from the real part of the optical-model potential using fermden, and is the half-density radius of the Fermi mass distribution. The parameter, , is generally small compared to the other quantities but is given by:
| (15) |
where MeV is the centroid energy of the isoscalar giant quadrupole resonance and MeV is the centroid energy of the isoscalar giant monopole resonance.
References
- [von Oertzen] et al. (2006) W. [von Oertzen], M. Freer, and Y. Kanada-En’yo, Physics Reports 432, 43 (2006), ISSN 0370-1573, URL http://www.sciencedirect.com/science/article/pii/S0370157306002626.
- Horiuchi et al. (2012a) H. Horiuchi, K. Ikeda, and K. Katō, Progress of Theoretical Physics Supplement 192, 1 (2012a), ISSN 0375-9687, eprint https://academic.oup.com/ptps/article-pdf/doi/10.1143/PTPS.192.1/5195150/192-1.pdf, URL https://doi.org/10.1143/PTPS.192.1.
- Hornberger et al. (2012) K. Hornberger, S. Gerlich, P. Haslinger, S. Nimmrichter, and M. Arndt, Rev. Mod. Phys. 84, 157 (2012), URL https://link.aps.org/doi/10.1103/RevModPhys.84.157.
- Kanada-En’yo and Horiuchi (2018) Y. Kanada-En’yo and H. Horiuchi, Front. Phys. (Beijing) 13, 132108 (2018).
- Chiba and Kimura (2015) Y. Chiba and M. Kimura, Phys. Rev. C 91, 061302 (2015), URL http://link.aps.org/doi/10.1103/PhysRevC.91.061302.
- Chiba et al. (2017) Y. Chiba, Y. Taniguchi, and M. Kimura, Phys. Rev. C 95, 044328 (2017), URL https://link.aps.org/doi/10.1103/PhysRevC.95.044328.
- Nesterenko et al. (2018) V. O. Nesterenko, A. Repko, J. Kvasil, and P.-G. Reinhard, Phys. Rev. Lett. 120, 182501 (2018), URL https://link.aps.org/doi/10.1103/PhysRevLett.120.182501.
- Nesterenko, Valentin et al. (2018) Nesterenko, Valentin, Kvasil, Jan, Repko, Anton, and Reinhard, Paul-Gerhard, EPJ Web Conf. 194, 03005 (2018), URL https://doi.org/10.1051/epjconf/201819403005.
- Nesterenko et al. (2019) V. O. Nesterenko, A. Repko, J. Kvasil, and P.-G. Reinhard, Phys. Rev. C 100, 064302 (2019), URL https://link.aps.org/doi/10.1103/PhysRevC.100.064302.
- Kanada-En’yo and Shikata (2017) Y. Kanada-En’yo and Y. Shikata, Phys. Rev. C 95, 064319 (2017), URL https://link.aps.org/doi/10.1103/PhysRevC.95.064319.
- Shikata et al. (2019) Y. Shikata, Y. Kanada-En’yo, and H. Morita, Progress of Theoretical and Experimental Physics 2019 (2019), ISSN 2050-3911, 063D01, eprint https://academic.oup.com/ptep/article-pdf/2019/6/063D01/28856574/ptz049.pdf, URL https://doi.org/10.1093/ptep/ptz049.
- Kanada-En’yo et al. (2018) Y. Kanada-En’yo, Y. Shikata, and H. Morita, Phys. Rev. C 97, 014303 (2018), URL https://link.aps.org/doi/10.1103/PhysRevC.97.014303.
- Kanada-En’yo and Shikata (2019) Y. Kanada-En’yo and Y. Shikata, Phys. Rev. C 100, 014301 (2019), URL https://link.aps.org/doi/10.1103/PhysRevC.100.014301.
- Chiba et al. (2019) Y. Chiba, Y. Kanada-En’yo, and Y. Shikata, arXiv preprint arXiv:1911.08734 (2019).
- Kvasil et al. (2011) J. Kvasil, V. O. Nesterenko, W. Kleinig, P.-G. Reinhard, and P. Vesely, Phys. Rev. C 84, 034303 (2011), URL https://link.aps.org/doi/10.1103/PhysRevC.84.034303.
- Reinhard et al. (2014) P.-G. Reinhard, V. O. Nesterenko, A. Repko, and J. Kvasil, Phys. Rev. C 89, 024321 (2014), URL https://link.aps.org/doi/10.1103/PhysRevC.89.024321.
- Kawabata et al. (2007) T. Kawabata, H. Akimune, H. Fujita, Y. Fujita, M. Fujiwara, K. Hara, K. Hatanaka, M. Itoh, Y. Kanada-En’yo, S. Kishi, et al., Physics Letters B 646, 6 (2007), ISSN 0370-2693, URL http://www.sciencedirect.com/science/article/pii/S0370269307000706.
- Adsley et al. (2017a) P. Adsley, D. G. Jenkins, J. Cseh, S. S. Dimitriova, J. W. Brümmer, K. C. W. Li, D. J. Marín-Lámbarri, K. Lukyanov, N. Y. Kheswa, R. Neveling, et al., Phys. Rev. C 95, 024319 (2017a), URL https://link.aps.org/doi/10.1103/PhysRevC.95.024319.
- Semenko (1981) S. Semenko, Sov. J. Nucl. Phys.(Engl. Transl.);(United States) 34 (1981).
- Repko et al. (2013) A. Repko, P.-G. Reinhard, V. O. Nesterenko, and J. Kvasil, Phys. Rev. C 87, 024305 (2013), URL https://link.aps.org/doi/10.1103/PhysRevC.87.024305.
- Nesterenko et al. (2016) V. Nesterenko, J. Kvasil, A. Repko, W. Kleinig, and P.-G. Reinhard, Physics of Atomic Nuclei 79, 842 (2016).
- Repko, A. et al. (2019) Repko, A., Nesterenko, V. O., Kvasil, J., and Reinhard, P. -G., Eur. Phys. J. A 55, 242 (2019), URL https://doi.org/10.1140/epja/i2019-12770-x.
- Harakeh and Woude (2001) M. N. Harakeh and A. Woude, Giant Resonances: fundamental high-frequency modes of nuclear excitation, vol. 24 (Oxford University Press on Demand, 2001).
- Garg and Colò (2018) U. Garg and G. Colò, Progress in Particle and Nuclear Physics 101, 55 (2018), ISSN 0146-6410, URL http://www.sciencedirect.com/science/article/pii/S0146641018300322.
- Gupta et al. (2016) Y. K. Gupta, U. Garg, J. Hoffman, J. Matta, P. V. M. Rao, D. Patel, T. Peach, K. Yoshida, M. Itoh, M. Fujiwara, et al., Phys. Rev. C 93, 044324 (2016), URL http://link.aps.org/doi/10.1103/PhysRevC.93.044324.
- Youngblood et al. (1999) D. H. Youngblood, Y.-W. Lui, and H. L. Clark, Phys. Rev. C 60, 014304 (1999), URL https://link.aps.org/doi/10.1103/PhysRevC.60.014304.
- Van Der Borg et al. (1979) K. Van Der Borg, M. Harakeh, and B. Nilsson, Nuclear Physics A 325, 31 (1979), ISSN 0375-9474, URL http://www.sciencedirect.com/science/article/pii/0375947479901490.
- Bertrand et al. (1978) F. E. Bertrand, K. van der Borg, A. G. Drentje, M. N. Harakeh, J. van der Plicht, and A. van der Woude, Phys. Rev. Lett. 40, 635 (1978), URL https://link.aps.org/doi/10.1103/PhysRevLett.40.635.
- Gupta et al. (2015) Y. Gupta, U. Garg, J. Matta, D. Patel, T. Peach, J. Hoffman, K. Yoshida, M. Itoh, M. Fujiwara, K. Hara, et al., Physics Letters B 748, 343 (2015), ISSN 0370-2693, URL http://www.sciencedirect.com/science/article/pii/S0370269315005316.
- Lu et al. (1986) H. J. Lu, S. Brandenburg, R. De Leo, M. N. Harakeh, T. D. Poelhekken, and A. van der Woude, Phys. Rev. C 33, 1116 (1986), URL https://link.aps.org/doi/10.1103/PhysRevC.33.1116.
- Soga et al. (1978) F. Soga, J. Schimizu, H. Kamitsubo, N. Takahashi, K. Takimoto, R. Wada, T. Fujisawa, and T. Wada, Phys. Rev. C 18, 2457 (1978), URL https://link.aps.org/doi/10.1103/PhysRevC.18.2457.
- Morsch et al. (1975) H. P. Morsch, D. Dehnhard, and T. K. Li, Phys. Rev. Lett. 34, 1527 (1975), URL https://link.aps.org/doi/10.1103/PhysRevLett.34.1527.
- Kamermans et al. (1979) R. Kamermans, H. Morsch, R. de Meijer, and J. Van Driel, Nuclear Physics A 314, 37 (1979), ISSN 0375-9474, URL http://www.sciencedirect.com/science/article/pii/0375947479905530.
- Morsch and Ellis (1976) H. Morsch and P. Ellis, Physics Letters B 64, 386 (1976), ISSN 0370-2693, URL http://www.sciencedirect.com/science/article/pii/0370269376901027.
- Adsley et al. (2018) P. Adsley, J. W. Brümmer, T. Faestermann, S. P. Fox, F. Hammache, R. Hertenberger, A. Meyer, R. Neveling, D. Seiler, N. de Séréville, et al., Phys. Rev. C 97, 045807 (2018), URL https://link.aps.org/doi/10.1103/PhysRevC.97.045807.
- Longland et al. (2012) R. Longland, C. Iliadis, and A. I. Karakas, Phys. Rev. C 85, 065809 (2012), URL http://link.aps.org/doi/10.1103/PhysRevC.85.065809.
- Longland et al. (2009) R. Longland, C. Iliadis, G. Rusev, A. P. Tonchev, R. J. deBoer, J. Görres, and M. Wiescher, Phys. Rev. C 80, 055803 (2009), URL http://link.aps.org/doi/10.1103/PhysRevC.80.055803.
- Schwengner et al. (2009) R. Schwengner, A. Wagner, Y. Fujita, G. Rusev, M. Erhard, D. De Frenne, E. Grosse, A. R. Junghans, K. Kosev, and K. D. Schilling, Phys. Rev. C 79, 037303 (2009), URL http://link.aps.org/doi/10.1103/PhysRevC.79.037303.
- Adsley et al. (2017b) P. Adsley, J. W. Brümmer, K. C. W. Li, D. J. Marín-Lámbarri, N. Y. Kheswa, L. M. Donaldson, R. Neveling, P. Papka, L. Pellegri, V. Pesudo, et al., Phys. Rev. C 96, 055802 (2017b), URL https://link.aps.org/doi/10.1103/PhysRevC.96.055802.
- Talwar et al. (2016) R. Talwar, T. Adachi, G. P. A. Berg, L. Bin, S. Bisterzo, M. Couder, R. J. deBoer, X. Fang, H. Fujita, Y. Fujita, et al., Phys. Rev. C 93, 055803 (2016), URL http://link.aps.org/doi/10.1103/PhysRevC.93.055803.
- Wühr et al. (1974) W. Wühr, A. Hofmann, and G. Philipp, Zeitschrift für Physik 269, 365 (1974).
- Van der Borg et al. (1977) K. Van der Borg, M. Harakeh, S. Van der Werf, A. Van der Woude, and F. Bertrand, Physics Letters B 67, 405 (1977), ISSN 0370-2693, URL http://www.sciencedirect.com/science/article/pii/0370269377904312.
- Toba et al. (1990) Y. Toba, Y.-W. Lui, D. H. Youngblood, U. Garg, P. Grabmayr, K. T. Knöpfle, H. Riedesel, and G. J. Wagner, Phys. Rev. C 41, 1417 (1990), URL https://link.aps.org/doi/10.1103/PhysRevC.41.1417.
- Youngblood et al. (1998) D. H. Youngblood, H. L. Clark, and Y.-W. Lui, Phys. Rev. C 57, 1134 (1998), URL https://link.aps.org/doi/10.1103/PhysRevC.57.1134.
- Youngblood et al. (2002) D. H. Youngblood, Y.-W. Lui, and H. L. Clark, Phys. Rev. C 65, 034302 (2002), URL https://link.aps.org/doi/10.1103/PhysRevC.65.034302.
- Roy et al. (1992) S. Roy, T. Dey, A. Goswami, S. N. Chintalapudi, and S. R. Banerjee, Phys. Rev. C 45, 2904 (1992), URL https://link.aps.org/doi/10.1103/PhysRevC.45.2904.
- Morsch (1976) H. Morsch, Physics Letters B 61, 15 (1976), ISSN 0370-2693, URL http://www.sciencedirect.com/science/article/pii/0370269376905499.
- Bender et al. (2003) M. Bender, P.-H. Heenen, and P.-G. Reinhard, Rev. Mod. Phys. 75, 121 (2003), URL https://link.aps.org/doi/10.1103/RevModPhys.75.121.
- Repko et al. (2015) A. Repko, J. Kvasil, V. O. Nesterenko, and P. G. Reinhard, Skyrme rpa for spherical and axially symmetric nuclei (2015), eprint 1510.01248.
- Repko et al. (2017) A. Repko, J. Kvasil, V. O. Nesterenko, and P. G. Reinhard, The European Physical Journal A 53, 221 (2017), ISSN 1434-601X, URL https://doi.org/10.1140/epja/i2017-12406-3.
- Repko et al. (2019) A. Repko, J. Kvasil, and V. O. Nesterenko, Phys. Rev. C 99, 044307 (2019), URL https://link.aps.org/doi/10.1103/PhysRevC.99.044307.
- Kvasil et al. (2016) J. Kvasil, V. O. Nesterenko, A. Repko, W. Kleinig, and P.-G. Reinhard, Phys. Rev. C 94, 064302 (2016), URL https://link.aps.org/doi/10.1103/PhysRevC.94.064302.
- Neveling et al. (2011) R. Neveling, H. Fujita, F. Smit, T. Adachi, G. Berg, E. Buthelezi, J. Carter, J. Conradie, M. Couder, R. Fearick, et al., Nuclear Instruments and Methods in Physics Research Section A: Accelerators, Spectrometers, Detectors and Associated Equipment 654, 29 (2011), ISSN 0168-9002, URL http://www.sciencedirect.com/science/article/pii/S0168900211012460.
- Tamii et al. (2009) A. Tamii, Y. Fujita, H. Matsubara, T. Adachi, J. Carter, M. Dozono, H. Fujita, K. Fujita, H. Hashimoto, K. Hatanaka, et al., Nuclear Instruments and Methods in Physics Research Section A: Accelerators, Spectrometers, Detectors and Associated Equipment 605, 326 (2009), ISSN 0168-9002, URL http://www.sciencedirect.com/science/article/pii/S0168900209007463.
- Kawabata (2013) T. Kawabata, Few-Body Systems 54, 1457 (2013), ISSN 1432-5411, URL http://dx.doi.org/10.1007/s00601-013-0615-3.
- Borg et al. (1981) K. V. D. Borg, M. Harakeh, and A. V. D. Woude, Nuclear Physics A 365, 243 (1981), ISSN 0375-9474, URL http://www.sciencedirect.com/science/article/pii/0375947481902979.
- Ziegler et al. (2010) J. F. Ziegler, M. D. Ziegler, and J. P. Biersack, Nuclear Instruments and Methods in Physics Research B 268, 1818 (2010).
- Li et al. (2017) K. C. W. Li, R. Neveling, P. Adsley, P. Papka, F. D. Smit, J. W. Brümmer, C. A. Diget, M. Freer, M. N. Harakeh, T. Kokalova, et al., Phys. Rev. C 95, 031302 (2017), URL https://link.aps.org/doi/10.1103/PhysRevC.95.031302.
- P.D. Kunz and Endres (2009) m. b. M. E. P.D. Kunz and J. Endres, Chuck3 (2009).
- ENS (2015) ENSDF, NNDC online data service, ENSDF database, http://www.nndc.bnl.gov/ensdf/ (2015).
- Adsley et al. (2020) P. Adsley, U. Battino, A. Best, A. Caciolli, A. Guglielmetti, G. Imbriani, H. Jayatissa, M. La Cognata, L. Lamia, E. Masha, et al., arXiv preprint arXiv:2005.14482 (2020).
- deBoer et al. (2010) R. J. deBoer, M. Wiescher, J. Görres, R. Longland, C. Iliadis, G. Rusev, and A. P. Tonchev, Phys. Rev. C 82, 025802 (2010), URL http://link.aps.org/doi/10.1103/PhysRevC.82.025802.
- Massimi et al. (2012) C. Massimi, P. Koehler, S. Bisterzo, N. Colonna, R. Gallino, F. Gunsing, F. Käppeler, G. Lorusso, A. Mengoni, M. Pignatari, et al., Phys. Rev. C 85, 044615 (2012), URL http://link.aps.org/doi/10.1103/PhysRevC.85.044615.
- Alford et al. (1986) W. Alford, J. Cameron, E. Habib, and B. Wildenthal, Nuclear Physics A 454, 189 (1986), ISSN 0375-9474, URL http://www.sciencedirect.com/science/article/pii/0375947486902642.
- Hunt et al. (2019) S. Hunt, C. Iliadis, A. Champagne, L. Downen, and A. Cooper, Phys. Rev. C 99, 045804 (2019), URL https://link.aps.org/doi/10.1103/PhysRevC.99.045804.
- Wolke et al. (1989) K. Wolke, V. Harms, H. W. Becker, J. W. Hammer, K. L. Kratz, C. Rolfs, U. Schröder, H. P. Trautvetter, M. Wiescher, and A. Wöhr, Zeitschrift für Physik A Atomic Nuclei 334, 491 (1989), ISSN 0939-7922, URL https://doi.org/10.1007/BF01294757.
- Giesen et al. (1993) U. Giesen, C. Browne, J. Görres, S. Graff, C. Iliadis, H.-P. Trautvetter, M. Wiescher, W. Harms, K. Kratz, B. Pfeiffer, et al., Nuclear Physics A 561, 95 (1993), ISSN 0375-9474, URL http://www.sciencedirect.com/science/article/pii/037594749390167V.
- Drotleff et al. (1993) H. W. Drotleff, A. Denker, H. Knee, M. Soine, G. Wolf, J. W. Hammer, U. Greife, C. Rolfs, and H. P. Trautvetter, Astrophys. J. 414, 735 (1993).
- Jaeger et al. (2001) M. Jaeger, R. Kunz, A. Mayer, J. W. Hammer, G. Staudt, K. L. Kratz, and B. Pfeiffer, Phys. Rev. Lett. 87, 202501 (2001), URL http://link.aps.org/doi/10.1103/PhysRevLett.87.202501.
- Jayatissa et al. (2020) H. Jayatissa, G. Rogachev, V. Goldberg, E. Koshchiy, G. Christian, J. Hooker, S. Ota, B. Roeder, A. Saastamoinen, O. Trippella, et al., Physics Letters B 802, 135267 (2020), ISSN 0370-2693, URL http://www.sciencedirect.com/science/article/pii/S037026932030071X.
- Ota et al. (2020) S. Ota, G. Christian, G. Lotay, W. Catford, E. Bennett, S. Dede, D. Doherty, S. Hallam, J. Hooker, C. Hunt, et al., Physics Letters B 802, 135256 (2020), ISSN 0370-2693, URL http://www.sciencedirect.com/science/article/pii/S0370269320300605.
- Adsley et al. (2019) P. Adsley, A. Laird, and Z. Meisel, arXiv preprint arXiv:1912.11826 (2019).
- Chabanat et al. (1998) E. Chabanat, P. Bonche, P. Haensel, J. Meyer, and R. Schaeffer, Nuclear Physics A 635, 231 (1998), ISSN 0375-9474, URL http://www.sciencedirect.com/science/article/pii/S0375947498001808.
- Kleinig et al. (2008) W. Kleinig, V. O. Nesterenko, J. Kvasil, P.-G. Reinhard, and P. Vesely, Phys. Rev. C 78, 044313 (2008), URL https://link.aps.org/doi/10.1103/PhysRevC.78.044313.
- P.-G. Reinhard (2021) J. M. P.-G. Reinhard, B. Schuetrumpf, Comp. Phys. Communic. 258, 107603 (2021).
- (76) N. Stone, Table of nuclear magnetic dipole and electric quadrupole moments.
- Watanabe et al. (2014) S. Watanabe, K. Minomo, M. Shimada, S. Tagami, M. Kimura, M. Takechi, M. Fukuda, D. Nishimura, T. Suzuki, T. Matsumoto, et al., Physical Review C 89, 044610 (2014).
- Horiuchi et al. (2012b) W. Horiuchi, T. Inakura, T. Nakatsukasa, and Y. Suzuki, Phys. Rev. C 86, 024614 (2012b), URL https://link.aps.org/doi/10.1103/PhysRevC.86.024614.
- (79) From ensdf database as of june 22nd, 2020. version available at http://www.nndc.bnl.gov/ensarchivals/.
- Nilsson (1965) S. Nilsson, Mat. Fys. Medd. Dan. Vid. Selsk. 29, 16 (1965).
- Mottelson and Nilsson (1959) B. Mottelson and S. G. Nilsson, Mat. Fys. Skr. Dan. Vid. Selsk 1, 8 (1959).
- Malov et al. (1976) L. Malov, V. Nesterenko, and V. Soloviev, Physics Letters B 64, 247 (1976), ISSN 0370-2693, URL http://www.sciencedirect.com/science/article/pii/037026937690191X.
- Abgrall et al. (1980) Y. Abgrall, B. Morand, E. Caurier, and B. Grammaticos, Nuclear Physics A 346, 431 (1980), ISSN 0375-9474, URL http://www.sciencedirect.com/science/article/pii/0375947480904789.
- Jang (1983) S. Jang, Nuclear Physics A 401, 303 (1983), ISSN 0375-9474, URL http://www.sciencedirect.com/science/article/pii/0375947483905316.
- Peach et al. (2016) T. Peach, U. Garg, Y. K. Gupta, J. Hoffman, J. T. Matta, D. Patel, P. V. M. Rao, K. Yoshida, M. Itoh, M. Fujiwara, et al., Phys. Rev. C 93, 064325 (2016), URL https://link.aps.org/doi/10.1103/PhysRevC.93.064325.
- Taniguchi and Kimura (2020) Y. Taniguchi and M. Kimura, Physics Letters B 800, 135086 (2020), ISSN 0370-2693, URL http://www.sciencedirect.com/science/article/pii/S0370269319308081.
- Firestone (2007) R. B. Firestone, Nuclear Data Sheets 108, 2319 (2007).
- Péru and Goutte (2008) S. Péru and H. Goutte, Phys. Rev. C 77, 044313 (2008), URL https://link.aps.org/doi/10.1103/PhysRevC.77.044313.
- Péru, S. and Martini, M. (2014) Péru, S. and Martini, M., Eur. Phys. J. A 50, 88 (2014), URL https://doi.org/10.1140/epja/i2014-14088-7.
- Ikeda et al. (1968) K. Ikeda, N. Takigawa, and H. Horiuchi, Progress of Theoretical Physics Supplement E68, 464 (1968).
- Baye (1976) D. Baye, Nuclear Physics A 272, 445 (1976), ISSN 0375-9474, URL http://www.sciencedirect.com/science/article/pii/0375947476903420.
- Baye and Heenen (1977) D. Baye and P.-H. Heenen, Nuclear Physics A 283, 176 (1977), ISSN 0375-9474, URL http://www.sciencedirect.com/science/article/pii/0375947477907060.
- Taniguchi et al. (2009) Y. Taniguchi, Y. Kanada-En’yo, and M. Kimura, Phys. Rev. C 80, 044316 (2009), URL https://link.aps.org/doi/10.1103/PhysRevC.80.044316.
- Darai et al. (2012) J. Darai, J. Cseh, and D. G. Jenkins, Phys. Rev. C 86, 064309 (2012), URL http://link.aps.org/doi/10.1103/PhysRevC.86.064309.
- Jenkins et al. (2012) D. G. Jenkins, C. J. Lister, M. P. Carpenter, P. Chowdury, N. J. Hammond, R. V. F. Janssens, T. L. Khoo, T. Lauritsen, D. Seweryniak, T. Davinson, et al., Phys. Rev. C 86, 064308 (2012), URL https://link.aps.org/doi/10.1103/PhysRevC.86.064308.
- Tanabe et al. (1983) T. Tanabe, K. Haga, M. Yasue, K. Sato, K. Ogino, Y. Kadota, M. Tochi, K. Makino, T. Kitahara, and T. Shiba, Nuclear Physics A 399, 241 (1983), ISSN 0375-9474, URL http://www.sciencedirect.com/science/article/pii/0375947483906061.
- et al. (1990) K. P. A. et al., Yad. Fiz. 51, 1220 (1990).
- Bas (2013) Nuclear Data Sheets 114, 1189 (2013).
- Kimura et al. (2017) M. Kimura, Y. Chiba, and Y. Taniguchi, Journal of Physics: Conference Series 863, 012024 (2017), URL http://stacks.iop.org/1742-6596/863/i=1/a=012024.
- Iachello (1985) F. Iachello, Physics Letters B 160, 1 (1985), ISSN 0370-2693, URL http://www.sciencedirect.com/science/article/pii/0370269385914558.
- Spieker et al. (2015) M. Spieker, S. Pascu, A. Zilges, and F. Iachello, Phys. Rev. Lett. 114, 192504 (2015), URL https://link.aps.org/doi/10.1103/PhysRevLett.114.192504.
- (102) M. N. Harakeh, Private communication.
- Harakeh and Dieperink (1981) M. N. Harakeh and A. E. L. Dieperink, Phys. Rev. C 23, 2329 (1981), URL https://link.aps.org/doi/10.1103/PhysRevC.23.2329.
- Nolte et al. (1987) M. Nolte, H. Machner, and J. Bojowald, Phys. Rev. C 36, 1312 (1987), URL https://link.aps.org/doi/10.1103/PhysRevC.36.1312.
- Satchler (1987) G. Satchler, Nuclear Physics A 472, 215 (1987), ISSN 0375-9474, URL http://www.sciencedirect.com/science/article/pii/0375947487902089.
- (106) Angcorpackage, https://github.com/padsley/AngCorPackage.