Relativistic reflection in NGC 4151
Abstract
We investigate the X-ray spectrum of the Seyfert galaxy NGC 4151 using the simultaneous Suzaku/NuSTAR observation and flux-resolved INTEGRAL spectra supplemented by Suzaku and XMM observations. Our best spectral solution indicates that the narrow Fe K line is produced in Compton-thin matter at the distance of several hundred gravitational radii. In such a model, we find a weak but significant relativistic reflection from a disk truncated at about ten gravitational radii when the source is in bright X-ray states. We do not find evidence either for or against the presence of relativistic reflection in the dim X-ray state. We also rule out models with X-ray emission dominated by a source located very close to the black hole horizon, which was proposed in previous works implementing the lamp-post geometry for this source. We point out that accurate computation of the thermal Comptonization spectrum and its distortion by strong gravity is crucial in applications of the lamp-post geometry to the NuSTAR data.
1 Introduction
NGC 4151 is a nearby (), archetypal Seyfert 1 galaxy, hosting a supermassive black hole with the mass estimated to – (Bentz et al., 2006; Hönig et al., 2014; Onken et al., 2014). It is among the brightest Seyfert galaxies in the hard X-ray range and has been extensively studied by all major X-ray missions. This observational effort revealed a significant complexity of its X-ray spectrum, which includes a blend of several emission and absorption components. The intrinsic X-ray emission seems to be produced by thermal Comptonization (but see Beloborodov, 2017) and it is accompanied by a strong narrow Fe K emission line as well as a Compton reflection component (e.g. Zdziarski et al., 1996; de Rosa et al., 2007; Lubiński et al., 2010). The nuclear radiation is strongly absorbed below 5 keV by an inhomogeneous material with cm-2, consisting of multiple layers of a neutral and ionized gas along the line of sight (e.g. Zdziarski et al., 2002; Kraemer et al., 2008), some of which undergo rapid changes on a time-scale of days (Puccetti et al., 2007). An additional soft X-ray emission, which has been spatially resolved on a hundreds of pc scale (e.g. Yang et al., 2001), dominates the spectrum below 2 keV and may be produced by scattering of the central continuum into our line of sight (e.g. Weaver et al., 1994).
Studies of relativistic reflection, which could indicate the presence of an optically thick disk at a distance of tens gravitational radii () or closer, give inconclusive results. No evidence of a relativistically broadened reflection was found e.g. by Schurch et al. (2003), Zoghbi et al. (2019), whereas a weak reflection from a truncated disk was estimated by Wang et al. (2001); Zdziarski et al. (2002). Zoghbi et al. (2012) reported measurement of energy-dependent lags with an energy profile resembling a relativistically broadened iron line. However, a variety of different profiles were measured later in NGC 4151 by Zoghbi et al. (2019), who then attributed the lags to variations in the absorber rather than to reverberation of the relativistic reflection. Then, using a long-look simultaneous Suzaku/NuSTAR observation, Keck et al. (2015) claimed evidence for reflection from an untruncated disk with a strongly increased emissivity close to the black hole. Such a steep inner emissivity motivates the lamp-post geometry of Martocchia & Matt (1996), with the X-ray source located on the symmetry axis of the system, very low above the black hole. A detailed lamp-post model explaining this observation, again including an untruncated disk whose irradiation is strongly dominated by a source located extremely close to the black hole horizon, was later presented by Beuchert et al. (2017).
However, the computational model used for these lamp-post fitting results involved significant inconsistencies in the implementation of general relativity (GR), see discussion in Niedźwiecki et al. (2016, 2019). In particular, radiation produced so close to the black hole is strongly redshifted, so the rest-frame spectral cutoff, related to the temperature of the X-ray source, occurs at an energy much larger than seen by a distant observer. For the most extreme lamp-post models, e.g. that fitted to NGC 4151, this implies that the rest-frame electron temperature is much larger than 100 keV. The nthcomp model (Zdziarski et al., 1996), applied in the lamp-post model of Beuchert et al. (2017), does not properly reproduce the Comptonization spectrum at such large temperatures. The related problems where omitted in their model by neglecting the redshift, which is unphysical. Furthermore, Comptonization spectra deviate from a power-law at relativistic electron temperatures, so using accurate thermal Comptonization models does not only give a more precise rest-frame temperature, but it may actually invalidate the overall fit.
Here we reconsider the Suzaku/NuSTAR observation to demonstrate how using the proper GR affects the fitting results. We study how the assumed absorption model and the origin of the narrow Fe K line affect the inferred parameters of relativistic reflection. We also apply the developed spectral models to other archival data sets including hard X-ray observations of NGC 4151, as data in this energy range are crucial for constraining the Comptonization process. Specifically, we use the INTEGRAL observations in the dim and bright state (Lubiński et al., 2010), supplemented by XMM (bright state) and Suzaku (dim state) observations, which correspond to the extrema of hard X-ray flux measured in NGC 4151 by contemporary detectors.
2 Data reduction
We use the following three archival data sets providing a broadband coverage of the X-ray spectrum, referred to as the spectral sets N, D and B:
N. The simultaneous Suzaku and NuSTAR observation on 2012 November 11–14. Here we use the same data as Keck et al. (2015) and Beuchert et al. (2017), and apply the same data reduction procedure.
D. The stacked INTEGRAL observations performed between 2005 April 29 and 2007 May 25 in the ’dim’ state of NGC 4151 (as defined by Lubiński et al., 2010), i.e. at the 18-50 keV ISGRI photon flux below s-1 cm-2, supplemented by the long-look Suzaku observation on 2006 December 18–21, when the source was in that state. Here we use the same data as Lubiński et al. (2010), and we apply the same data reduction procedure.
B. The INTEGRAL observation during 2003 May 23–28 in the ’bright’ state of NGC 4151 (as defined by Lubiński et al., 2010), at the 18-50 keV ISGRI flux s-1 cm-2, supplemented by a partially simultaneous XMM observations performed during 2003 May 25–27, obs. id 0143500101 (X1), 0143500201 (X2) and 0143500301 (X3). Here, we use the same data as Lubiński et al. (2010), and apply the same data reduction procedure. The observations X1 and X2 have been added, and called X12. Observation X3 is treated separately, see Section 3.1.2.
The Suzaku data have been extracted and reduced using the aepipeline script, with the calibration release from 2015-10-05 for XIS and the calibration release from 2011-09-15 for HXD. The NuSTAR data have been reduced with the nupipeline script, using the standard NuSTAR Data Analysis Software NuSTARDAS-v.1.4.1 with the NuSTAR CALDB from 2015-10-08. The XMM/EPIC pn data have been reduced using the XMM Science Analysis Software version 8.0.1 with the standard selection criteria and excluding periods of high or unstable background. The INTEGRAL/ISGRI data have been reduced using the Offline Scientific Analysis 7.0 provided by the INTEGRAL Science Data Centre, with the pipeline parameters set to the default values.
| Observations | Cross-calibration constants | & probability | ||||||||
| Instrument | Start date | End date | Exposure [ks] | model 3 | model 4 | model 6 | model 3 | model 4 | model 6 | |
| D | Suzaku | 2006-12-18 | 2006-12-21 | 125 | 1.0 | 1.0 | 1.0 | 534/407 | 528/410 | 557/417 |
| INTEGRAL | 2005-04-29 | 2007-05-25 | 651 | 0.997 | ||||||
| N | Suzaku | 2012-11-11 | 2012-11-13 | 150 | 1.0 | 1.0 | 1.0 | 702/453 | 577/458 | 605/458 |
| NuSTAR | 2012-11-12 | 2012-11-15 | 140 | 1.0 | ||||||
| B | XMM (X12) | 2003-05-25 | 2003-05-27 | 17 | 1.0 | 1.0 | 1.0 | 697/701 | 685/703 | 690/703 |
| XMM (X3) | 2003-05-27 | 2003-05-27 | 12 | 0.918 | ||||||
| INTEGRAL | 2003-05-23 | 2003-05-28 | 271 | |||||||
| Joint fit | 1933/1567 | 1790/1573 | 1852/1583 | |||||||
| 1.0 | ||||||||||
For the spectral analysis, we use the data in the range of 2.5–9 keV from the XIS front-illuminated (FI, XIS 0 + XIS 3) detectors, 2.5–7.5 from the XIS back-illuminated (BI, XIS 1) detector and 14–60 keV from the PIN, all on board Suzaku, 5–79 keV from the NuSTAR FPM A and B detectors, 2.5–9.5 keV from the XMM/EPIC pn and 20–200 keV from the INTEGRAL/ISGRI detectors. The data sets from XIS and EPIC pn detectors were binned using the same condition on the minimal signal-to-noise ratio (S/N) of 10. For PIN, both FPM and ISGRI instruments, we use the condition of S/N = 40, 100 and 3, respectively. For XIS, EPIC pn and FPM detectors this gives the width of the spectral bins of about 20 eV around 6.4 keV.
In the spectral analysis, we apply cross-normalization constants to all detectors relative to the co-added XIS-FI data for spectra D and N and relative to X12 EPIC pn for spectrum B. The cross-normalization constant for INTEGRAL/ISGRI and NuSTAR in our best-fitting spectral models are given in Table 1. In all models for spectrum D, the XIS-BI/XIS-FI cross-normalization is fitted at the nominal value, . In all models for spectrum N, the XIS-BI/XIS-FI cross-normalization is fitted at a lower value, , which is still reasonable (see Keck et al., 2015). The cross-normalization factor of PIN relative to XIS-FI is fitted with in all cases.
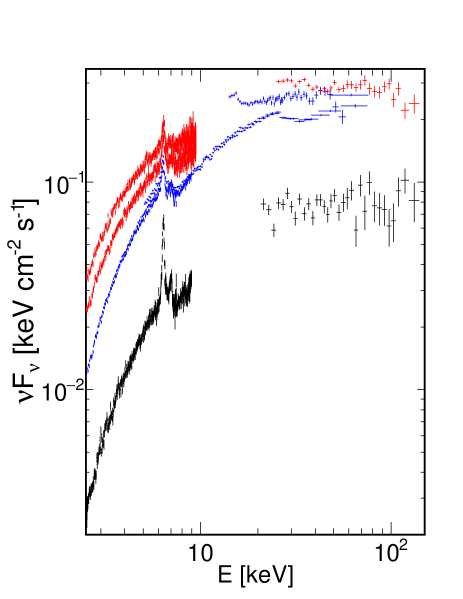
The definition of spectral sets D and B follows from the finding that the intrinsic X-ray spectrum of NGC 4151 changes systematically with the change of its intrinsic X-ray luminosity, see Lubiński et al. (2010). Figure 1 shows the three spectral sets used in this work. The Swift/BAT photon flux during the Suzaku observation of spectral set D, s-1 cm-2, was higher than the average ISGRI flux for all D observations, s-1 cm-2, which justifies the lower than 1 values of the ISGRI normalization relative to Suzaku for this spectrum (see Table 1).
3 Spectral analysis
3.1 Spectral components
NGC 4151 is well known for a significant complexity of its X-ray spectrum, which requires several components to be included in the spectral model. We describe here computational models used for these components in our analysis.
3.1.1 Primary radiation and its reflection from the inner disk
Our main results are obtained using the relativistic reflection models reflkerr and reflkerr_lp of Niedźwiecki et al. (2019). These models involve an accurate computation of the thermal Comptonization spectrum. In particular, they properly describe the distortion of Comptonization spectra in strong gravity. We also recover the lamp-post results of Beuchert et al. (2017) in the model using relxilllpCp (Dauser et al., 2014), where the strong gravity effects on the direct spectrum have been neglected.
In reflkerr and reflkerr_lp, the primary radiation is modeled with compps (Poutanen & Svensson, 1996), originally parametrized by the optical depth, , electron temperature, , and the black-body temperature of seed photons, . In our implementation of compps, the photon spectral index, , can be used instead of . All our results correspond to the spherical geometry of the X-ray source (geometry=0 in compps) and we use a constant eV, which is the characteristic disk temperature at the BH mass and the luminosity of NGC 4151, see, e.g., Lubiński et al. (2010).
In relxilllpCp, the primary radiation is computed with nthcomp, parametrized by and the photon spectral index, . This model is inaccurate at high and then it is not suitable for computing the spectra affected by strong gravity (see Niedźwiecki et al., 2019). Beuchert et al. (2017) override this problem by neglecting the effect of the gravitational shift on the nthcomp spectrum, which then implies that the spectrum in the X-ray source frame is strongly blueshifted. However, at the relativistic rest-frame implied by this blueshift, the Comptonization spectrum deviates from a power-law, which effect is not reproduced properly by nthcomp. Comparing the results obtained with relxilllpCp and reflkerr_lp shows that this is a crucial issue for relativistic reflection models.
The lamp-post models, reflkerr_lp and relxilllpCp, are parametrized by the black-hole spin parameter, , the X-ray source height, , the inner and outer radius of the disk, and (, and are in units of ), and the inclination angle, . The reflection strength (i.e. the normalization of the observed reflection with respect to the direct spectral component from the X-ray source) is strictly determined for the lamp-post geometry and we do not treat it as a free parameter; however, in the application of relxilllpCp, we relax this physical constraint in order to reproduce the results of Beuchert et al. (2017). In reflkerr, a phenomenological radial emissivity, , is assumed. This version may approximate physical models with various geometries of the X-ray source; therefore, here the reflection fraction, , is treated as a free parameter. The definition of used here follows Niedźwiecki et al. (2019), i.e. corresponds to the fluxes of radiation incident on the disk and contributing to the directly observed component being equal. reflkerr is parametrized by , , , , and .
The rest-frame reflection is described by xillver (García et al., 2013) in relxilllpCp and by hreflect (Niedźwiecki et al., 2019) in reflkerr and reflkerr_lp; hreflect modifies xillver by using a more accurate model for Compton reflection of Magdziarz & Zdziarski (1995). In both models, the reflector is characterized by the iron abundance with respect to solar, ZFe, and the ionization parameter, .
3.1.2 Absorption
A variety of absorption models have been applied to fit the X-ray spectra of NGC 4151, typically involving at least two absorbers. Here we consider models similar to those used in recent works, including two neutral as well as either one (as in Beuchert et al., 2017) or two (as in Keck et al., 2015; Zoghbi et al., 2019) ionized absorbers, and allowing them to only partially cover the source. The neutral absorption is described by ztbabs and modified by partcov, which converts it to partial covering absorption. The ionized absorption is described using the zxipcf model. ztbabs is parametrized by the column density, , and the redshift which in this component is always set to . partcov is parametrized by the covering fraction, . zxipcf is parametrized by , , and . This model assumes a rather small turbulent velocity of km/s; we have checked that replacing it with warmabs with km/s does not affect our results.
Following Beuchert et al. (2017), we also considered an absorption line at keV, modeled with gabs, which may be due to an ultrafast outflow. We found that it improves the fits to the spectral set N by for three additional free parameters. However, its inclusion does not affect the fitted parameters of other spectral components. Furthermore, we do not find evidence for such an additional line in either B or D spectrum. Therefore, we neglected it for the results presented below. Instead, taking into account that fast outflows of the ionized absorbers are often observed, we allow the zxipcf components to be blueshifted in the host galaxy frame by allowing their redshift parameters to vary with .
In the data set B, the observations X1 and X2 exhibit consistent soft X-ray spectra, therefore, we use these observations added together and refer to this stacked spectrum as X12. The observation X3 shows a different absorption level (see Lubiński et al., 2010). Then, we consider separately X12 and X3 by applying slightly different absorption. In order to minimize the number of free parameters, we vary only of one of the neutral absorbers between these two spectra.
3.1.3 Narrow Fe K lines and the distant reflection
NGC 4151 exhibits a strong, narrow line at keV, which may be produced, e.g., in (i) a pc-scale ( for ) torus (Schurch et al., 2003), (ii) a cold, intermediate disk at a distance of several hundred (Miller et al., 2018), or (iii) clouds located from the center (Zoghbi et al., 2019). In cases (i) and (iii), the reprocessor can be either Compton-thick or Compton-thin. In cases (ii) and (iii), the line should be (weakly) relativistically distorted. Taking these possibilities into account, we consider the following models:
(i) Reflection from Compton-thick, static matter. We assume that the reflector is optically-thick, neutral, distant and static (i.e. the reflected spectrum is affected only by the cosmological redshift) and has the same as the inner disk. We describe reflection from such a material using hreflect with and the incident spectrum given by the main Comptonization component of our reflkerr model. The reflection strength of the distant reflection is a free parameter and has a simple interpretation of where is the solid angle subtended by the reflector at the central X-ray source. This model describes a reflector located beyond (i.e. the distance at which a relativistic distortion is below the energy resolution of Suzaku or XMM), e.g. a molecular torus, and is represented by model 5 in Section 3.3. The distant reflector is likely geometrically thick, however, its spatial configuration, in particular the orientation of the reflecting surface with respect to the observer, is uncertain. We assumed for this reflection component. We checked that this assumption does not affect our results (the only significant change for using different in the model 5 concerns the fitted value of , e.g. for , whereas for ).
(ii) Relativistically blurred, Compton-thick reflection. The reflection here is described by hreflect, similar as in (i), with an additional weak relativistic blurring described by rdblur, which is the convolution version of the diskline model of Fabian et al. (1989). rdblur has certain advantages over reflkerr in modeling the narrow line. First, it allows to compute emission from a disk extending beyond , whereas reflkerr has a limit of . Second, it has no limit on the disk inclination (which appears to be important for NGC 4151), whereas reflkerr has a limit of . For hreflect we assume , we link ZFe to the inner disk, and we treat the reflection strength, , as a free parameter. This model may describe reflection from the intermediate disk and large values of may be explained by a warp or a concave structure of the outer disk. Then, we use the same inclination angle in rdblur and hreflect, but we allow it to be different than the inner disk inclination angle in reflkerr. We also fix of reflkerr to equal of rdblur. The fitted value of this parameter would physically correspond to the radius beyond which the disk is significantly warped. This case is represented by model 6 in Section 3.3.
(iii) Compton-thin emission. A Compton-thin material can emit a strong Fe K line, with the equivalent width (EW) eV at the column density cm-2 (e.g. Matt et al., 2003), without producing a strong Compton-reflected continuum. We phenomenologically describe the fluorescent iron emission using two Gaussian components representing the Fe K and K lines with an appropriate branching ratio (with the flux ratio equal to , e.g. Basko, 1978) and the same relative intrinsic widths. We allow these lines to be shifted in energy, assuming that the energy shift is the same for both lines, i.e. their centroid energies are linked at . The Gaussians are computed with the zgauss model for , so the fitted and give the line energies in the host galaxy frame. This description of the narrow lines is used in all models in Section 3.2 and in model 4 in Section 3.3.
3.1.4 Soft X-ray component
Our study is focused on the central X-ray source; therefore, we neglect the data below 2.5 keV, at which emission from a large-scale gas starts to dominate. However, we take into account a possible contribution of this extended emission at higher energies and, following Beuchert et al. (2017), we assume that it is a nuclear continuum scattered off a distant matter, and model it as an unabsorbed compps spectrum (or nthcomp spectrum in the model with relxilllpCp) with the parameters of the main Comptonization component (except for normalization, which is free).
We find that adding this component is of minor importance. In all cases, its contribution is at most a few per cent at keV and negligible at higher energies. Furthermore, its inclusion improves our fits by at most and it does not affect the fitted values of other model parameters.
| model 1: tbabs*(zxipcf*(partcov*ztbabs)*(partcov*ztbabs)*(nthcomp+relxilllpCp+relxilllpCp+zgauss+zgauss)+nthcomp) | |||||
| model 2: tbabs*(zxipcf*(partcov*ztbabs)*(partcov*ztbabs)*(reflkerr_lp+reflkerr_lp+zgauss+zgauss)+compps) | |||||
| model 3: tbabs*(zxipcf*zxipcf*(partcov*ztbabs)*(partcov*ztbabs)*(reflkerr_lp+reflkerr_lp+zgauss+zgauss)+compps) | |||||
| Model component | model 1 | model 2 | model 3 | ||
| N | N | D | N | B | |
| warm absorber: | zxipcf | ||||
| warm absorber: | zxipcf | ||||
| - | - | - | |||
| - | - | - | |||
| - | - | - | |||
| - | - | - | |||
| neutral absorber: | partcov*ztbabs | ||||
| neutral absorber: | partcov*ztbabs | ||||
| X12 | |||||
| X3 | |||||
| narrow K: | zgauss | ||||
| [keV] | |||||
| [eV] | |||||
| ph/(cm2s) | |||||
| LP components: | relxilllpCp | reflkerr_lp | |||
| 0.998 (f) | 0.998 (f) | (l) | |||
| (l) | |||||
| (l) | |||||
| (f) | |||||
| 400(f) | 400(f) | ||||
| LP1 | |||||
| 1.17 (f) | 1.17 (f) | ||||
| LP2 | |||||
| 15 (f) | 15 (f) | ||||
| primary | nthcomp | ||||
| - | |||||
| soft component | nthcomp | compps | |||
| 607/461 | 928/461 | 534/407 | 702/453 | 697/701 | |
| - | - | 1933/1567 | |||
Notes: The second, unabsorbed (except for the Galactic ISM) Comptonization (soft) component, nthcomp in 1 and compps in 2 and 3, has the spectral index linked to of the main Comptonization component (see Section 3.1.4). The second Gaussian component represents the Fe K line (see Section 3.1.3). The normalization, , of Comptonization components give the 1-keV flux in keV cm-2 s-1. The LP components in 1 neglect the direct component (following Beuchert et al., 2017) but we give this model normalization corresponding to fixReflFrac=1. Parameters denoted with ’(f)’ were fixed in the fitting. is given in the unit of . In model 3 parameters denoted with ’(l)’ are linked across the three spectra. DoF for the individual spectra include these parameters, therefore, their sum is larger than the DoF for the joint fit.
3.2 Lamppost with an untruncated disk
We present here our lamppost model results. In all lamppost models discussed here, we use the same additional spectral components as Beuchert et al. (2017), i.e., a warm absorber an two neutral, partially-covering absorbers (Section 3.1.2), narrow Fe K and K lines (Section 3.1.3) and an additional Comptonization component attenuated only by the Galactic absorption (Section 3.1.4).
We first use the lamppost model previously applied to spectrum N (relxilllpCp) and compare it with an improved model using reflkerr_lp, which allows us to illustrate the importance of the proper modeling of gravitational redshift. Spectrum N was previously analyzed with lamppost models by Keck et al. (2015) and Beuchert et al. (2017). They claimed the presence of an untruncated accretion disk around a rapidly rotating BH, illuminated by two sources, one of them located very close to the BH horizon. These two point-like sources are supposed to approximate a single vertically extended corona, therefore, the parameters of their intrinsic Comptonization spectra are linked. We first assume the parameters of the model fitted in Beuchert et al. (2017), including two lamppost (LP) components at and , the disk truncated at , and . Our aim is to illustrate the GR effects by comparing two models with the same lamppost parameters, therefore, we consider two models with parameters of the LP components fixed at these values.
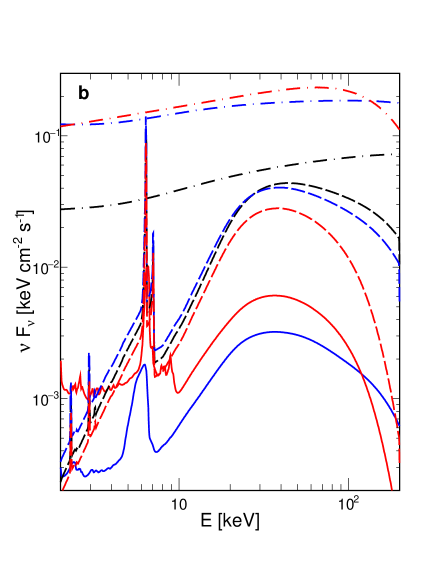
In the model 1, we follow Beuchert et al. (2017), i.e., we include two lamppost reflection components, LP1 and LP2, described by relxilllpCp (neglecting their direct components) and one thermal Comptonization component described by an independent nthcomp spectrum, and we allow for free normalizations of these three spectral components. This model neglects the GR redshift of the primary emission as well as it does not use the physical reflection fractions. In the model 2, we use two reflkerr_lp components including both the primary and reflected radiation and in both we fix the physical reflection fraction. In both models, we also fix keV (following Beuchert et al. 2017).
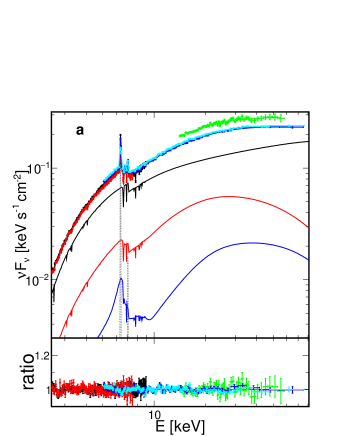
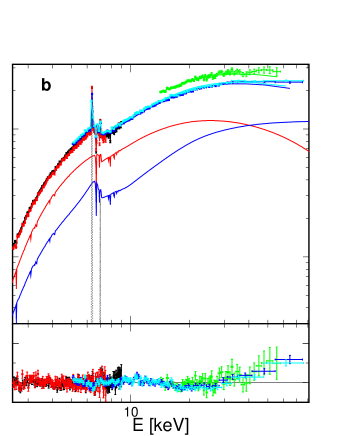
Our fitting results are shown in Table 2 and Fig. 2. The model 1 gives a good fit, similar to that found in Beuchert et al. (2017). The model 2 gives a significantly worse fit, with , and a strong residual pattern seen in Fig. 2(b). The discrepancy is related with the redshift of the primary component from , taken into account in reflkerr_lp and neglected in the model 1. Allowing to vary in the model 2 does not improve the fit and the fitted value remains keV. This behavior of the model results from properties of thermal Comptonization spectra, which deviate from a power-law shape at large (rest-frame) . Such deviations appear already at the fitted keV and (see, e.g., figure 4 in Niedźwiecki et al. 2019) and are more pronounced for larger . Therefore, an increase of , which could compensate for the redshift, would also lead to departures from a power-law shape and a disagreement with the data.
We note that the physical reflection fractions used in the model 2 are crucial for the above discrepancy. If we use this model with free reflection fractions (which is unphysical), we find we can obtain a good fit, with for LP1 and for LP2. It includes a weakly redshifted primary spectrum of LP2 stronger than that of LP1, and completely dominating at high energies.
Also the physical reflection fraction gives a slightly larger in the model 2 relative to model 1. The tendency of the increase of is due to the related decrease of the contribution of the direct component from LP1, which is too strongly redshifted to fit the data. The fitted is the largest inclination for which the related change of the line profile can be compensated by the change in absorption.
We now modify model 2 by allowing , and both to vary. We refer to this version as model 3 and we apply it to all three spectral sets, linking , and ZFe across them. We also constrained for LP1, and we added a second ionized absorber, i.e. we now use the same absorption model as for the models with the truncated disk in Section 3.3. For spectrum D the second warm absorber does not give a statistically significant improvement ( for 4 degrees of freedom, which decreases the model likelihood), therefore, we neglected it. The model 3 results are shown in Table 2. We see that the parameters fitted for spectrum N are not significantly different from those in the model 2 and the quality of the spectral description is still very poor and much worse than that with the truncated disk models in Section 3.3. On the other hand, the quality of the model 3 fits to spectra D and B is not so strongly worse than that for the fits with the truncated disk models. In these model 3 fits to spectra D and B, however, the directly observed radiation is dominated by the LP2 component (i.e. the one at a larger ), in contrast to the model for spectrum N. Therefore, the redshift of the direct radiation is not significant.
Then, we modify model 3 by removing the LP2 component and for LP1 we keep the constraint of , with other assumptions of the model not changed. Even in such a model we do not find a strong systematic disagreement with the data such as that estimated above for spectrum N. Although the fitted temperatures are now very large, keV for D and keV for B, we find that the related distortions of the Comptonization spectrum can be compensated by the change of the cross normalization of the ISGRI data within its uncertainty limit. We conclude that the spectral sets including only the INTEGRAL data in the hard X-ray range do not allow to rule out spectral solutions with a strongly redshifted thermal Comptonization component in a manner similar to that inferred with the NuSTAR data.
3.3 Truncated disk
We now analyze the spectra N, D and B using models with a free . Allowing to vary in the lamp-post model, we typically find and . For such parameters, the disk irradiation is . Therefore, for our further analysis we use the reflkerr model with . This model can be considered as an approximation of an inner hot flow irradiating a truncated disk, which we regard as a likely geometry for the fitted parameters. The reflkerr model gives very similar results to reflkerr_lp except for the rest-frame fitted to N, which is higher by a factor in the lamp-post fits. Also for the fitted values of , the model spectra are negligibly affected by the spin value. For simplicity we assume for the results presented below.
The unknown origin of the narrow Fe K line results in the major uncertainty for spectral modeling of NGC 4151. We have considered various models as described in Section 3.1.3. In model 4 we describe the narrow Fe K lines by the zgauss components and in model 5 we assume that the lines are produced by Compton-thick reflection computed with hreflect. Model 6 is similar to model 5, but the hreflect reflection is weakly smeared by rdblur. Each model was fitted jointly to spectrum N, B and D, with and ZFe linked across the three spectral sets. For all results presented in this section, we use two neutral and two ionized absorbers, except for the models 5 and 6 for spectrum D, where the second warm absorber as well as the neutral absorbers did not improve the fit.
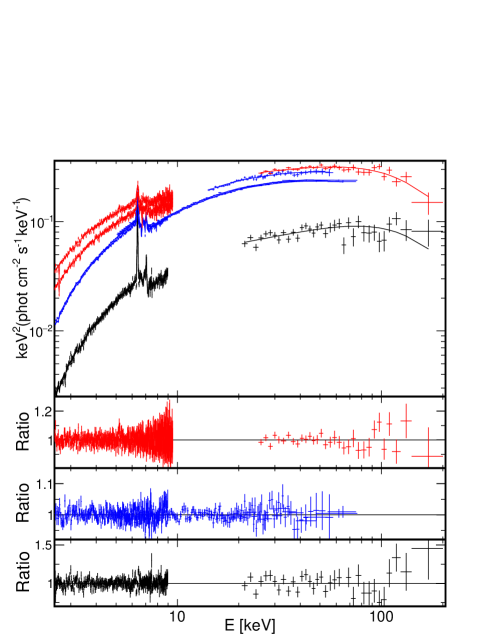
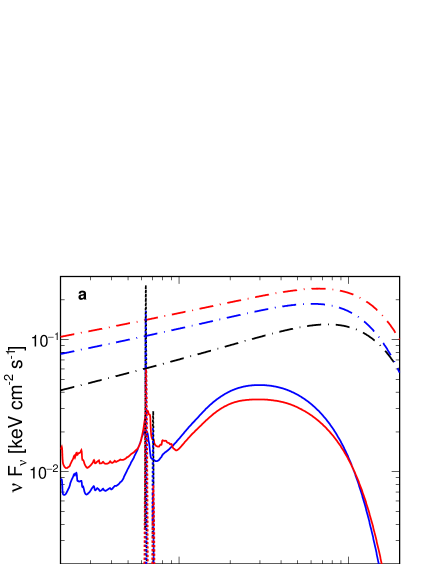
The results for models 4 and 6 are given in Table 3 and Figure 3 shows the main emission components of these fitted models. Figure 4 shows spectra for model 4. For model 5 we found very similar parameters of reflkerr to those fitted in model 6 (except for a smaller in model 5) but with a much worse . The deficiency of model 5 is due to its inability to reproduce the redshifted component of the narrow Fe K line, which is present in the observed spectra D and N, as indicated e.g. by the fitted centroid energies of zgauss in model 4. In spectrum B the narrow line is not redshifted. Remarkably, for spectrum N the same value of the redshift is indicated independently by the Suzaku and the NuSTAR observations. Fitting these observations separately with model 4, in both cases we found the same keV (in the host galaxy frame).
This fitted may result from the gravitational redshift if the emission arises at . Similar distance of the emission region is indicated by the fitted of rdblur in model 6, where also the fitted rdblur inclination angle is . Also similar results are obtained when the zgauss components in model 4 are replaced by diskline. The fitted diskline parameters are (D) and (N), and .
Model 4 gives a better spectral fit than model 6, which indicates that the narrow Fe K line is produced in a Compton-thin rather than Compton-thick material. Distinguishing between these two cases is crucial for the assessment of the presence of the inner disk. In model 4 we find a significant evidence for reflection, with , from a disk truncated at in N and at (but poorly constrained) in B. We checked the significance of inner disk reflection individually for each spectral set. Neglecting the relativistic reflection (i.e. setting ) gives for N and for B. For spectrum D we found no significant indication for the inner disk reflection ( for 3 degrees of freedom), therefore, we neglected it.
| model 4: tbabs*(zxipcf*zxipcf*(partcov*ztbabs)*(partcov*ztbabs)*(reflkerr+zgauss+zgauss)+compps) | ||||||
|---|---|---|---|---|---|---|
| model 6: tbabs*(zxipcf*zxipcf*(partcov*ztbabs)*(partcov*ztbabs)*(reflkerr+rdblur*hreflect)+compps) | ||||||
| model 4 | model 6 | |||||
| D | N | B | D | N | B | |
| zxipcf | warm absorber | |||||
| zxipcf | warm absorber | |||||
| - | ||||||
| - | ||||||
| - | ||||||
| - | ||||||
| partcov*ztbabs | neutral absorber | |||||
| - | ||||||
| - | ||||||
| partcov*ztbabs | neutral absorber | |||||
| - | ||||||
| X12 | - | X12 | ||||
| X3 | X3 | |||||
| reflkerr | disk reflection | |||||
| - | (l) | - | (l) | |||
| - | (l) | (l) | ||||
| - | - | |||||
| - | - | |||||
| - | - | |||||
| rdblur*hreflect | distant reflection | |||||
| - | - | - | (l) | |||
| - | - | - | ||||
| - | - | - | ||||
| zgauss | narrow Fe K line | |||||
| - | - | - | ||||
| - | - | - | ||||
| ph/(cm2s) | - | - | - | |||
| compps | soft component | |||||
| 1790/1573 | 1852/1583 | |||||
| 528/410 | 577/458 | 685/703 | 557/417 | 605/458 | 690/703 | |
Notes: The relativistic reflection component in D is neglected due to its negligible significance. Parameters denoted with ’(l)’ are linked across the three spectra; the DoF for the individual spectra include these parameters, therefore, their sum is larger than the DoF for the joint fit. In model 6, in reflkerr and in hreflect are linked, also in hreflect and in rdblur are linked (because the light bending as well as relativistic aberration are negligible at the fitted distances). is given in the unit of . See the Notes of Table 2 for definition of and description of the soft component.
The relativistic reflection parameters appear to be reliably constrained for spectrum N. Allowing to vary for that spectrum we find and the fitted value of is not affected, i.e. . In turn, the reflection parameters are poorly constrained for spectrum B, for which any value of gives the same value of . However, for B we also note a correlation between and , e.g. we get for (fixed) and for , which disfavors a significant contribution from .
In model 6, the (weakly blurred) Compton reflection continuum, produced together with the narrow Fe K line, reduces a potential contribution of the inner disk reflection to and the significance of the inner disk reflection is then only marginal, namely setting gives for N and for B. For spectrum D we again found no significant indication for the inner disk reflection ( for 3 degrees of freedom), therefore, we neglected it.
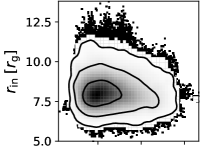
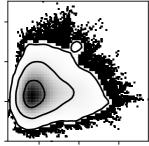
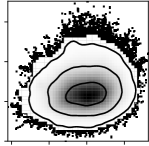
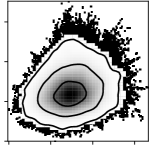
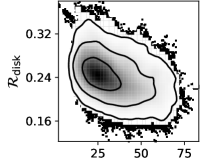
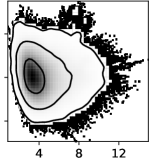
We did not find any significant degeneracies between the parameters of absorption and reflection components. Figure 5 shows example correlation plots of and against of the four absorption components in the model 4 for spectrum N, obtained using the Markov Chain Monte Carlo (MCMC) method. The correlation plots for spectra B and D are qualitatively similar to these in Figure 5.
4 Discussion
Table 1 compares the likelihoods of the lamp-post and the truncated disk models. Model 5 is almost the same as model 6, except for the lack of relativistic blurring of distant reflection and the related increase of , therefore, it is not included. The likelihoods are found using the Akaike information criterion (Akaike, 1973), with a correction for the finite size of sample, strictly following the procedure described in Dziełak et al. (2019). We see that the model 4 is strongly favored. The alternative models are ruled out for spectrum N as well as for the joint fits, and they have low likelihoods for spectra B and D.
Application of our reflkerr_lp model to the Suzaku/NuSTAR data for NGC 4151 rules out the lamp-post geometry proposed for these data by Keck et al. (2015) and Beuchert et al. (2017), since a very poor fit is obtained with the properly calculated Comptonization spectrum. This demonstrates the importance of a proper modeling of gravitational redshift acting on the direct radiation from a source close to the horizon, i.e., at the location needed to explain the apparently very broadened reflection components. This redshift cannot be compensated by an increase of electron temperature, even in the data extending only up to keV. Niedźwiecki et al. (2016) discussed further problems with this geometry related with trapping of a majority of X-ray photons under the horizon as well as extreme values of the compactness parameter, , implying a runaway e± pair production for . For the LP1 component found in our best fitted lamp-post model (model 3), the trapping reduces the X-ray luminosity by a factor of 100 (spectrum D, ), 25 (spectrum N, ) and 10 (spectrum B, ), and the corresponding , and , respectively. Yet another problem for the lamp-post model follows from the the X-ray/UV/optical delay pattern measured in NGC 4151 (Edelson et al., 2017), which cannot be explained by reprocessing in the disk strongly illuminated by a compact lamp-post.

We found that models with a truncated disk give a much better spectral description for NGC 4151. Here the inferred properties of the inner flow depend on the nature of the distant reprocessor producing the narrow Fe K line. This distant matter appears to be not very distant but rather located at a distance of several hundred , as indicated by our modeling of the narrow line. We agree in this point with other recent studies of NGC 4151. Our measured Fe K line widths of eV are consistent with those obtained from the higher-resolution Chandra data (Miller et al., 2018), where also the line asymmetry was found indicating the presence of a redshifted line component and parameters of the line-emitting region similar to ours ( of several hundred and very low ) were estimated. Zoghbi et al. (2019) report variability of the narrow Fe K line and a measurement of a delay of days in its response to the X-ray continuum, which corresponds to the distance of for . This is larger by a factor of 3 than of the line production site which we found for data set N. However, Zoghbi et al. (2019) estimated the 3-day delay basing primarily on the XMM data, whereas the Suzaku observations alone (the same as in our data sets D and N) indicate a much shorter delay of 1 day (see their figure 10d).
Our overall best fit is obtained in the model assuming that the source of the narrow Fe K line is Compton thin, so that the Fe line is not accompanied by a strong Compton-reflected continuum. In this scenario, it is likely that the narrow Fe K line is produced in the material responsible for the neutral absorption, most likely by the clouds in the broad line region (BLR). We can then compare the fitted with the column densities needed to produce the line with the measured EW, although we note that our absorption fits give the line-of-sight , whereas the line production efficiency depends on the angle averaged value. Furthermore, the theoretical EW depends on many factors, in particular the geometry, orientation and covering factor of the line-emitting material (Yaqoob et al., 2010), which are very uncertain. In the context of the model of Ikeda et al. (2009), the eV (D), 100 eV (N) and 60 eV (B) of the narrow Fe K line with respect to the main Comptonization component in our Compton-thin model (model 4), may be produced at – cm-2. These values are indeed approximately consistent with of the neutral absorber in the model 4, where also the decrease of the fitted between D and B is in agreement with the measured decrease of EW. The weakly covering neutral absorber, fitted with , indicates even higher , but this component likely describes small clouds passing in the light-of-sight (as partial covering in time is more likely than in space here) so its may not be representative for angle-averaged column densities.
Models assuming that the narrow Fe K line is produced in a Compton thick matter give a worse spectral description of the X-ray data. Interestingly, the hreflect components are fitted with similar normalizations in all spectral sets in these models (see Figure 3b for model 6, the spectral decomposition for model 5 is similar). Such a weakly variable reflection component could be expected for reflection produced at a parsec scale (e.g. in a molecular torus postulated in the AGN unified model) and then averaged over different emission states of the central source. However, the reflection appears to take place mostly on a much closer spatial scale, as discussed above. On the other hand, the fitted values of challenge the model with reflection from the intermediate region of a warped disk, proposed by Miller et al. (2018). Here, a significant change of the solid angle subtended by the disk at the X-ray source, with in D, in N and in B, seems very unlikely (and we did not find any trends in the Swift/BAT light curves during several-day periods preceding observations D and N, which could explain the reflection steadiness by flux variability).
Describing the narrow Fe K line with the disk emission model, rdblur or diskline, we obtained inclinations formally indicating a strictly face-on orientation of the disk. However, if the line is emitted from the BLR, this fitted line profile more likely indicates a significant contribution from a non-disk component, whose chaotic motion smears the disk-like emission line. Such a complex configuration of the BLR is indicated by its formation models (e.g. Czerny & Hryniewicz, 2011) and by the observed profiles of the optical emission lines (e.g. Bon et al., 2009).
The inclination angle of the fitted inner reflection model gives in turn the actual inclination of the accretion disk. We found small , in agreement with all previous applications of relativistic reflection models to NGC 4151 (e.g. Zdziarski et al., 2002; Keck et al., 2015; Beuchert et al., 2017), where even lower values than of our model 4 were typically found. This low is seemingly in conflict with a strong obscuration of the X-ray spectrum in NGC 4151, which according to the original unification scheme of AGNs (e.g. Antonucci, 1993) should correspond to rather large inclination with the line-of-sight crossing the molecular torus. In our current view of AGN unification, however, it has become clear that additional components should be incorporated, in particular obscuration by gas in the BLR (e.g. Netzer, 2015), which makes obscuration not being due to orientation effects only (as proposed in the simplest unification model). This is likely the case for NGC 4151, where obscuration is observed to be highly variable and then it occurs on a spatial scale close to the central region.
The electron temperature of the X-ray source is keV in model 4 fitted to all three spectral sets. In model 6, keV in B and –400) keV in D and N. This difference between models 4 and 6 results from a strong contribution of the neutral reflection needed to fit the soft X-ray part of spectrum D in the latter model, which then requires a large to reproduce the hard X-ray part by the total model spectrum. If no reflection component is present (as in model 4 for D) the same data can be reproduced by the thermal Comptonization spectrum with much lower . The difference in fitted to spectrum N in models 4 and 6 results from the difference of in these models. We note that a high value of keV is precisely determined in the model 6 fit to spectrum N despite using the data extending only up to 80 keV (i.e. not covering the high energy cut-off produced at this temperature) due to the dependence of the Compton reflection spectrum on at these energies.
Also of the absorbing material estimated for spectrum D shows a strong dependence on the assumed spectral model. The soft X-ray part of this spectrum can be described by either a strong (), neutral reflection component (as in model 6), or a neutral material with , absorbing % of the X-ray emission (as in model 4). The latter solution has a higher statistical likelihood. It also fits in a scenario in which the column density of the neutral absorber increases with decreasing hard X-ray flux (with the total in B, 20 in N and 80 in D). No such a systematic trend is found in the former solution (with a strong neutral reflection).
Altogether, our results indicate that the disk in NGC 4151 is truncated, which favors the geometry with X-rays produced by an inner hot flow. In our best spectral model the truncation occurs relatively close to the black hole (within a ) when the source is bright in hard X-rays, and reflection from the inner disk is weak, , which implies that the vertical scale height of the flow is small. Our best model is consistent with the spectral-timing model proposed for NGC 4151 by Mahmoud & Done (2020), where the main reprocessing of the X-ray radiation occurs in optically thin clouds on size scales of the BLR. The presence of the inner disk estimated in our analysis does not conflict with the dominating reprocessing in the BLR, because only a small fraction of X-rays is reprocessed in the disk.
5 Conclusions
We have found that the lamp-post model proposed in previous works for NGC 4151 gives a poor spectral description when GR effects are properly included in the computation of the thermal Comptonization spectrum. Much better spectral solutions are obtained by allowing the optically-thick disk to be truncated. Our overall best solution indicates that the narrow Fe K line is produced by Compton-thin matter in the BLR, which is similar to the well-established case of another bright Seyfert 1 galaxy, NGC 7213 (Bianchi et al., 2008). In this solution we find also a weak but significant reflection from a disk truncated at (10– when the source is in bright emission states. We did not find evidence either for or against the presence of the disk when the source is in the dim state. We also did not find any significant evidence for reflection from the inner disk in the alternative model, with the narrow Fe K line produced by reflection from the disk, at during the NuSTAR observation and at larger distances in the remaining data sets. This alternative model is disfavored, however, by its statistical inferiority as well as physical consistency problems, most notably large changes of the angle subtended by the reflector (presumably the intermediate disk) as seen by the X-ray source, required to explain the reflection amplitude.
ACKNOWLEDGEMENTS
We thank the anonymous referee for helpful comments, Tobias Beuchert for a clarification regarding his model and Piotr Lubiński for providing the spectral data. This research has been supported in part by the Polish National Science Centre grants 2015/18/A/ST9/00746, 2016/21/B/ST9/02388 and 2019/35/B/ST9/03944. A.A.Z. and A.N. are members of International Teams at the International Space Science Institute (ISSI), Bern, Switzerland, and thank ISSI for the support during the meetings.
References
- Akaike (1973) Akaike, H. 1973, in Proceedings of the 2nd International Symposium on Information, ed. B. N. Petrov & F. Csaki, Budapest: Akademiai Kiado, 267–281
- Antonucci (1993) Antonucci, R. 1993, ARA&A, 31, 473, doi: 10.1146/annurev.aa.31.090193.002353
- Basko (1978) Basko, M. M. 1978, ApJ, 223, 268, doi: 10.1086/156260
- Beloborodov (2017) Beloborodov, A. M. 2017, ApJ, 850, 141, doi: 10.3847/1538-4357/aa8f4f
- Bentz et al. (2006) Bentz, M. C., Denney, K. D., Cackett, E. M., et al. 2006, ApJ, 651, 775, doi: 10.1086/507417
- Beuchert et al. (2017) Beuchert, T., Markowitz, A. G., Dauser, T., et al. 2017, A&A, 603, A50, doi: 10.1051/0004-6361/201630293
- Bianchi et al. (2008) Bianchi, S., La Franca, F., Matt, G., et al. 2008, MNRAS, 389, L52, doi: 10.1111/j.1745-3933.2008.00521.x
- Bon et al. (2009) Bon, E., Popović, L. Č., Gavrilović, N., La Mura, G., & Mediavilla, E. 2009, MNRAS, 400, 924, doi: 10.1111/j.1365-2966.2009.15511.x
- Czerny & Hryniewicz (2011) Czerny, B., & Hryniewicz, K. 2011, A&A, 525, L8, doi: 10.1051/0004-6361/201016025
- Dauser et al. (2014) Dauser, T., Garcia, J., Parker, M. L., Fabian, A. C., & Wilms, J. 2014, MNRAS, 444, L100, doi: 10.1093/mnrasl/slu125
- de Rosa et al. (2007) de Rosa, A., Piro, L., Perola, G. C., et al. 2007, A&A, 463, 903, doi: 10.1051/0004-6361:20065028
- Dziełak et al. (2019) Dziełak, M. A., Zdziarski, A. A., Szanecki, M., et al. 2019, MNRAS, 485, 3845, doi: 10.1093/mnras/stz668
- Edelson et al. (2017) Edelson, R., Gelbord, J., Cackett, E., et al. 2017, ApJ, 840, 41, doi: 10.3847/1538-4357/aa6890
- Fabian et al. (1989) Fabian, A. C., Rees, M. J., Stella, L., & White, N. E. 1989, MNRAS, 238, 729, doi: 10.1093/mnras/238.3.729
- García et al. (2013) García, J., Dauser, T., Reynolds, C. S., et al. 2013, ApJ, 768, 146, doi: 10.1088/0004-637X/768/2/146
- Hönig et al. (2014) Hönig, S. F., Watson, D., Kishimoto, M., & Hjorth, J. 2014, Nature, 515, 528, doi: 10.1038/nature13914
- Ikeda et al. (2009) Ikeda, S., Awaki, H., & Terashima, Y. 2009, ApJ, 692, 608, doi: 10.1088/0004-637X/692/1/608
- Keck et al. (2015) Keck, M. L., Brenneman, L. W., Ballantyne, D. R., et al. 2015, ApJ, 806, 149, doi: 10.1088/0004-637X/806/2/149
- Kraemer et al. (2008) Kraemer, S. B., Schmitt, H. R., & Crenshaw, D. M. 2008, ApJ, 679, 1128, doi: 10.1086/587802
- Lubiński et al. (2010) Lubiński, P., Zdziarski, A. A., Walter, R., et al. 2010, MNRAS, 408, 1851, doi: 10.1111/j.1365-2966.2010.17251.x
- Magdziarz & Zdziarski (1995) Magdziarz, P., & Zdziarski, A. A. 1995, MNRAS, 273, 837, doi: 10.1093/mnras/273.3.837
- Mahmoud & Done (2020) Mahmoud, R. D., & Done, C. 2020, MNRAS, 491, 5126, doi: 10.1093/mnras/stz3196
- Martocchia & Matt (1996) Martocchia, A., & Matt, G. 1996, MNRAS, 282, L53, doi: 10.1093/mnras/282.4.L53
- Matt et al. (2003) Matt, G., Guainazzi, M., & Maiolino, R. 2003, MNRAS, 342, 422, doi: 10.1046/j.1365-8711.2003.06539.x
- Miller et al. (2018) Miller, J. M., Cackett, E., Zoghbi, A., et al. 2018, ApJ, 865, 97, doi: 10.3847/1538-4357/aadbaa
- Netzer (2015) Netzer, H. 2015, ARA&A, 53, 365, doi: 10.1146/annurev-astro-082214-122302
- Niedźwiecki et al. (2019) Niedźwiecki, A., Szanecki, M., & Zdziarski, A. A. 2019, MNRAS, 485, 2942, doi: 10.1093/mnras/stz487
- Niedźwiecki et al. (2016) Niedźwiecki, A., Zdziarski, A. A., & Szanecki, M. 2016, ApJ, 821, L1, doi: 10.3847/2041-8205/821/1/L1
- Onken et al. (2014) Onken, C. A., Valluri, M., Brown, J. S., et al. 2014, ApJ, 791, 37, doi: 10.1088/0004-637X/791/1/37
- Poutanen & Svensson (1996) Poutanen, J., & Svensson, R. 1996, ApJ, 470, 249, doi: 10.1086/177865
- Puccetti et al. (2007) Puccetti, S., Fiore, F., Risaliti, G., et al. 2007, MNRAS, 377, 607, doi: 10.1111/j.1365-2966.2007.11634.x
- Schurch et al. (2003) Schurch, N. J., Warwick, R. S., Griffiths, R. E., & Sembay, S. 2003, MNRAS, 345, 423, doi: 10.1046/j.1365-8711.2003.06946.x
- Wang et al. (2001) Wang, J.-X., Wang, T.-G., & Zhou, Y.-Y. 2001, ApJ, 549, 891, doi: 10.1086/319471
- Weaver et al. (1994) Weaver, K. A., Mushotzky, R. F., Arnaud, K. A., et al. 1994, ApJ, 423, 621, doi: 10.1086/173840
- Yang et al. (2001) Yang, Y., Wilson, A. S., & Ferruit, P. 2001, ApJ, 563, 124, doi: 10.1086/323693
- Yaqoob et al. (2010) Yaqoob, T., Murphy, K. D., Miller, L., & Turner, T. J. 2010, MNRAS, 401, 411, doi: 10.1111/j.1365-2966.2009.15657.x
- Zdziarski et al. (1996) Zdziarski, A. A., Johnson, W. N., & Magdziarz, P. 1996, MNRAS, 283, 193, doi: 10.1093/mnras/283.1.193
- Zdziarski et al. (2002) Zdziarski, A. A., Leighly, K. M., Matsuoka, M., Cappi, M., & Mihara, T. 2002, ApJ, 573, 505, doi: 10.1086/340745
- Zoghbi et al. (2012) Zoghbi, A., Fabian, A. C., Reynolds, C. S., & Cackett, E. M. 2012, MNRAS, 422, 129, doi: 10.1111/j.1365-2966.2012.20587.x
- Zoghbi et al. (2019) Zoghbi, A., Miller, J. M., & Cackett, E. 2019, ApJ, 884, 26, doi: 10.3847/1538-4357/ab3e31