Successive magnetic transitions in heavy fermion superconductor Ce3PtIn11
studied by 115In nuclear quadrupole resonance
Abstract
Nuclear quadrupole resonance (NQR) measurements were performed on the heavy fermion superconductor Ce3PtIn11 with K. The temperature dependence of both spin-lattice relaxation rate and NQR spectra evidences the occurrence of two successive magnetic transitions with K and K. In successive magnetic transitions, even though the magnetic moment at the Ce(2) site plays a major role, the magnetic moment at the Ce(1) site also contributes to some extent. While a commensurate antiferromagnetic ordered state appears for , a partially incommensurate antiferromagnetic ordered state is suggested for .
I Introduction
Ce-based intermetallic systems have gained considerable research interest due to their diverse and perplexing physical properties encompassing observation of non-Fermi-liquid behavior, heavy-fermion-superconductivity, and quantum criticality Ste1 ; Math ; Pet1 ; Wan1 ; Das1 . Among the vast number of known compounds, the members of the CeIn3n+2m ( Co, Rh, Pd, Ir, Pt) family have drawn an unprecedented amount of research effort due to their fascinating phase diagrams, which allow exploration of the relationship between magnetism and adjacent superconductivity.
Among them, CeIn3 (, ) is a three-dimensional material, and the localized magnetism of Ce ions is dominant at ambient pressure ( K) Math . However, with increasing pressure, antiferromagnetic order is gradually suppressed, the hybridization between Ce electrons and conduction electrons becomes significant, and finally superconductivity emerges near the magnetic quantum critical point ( K at 2.6 GPa). In turn, the CeIn5 phases () have quasi-two-dimensional character. CeCoIn5 is one of the most intensively studied systems in recent times due to its unique physics associated with heavy-fermion superconductivity at ambient pressure ( K) and normal-state non-Fermi-liquid behavior Pet1 ; Koh1 . In high magnetic fields, confined in the basal plane of the tetragonal unit cell, an inhomogeneous superconducting phase of the Fulde-Ferrell-Larkin-Ovchinnikov (FFLO) type possibly forms at the lowest temperatures Rad1 ; Bia1 ; Yana1 . The compound CeRhIn5, isostructural to CeCoIn5, is antiferromagnetic at ambient pressure ( K), and exhibits superconductivity under pressure ( K at 2.0 GPa) Heg1 ; Kaw1 . Maximum is about an order of magnitude higher than that of CeIn3, which is a consequence of the reduced effective dimensionality Mon1 . Ce2PdIn8 (, ) exhibits superconductivity below K Kac1 ; Kac3 . There, the antiferromagnetic fluctuations are not as strong as in CeCoIn5 Fuk4 ; Fuk5 .
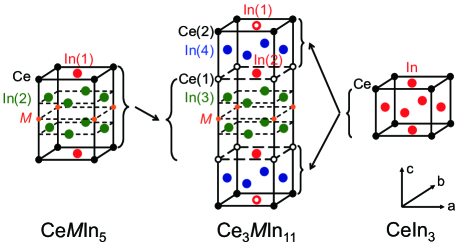
Recently, the synthesis of CeIn11 (, ) has been reported Kac4 ; Cus1 . Unlike CeIn5, CeIn8, and CeIn3, in which a single Ce site exists, there are two inequivalent Ce sites in the unit cell of the CeIn11 crystal, namely, Ce(1) at the site and Ce(2) at the site. The structure gives a new interest in considering magnetism and superconductivity in the CeIn3n+2m group. Both Ce3PtIn11 and Ce3PdIn11 exhibit two successive antiferromagnetic phase transitions at ambient pressure ( K and K for Pt, K and K for Pd) Cus1 . Even in the antiferromagnetic state, they exhibit superconductivity below K ( Pt) and 0.42 K ( Pd) Cus2 ; Cus3 . In each material, a further metamagnetic transition occurs in a high magnetic field Kac5 ; Das2 . This suggests that the coexistence of antiferromagnetism and superconductivity in the CeIn11 compounds is quite a unique phenomenon driven by the hybridization between electrons of Ce ions and conduction electrons Ben1 . Naively, the superconductivity and two successive antiferromagnetic transitions can be considered to be due to two inequivalent Ce sites. The localized magnetic moment of the Ce(2) site (depicted in Fig.1) is supposed to be responsible for the magnetic transitions. In turn, the Ce(1) site is either nonmagnetic or very weakly magnetic, as suggested by the specific heat data Cus1 ; Cus2 . This duality of Ce sites facilitates understanding of new physics near the quantum critical point. For this purpose, knowledge of magnetic structures in the CeIn11 compounds is essential. However, due to excessive In content in this system, standard neutron diffraction measurements are difficult to perform and time consuming because In has a large absorption cross section. Thus local probe measurements such as nuclear quadrupole resonance (NQR) can be of great use, and indeed such experiments have recently been performed for Ce3PtIn11 by Kambe et al. Kam1 ; Kam2 . However, it must be noted that the successive magnetic transitions, which were observed by specific-heat and magnetic-susceptibility measurements, were not clearly observed in NQR Kam2 . The NQR data suggested that the wave vector of the magnetic structure below was (, , ) with an incommensurate component of the wave vector. The magnetic moment at the Ce(2) site has a main component along the crystal axis and a tilted component within the plane. This magnetic structure is similar to that of CeRhIn5, where the wave vector is expressed with (, , 0.297) Cur1 ; Bao2 . Moreover, taking into account the decrease in signal intensity due to the internal magnetic field at each In site, Kambe et al. concluded that the localized moment of the Ce(2) ion gives the main contribution to the magnetically ordered state in CeIn11, as suggested first in Ref. Cus2 .
In this paper, we performed detailed measurements of the NQR spectra and the spin-lattice relaxation rate of Ce3PtIn11 with a focus on the In(2), In(3), and In(4) sites. In both physical quantities, two successive transitions were clearly observed, which were not detected in the previous study Kam1 . From the viewpoint of the NQR spectra, each inequivalent In site has a single internal magnetic field between and , and the In(3) site feels two or more different internal magnetic fields below . Based on the results of our study, we suggest the most probable magnetically ordered state in Ce3PtIn11, in which a wave vector with (, , 0, or ) is realized between and . Our analysis suggests that this wave vector changes into a commensurate or an incommensurate vector depending on the inequivalent Ce sites below .
II Experiments
A polycrystalline sample of Ce3PtIn11 was obtained in a two-step procedure. First, CeIn2 and Pt3In7 binaries were synthesized by melting the high-purity elemental constituents under a high-purity argon atmosphere using an arc furnace installed inside an MBRAUN glove box with controlled oxygen and moisture contents. Then, the two precursors were arc-melted in the same furnace together with elemental indium in the proportion 9:1:8, required to get the nominal composition Ce3PtIn11. The button was turned over and remelted several times to promote homogeneity. The final mass loss was less than 1%. The so-obtained sample was wrapped with tantalum foil and annealed in an evacuated quartz ampoule at 500∘C for 4 weeks, followed by quenching in cold water. Quality of the product was checked by x-ray powder diffraction, by energy-dispersive x-ray analysis, and by bulk property measurements. the detailed synthesis process and preliminary characterization data are reported elsewhere Kac6 . The sample contains a partial parasitic phase of CeIn3 (less than 5%-10%) but has a fairly sharp superconducting transition at 0.33 K and two antiferromagnetic transitions at = 2.2 K and = 2.0 K, in agreement with the literature data Cus1 ; Kac5 . For NQR measurements, the sample was fine powdered in order to reduce the heating-up effect at low temperatures and improve the NQR signal intensity. The 115In NQR studies were performed in the frequency range of 7-70 MHz using a phase-coherent pulsed NQR spectrometer. Measurements down to 1.4 K were carried out using a 4He cryostat. The spin-lattice relaxation time was obtained from the recovery of the nuclear magnetization after a saturation pulse.
III Results and Discussion
III.1 In-NQR spectrum at 4.2 K
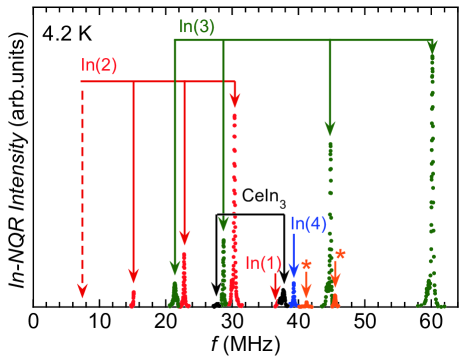
Figure 2 shows the NQR spectrum of Ce3PtIn11 taken at 4.2 K. The obtained data are very similar to those reported before Kam1 ; Kam2 . As can be inferred from Fig. 1, there are four inequivalent crystallographic positions for indium atoms in the unit cell of Ce3PtIn11, namely, In(1) (), In(2) (), In(3) (), and In(4) (). (We follow the notation of site index indicated by Kambe et al. Kam1 ; Kam2 .) For the In nuclei ( = 9/2), the electric quadrupole Hamiltonian is given by
| (1) |
where , , and represent the electric field gradient (EFG), the nuclear quadrupole moment, and the asymmetry parameter of the EFG, respectively. is defined by , where , , and are the principal axes of the EFG and . By diagonalizing and considering the four inequivalent In sites in Ce3PtIn11, one can assign all the observed features in the NQR spectrum. For each In site, four resonance lines appear with increasing frequencies: , , , and . The line corresponds to the transition between and , the line is due to the transition between and , etc. Note that differs from the resonance frequency except for the case of . For sites with , they are equidistant, and for those with , they are not equidistant. Therefore, for the In(2) [or In(1)] site, it can be determined as a site with without numerical calculation. However, for other sites, it is necessary to perform numerical calculation to identify the site.
The obtained NQR frequency and the parameter are 7.591(2) MHz and 0.000(1), respectively, for In(2), and 15.114(4) MHz and 0.2388(4), respectively, for In(3). We also observed the NQR signals at the positions that were assigned before (see above) as lines of In(1) and In(4) Kam1 ; Kam2 . Therefore the NQR spectrum obtained at 4.2 K is consistent with that previously obtained at 3.1 K in the paramagnetic state.
As shown in Fig. 2, some weak NQR signals were attributable to antiferromagnetically-ordered CeIn3. In addition, we found two extra lines at around 41.2 and 45.5 MHz, which could be assigned to neither Ce3PtIn11 nor CeIn3 and hence likely arise due to other parasitic phases, which were also pointed out previously Kam1 ; Kam2 .
III.2 In-NQR spectra between 1.4 and 4.2 K
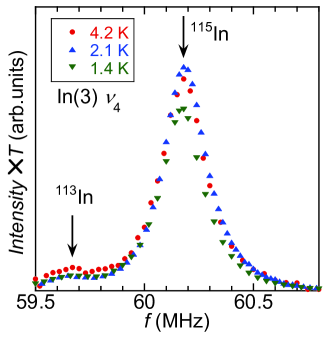
We followed the temperature evolution of the to lines of the In(2) site, all lines of the In(3) site, and the line of the In(4) site. In the spectrum recorded at 4.2 K, the line of the In(1) site had quite a short spin-spin relaxation time . If is long enough, the NQR signal intensity simply increases in inverse proportion to the temperature, but if becomes short around , its correction must be taken into account Sli1 . Just for this reason, we could not follow the line of the In(1) site below . Figure 3 shows the spectra of the line at the In(3) site at 1.8, 2.1, and 4.2 K. These spectra were multiplied by temperature and corrected. The spectral line of 113In nuclei is observed on the lower-frequency side of the 115In line Not1 . Regarding the , , and lines of the In(2) site as well as the line of the In(3) site, the spectra were almost independent of temperature, similarly to the line of the In(3) site. On the other hand, the and lines of the In(3) site and the line of the In(4) site showed a clear change in the spectrum taken below .
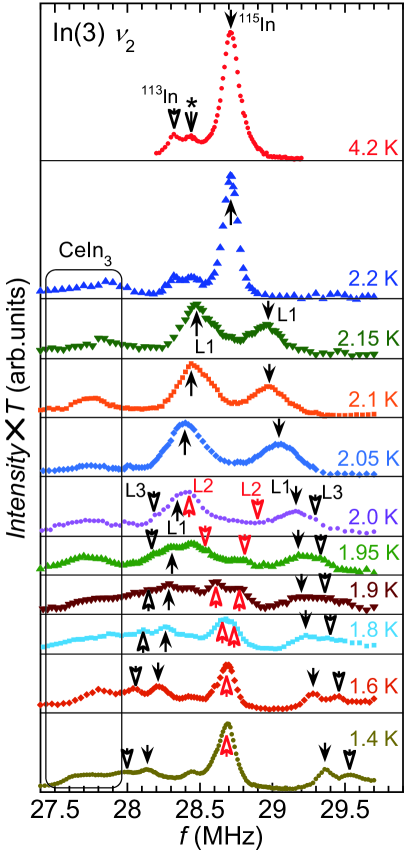
Figure 4 shows the temperature evolution of the line of the In(3) site. These spectra were also multiplied by temperature and corrected. At 4.2 K, we observed a narrow NQR line. In addition, a signal from a parasitic phase, as small as that of 113In nuclei, was also observed on the lower-frequency side of the 115In line Not1 . Notably, with decreasing temperature, the feature splits into two lines in the temperature region between 2.0 and 2.2 K (labeled L1 in Fig. 4). The spectra below 2.0 K are more complicated. Around the center of the spectra, the separation of lines decreases with decreasing temperature, and the two lines merge into a single line below 1.8 K (L2 in Fig. 4). Below 2.0 K, another couple of separated lines appear outside the original separated lines (L3 in Fig. 4). The spectrum changes continuously through . Therefore the phase transition at cannot be interpreted as a phase separation of the paramagnetic phase and the antiferromagnetically ordered phase.
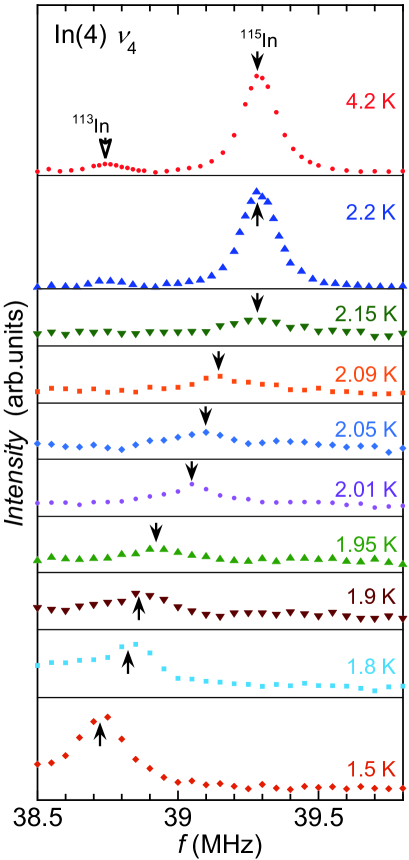
Figure 5 shows the temperature evolution of the spectrum of the In(4) site. The experimental results were corrected only for the data obtained at 2.2 and 4.2 K. This is because the signal intensity decreased considerably below , which hampered precise evaluation of . The recovery of the signal at 1.5 K is probably due to increase of below . Unlike lines of the In(3) site, the line of the In(4) site shifts monotonically to the low-frequency side without any splitting below . The peak of the spectrum at 1.5 K is around 38.7 MHz, which is consistent with the previous reports Kam1 ; Kam2 .
In order to determine the direction of the internal magnetic field and evaluate the contribution of the internal magnetic field at the In(2), In(3), and In(4) sites, we added to the Hamiltonian described in Eq. (1) the following Zeeman-effect Hamiltonian:
where , , , and are the nuclear magneton of indium, the internal magnetic field at the In sites, the polar angle from , and the azimuthal angle from , respectively.
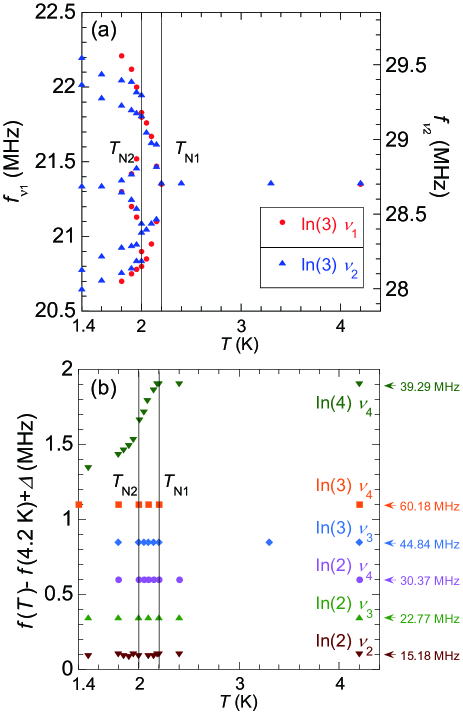
Figure 6 shows the temperature dependence of the characteristic frequencies of each line measured for Ce3PtIn11. First, the , , and lines of the In(2) site are nearly independent of temperature [see Fig. 6(b)]. This feature clearly implies that the internal magnetic field is canceled out at this site. Next, it can be seen that both and of the In(3) site show almost the same and clear temperature dependences [see Fig. 6(a)]. This is in contrast to the fact that both and of the In(3) site do not change through out the entire temperature range. These results indicate that, at the In(3) site, the internal field broadens the and lines, yet does not affect the and lines. Performing numerical calculations in terms of Eqs. (1) and (2), one can easily deduce that is realized in the ordered state. Moreover, the numerical diagonalization of the Hamiltonians reveals that is more likely rather than . The calculation revealed that a range is allowed to account for the data because of the finite asymmetry parameter at the In(3) site. Following this finding, the value of the internal magnetic field of 25 mT was found, which can explain the spectral splitting of the In(3) site at . Finally, the peak frequency of the line of the In(4) site decreases monotonically without splitting below . This requires at least , which implies that the direction of the internal magnetic field at the In(4) site is the same as or close to that at the In(3) site. Therefore the internal magnetic field can be evaluated from the shift of the line of the In(4) site. At , such a shift attains about 0.3 MHz, which corresponds to an internal magnetic field of about 400 mT.
III.3 Dipolar model analysis
Here, we consider the magnetic moments at the Ce sites and the wave vectors, which correspond to the obtained direction and magnitude of the internal magnetic fields at based on the appearance of the antiferromagnetic order in Ce3PtIn11. We assume the wave vector of (,) in the - plane of the wave vector space; by analogy to other CeIn3n+2m compounds, (, , 0) for Ce2RhIn8, (, , ) for CeIn3 Bao1 and CePt2In7 Kur1 ; Sak1 ; Rab1 ; Gau1 , and (, , 0.297) for CeRhIn5 Cur1 ; Bao2 . Most importantly, a similar wave vector (, , ) was recently also suggested for Ce3PtIn11 Kam2 . Based on the latter finding, we set the moment at the Ce (2) site as and assume that the Ce(1) site is nonmagnetic or very weakly magnetic. Then, the internal magnetic fields at the In(1) and In(2) sites are roughly proportional to , while those at the In(3) and In(4) sites are proportional to , if one of the principal axes of the EFG () is parallel to the crystal axis for which the In(3) and In(4) sites are located in the crystal plane [or if is parallel to the axis for which the In(3) and In(4) sites are located in the plane].
First, since the internal magnetic field does not appear at the In(2) site below , the ordered magnetic moment has only a -axis component (. Kambe et al. Kam1 ; Kam2 pointed out that the disappearance of the signal at the In(1) site implies the appearance of an internal magnetic field parallel to the principal axis of the EFG. In such a case, a similar clear internal magnetic field would have appeared at the In(2) site, and all the In(2) lines must split, which is inconsistent with our experimental results. Therefore it is reasonable to presume that the extremely short relaxation time makes difficult observation of the signal at the In(1) site below . In addition, Kambe et al. Kam1 ; Kam2 suggested some possibility of a wave vector of (0, 0, ) with a magnetic moment direction along the axis. However, in such a case, a large internal magnetic field would have also appeared at the In(2) site. Hence this conjecture must be ruled out.
| (calc) (MHz) | (calc) | (exp) (MHz) | (exp) | |
|---|---|---|---|---|
| In(1) | 10.1 | 0 | (9.24) | |
| In(2) | 8.73 | 0 | 7.591(2) | 0.000(1) |
| In(3) | 14.5 | 0.190 | 15.114(4) | 0.2388(4) |
| In(4) | 10.4 | 0.00054 | (9.8) |
Next, in the case that is parallel to the crystal axis [the In(3) sites located in the plane], an internal magnetic field parallel to (0, , 0) should appear at the In(3) site because the in-plane component of the magnetic moment must be zero (: see the discussion above). In order to confirm the relation between the principal axes of the EFG and the crystal axes, we performed the electronic structure calculation using the WIEN2K code Bla1 , where the full-potential linearized augmented-plane-wave method with the generalized gradient approximation for electron correlations is used. For calculations, the space group, the lattice constants, and the starting positions of atoms in the cell were taken from Tables 1 and 2 of Ref. Kac5 , and the positions of the atoms were finally determined by structure optimizations. For comparison, Table 1 summarizes the calculated and the experimentally determined and . Both values are consistent with each other, which ensures the reliability of the calculations. The calculated values of , , and , before the rotation of the principal axes, are 17.75, -10.56, and -7.19, respectively in units of V/m2. These values were calculated for the In(3) sites located in the crystal plane. Hence this means that , , and , after the rotation of the principal axes, are parallel to the axis, axis and axis, respectively, which implies that the internal magnetic field at the In(3) site is perpendicular to both and . This is consistent with the experimentally obtained direction of the internal magnetic field at the In(3) site (, ). At least between and , the In(3) site feels a homogeneous internal magnetic field of mT. Otherwise, the spectrum would be much broader and the obtained values of the internal magnetic fields would also be distributed. This adds a condition that the wave number along the direction must be commensurate. Accordingly, the wave vector should be either (, , 0) or (, , ), and the magnetic moment must be parallel to the axis between and . This conclusion is different from the suggestion by the previous report that required inclination of the magnetic moment from the axis Kam2 .
| Wave vector | (mT) | (mT) | ||
|---|---|---|---|---|
| Ce(1) | (, , 0) | 0.20 | (0, 15.4, 0) | (0, -15.4, 0) |
| Ce(2) | (, , 0) | 5.30 | (0, 9.2, 0) | (0, 416.7, 0) |
| (Total) | (0, 24.6, 0) | (0, 401.3, 0) | ||
| Ce(1) | (, , ) | 0.19 | (0, 15.3, 0) | (0, -14.6, 0) |
| Ce(2) | (, , ) | 5.29 | (0, 9.6, 0) | (0, 415.9, 0) |
| (Total) | (0, 24.9, 0) | (0, 401.3, 0) |
By calculating the dipole magnetic field with (, , 0) or (, , ), we have checked whether the experimentally obtained internal magnetic fields at could be reproduced, i.e., 25 mT at the In(3) site and 400 mT at the In(4) site. For the numerical calculations of the dipole field with the magnetic moment along the crystal axis, 12012030 unit cells were used, and it was confirmed that the calculations converged by the calculation radius of about 10 nm. Here, we used the structure data (space group, lattice constants, and positions of atoms) summarized in Tables 1 and 2 of Ref. Kac5 . First, we assumed the magnetic moment only at the Ce(2) site. However, in this case, we were not able to determine the size of the magnetic moment that could explain the internal magnetic fields at both In sites Not2 . Next, we additionally assumed the magnetic moment at the Ce(1) site. For simplification, we set the magnetic moment of the Ce(1) site parallel to that of the Ce(2) site belonging to the same unit cell. Then, we obtained the set of the magnetic moments summarized in Table 2, which is consistent with the experimentally obtained internal magnetic fields. The contribution of the internal magnetic field at the In(3) site is attributable to the magnetic moments of the Ce(1) and Ce(2) sites. On the other hand, the main contribution of the field at the In(4) site is ascribable to the moment of the Ce(2) site. Remarkably, the moment of the Ce(1) site is about 4% of that of the Ce(2) site in both cases. This indicates that the magnetic moment of the Ce(1) site is very small and that the magnetic moment of the Ce(2) site plays a main role in the magnetism of Ce3PtIn11. The evaluated moment for the Ce(2) site is much larger than expected for the Ce3+ ion. In the actual system, each In site feels a pseudo-dipole field transferred by conduction electrons Cur2 , which is larger than a direct dipole field. In the present simple calculation, this contribution of the transferred field cannot be included.
Below , about half the In(3) sites do not feel any internal magnetic fields, while the In(4) sites feel nearly identical magnetic field. If the In(4) site exhibits field cancellation, its line must split below . It is worth highlighting that the internal magnetic field of the In(3) site is mainly affected by the moment contribution from the Ce(1) site and some partial contribution from the Ce(2) site. On the other hand, the internal field at the In(4) site is influenced by the magnetic moments of the Ce(2) site only. This suggests that the wave vector of the Ce(2) site remains commensurate and that of the Ce(1) site changes into incommensurate in order to compensate the constant contribution, at the In(3) site, of the Ce(2) moments by modulation of the Ce(1) moments. If we do not consider the moment of the Ce(1) site, the commensurate order of the moment of the Ce(2) site produces double-peak structure for the and lines of the In(3) sites, even below , which was observed between and . This is inconsistent with the experimentally observed center line and broad satellite lines. Though most of the Ce(1) moment seems to have been screened by the Kondo effect, the existence of the tiny magnetic moment of the Ce(1) site is essential to explain the spectrum below . Since the transition at is clearly observed in thermodynamic quantities such as specific heat Cus1 ; Cus2 ; Kac5 and (described in the next section), the large magnetic moment of the Ce(2) site is responsible for the transition. This implies that the change of the wave vector at the Ce(2) site is essential, yielding a commensurate-to-commensurate transition: (, , 0) to (, , ) or vice versa. Hence a wave vector of (, , ) at the Ce(1) site with modulation in the direction from (, , 0) or (, , ) may account for the absence of any internal magnetic field at the In(3) site. This model was suggested before for the magnetic moment of the Ce(2) site by Kambe et al. Kam2 . However, in this case, the spectrum should be broadened for general . Probably, is modulated in the direction in a way that brings about the cancellation of the internal magnetic field at half of the In(3) sites, although the exact could not be determined within the present calculations. Further analysis beyond the simple dipole sum calculations is desired.
III.4 Spin-lattice relaxation rate
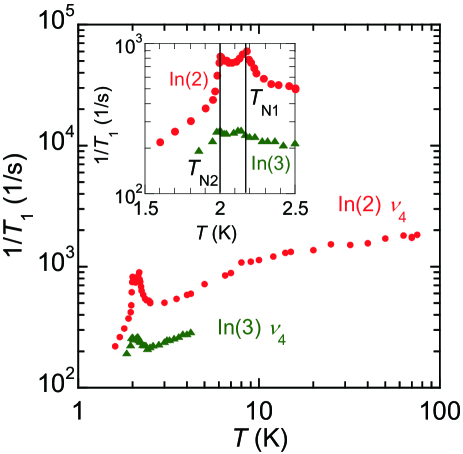
Figure 7 shows the temperature dependence of the spin-lattice relaxation rate of the line at the In(2) and In(3) sites. In both cases, two distinct transitions are observed at K and K. The observed relaxation curve can be fitted well to the theoretical formula expected for the lines of nuclei Chep . This result indicates that the longitudinal relaxation in Ce3PtIn11 is of magnetic origin and that there is almost no influence of the internal magnetic field even below , which is consistent with the conclusion that the internal field is absent and small at the In(2) and In(3) sites, respectively. Here, it should be recalled that Kambe et al. pointed out that superconductivity is observed at the In sites that feel the internal magnetic fields Kam2 .
IV Summary
NQR measurements were performed on the heavy-fermion superconductor Ce3PtIn11. The temperature dependencies of both and the NQR spectra revealed the occurrence of two successive magnetic transitions. Each inequivalent In site feels a single internal magnetic field between and , and the In(3) site feels two or three different internal magnetic fields below . Based on the NQR data we concluded that the magnetic wave vector is commensurate (, , 0, or ) with the magnetic moment parallel to the axis between and . It was also revealed that the ordered magnetic moment at the Ce(2) site is about 25 times larger than that at the Ce(1) site. This indicates that the magnetic moment of the Ce(2) site plays a crucial role in the magnetism of Ce3PtIn11. The duality of the crystallographically inequivalent Ce sites is indeed realized in this compound. At , a complicated phase transition of commensurate to commensurate at the Ce(2) site and commensurate to incommensurate at the Ce(1) site is suggested. Further analysis beyond the simple dipolar model presented in this paper is desired. NQR studies performed at lower temperatures are required to conclude that the claimed coexistence of antiferromagnetism and superconductivity in Ce3PtIn11 is an intrinsic property of this interesting material.
ACKNOWLEDGMENTS
The authors thank S. Kambe and T. Ohama for fruitful discussions. This work was supported by JSPS KAKENHI Grant (No. 18K03505 and No. 19K14644). The work in Poland was supported by the National Science Centre (Poland) under Research Grant No. 2015/19/B/ST3/03158.
References
- (1) F. Steglich, J. Aarts, C. D. Bredl, W. Lieke, D. Meschede, W. Franz, and H. Schafer, Phys. Rev. Lett. 43, 1892 (1979).
- (2) N. D. Mathur, F. M. Grosche, S. R. Julian, I. R. Walker, D. M. Freye, R. K. W. Haselwimmer, and G. G. Lonzarich, Nature 394, 39 (1998).
- (3) C. Petrovic, P. G. Pagliuso, M. F. Hundley, R. Movshovich, J. L. Sarrao, J. D. Thompson, Z. Fisk, and P. Monthoux, J. Phys.: Condens. Matter 13, L337 (2001).
- (4) H. Wang, J. Guo, E. D. Bauer, V. A. Sidorov, H. Zhao, J. Zhang, Y. Zhou, Z. Wang, S. Cai, K. Yang, A. Li, X. Li, Y. Li, P. Sun, Y.F. Yang, Q. Wu, T. Xiang, J. D. Thompson, and L. Sun, Phys. Rev. B 97, 064514 (2018).
- (5) D. Das, D. Gnida, P. Wisniewski, and D. Kaczorowski, PNAS 116, 20333 (2019).
- (6) Y. Kohori, Y. Yamato, Y. Iwamoto, T. Kohara, E. D. Bauer, M. B. Maple, and J. L. Sarrao, Phys. Rev. B 64 134526 (2001).
- (7) H. A. Ladovan, N. A. Fortune, T. P. Murphy, S. T. Hannahs, E. C. Palm, S. W. Tozer, and D. Hall, Nature 425, 51 (2003).
- (8) A. Bianchi, R. Movshovich, C. Capan, P. G. Pagliuso, and J. L. Sarrao, Phys. Rev. Lett. 91, 187004 (2003).
- (9) Y. Yanase and M. Sigrist, J. Phys. Soc. Jpn. 78, 114715 (2009).
- (10) H. Hegger, C. Petrovic, E. G. Moshopoulou, M. F. Hundley, J. L. Sarrao, Z. Fisk, and J. D. Thompson, Phys. Rev. Lett. 84, 4986 (2000).
- (11) S. Kawasaki, T. Mito, Y. Kawasaki, G.-q. Zheng, Y. Kitaoka, D. Aoki, Y. Haga, and Y. Onuki, Phys. Rev. Lett. 91, 137001 (2003).
- (12) P. Monthoux and G. G. Lonzarich, Phys. Rev. B 63, 054529 (2001).
- (13) D. Kaczorowski, A. P. Pikul, D. Gnida, and V. H. Tran, Phys. Rev. Lett. 103, 027003 (2009):ibid 104, 059702 (2010).
- (14) D. Kaczorowski, D. Gnida, A. P. Pikul, and V. H. Tran, Solid State Commun. 150, 411 (2010).
- (15) H. Fukazawa, T. Okazaki, K. Hirayama, Y. Kohori, G. Chen, S. Ohara, I. Sakamoto, and T. Matusmoto, J. Phys. Soc. Jpn. 76, 124703(2007).
- (16) H. Fukazawa, R. Nagashima, S. Shimatani, Y. Kohori, and D. Kaczorowski, Phys. Rev. B 86, 094508 (2012).
- (17) A. Tursina, S. Nesterenko, Y. Seropegin, H. Nol, D. Kaczorowski, J. Solid State Chem. 200, 7 (2013).
- (18) M. Kratochvílová, M. Dušek, K. Uhlířová, A. Rudajevová, J. Prokleška, B. Vondráčková, J. Custers, and V. Sechovský, J. Cryst. Growth 397, 47 (2014).
- (19) J. Prokleška, M. Kratochvílová, K. Uhlířová, V. Sechovský, and J. Custers, Phys. Rev. B 92, 161114(R) (2015).
- (20) M. Kratochvílová, J. Prokleška, K. Uhlířová, V. Tkáč, M. Dušek, V. Sechovský, and J. Custers, Sci. Rep. 5, 15904 (2015).
- (21) D. Das, D. Gnida, L. Bochenek, A. Rudenko, M. Daszkiewicz, and D. Kaczorowski, Sci. Rep. 8, 16703 (2018).
- (22) D. Das, D. Gnida, D. Kaczorowski, Phys. Rev. B 99, 054425 (2019).
- (23) A. Benlagra, L. Fritz, and M. Vojta, Phys. Rev. B 84, 075126 (2011).
- (24) S. Kambe, H. Sakai, Y. Tokunaga, R. E. Walstedt, M. Kratochvílová, K. Uhlířová, and J. Custers, JPS Conf. Proc. 29, 011009 (2020).
- (25) S. Kambe, H. Sakai, Y. Tokunaga, R. E. Walstedt, M. Kratochvílová, K. Uhlířová, and J. Custers, Phys. Rev. B 101, 081103(R) (2020).
- (26) N. J. Curro, P. C. Hammel, P. G. Pagliuso, J. L. Sarrao, J. D. Thompson, and Z. Fisk, Phys. Rev. B 62, 6100(R) (2000).
- (27) W. Bao, P. G. Pagliuso, J. L. Sarrao, J. D. Thompson, Z. Fisk, J. W. Lynn, and R. W. Erwin, Phys. Rev. B 62, R14621 (2000); 63, 219901(E) (2001).
- (28) D Das, J. Bławat, D. Gnida, and D. Kaczorowski (unpublished).
- (29) P. Blaha, K. Schwarz, F. Tran, R. Laskowski, G. K. H. Madsen, and L. D. Marks, J. Chem. Phys. 152, 074101 (2020).
- (30) C. P. Slichter, Principle of Magnetic Resonance, 3rd edition, Springer Verlag (1989).
- (31) Because the natural abundance of 113In is 4.3% and that of 115In is 95.7%, the 113In line intensities are quite low (see Fig. 3). The lines due to 113In overlap with those of 115In because the ratio of quadrupole moments is . However, they can be identified because of this ratio and the natural-abundance ratio.
- (32) W. Bao, P. G. Pagliuso, J. L. Sarrao, J. D. Thompson, Z. Fisk, and J. W. Lynn, Phys. Rev. B 64, 020401(R) (2001).
- (33) Zh. M. Kurenbaeva, E. V. Murashova, Y. D. Seropegin, H. Nol, A. I. Tursina, Intermetallics 16, 979 (2008).
- (34) H. Sakai, Y. Tokunaga, S. Kambe, H.-O. Lee, V. A. Sidorov, P. H. Tobash, F. Ronning, E. D. Bauer, and J. D. Thompson, Phys. Rev. B 83, 140408(R) (2011).
- (35) M. Raba, E. Ressouche, N. Qureshi, C. V. Colin, V. Nassif, S. Ota, Y. Hirose, R. Settai, P. Rodiere, and I. Sheikin, Phys. Rev. B 95, 161102(R) (2017).
- (36) N. Gauthier, D. Wermeille, N. Casati, H. Sakai, R. E. Baumbach, E. D. Bauer, and J. S. White, Phys. Rev. B 96, 064414 (2017).
- (37) Strictly speaking, it is not impossible to explain the spectrum between and solely by the moment of the Ce(2) site if we consider transferred magnetic fields described below, which may be different at the In(3) and In(4) sites. However, it becomes more difficult to explain the spectrum below without the moment of the Ce(1) site.
- (38) N. J. Curro, New J. Phys. 8, 173 (2006).
- (39) J. Chepin and J. H. Ross, J. Phys.: Condens. Matter 3, 8103 (1991).