11email: olah@konkoly.hu 22institutetext: Department of Physics, and Kavli Institute for Astrophysics and Space Research, Massachusetts Institute of Technology, Cambridge, MA 02139, USA 33institutetext: Max-Planck-Institut für Sonnensystemforschung, Göttingen, Germany 44institutetext: Eötvös Loránd University, Department of Astronomy, Budapest, Hungary
Towards the true number of flaring giant stars in the Kepler field
Abstract
Aims. We aim to give a reliable estimate of the number of flaring giant stars in the Kepler field. By analyzing the flaring activity of these stars we explore their flare statistics and the released flare energies. The role of oscillation in suppressing magnetic activity is also investigated. On a sample of flaring giant stars we search for flaring specialities which may be associated with the giant nature.
Methods. We search for flares using the 4 yr long Kepler data on a sample of 706 stars compiled from two lists of flaring giants () found in the literature. To lessen the probability of false positives two different pipelines are used independently for flare detection. Tests are carried out to correct the detection bias at low flare energies for a subsample of 19 further studied, frequently flaring stars. For these 19 stars flare energy distributions and flare frequency diagrams (FFDs) are constructed. For comparison purposes KIC 2852961 (Kővári et al., 2020) is re-analysed with our present approach.
Results. From the 706 Kepler flaring giant candidates, we ruled out those where oscillations or pulsations were misclassified and those that turned out to be dwarf stars. In the end, we confirm only 61 stars as flaring giants. Among these 61 flaring giants we found only six which also show oscillations; we suggest that a large fraction of the 61 flaring giants are members of spectroscopic binaries which are proven already for 11. The number of detected flares on giant stars correlate only weakly with the rotational periods. The FFDs for the most flaring 19 stars were fitted by power-law functions. On log-log representation the slopes of the individual fits lead to an average power law index, but the ranges of flare energies scatter within almost two orders showing the inherent heterogeneity of the sample of flaring giants. Broken power-law fits are applied for two giant stars which have similar flare energy ranges, however, the energy at the breakpoints of the power laws are different showing possible differences in the magnetic field strengths and atmospheric structures of these stars. The average power law index of 2 is the same for the flaring giants, for the (super)flaring G-dwarfs and for dwarf stars between spectral types M6–L0.
Conclusions. The 61 confirmed flaring giant stars make up only 0.3% of the entire giant star population in the Kepler database, in contrast with previous estimates of about an order higher percentage. We found that most of the false positives are in fact oscillating red giants. No strong correlation was found between the stellar properties and the flaring characteristics. The wide scale of the flaring specialities are hardly related to the giant nature, if at all. This, together with the finding that the observed flare durations correlate with flare energies, regardless of the flare energy level and stellar luminosity class, suggest common background physics in flaring stars, or in other words, a general scaling effect behind.
Key Words.:
Stars: activity – Stars: flare – Stars: late-type1 Introduction
Magnetism accompanies stars from cradle to grave, magnetic fields play a crucial role from the formation of stars to the end of their existence. Most stars at a certain stage of stellar evolution exhibit enhanced magnetic activity, showing phenomena like the most easily observable flares. Stellar flares are sudden eruptions of energy through magnetic reconnection which occur mostly (but not exclusively) on late-type stars. The incidence of flaring stars among different types of stars including solar-type stars, cool dwarfs, active giants, and even early-type stars marks the presence and strength of magnetic field, and this way has serious impact in studying the evolution of such stars in general (Cantiello et al., 2016), therefore knowing their true number is essential. Magnetically active red giant stars with strong flares gather on the red giant branch (RGB) of the HertzsprungRussell-diagram (HRD). This is an exciting episode of stellar evolution. Depending on their mass, the stars spend only a short period of their life on the RGB, with continuously expanding atmosphere and basic changes in their inner structure and energy production.
Flares on stars (including the Sun) originate through magnetic reconnection in emerging flux tubes. Theoretical description of the magnetohydrodynamic processes based on data of the only star where flares are directly observable, the Sun, is reviewed by Shibata & Magara (2011). For a flare eruption a working magnetic dynamo originating from the counteraction of the differential rotation and convective motions in the stellar envelope is needed. A comprehensive review of solar-stellar magnetism was recently presented by Brun & Browning (2017). These works however, deal mostly with late-type dwarf stars. The role of the magnetic field in the activity of giant stars is only little studied and not well understood. To our knowledge no later study about emerging (and trapped) magnetic flux tubes, causing the observable magnetic features like spots or flares, exists, than the one by Holzwarth & Schüssler (2001).
The existence of the magnetic field is the base of the flare activity on giant stars as well as on dwarfs, however, measuring it is not an easy task. The interested reader finds a summary of such measurements on stars in Reiners (2012). Indirect evidence of magnetic activity on giant stars is the rotational modulation of brightness caused by starspots which is monitored using photometry for decades on a few active giants (Oláh et al., 2009, for example) and more recently are studied by Doppler imaging, see e.g., Kővári et al. (2017, see their Table 1.), while a summary of the observables of cool star dynamos, including giant stars, is presented by Kővári & Oláh (2014). Recently, spots on giant stars’ surfaces were even directly imaged (Roettenbacher et al., 2016).
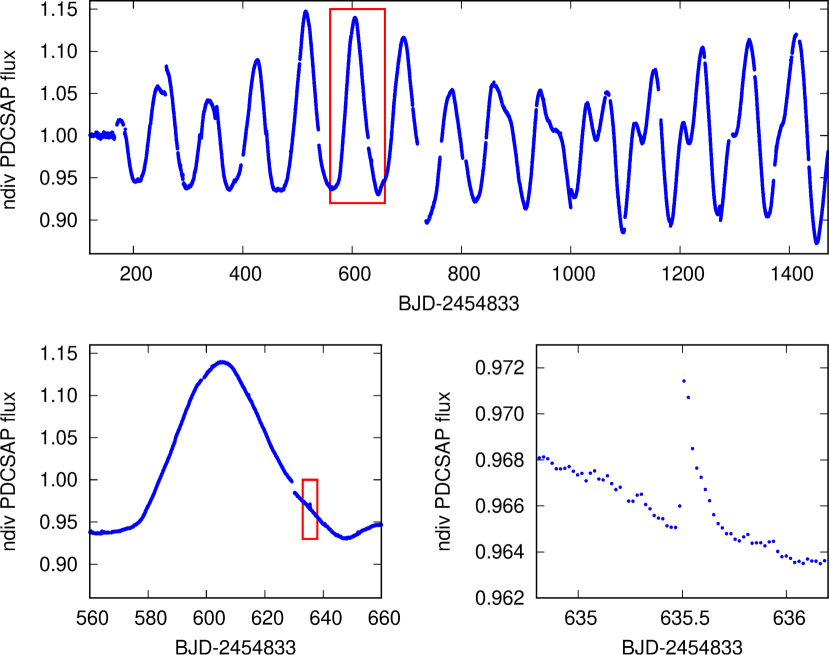
Before the era of space-borne photometry, observations of flares on giant stars were restricted to very few studies. The reason behind this is the fact that flares on giants are hardly observable from the ground: (i) the day-night period on the Earth generally restricts continuous monitoring of stars. With rotational periods over about a day to weeks, even one single rotation cannot be fully covered - except the polar regions of the Earth with only a few instruments. As an example, see the results of a continuous 10.15 days photometry with 155 sec cadence for the RS CVn active binary V841 Cen (and the non-radially pulsating Scuti star V1034 Cen) from the Antarctica by Strassmeier et al. (2008). (ii) the signal-to-noise (S/N) of the ground-based photometry is limited by atmospheric effects and weather conditions, (iii) due to the high luminosity of giant stars the flares appear on a luminous background resulting in only a small amplitude brightness increase relative to the star. Fig. 1 shows a flare lasting a few hours on an active giant star with a long period and high amplitude rotational modulation; this flare would be hardly (or even not) observable from the ground.
Among the very few flares observed on giant stars from the ground there is a remarkable six days long event. This huge eruption, observed in H by Catalano & Frasca (1994), occurred on HK Lac, a close binary with an active giant component. The flare released erg total in H, and it was correlated with the appearance of a new active region on the star (Oláh et al., 1991). Another interesting example is an almost 10 days log flare event lasting for about one stellar rotation on YY Men, an FK Com-Type K1III giant star, observed photometrically in broadband colors by Cutispoto et al. (1992) obtaining one datapoint/night. The total released energy in the optical passbands was about erg (Cutispoto et al., 1992).
Continuous monitoring of stars by space instruments in optical wavelengths (Kepler, TESS) both in 2-min and 30-min cadence immediately initiated studying the incidence of flaring objects among stars with different stellar parameters such like their spectral type, mass, effective temperature etc. A number of different algorithms have been developed to find flares in the enormous photometric datasets provided by the satellites (in the order of stars from each instrument). In the same time the question also arose, namely, how trustful are the algorithms, considering that flares can be mixed up with several real and erroneous features like stellar oscillations or photometric errors. Of course, false positive detections are hardly inevitable but the goal is to minimize their number.
Davenport (2016) investigated the available Kepler data from Quarters 0-17 and catalogized 4041 flare stars but did not list their luminosity classes. Van Doorsselaere et al. (2017, hereafter D17) analysed the long-cadence Kepler data from Quarter 15 and tabulated the flaring stars by spectral types. They gave a list of 695 flaring giant stars out of the 21875 analysed giants yielding a 3.18% flare incidence, slightly higher than the rate for the G-stars. These cited results used fully automatic pipelines for flare detection which resulted in a high number of false positives. The possible origin of the detected false positives in Davenport (2016) was explained by Davenport et al. (2019) in their own results, namely, that the earlier version of the appaloosa code insufficiently treated the periodic signals in the data leaving in sharp or peaked structures in the residuals which then were recognized as flares.
Finally, applying all Kepler long-cadence, DR 25 data Yang & Liu (2019, hereafter YL19) discussed in detail the origin of the high number of false positive flare detections in the earlier studies and summarised the characteristics of all previous flare-finding techniques together with their own approach which included the possibility of visually checking the results. In their Table 3 YL19 compared the flare incidences published by different authors with their own results, and specifically, they found 0.33% flare incidence for the giant stars. From the final dataset of 3420 flaring stars of YL19 the published stellar parameters made us possible to select the giant flaring stars of the paper for our present study.
In this paper we revise the earlier detections of D17 and YL19 on the incidence of flaring stars among the giants in the Kepler field and give details about the flare characteristics of the confirmed flaring giants.
Recently we studied KIC 2852961, a giant star in the Kepler field discussing its flaring properties in Kővári et al. (2020, hereafter Paper I), with a title ”Superflares on the late-type giant KIC 2852961”. Studying now dozens of flaring giants a perhaps naive question arises: what does ”superflare” indeed mean? Since superflares are commonly defined by energies [erg] all detectable flares on giant stars would automatically be classified as superflares. But this definition is only an energy scale: the environments where the flares originate are different on ultracool dwarfs (full convenction, high gravity), on main-sequence G, K and M dwarfs (convective shell, high gravity) and on giants (convective shell, low gravity). This question is discussed in Sect. 5.5.
2 Data
For checking the flaring events in giant stars we used a set of 706 stars compiled from the lists of D17 with radii less than 30 solar radius (666 stars), and from YL19 (80 stars in this paper, 40 stars are common in the two lists). The stars in the aforementioned lists were selected taking as well. Both these studies originally used the stellar parameters from the Kepler Input Catalog (KIC) database; D17 used KIC DR10 while YL19 used KIC DR25. However, recently, Berger et al. (2018) revised the radii of the Kepler stars, and used the values from Mathur et al. (2017) supplemented with information from other sources. The Revised TESS Input Catalog (Stassun et al., 2019) (hereafter TICv8) contains most of the stars we planned to study. Thus, it is timely to revise the flaring giant statistics in the light of the revised stellar parameters.
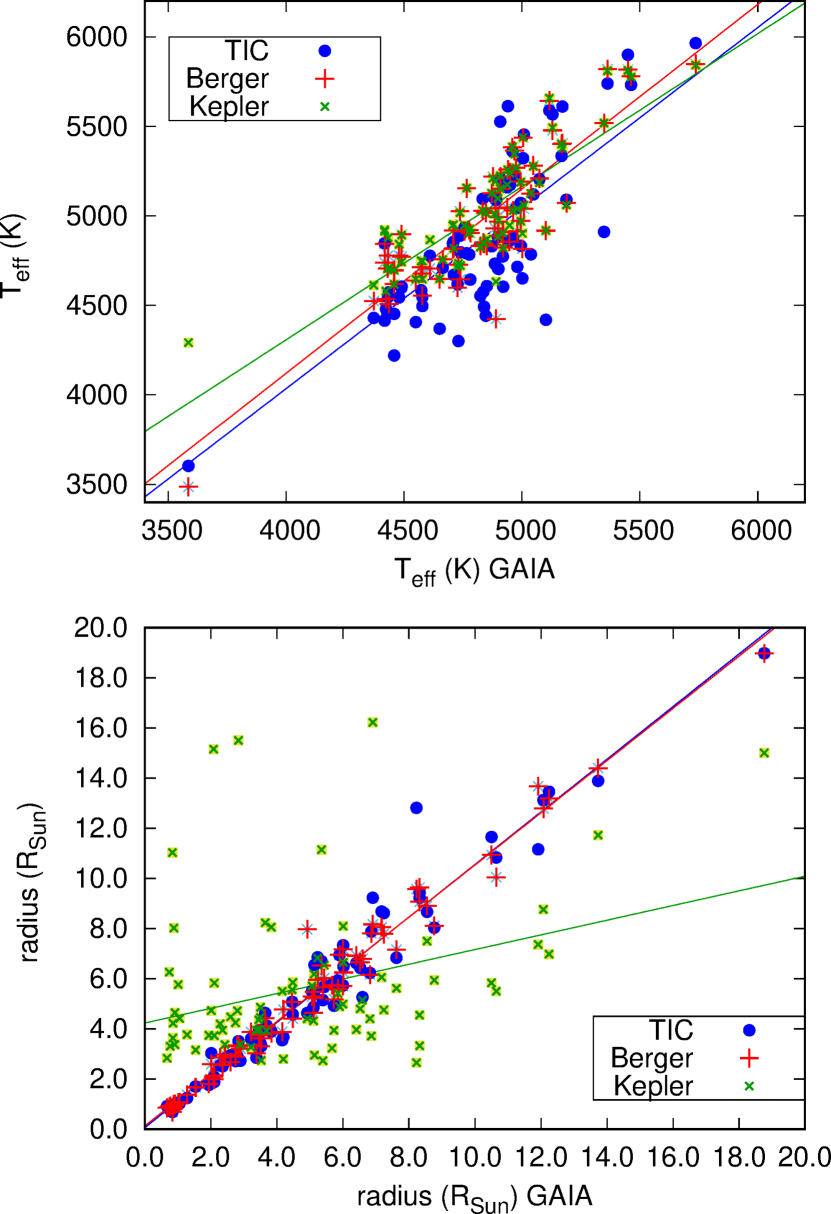
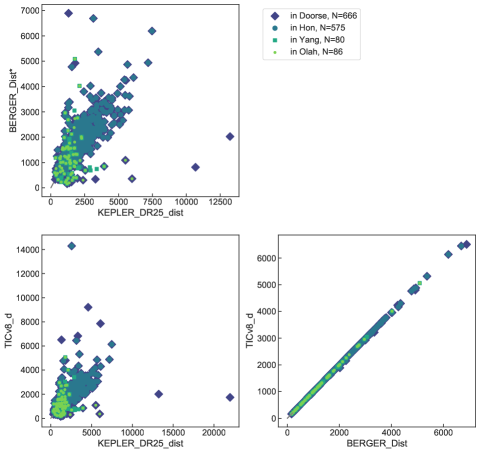
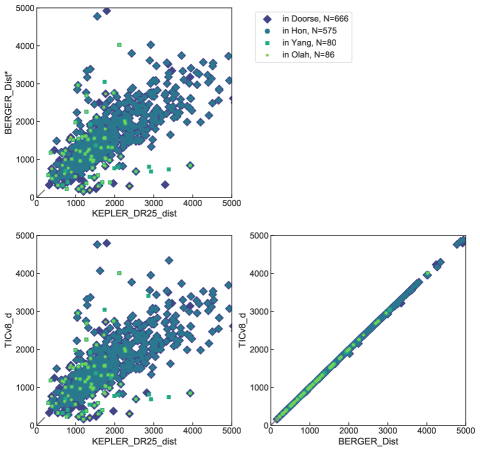
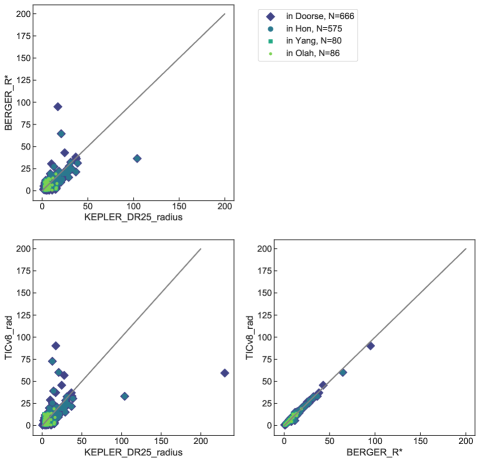
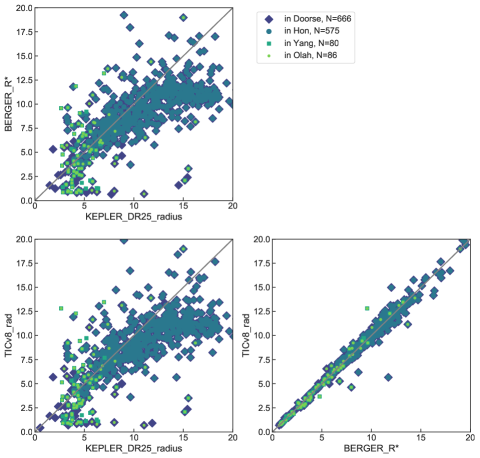
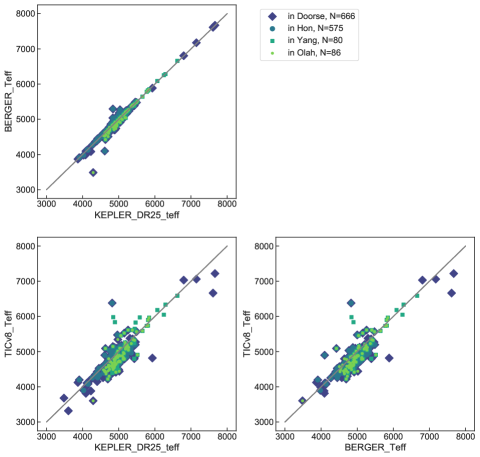
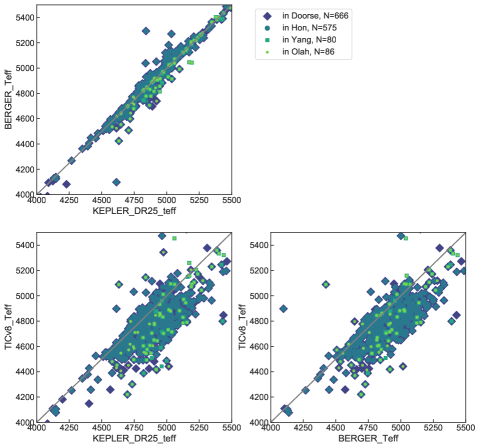
To decide the most useful catalog to represent stellar parameters for our study, in Fig. 2 we plotted and radii of those 77 flaring stars from the resulting 86 (see Sec.4, Table LABEL:tab:long) which have values in all of these catalogs: KIC, Gaia DR2, TICv8 and that of Berger et al. (2018). The result shows that concerning the KIC data, the radii of the stars strongly deviate from the values comparing to the other three sources; data from Berger et al. (2018), Gaia DR2 and TICv8 agree well with each other. The temperature values of Berger et al. (2018) and KIC have a small, on average 100 K systematic difference comparing to the Gaia DR2 and TICv8 data. The mean effective temperature of the 77 stars from the Gaia DR2 and TIC catalogs are and , whereas from Berger et al. (2018) and KIC are and , respectively. We note, that the temperature values in Gaia DR2 and TIC catalogs, and that of in KIC and Berger catalogs are mostly of the same origin, as shown by these averages as well. For the full D17+YL19 sample of giants used in this paper comparisons of the temperatures, radii and distances (which are important for the radius determinations) are compared in Appendix A on Figs. 19–21.
In this paper we used the long cadence Kepler Pre-search Data Conditioning (PDC) light curves from DR25 with the help of various facilities of the NASA Exoplanet Archive. Finally, and radii of the stars in the tables of results of the present paper are taken from TICv8 (Stassun et al., 2019), if not available, than from Gaia DR2 and KIC DR25, in this order.
3 Methods
To identify the flaring giant stars we used conventional (visual inspection) and automated pipeline search in combination. The first approach to check if the stars were indeed flaring in D17 and YL19 was simply to inspect their light curves one by one visually. First we kept the seemingly truly flaring and the questionable cases and got a list of stars that were good candidates as indeed flaring giants.
Next, a flare search made use of an automated pipeline accompanied by visual inspection. To this end, we ran an updated version of the flare detection algorithm from Günther et al. (2020) on the detrended Kepler light curves. First, we computed a Lomb-Scargle periodogram to identify (semi-)periodic modulation caused by stellar variability or rotation. Then, we removed the dominating periodic signal using a cubic spline with knots spaced at one tenth of this period. During this step, we also identified and masked all outlier datapoints at 3- by sigma clipping the data residuals. We repeated this entire process two more times or until no new periods were found. Finally, from the collected list of all outliers, we considered those to be flare-like events which contained a series of at least three subsequent 3- outliers.
These candidates were then visually inspected to decide if they should be declared a flare or a false positive. For this, we used the prior knowledge of typical M-dwarf flare profiles in white light, which typically show a rapid rise followed by exponential decay. However, we also identified and recorded various shapes that were clearly distinct from the stellar variability, but did not exactly match the classical rapid rise and exponential decay profile. These might have been altered by quasi-period oscillations, scatter, instrumental effect, multiple flare events — or a different physical process leading to the flare origin.
We cross-matched the lists from the two approaches (purely visual, and automated pipeline combined with visual inspection) and checked again the questionable cases. Those stars which show brightenings that we considered unlikely to be flares were deleted from the list. This way we got a final list of 86 flaring stars.
Next, we run the pipeline FLATW’RM (FLAre deTection With Ransac Method) of Vida & Roettenbacher (2018)111https://github.com/vidakris/flatwrm/ for each target of the final list of the 86 flaring stars for independent automated flare detections. Finally, the individual flare detections carried out by the two independent pipelines from Günther et al. (2020) and FLATW’RM of Vida & Roettenbacher (2018) were cross-matched, and a flare was considered real when it appeared as a result from both pipelines.
The observed flare duration is the time difference between the last and first datapoints of the flares which are above the 3- detection limit, and, due to the long (30 min) cadence, this underestimates the true flare duration especially for shorter flares.
For calculating the relative flare energies (that is the flare energies relative to the quiescent star) we made use of the program FLATW’RM (Vida & Roettenbacher, 2018) as well. To run FLATW’RM we set the minimum number of flare points to two, and the detection level to 3-. This way we could minimize the number of false positives at the cost of missing some smaller events. As template a simple ”classical” flare shape was used (Davenport et al., 2014); we discuss the effect of this simplification in the flare energy calculations of complex flares in Section 5.1. From the relative flare energies the absolute flare energies were derived by multiplying values by the base luminosity of the quiescent flare hosting star. Base luminosities in most cases are obtained using stellar effective temperatures and radii from TICv8 (if not available, then from Gaia DR2 and KIC DR25, see Table LABEL:tab:long) and assuming blackbody radiation through the Kepler filter. For more details on flare energy calculations see Paper I (their Sect. 6).
Rotational periods of the flaring stars were calculated using the Lomb-Scargle algorithm provided by the NASA Exoplanet Archive Kepler Stellar Table.
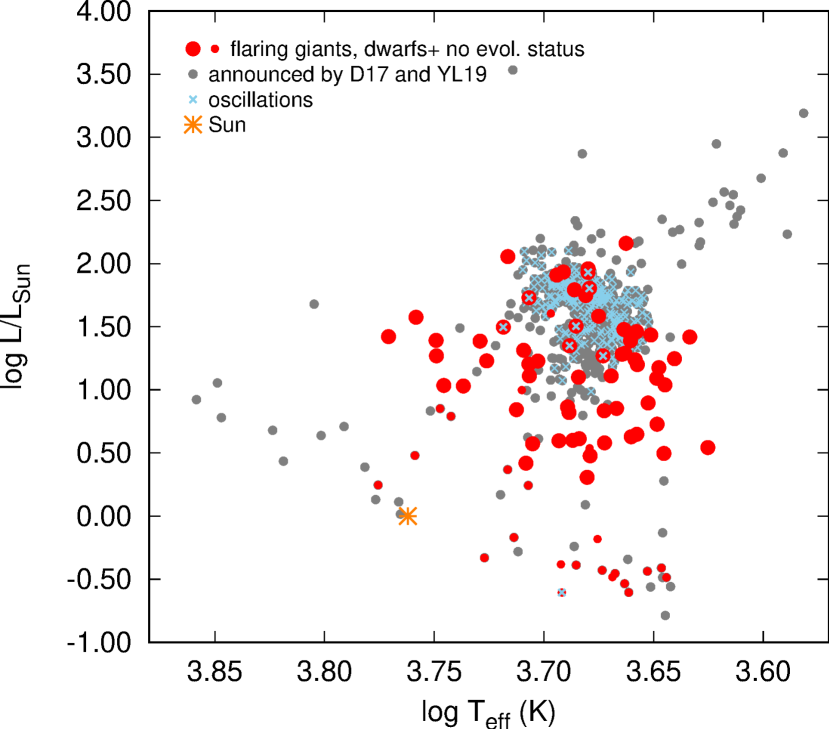
overlapping them on the figure. Orange star marks the location of the Sun. See the text and Fig.22 for more.
4 Results
4.1 The confirmed flaring giant stars
Among the 706 giant stars that we compiled from the lists of D17 and YL19, we confirm the detection of flares in 86 cases, and do not measure any significant flare signal in the rest of the sample. We also confirm the detection of flares for 53 of the 80 flaring red giants that were found by YL19.
As already mentioned in the Introduction, according to Davenport et al. (2019) the false positive flare detections in Davenport (2016) originated from the earlier version of the appaloosa code which left sharp or peaked pseudo-structures in the residuals from the periodic signals. Such a failure might happen when using automated search for flares in other, earlier codes as well. When discussing what kind of variability was behind the false positives in D17, YL19 mentioned pulsating stars, but without any further detail (see their Sections 2.2 and 3.2). The origin of the high number of false positive flare detections has finally been unveiled with the help of the recent papers by Hon et al. (2019) and Gaulme et al. (2020).
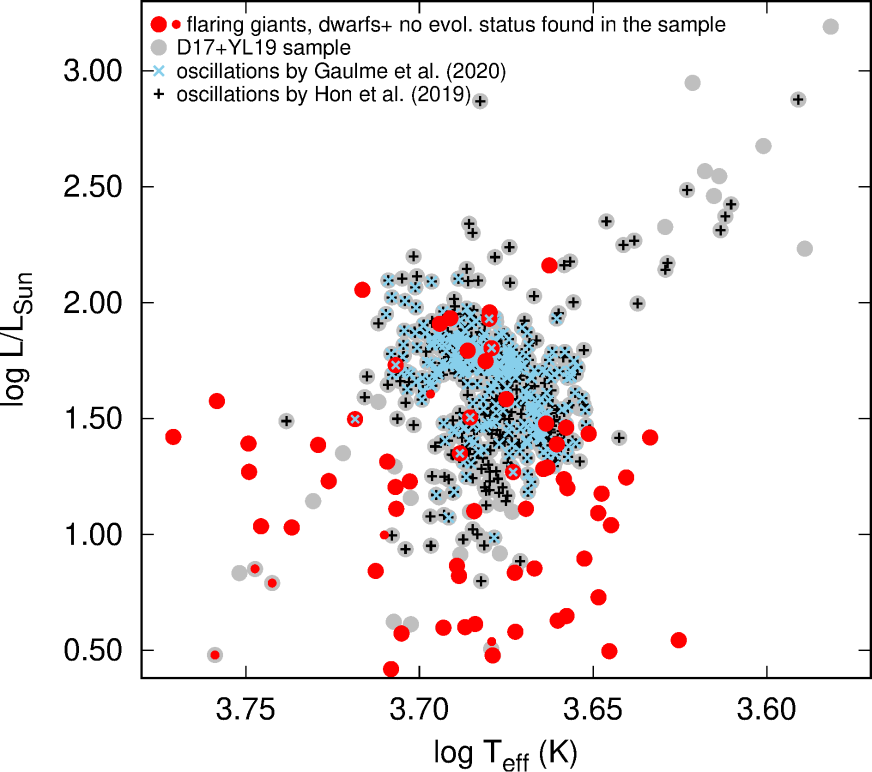
Cross-matching the 666 stars from the D17 flaring giant sample with the results of Hon et al. (2019) we found 577 common stars meaning that these could be in fact oscillating giants. These 577 oscillating stars by Hon et al. (2019) include those 310 brighter ones (Kpmag ) from Gaulme et al. (2020) detected independently. Visualizing these results, the HRD of the studied sample and our results are shown in Fig.3, where the brighter subsample of the oscillating giants derived by Gaulme et al. (2020) are plotted with light blue crosses. In Fig.22 an enlarged version of the dense part of Fig.3 is found including also the oscillating stars from Hon et al. (2019) cross-matched with our sample. Taking these evidences into account we can conclude that the vast majority of the false positive flaring giants we found are in fact oscillating stars. Of course during co-adding and cross-matching samples of many stars from different sources may result in a few misclassifications, but we are confident that this number is very small. It turns out that flaring stars show oscillations as well (e.g., the Sun), but among our verified flaring giants we found only a few. We discuss the incidence of oscillations in flaring giants in Sect. 4.3.2.
The stellar parameters from the TICv8 (if not available, then from Gaia DR2 and KIC DR25), the rotational periods calculated using the Lomb-Scargle algorithm provided by the NASA Exoplanet Archive Kepler Stellar Table, and the number of detected flares are given in Table LABEL:tab:long. We note that the luminosity classes reported in the TICv8 indicate that 17 of the 86 flaring stars are actually dwarfs, and another 8 stars are not found in the TICv8, so for these no evolutionary status is given. Therefore, the number of flaring giants we confirm is at best 69 – only confirming a tenth of the originally claimed discoveries of D17. Fig.3 shows a clear main sequence with the position of the Sun marked, drawn by the polluting flaring dwarfs.
There are 17 stars in the combined sample of 706 flaring giant candidates from D17+YL19 which we find uncertain cases to classify as flaring giants for various reasons, like too short or no rotational periods, blends and possible oscillating or pulsating nature of the variability. They are listed Table 4 with explanations; six stars in the table are considered as dwarfs in TICv8.
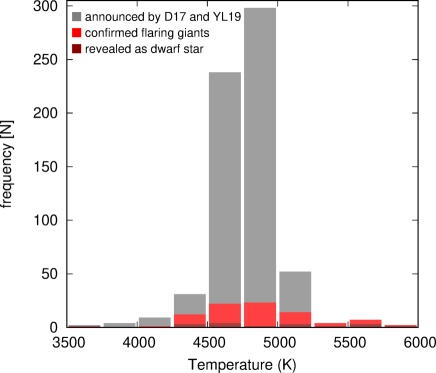
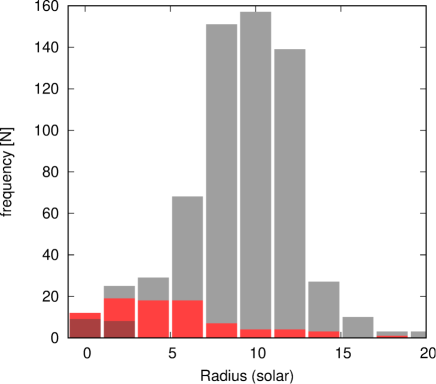
The distributions of effective temperatures and stellar radii of both the full sample and the confirmed flaring giants are displayed in Fig. 4. The two panels show that only 10-12% of the giants of the D17+YL19 candidates do exhibit flares. The histogram of effective temperatures shows that the distribution of the confirmed flaring stars is very similar to that of the whole sample. To the contrary, the distribution of radii is significantly different: the whole sample peaks at about 10 whereas the distribution of confirmed flaring stars peaks between 3 and 7 . This is well in line with the finding of Gaulme et al. (2020) (their Fig. 9., upper part of the bottom panel), showing that highest number of the radii of active giants on the RGB is around 5-6 . The part of the sample with the smaller radii mostly consists of dwarf stars (dark red color in Fig. 4), which contaminate the sample according to TICv8.
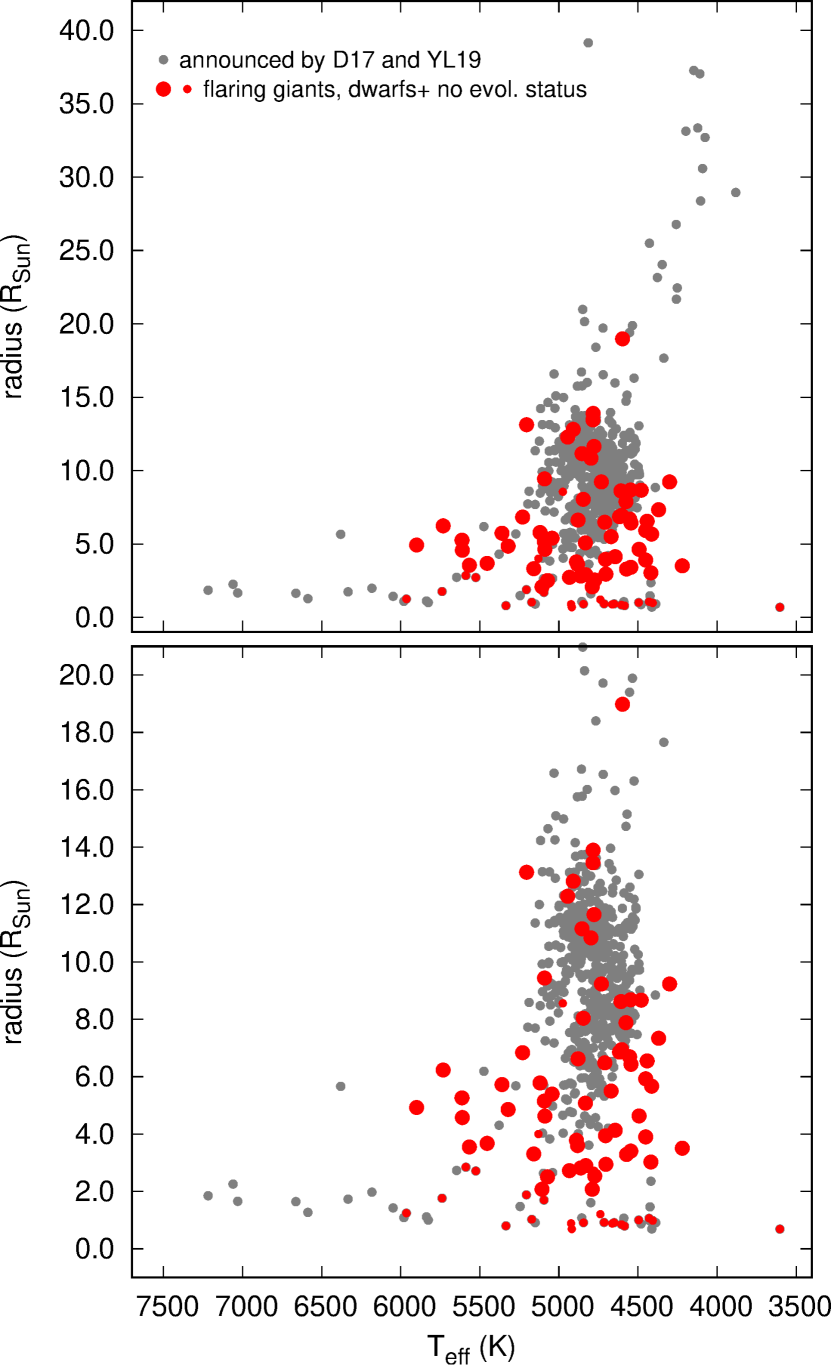
Stellar radii vs. temperature is shown in Fig. 5, in the upper panel the whole investigated sample while in the lower the most dense part, containing all the resulted flaring stars, are plotted. The dense group of false positive flaring giant stars (grey dots) with radii between 6-14 in the temperature range between 4500-5200 K are mostly oscillating red giants as it is suggested by our cross-matching results detailed above.
Magnetic fields are measured in 29 single G-K giant stars via the Zeeman-effect by Aurière et al. (2015, Fig. 5) depicting a well-defined ”magnetic strip” on the HRD indicating the maximum convective turnover time () on the tracks and presenting Rossby-numbers (ratio of the rotational period and the convective turnover time, ) of the studied stars. The origin of these fields is thought to be working dynamos, whose existence is predicted by Charbonnel et al. (2017, their Fig. 6., upper right panel) showing that low Rossby-numbers, which is essential for the generation of the magnetic field, are characteristic on the segments of the theoretical evolutionary tracks where the giant stars with the measured magnetic fields are found (Aurière et al., 2015). The location of the ”magnetic strip” drawn both by observations and theory agrees well with the position of the flaring giant stars shown in Fig. 3, confirmed in this paper.
4.2 Activity and rotation
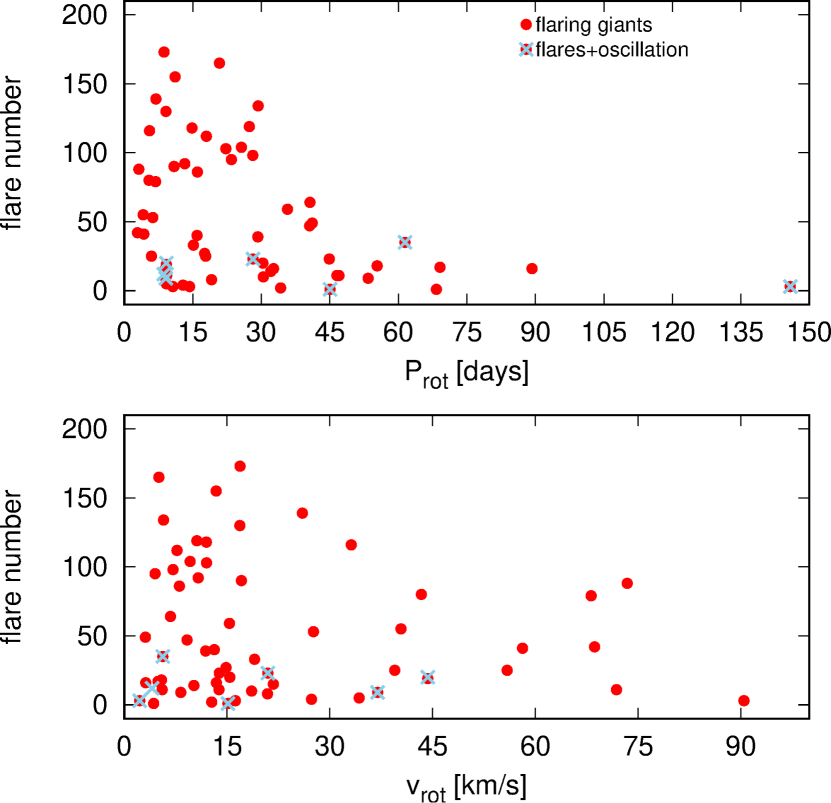
We plotted the number of flares as a function of the rotational periods and rotational velocities in Fig. 6. Looking at the upper panel of the figure it is seen that flaring giant stars with rotational periods from the shortest ones to about 30-40 days can produce both higher and lower numbers of flares. There are 15 stars on Fig. 6 with rotational periods longer than 35 days, with flare numbers below 65, all of them are giants, and constitute about one quarter of the confirmed flaring giant population (minimum 61 stars). From the lower panel of Fig. 6 no real disctinction of flare numbers between stars with lower and higher rotational velocities is seen, though a slight decrease of showing less flares with higher rotational velocity is maybe present. However, due to the low number of stars with higher rotational velocities, this change is not significant. The investigation of the connection (if any) between the rotational properties and flare numbers of giant stars needs detailed knowledge of the physical parameters of these giants which extends the scope of the present paper.
4.3 Binarity and oscillations among the flaring red giants
4.3.1 Binarity
Gaulme et al. (2020) searched for the incidence of binary systems among the red giants that show photometric rotational modulation. They obtained multi-epoch spectroscopic observations for a subsample of 85 stars. Among these 85 stars, 14 belong to the 61 flaring giants studied in the present paper (see Table LABEL:tab:long). Of these 14 stars, one is a subgiant (or a small red giant) spectroscopic binary (KIC 11551404), nine are clear red giants in spectroscopic binaries with no oscillations, one is an oscillating (weak oscillations) red giant in a spectroscopic trinary (KIC 8515227), one is a single fast rotating red giant (KIC 11087027), and two are fast rotators (KICs 5821762 and 8749284) for which the spectroscopic signal is too noisy to assess any radial-velocity variability (Fig. 7 and Table LABEL:tab:long). Even though only a complete spectroscopic survey would be needed, this information confirms that close binary systems are likely to compose a large fraction of the sample: among the 61 giants, 11 SBs represent already 18 %.
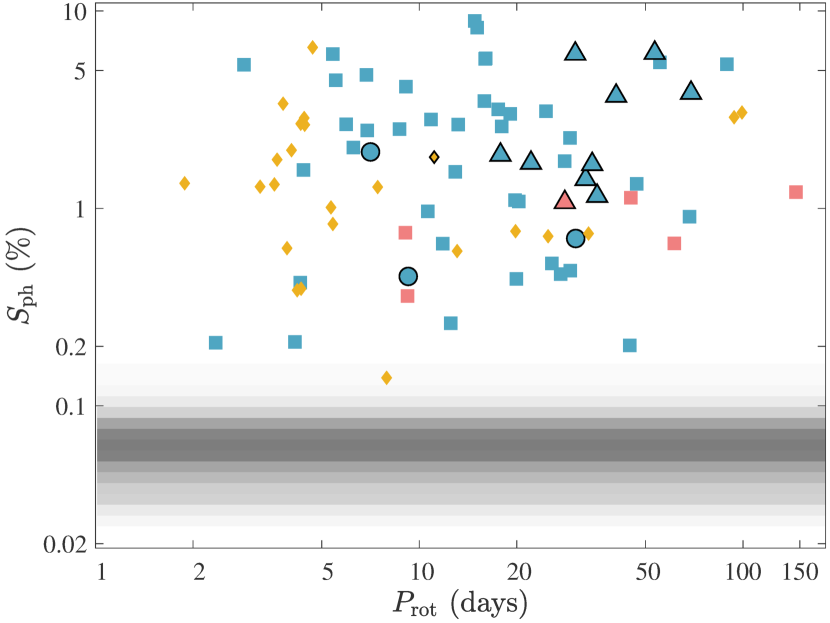
We also computed the photometric index (percent) for each target. This parameter is the mean standard deviation of the time series computed over five rotational periods (Mathur et al., 2014). It is commonly used as a proxy of magnetic activity in photometric time series: the larger , the larger the surface magnetic field. Fig. 7 shows this parameter of all 86 stars from Table LABEL:tab:long as a function of the rotational period. No particular trend is visible but it is worth noticing that its value is always higher than 0.2% for all the flaring giants, whereas regular inactive red giants have % (Gaulme et al., 2020). In addition, a large fraction of the targets display values of larger than 1%. According to the spectroscopic study of 85 red giants with activity in Gaulme et al. (2020), red giants with % are fast single rotators, whereas the vast majority of red giants with % belong to close binary systems (see their Fig. 12). We can therefore rightly suspect that a large fraction of our flaring giants do belong to close binary systems.
4.3.2 Oscillations
Red giants are known to display oscillations in the vast majority of cases (99% Gaulme et al., 2020). The only situation where oscillations are not detectable corresponds to red giants in close binary systems: more than 85% of the red giants with no oscillations are in close binaries (Gaulme et al., 2020). The presence of oscillations is thus a parameter that is complementary to large values of to indicate the presence of close binary systems. We therefore looked for oscillations in all the 86 targets of the sample. We note that we could not search for oscillations of main-sequence or subgiant stars of the sample because the sampling of the Kepler light curves (30-minutes cadence) is not fast enough to access stars with frequency at maximum amplitude larger than about 300 Hz, that is, not smaller than red giants.
Despite 20 targets were already listed in Gaulme et al. (2020) and 24 in Hon et al. (2019) (the same plus four), we thoroughly restudied them one by one. Indeed, light curves with flares are tedious to deal with as a single uncorrected flare event is able to ruin the power spectrum of the light curve, in which we search for oscillations. Hon et al. (2019) report the detection of oscillations for the 24 stars that are common to our list. To the contrary, Gaulme et al. (2020) reports the detection of oscillations in only four red giants of the same list. We reprocessed one by one the light curves thanks to the flare date and duration produced by the flare automatic pipeline. We systematically cut the flares and bridged them with a smooth of the light curves during the gaps. We also manually removed a few remaining flares that were not picked by the algorithms. Except for the removal of the flares, we processed the data in the same way as performed in Gaulme et al. (2020) and we refer to this paper for more details.
Of the 86 flaring stars, we detect red-giant oscillations in seven of them (KIC 4680688, 5286780, 5808398, 6445442, 7363468, 8515227, and 8951096) and we rule out all of the others. The discrepancy with the results of Hon et al. (2019) are explainable by the fact that they make use of an automatic pipeline based on machine learning that deals with almost all of the Kepler red giants observed by Kepler. Individual errors can happen here and there, and it is not surprising that it did so on light curves that have large flares, which are a terrible source of systematic noise in the Fourier domain. The oscillating stars are indicated in Fig. 7 in the form of red symbols. We also detect a Doradus– Scuti type oscillator in the sample.
It has been observed that red giants in close eclipsing binary (EB) systems have peculiar photometric properties (Gaulme et al., 2014). Among the 35 Kepler red giants that are confirmed to belong to EBs, 18 display regular solar-like oscillations – with their amplitudes matching the empirical expectations (e.g., Kallinger et al., 2014) – and no rotational modulation. All of the remaining systems display rotational modulation, seven with partially suppressed oscillations, and ten with no detectable oscillations (Gaulme et al., 2014, 2016, Benbakoura et al. submitted). Gaulme et al. (2016) showed that the non-detection of oscillations is not an observational bias. This is observed in the closest systems, where most orbits are circularized, and rotation periods are either synchronized or in a spin-orbit resonance. Such a configuration is observed for systems whose orbital periods are shorter than about days. Gaulme et al. (2014) suggested that the surface activity and its concomitant mode suppression originate from tidal interactions. During the red giant branch, close binary systems reach a tidal equilibrium where stars are synchronized and orbits circularized (e.g., Verbunt & Phinney, 1995; Beck et al., 2018). Red giant stars are spun up during synchronization, which leads to the development of a dynamo mechanism inside the convective envelope, leading to surface spots. The magnetic field in the envelope likely reduces the turbulent excitation of pressure waves by partially inhibiting convection. Since spots can also absorb acoustic energy, these two effects lead to the suppression of oscillations.
| KIC No. | Kpmag | lum. class (TICv8) | source | flare no. | remarks | |
|---|---|---|---|---|---|---|
| 4680688 | 13.476 | 9.190 | GIANT | pp | 20 | single? |
| 5080290 | 9.507 | — | GIANT | — | 6 | Dor / Sct hybrid |
| 5286780 | 13.963 | 8.625 | — | G+20 | 12 | |
| 5808398 | 11.455 | 145.81 | GIANT | G+20 | 3 | |
| 6445442 | 13.194 | 45.032 | GIANT | G+20 | 1 | |
| 7363468 | 12.386 | 61.445 | GIANT | G+20 | 41 | |
| 8515227 | 11.176 | 28.157 | GIANT | G+20 | 23 | triple-lined sp. binary |
| 8951096 | 13.336 | 9.074 | GIANT | G+20 | 9 |
Summary of the results on binarity and oscillations of the flaring red giants are plotted in Fig. 8. The list of six giant stars plus one of unknown evolutionary status that are both flaring and show oscillations, and one Dor / Sct type star is given in Table 1. The star without given evolutionary status (KIC 5286781) seems to be a dwarf star concerning its position in the HRD, see Fig. 8. The flaring rate of the six giant stars with oscillations in Table 1 (16 flares on average) is much lower than the average flare number of the 61 giants (52 flares on average), which is well seen in Fig. 6 where the oscillating red giants are marked with light blue crosses. This fact is in line with the result of Gaulme et al. (2016) showing that the presence of oscillations suggests weaker activity. At last, we added the four non-oscillating red giants (KIC 3955867, 4569590, 7943602, 9291629) that belong to eclipsing binary systems studied by Gaulme et al. (2016), which are observed to display flares too. Their parameters are known from dynamical analysis, that is, a combination of high-resolution spectroscopy and eclipse photometry.
4.3.3 The case of KIC 5080290
We list KIC 5080290 in Table 1 as Dor / Sct hybrid without derived rotational period. This star was identified as a Sct star earliest by Uytterhoeven et al. (2011) listing four independent Sct-type frequencies. However, this star had at least six unambiguous flares concerning our cross-matched results with logarithmic energies between [erg]. KIC 5080290 is a bright star, it is 9.51 mag. in G-band, the neighbour stars, not even close by, are several magnitudes fainter.
Just recently however, Zwintz et al. (2020) showed that Cas, an F2III Sct type pulsator with only three p-mode frequencies of low amplitude, has a complex magnetic field very possibly of dynamo origin. Cas is a terminal-age main-sequence (TAMS) star with 0.58 and 140 K, rotating very fast with d which probably helps to maintain the dynamo even at such high temperature (Zwintz et al., 2020). Thus, KIC 5080290 could be another example of a pulsating star with magnetic activity.
The mass of Cas is about 2.1 (or 1.910.02 as given in Che et al. (2011)) and is already moving away from the TAMS. Its age is 1.180.05 Gyr derived by Che et al. (2011). We may suppose that such a star as Cas could be a progenitor of flaring giant stars investigated in this paper. Specifically, KIC 2852961, having the highest energy flares among the flaring giants confirmed in this paper, has a mass of 1.70.3 and its age is about 1.7 Gyr. As discussed in Paper I it is imaginable that the progenitor of KIC 2852961 was an A5-F0 type star.
5 Discussion of flares
5.1 Reliability of the derived flare numbers and their energies
For testing the performance of the cross-matched results of flare recoveries from the D17+YL19 sample by the pipeline from Günther et al. (2020) and FLATW’RM of Vida & Roettenbacher (2018), we compared the flare list of KIC 2852961 from the present paper with the visually found and checked flares published in Paper I, Table 3. From the 59 flares in Paper I our automated detection found 51. From the missing eight flares seven belong to the low energy regime [erg] (equivalent with 1-min relative energy) or less, where the probability of detecting a flare starts to diverge noticeably from 100%, according to the test results presented in Paper I (see Sect. 7 in that paper). One non-detection belongs to a complex flare. However, the total number of automatically detected flares of KIC 2852961 in this paper is, by coincidence, also 59, due to detecting complex events with multiple peaks as series of single events by the pipelines. This comparison shows that we successfully avoid false positives on the cost of missing some real, mostly small energy flares, and the overall picture of the detected flare numbers and energies are not misleading.
We compared the derived flare energies of 51 flares of KIC 2852961 which are available both from Paper I and from the present paper. From these flares 24 are complex and 27 are simple events. Since we use a simple flare template for automatically derive the flare energies by FLATW’RM (Vida & Roettenbacher, 2018) we also checked how this simplification affect the resulting flare energies. The simple mean of the difference between the two approaches (in the sense of energies from the present paper minus from Paper I) is showing that there is a small shift between the results due to the different used in the two sources. Separately from the complex and simple flares the results are and , respectively, which is only a small difference. The higher standard deviation of the mean of the complex flares points towards a slightly higher average scatter of the resulting flare energies when using the simple template for calculating the energies of complex events, but this does not modify the FFDs noticeably as it is shown in Fig. 13 later, see Sect. 5.3.
5.2 Distribution of flare energies
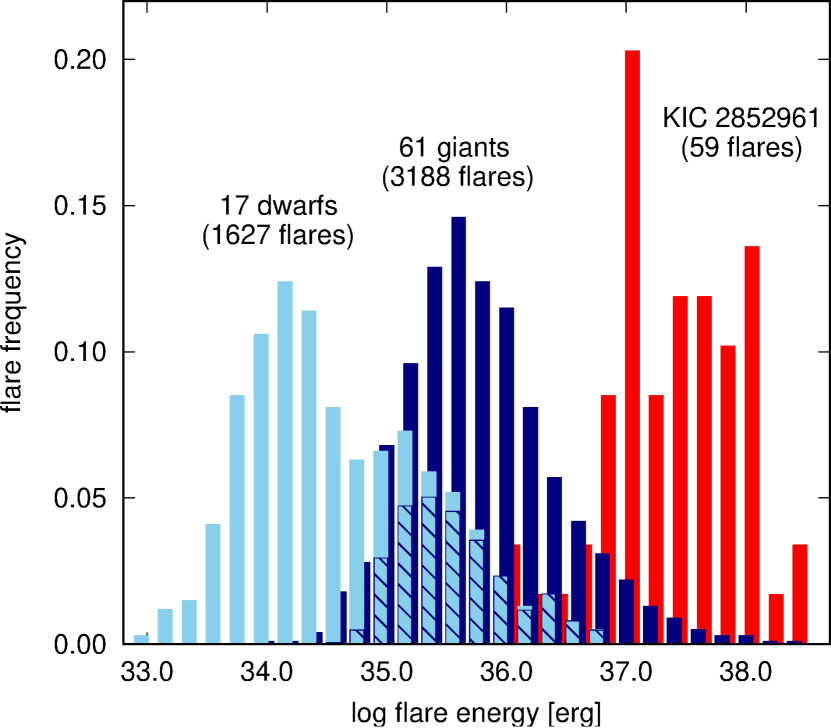
In Fig. 9 flare energy distributions of the 17 dwarfs (light blue), 61 giants (dark blue) and KIC 2852961 (red) from Table LABEL:tab:long are compared. Missing are those eight stars for which no evolutionary status is given. The difference in the mean flare energies between dwarfs and giants are clear. The extended tail of the flare energy distributions of giants is mostly made up by the excess high energy flares of KIC 2852961.
On the histogram of the dwarfs (light blue) a small secondary maximum is found towards higher energy. This hump is mostly due to two stars listed as dwarfs in TICv8, KIC 9116222 (260 flares) and KIC 11515713 (186 flares) which have approximately one order higher energy flares than rest of the dwarfs. The common energy distribution of these two stars are marked with slanted blue lines in Fig. 9. These dwarfs could be G-type superflaring stars, both of them have effective temperatures about 5500 K, see also Shibayama et al. (2013, their Fig. 8). On the other hand, radii are 2.7 and 2.8 (Table LABEL:tab:long) and values from LAMOST222http://dr5.lamost.org/ are 3.69 and 3.88 for KIC 9116222 and KIC 11515713, respectively, suggesting slightly evolved, subgiant evolutionary status of these stars. (In the LAMOST catalog 45 stars out of the 86 from Table LABEL:tab:long have spectra, the LAMOST parameters (, and [Fe/H]) of these stars are given in Table 5 as supplementary information.)
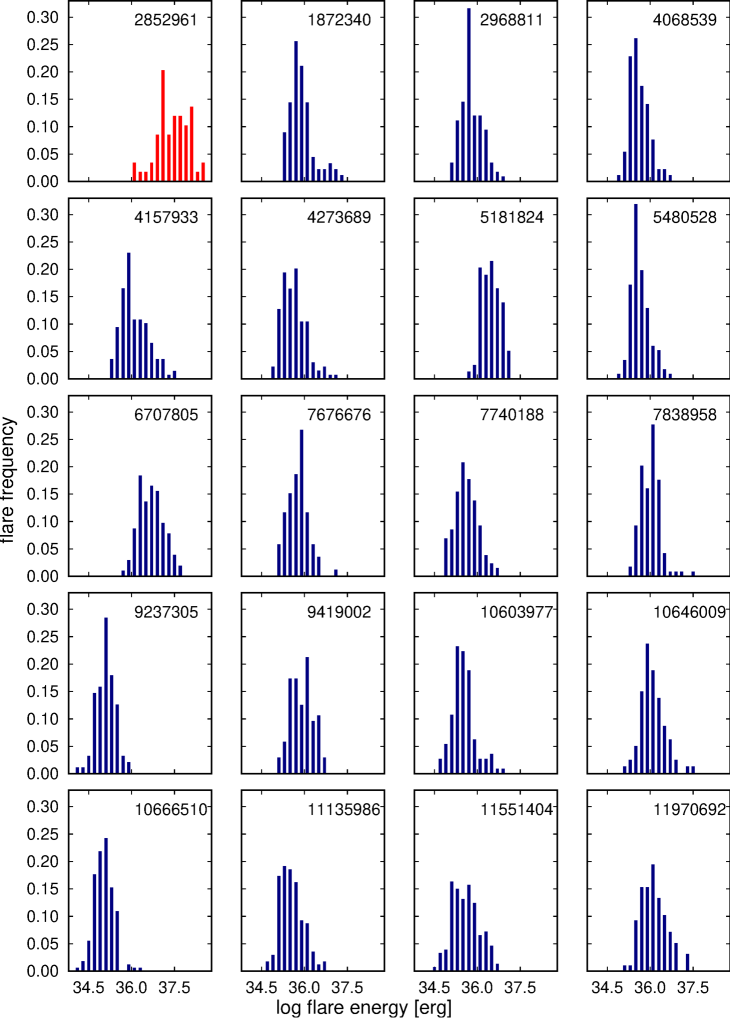
From the final results of the 86 stars in Table LABEL:tab:long we selected 19 giant stars with the highest number of observed flares in order to compare their flare energy distributions. The basic stellar parameters (, , ), quiescent stellar luminosity values in the Kepler bandpass, average flare energies, equivalent times (=relative flare energies), histogram skews, and remarks if the star is a member of a binary system, are given in Table 2. Comparing these stars with that of KIC 2852961 (Table 2, bottom line) we find that the latter has on average much higher energy flares than the selected 19 flaring giants. The flare energy distribution of KIC 2852961 reveals mostly high energy flares (Paper I, Fig. 15) opposite to the ones observed for the selected 19 stars which all show declining number of flares towards higher energies. The low energy parts of the histograms are affected by the recovery bias.
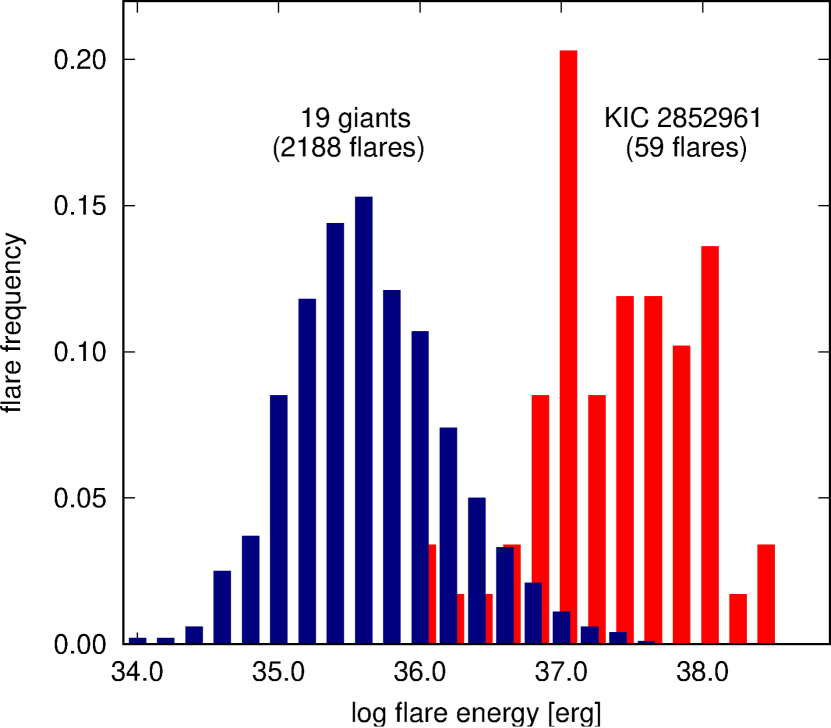
The individual flare energy distribution histograms of the 19 stars are plotted in Appendix C, Fig.23 together with that of KIC 2852961. Most of the histograms of Fig.23 are approximately symmetric or moderately positively skewed (skewness is less than 0.5, or between 0.5-1.0, respectively), except two cases with highly positive skew. Only the histogram for KIC 2852961 shows a small negative skew meaning that the mean flare energy is smaller than the peak of the distribution, i.e., the high energy flares dominate. The comparison of the distribution between 2188 individual flare energies of 19 stars together, and that of KIC 2852961 in Fig. 10 depicts the striking difference in the energy distributions in one figure.
From Table 2 it is seen that the flare characteristics of the two confirmed spectroscopic binaries (both SB2) are not different from the rest of the stars, therefore the binarity itself cannot be the ultimate cause of the difference between the flaring nature of the 19 stars and KIC 2852961. It has already been shown by Strassmeier et al. (1990, 1994) from observations of chromospheric activity at CaII H&K and H that, to the contrary of MS active stars in binaries, in case of evolved stars binarity does not play a crucial role in the activity level.
| KIC No. | number | mean | mean | histogram | remarka𝑎aa𝑎aSB1=single-lined spectroscopic binary; SB2=double-lined spectroscopic binary. | ||||
|---|---|---|---|---|---|---|---|---|---|
| [K] | [d] | of flares | [ erg/s] | [ erg] | [s] | skew | |||
| 1872340 | 5454 | 3.674 | 10.884 | 90 | 11.478 | 6.257 | 54.5 | 1.12 | |
| 2968811 | 4220 | 3.504 | 14.814 | 118 | 2.966 | 4.988 | 168.2 | 0.76 | |
| 4068539 | 4862 | 2.818 | 13.226 | 92 | 3.967 | 3.280 | 82.7 | 0.73 | |
| 4157933 | 5567 | 3.547 | 6.914 | 139 | 11.703 | 9.777 | 83.5 | 0.66 | |
| 4273689 | 5159 | 3.309 | 29.301 | 134 | 7.242 | 3.417 | 47.2 | 0.82 | |
| 5181824 | 4732 | 9.231 | 6.861 | 79 | 37.279 | 24.350 | 65.3 | 0.08 | |
| 5480528 | 4882 | 3.603 | 5.506 | 116 | 6.616 | 3.620 | 54.7 | 0.89 | |
| 6707805 | 5613 | 5.261 | 22.216 | 103 | 26.680 | 38.036 | 142.6 | 0.20 | SB2 |
| 7676676 | 4774 | 2.539 | 15.979 | 86 | 2.946 | 4.687 | 159.1 | 0.36 | |
| 7740188 | 4419 | 3.028 | 9.094 | 130 | 2.831 | 3.274 | 115.7 | 0.35 | |
| 7838958 | 5360 | 5.727 | 27.369 | 119 | 25.813 | 8.202 | 31.8 | 1.01 | |
| 9237305 | 5107 | 2.074 | 23.458 | 95 | 2.715 | 1.003 | 37.0 | 0.09 | |
| 9419002 | 5322 | 4.857 | 25.640 | 104 | 17.982 | 6.477 | 36.0 | 0.04 | |
| 10603977 | 4933 | 2.728 | 17.962 | 112 | 3.987 | 2.573 | 64.5 | 0.89 | |
| 10646009 | 4493 | 4.634 | 5.412 | 80 | 7.228 | 9.840 | 136.1 | 0.71 | |
| 10666510 | 4790 | 2.074 | 20.845 | 165 | 1.998 | 0.882 | 44.2 | 0.53 | |
| 11135986 | 4830 | 2.899 | 8.692 | 173 | 4.067 | 2.803 | 68.9 | 0.55 | |
| 11551404 | 4703 | 2.944 | 11.120 | 155 | 3.678 | 3.077 | 83.7 | 0.22 | SB2 |
| 11970692 | 4705 | 3.944 | 28.116 | 98 | 6.615 | 10.629 | 160.7 | 0.41 | |
| 2852961 | 4797 | 10.836 | 35.715 | 59 | 54.940 | 215.427 | 392.1 | -0.27 | SB1 |
5.3 Flare recovery completeness
We made flare recovery tests for the 19 most flaring giant stars and for KIC 2852961 to compare the results of the present paper with that of Paper I, using the code allesfitter (Günther & Daylan, 2019, 2020). We note that the tests were done and used only for long-cadence, 30-min time resolution data of Kepler with the method described in detail in Paper I, Sect. 7. The photometric precision of the 20 stars with their Kp magnitudes between 10.2-14.0 are similar444https://keplergo.arc.nasa.gov/CalibrationSN.shtml, so the effect of S/N has no, or very minor, influence of the test results.
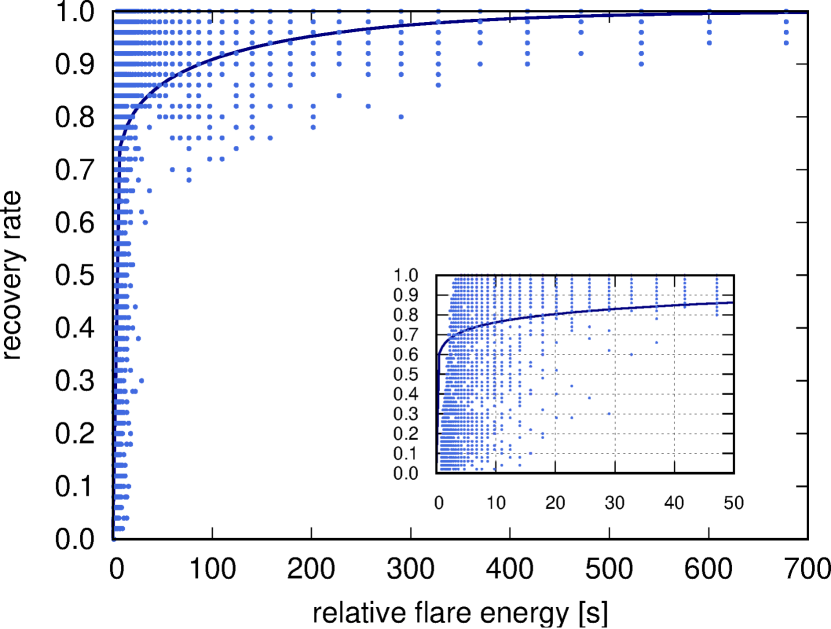
The recovered flare rates for 20 stars (19 most flaring giants plus KIC 2852961) were plotted together in the function of the relative flare energies of the injected flares in Fig. 11. The shapes of the individual test results proved to be very similar, so we tried to use the test as a single recovery application by fitting the test results with an arbitrarily chosen parameterized hiperbolic tangent () function tracking the envelope of the test results. This generalized function allows to automatically correct the detection bias of the cumulative number of flare frequencies towards lower energies for all stars in the same time. However, there are deviating points in Fig. 11 between s relative flare energies ( equivalent times), but most of these come from the recovery tests of three stars (out of 20) only. Fig. 12 shows the difference between applying the common recovery correction and the one realised for the star only in the most deviating case of KIC 5480528. The very small difference between the slopes of the fits to the cumulative number of flare frequencies proves that the use of a common correction function for all stars is appropriate.
The inset of Fig. 11 shows the lowest part of the relative flare energies of the test. The total number of flares to be corrected for recovery bias is 2247, and from these only 30 flares fall below 10 s equivalent time (1.3%) where the applied function does not follow well the envelope of the test results. We note that at the lowest relative flare energies (say, below 5 s) the test gave quite uncertain results, because at this range the data noise exceeds the lowest flare amplitudes. The other reason could be the limited (30-min) time resolution of the observing data.
At the end, from the generalized tanh recovery function we derived correction factors (multiplicative inverses) to estimate the real flare numbers which is significant only at the low energy ranges. These correction factors are used to provide the detection bias-corrected cumulative flare-frequency diagrams (FFDs) in Figs. 12–13–17.
5.4 Reliability of the flare frequency diagrams
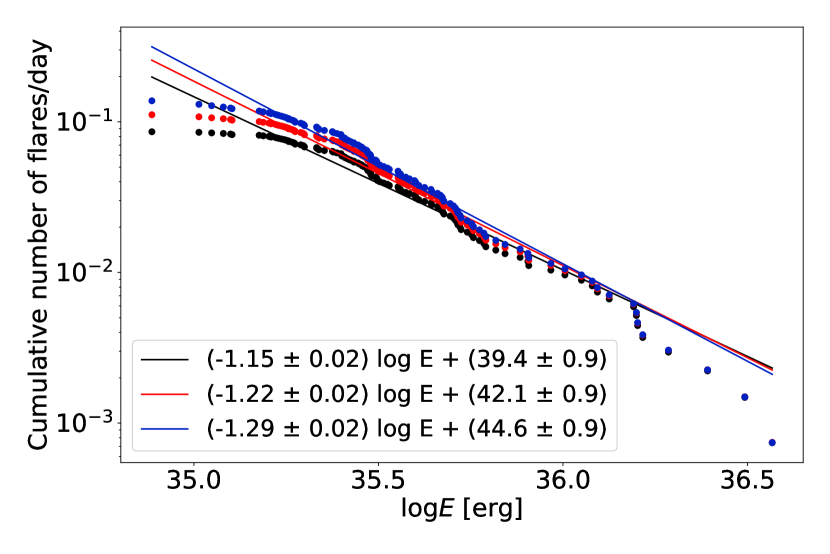
A flare frequency diagram (FFD) was drawn for KIC 2852961, with the method described in detail in Paper I (Sect. 6). This time we used the stellar parameters as given in TICv8, i.e., everything was done in the same way for KIC 2852961 as for the selected most flaring 19 stars. The result is plotted in Fig. 13 using grey and blue points from the original data and from the corrected flare recovery, respectively. The bias-corrected recovery values from Paper I (its Fig. 11) are plotted with orange crosses. The comparison with the blue points and orange crosses shows that mostly the low energy flares were not detected by our method as discussed above in Sect. 5.2. A very small shift in the cumulative energy derived in the present paper towards the lower values is also seen due to the different base stellar flux calculated from the temperature and radius given in TICv8 and in Paper I. However, the two distributions are very similar.
The result for the fit to the lower energy range (red line) yields a power law index of =1.310.02, while the result in Paper I is =1.290.02. Similarly, the fit for the high energy range (green line) yields =2.650.09, while the result in Paper I is =2.840.06. From these very similar results we conclude that the method we apply for the 19 frequent flaring giants give reliable frequency diagrams and fits.
5.5 Flare frequency diagrams of 19 giant stars
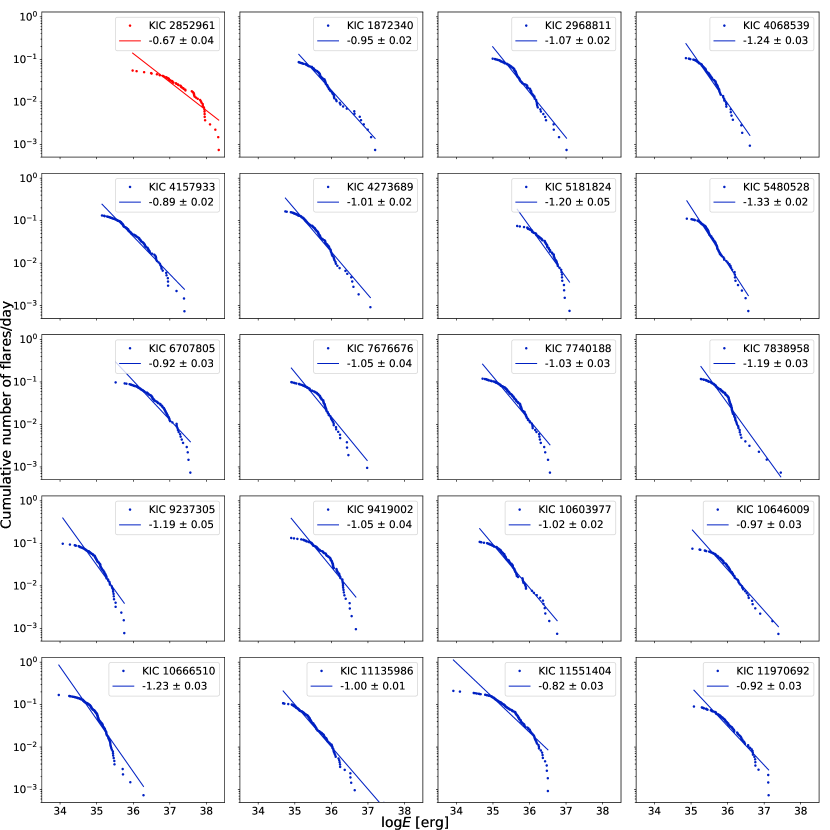
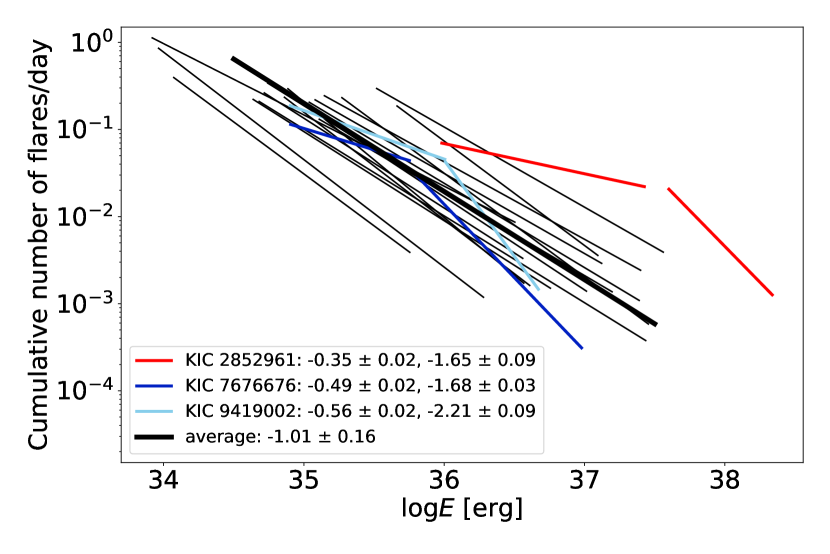
After correcting for the detection bias FFDs were constructed for the 19 most flaring giants stars from Table LABEL:tab:long, plotted in Fig. 14 applying simple linear fits to the data. Most of the FFDs can well be fitted with a single line, except KIC 11551404 whose FFD shows a continuous curvature. The slopes of the linear fits (without KIC 2852961) spread between 0.82 and 1.33 with errors between 0.02-0.05. The mean of the slopes translates to power law index for the 19 giants (cf. Fig. 14).
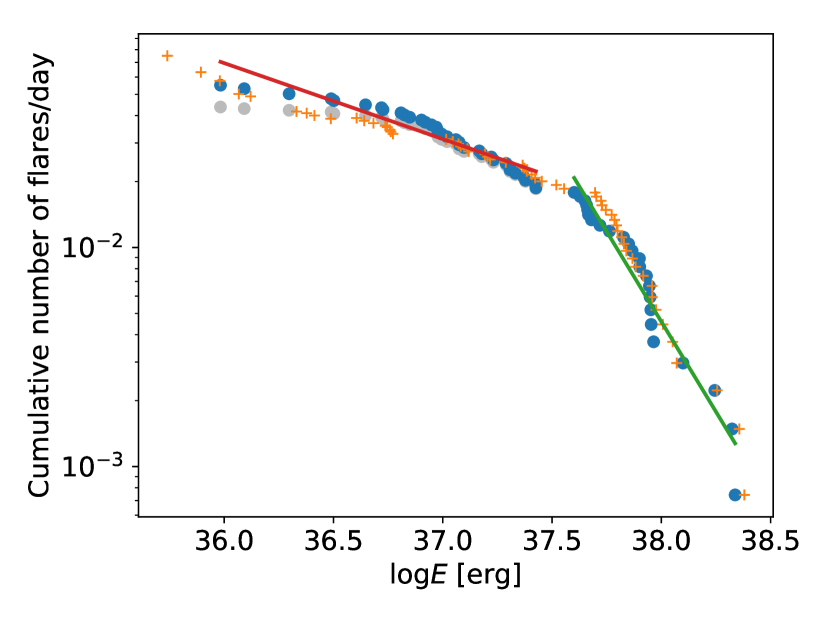
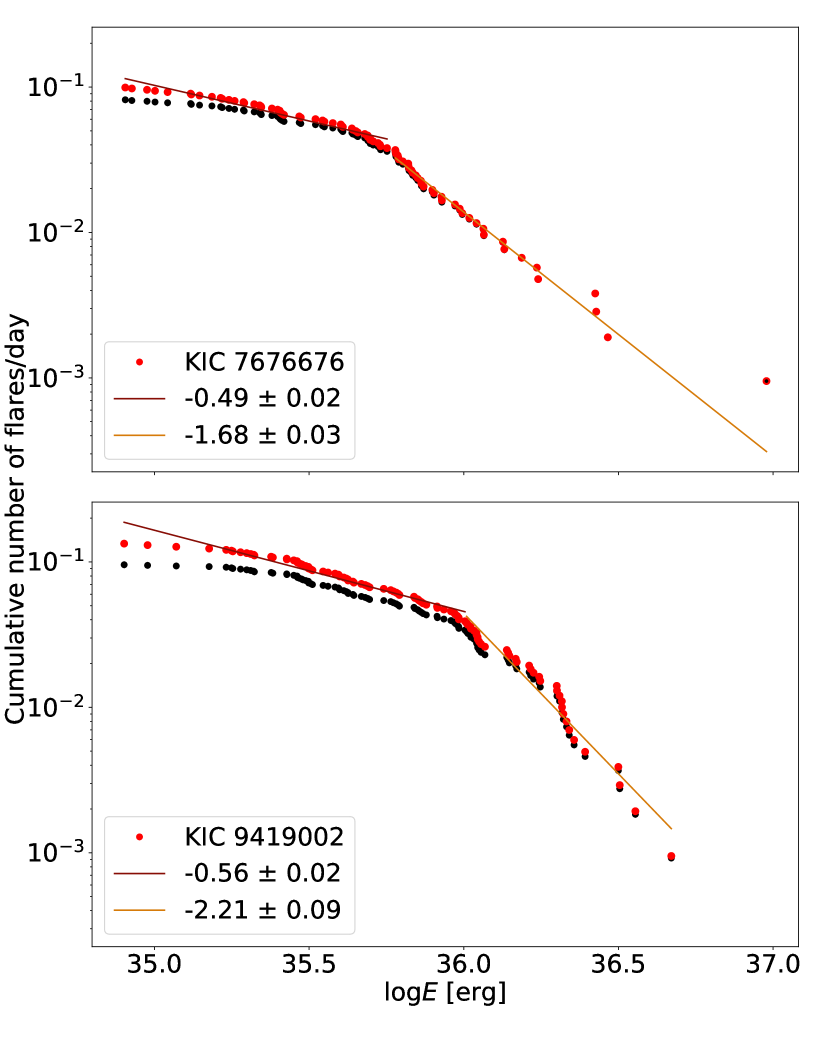
For KIC 7676676, and KIC 9419002 two-component linear fits shown in Fig. 15 look more appropriate. The breakpoints between the high- and low energy parts of the FFDs are at , 36.0, and 37.6 [erg] for KIC 7676676, KIC 9419002 (Fig. 15), and KIC 2852961 (Fig. 13), respectively.
Studying flare energy spectra of dwarf stars and that of the Sun with two distinct power-law regions Mullan & Paudel (2018) showed, that the breakpoint in an FFD appears at a certain critical energy which depends on the local magnetic field strength and the local density, thus it should not be the same for all stars. The energy range within which the flares are detectable on a given star depends on observational selection, for example low activity stars exhibit smaller number of flares and low energy flares cannot be detected at high S/N. Thus, it is not necessary that the critical energy lies inside the observable energy range of flares. If it is outside than no break appears in the FFD, as was suggested by Mullan & Paudel (2018). We may extend this important finding to FFDs of more evolved stars discussed in the present paper. The two FFDs plotted in Fig. 15 span about the same energy range, but the breakpoints of the power laws are different, suggesting different magnetic field strengths and densities of the atmospheres, which probably originate from different masses and evolutionary stages on the RGB.
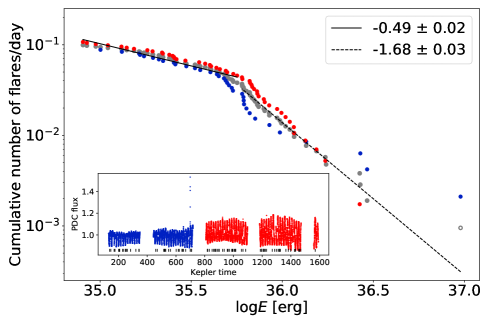
An interesting question is to explore the changes of the flare activity during different strengths of the overall activity of stars (activity cycles). We addressed this problem already in Paper I (see their Fig. 13). From the 19 selected stars KIC 7676676 shows continuous increase of the light curve amplitude suggesting increasing activity level of the star. In Fig. 16 FFDs are plotted for the time intervals of the lower (blue, 35 flares) and higher (red, 51 flares) amplitude rotational modulation. While at low energies the two distributions are nearly similar, from about [erg] the energies of the flares observed after day 700 (Kepler time, plotted in red) are significantly higher, together with the increased overall activity manifested in higher amplitude rotational modulation. At the highest energies the number of flares are small, but it is interesting that the highest energy flare occurred near the end of the lower activity phase of the star.
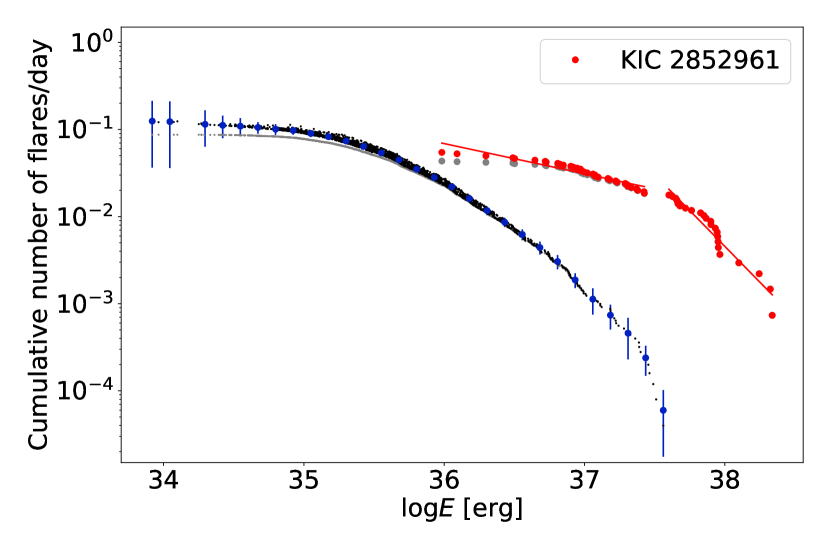
Cumulative FFD for the most flaring 19 stars co-adding 2188 flares is shown in Fig. 17 with grey and black dots for the original and bias corrected values. Red dots and bars show means and errorbars for 30 bins throughout the data. The errorbars were calculated from the Poisson noise in each bin. Towards the low energy parts the individual FFDs bend at different energies, even after the correction for the recovery bias, therefore when summing up all flares a curvature on the overall FFD appears ending around [erg]. Towards higher energies the flare frequency is nearly linearly decreasing in all FFDs, consequently also in the common FFD, except the highest energy part with a few flares only, where the decrease is faster. Note the similarity of Fig. 17 with Yang & Liu (2019, their Fig. 15). The FFD of KIC 2852961 is plotted separately into the cumulative FFD of the 19 giants (grey for the original data, and blue for bias corrected data and the fit). The high energy part of the FFD of KIC 2852961 starts at about the same energy ( [erg]) where the highest energy flare of the 19 giants ( [erg]) appears, meaning that in the high-energy range all flares of KIC 2852961 are more powerful than any flare from the 19 frequently flaring giant stars.
The recent works of Paudel et al. (2018), Shibayama et al. (2013) and the present paper allow an interesting comparison between the FFDs of set of ultracool dwarfs, G dwarfs and flaring giants. The observations of ten ultracool dwarfs with spectral types between M6-L0 were made during the Kepler K2 mission, the flare recovery and the individual FFDs of their targets were calculated and presented in the same way as for the giants in this paper. For comparison see Paudel et al. (2018, their Figs. 3-4) and Fig. 14 and 18 in this paper. The energy ranges of the flares on the ultracool dwarfs are between [erg] whereas the whole energy range of the giants is outside this interval at higher energies, between [erg]. The average power law index of the individual fits to the FFDs of the ten ultracool dwarfs (Paudel et al., 2018) and 20 flaring giants (present paper) is the same: . Between the ultracool dwarfs and flaring giants are the flare energies of the (super)flaring G-dwarf stars with bolometric [erg] energy studied by Shibayama et al. (2013) also from Kepler data, who found power law indices 2.0-2.2 for slowly rotating G stars, and for all G-dwarfs together. The flare energy interval the Kepler passband for the G-dwarfs is about [erg] using the conversion from Osten & Wolk (2015). Yang & Liu (2019) calculated FFDs for different spectral types of flaring stars (their Fig. 3.), gave power law index especially for the giants and as an average for all spectral types except the A-stars.
These results present a consistent view of magnetically active stars with flares from the smallest L0-stars through G- and M-dwarfs to normal giants in a wide range of stellar mass, structure and age. In this pool all stars show flares of magnetic origin with similar shapes but of different timescales spanning a huge energy range between [erg]. The flares were observed with the same instrument (Kepler) and treated with the same or very similar methods. The FFDs of the different groups of stars run in the same way with a common power law index of . The different flare energies from an L0 to a giant star result from only a scaling effect depending on the details of the magnetic field, on the size of the active regions from where the flares originate, and on the local environments like density and gravity. We discussed the details of the scaling effect in Paper I (see Sect. 9.5 in that paper).
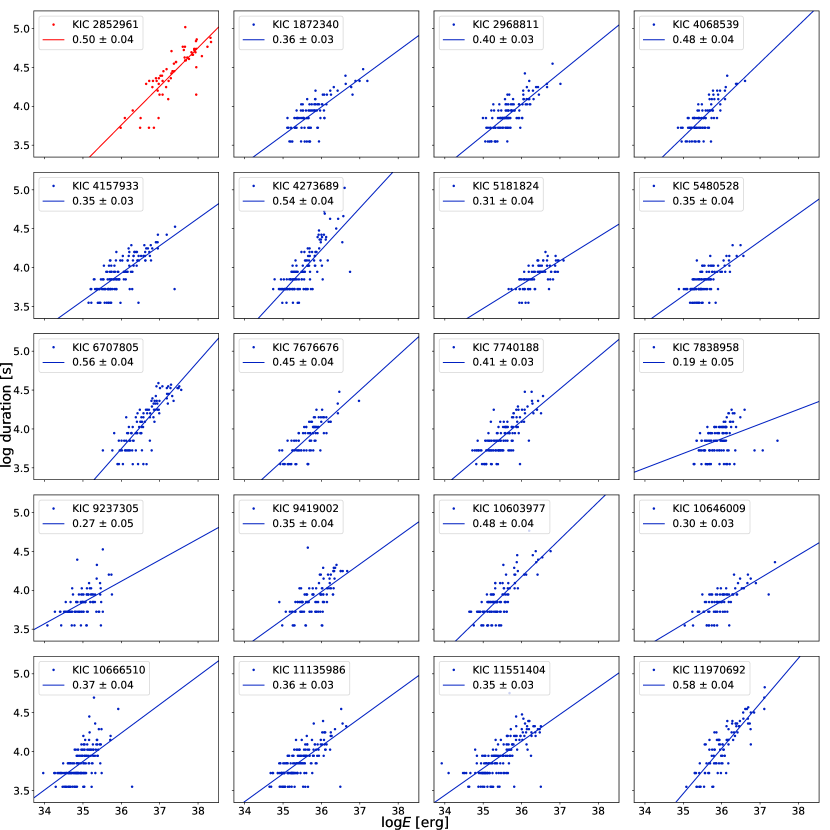
A recent paper of Maehara et al. (2020, their Fig. 14) compares the observed flare durations in the function of flare energies of the Sun, the flaring M-dwarf YZ CMi, G-dwarfs (Shibayama et al., 2013) and KIC 2852961 from Paper I. The slope of the relation is about 1/3 assuming constant magnetic filed strengths, and in this relation KIC 2852961 is on the same line as the Sun with =60 G (Maehara et al., 2020). The selected most flaring 19 stars of the present paper have observed flare durations between about 1-30 hours (59-1766 minutes), and the energies are between [erg] occupying a region in the upper right part of Fig. 14. in Maehara et al. (2020). The slope of the flare energy-duration power-law relation of KIC 2852961 from Paper I is , while that from the present paper is higher, it is as seen from Fig. 24 (upper left corner, red), still, the two results are within 3- from each other. On this basis we may suspect that the slopes of the relations of the other 19 individual stars, plotted in Fig. 24, are probably also higher than real, due to the underestimation of the flare duration mostly for the shorter, lower energy flares, see Section 3 for explanation. Nevertheless, all the slopes reveal positive correlation, they are different, but concerning the errors the difference is not significant.
For the question we ask in the Introduction about the correct definition of the term ”superflare” we cannot give a definite answer. The flare energy ranges of stars embrace 1010 erg from the smallest flare on an ultracool dwarf to the most energetic one on a giant star. A specific, high flare energy limit to reach for being a ”superflare” in the individual stars could be estimated through the maximum available magnetic energies as we did in Paper I (see Sect. 9.4) for KIC 2852961. But this is a complicated task with many uncertainties like the sizes of the active regions (through spot modeling), the magnetic field strengths (from measurements) and flare loop sizes (from models). Perhaps the term ”superflare” would better to reserve only for the Sun where these parameters can directly be measured.
6 Summary and conclusions
We confirmed 61 flaring giant stars in the Kepler field. This number can raise to 69 with those eight stars of unknown evolutionary status (Table LABEL:tab:long), and could further increase by a few giants from the uncertain cases (Table 4) once any of those proves to be the origin of the observed flares.
Throughout this paper we used the recent study of KIC 2852961 (Paper I) for verifying the new methods and results by re-analysing this star using the more automatized approaches introduced in this paper.
We showed that the rotational periods of the flaring giants correlated only weakly with the number of flares, hence with this measure of the activity strength. No correlation was found between and rotational periods, but the index was found to be significantly higher for all stars than for their inactive counterparts (Gaulme et al., 2020). We found only six giants which show both flares and oscillations, and on one pulsating star (a Dor- Sct hybrid) we identified a few significant flares.
Flare energies were calculated and energy distributions in histograms were drawn for all flaring giants and contaminating dwarfs from Table LABEL:tab:long with peak energies at [erg] and [erg], respectively. Most of the histograms have nearly symmetric shapes with longer tails towards higher energies.
We constructed FFDs for a subsample 19 most flaring stars from Table LABEL:tab:long plus a new FFD for KIC 2852961 from Paper I. for comparison purposes. The individual FFDs were fitted first by a single power law. For two stars from this subsample broken power law approaches turned out to be more appropriate. These two stars have flares in the same energy range but the breakpoints of their fits are at different energies suggesting a difference between the local environments from where their flares originate. We also find that even the weakest flare from the high energy part of the KIC 2852961 FFD is stronger than any flare erupted in the subsample of the 19 most flaring stars.
We find that the slopes of fits to the individual FFDs of the 19 most flaring stars are quite similar to each other, the average being , though the difference between the energy ranges of the individual stars is close to two orders, see Fig. 18.
Positive flare energy-duration correlations were found for the subsample of the 19 most flaring giants with slopes somewhat higher than suspected due to the low sampling of the data (30 min cadence), since the observed flare durations were underestimated.
From the results summarized above we conclude that:
-
•
Only about 0.3% of the Kepler giant stars with show flare activity, that is, about 10% of the result in D17, but agreeing well with the result of YL19.
-
•
No strong correlation was found between the stellar properties (rotation period, velocity, binarity) and the flaring characteristics. The wide scale of the flaring specialities points towards the heterogeneity of flaring giants.
-
•
On flaring giant stars, similar to flaring dwarfs, observed flare durations correlate with flare energies, suggesting similar background physics and a scaling effect behind (cf. Paper I).
-
•
The flaring nature of KIC 2852961 with higher energy flares in excess is markedly different from the rest of the studied giants. The reason of the dissimilarity, probably specific of the stellar structure, needs further investigation.
-
•
A large fraction of the flaring red giants are likely to belong to close binary systems, given the levels of photometric variability , the general absence of oscillations, and the fact that 11 out of the 14 giants that have spectroscopic data are binaries.
Acknowledgements.
We thank an anonymous referee for useful comments which helped to express our results more clearly. This work was supported by the Hungarian National Research, Development and Innovation Office grant OTKA K131508 and by the Lendület Program of the Hungarian Academy of Sciences, project No. LP2018-7/2019. Authors from Konkoly Observatory acknowledge the financial support of the Austrian-Hungarian Action Foundation (95 öu3, 98öu5, 101öu13). B.S. was supported by the ÚNKP-19-3 New National Excellence Program of the Ministry for Innovation and Technology. M.N.G. acknowledges support from MIT’s Kavli Institute as a Torres postdoctoral fellow. P. Gaulme acknowledges funding from the German Aerospace Center (Deutsches Zentrum für Luft- und Raumfahrt) under PLATO Data Center grant 50OO1501. This research has made use of the NASA Exoplanet Archive, which is operated by the California Institute of Technology, under contract with the National Aeronautics and Space Administration under the Exoplanet Exploration Program. This work presents results from the European Space Agency (ESA) space mission Gaia. Gaia DR2 data are being processed by the Gaia Data Processing and Analysis Consortium (DPAC). Funding for the DPAC is provided by national institutions, in particular the institutions participating in the Gaia MultiLateral Agreement (MLA). The Gaia mission website is https://www.cosmos.esa.int/gaia. The Gaia archive website is https://archives.esac.esa.int/gaia. Guoshoujing Telescope (the Large Sky Area Multi-Object Fiber Spectroscopic Telescope LAMOST) is a National Major Scientific Project built by the Chinese Academy of Sciences. Funding for the project has been provided by the National Development and Reform Commission. LAMOST is operated and managed by the National Astronomical Observatories, Chinese Academy of Sciences.References
- Aurière et al. (2015) Aurière, M., Konstantinova-Antova, R., Charbonnel, C., et al. 2015, A&A, 574, A90
- Beck et al. (2018) Beck, P. G., Mathis, S., Gallet, F., et al. 2018, MNRAS, 479, L123
- Berger et al. (2018) Berger, T. A., Huber, D., Gaidos, E., & van Saders, J. L. 2018, ApJ, 866, 99
- Brun & Browning (2017) Brun, A. S. & Browning, M. K. 2017, Living Reviews in Solar Physics, 14, 4
- Cantiello et al. (2016) Cantiello, M., Fuller, J., & Bildsten, L. 2016, ApJ, 824, 14
- Catalano & Frasca (1994) Catalano, S. & Frasca, A. 1994, A&A, 287, 575
- Charbonnel et al. (2017) Charbonnel, C., Decressin, T., Lagarde, N., et al. 2017, A&A, 605, A102
- Che et al. (2011) Che, X., Monnier, J. D., Zhao, M., et al. 2011, ApJ, 732, 68
- Cutispoto et al. (1992) Cutispoto, G., Pagano, I., & Rodono, M. 1992, A&A, 263, L3
- Davenport (2016) Davenport, J. R. A. 2016, ApJ, 829, 23
- Davenport et al. (2019) Davenport, J. R. A., Covey, K. R., Clarke, R. W., et al. 2019, ApJ, 871, 241
- Davenport et al. (2014) Davenport, J. R. A., Hawley, S. L., Hebb, L., et al. 2014, ApJ, 797, 122
- Frasca et al. (2016) Frasca, A., Molenda-Żakowicz, J., De Cat, P., et al. 2016, A&A, 594, A39
- Gaulme et al. (2014) Gaulme, P., Jackiewicz, J., Appourchaux, T., & Mosser, B. 2014, ApJ, 785, 5
- Gaulme et al. (2020) Gaulme, P., Jackiewicz, J., Spada, F., et al. 2020, A&A, 639, A63
- Gaulme et al. (2016) Gaulme, P., McKeever, J., Jackiewicz, J., et al. 2016, ApJ, 832, 121
- Günther & Daylan (2019) Günther, M. N. & Daylan, T. 2019, allesfitter: Flexible star and exoplanet inference from photometry and radial velocity
- Günther & Daylan (2020) Günther, M. N. & Daylan, T. 2020, arXiv e-prints, arXiv:2003.14371
- Günther et al. (2020) Günther, M. N., Zhan, Z., Seager, S., et al. 2020, AJ, 159, 60
- Holzwarth & Schüssler (2001) Holzwarth, V. & Schüssler, M. 2001, A&A, 377, 251
- Hon et al. (2019) Hon, M., Stello, D., García, R. A., et al. 2019, MNRAS, 485, 5616
- Kallinger et al. (2014) Kallinger, T., De Ridder, J., Hekker, S., et al. 2014, A&A, 570, A41
- Kővári & Oláh (2014) Kővári, Z. & Oláh, K. 2014, Space Sci. Rev., 186, 457
- Kővári et al. (2017) Kővári, Z., Oláh, K., Kriskovics, L., et al. 2017, Astronomische Nachrichten, 338, 903
- Kővári et al. (2020) Kővári, Zs., Oláh, K., Günther, M. N., et al. 2020, A&A, 641, A83
- Maehara et al. (2020) Maehara, H., Notsu, Y., Namekata, K., et al. 2020, arXiv e-prints, arXiv:2009.14412
- Mathur et al. (2017) Mathur, S., Huber, D., Batalha, N. M., et al. 2017, ApJS, 229, 30
- Mathur et al. (2014) Mathur, S., Salabert, D., García, R. A., & Ceillier, T. 2014, Journal of Space Weather and Space Climate, 4, A15
- McQuillan et al. (2014) McQuillan, A., Mazeh, T., & Aigrain, S. 2014, ApJS, 211, 24
- Mosser et al. (2014) Mosser, B., Benomar, O., Belkacem, K., et al. 2014, A&A, 572, L5
- Mullan & Paudel (2018) Mullan, D. J. & Paudel, R. R. 2018, ApJ, 854, 14
- Oláh et al. (1991) Oláh, K., Hall, D. S., & Henry, G. W. 1991, A&A, 251, 531
- Oláh et al. (2009) Oláh, K., Kolláth, Z., Granzer, T., et al. 2009, A&A, 501, 703
- Osten & Wolk (2015) Osten, R. A. & Wolk, S. J. 2015, ApJ, 809, 79
- Paudel et al. (2018) Paudel, R. R., Gizis, J. E., Mullan, D. J., et al. 2018, ApJ, 858, 55
- Reiners (2012) Reiners, A. 2012, Living Reviews in Solar Physics, 9, 1
- Roettenbacher et al. (2016) Roettenbacher, R. M., Monnier, J. D., Korhonen, H., et al. 2016, Nature, 533, 217
- Shibata & Magara (2011) Shibata, K. & Magara, T. 2011, Living Reviews in Solar Physics, 8, 6
- Shibayama et al. (2013) Shibayama, T., Maehara, H., Notsu, S., et al. 2013, ApJS, 209, 5
- Stassun et al. (2019) Stassun, K. G., Oelkers, R. J., Paegert, M., et al. 2019, AJ, 158, 138
- Strassmeier et al. (2008) Strassmeier, K. G., Briguglio, R., Granzer, T., et al. 2008, A&A, 490, 287
- Strassmeier et al. (1990) Strassmeier, K. G., Fekel, F. C., Bopp, B. W., Dempsey, R. C., & Henry, G. W. 1990, ApJS, 72, 191
- Strassmeier et al. (1994) Strassmeier, K. G., Handler, G., Paunzen, E., & Rauth, M. 1994, A&A, 281, 855
- Uytterhoeven et al. (2011) Uytterhoeven, K., Moya, A., Grigahcène, A., et al. 2011, A&A, 534, A125
- Van Doorsselaere et al. (2017) Van Doorsselaere, T., Shariati, H., & Debosscher, J. 2017, ApJS, 232, 26
- Verbunt & Phinney (1995) Verbunt, F. & Phinney, E. S. 1995, A&A, 296, 709
- Vida & Roettenbacher (2018) Vida, K. & Roettenbacher, R. M. 2018, A&A, 616, A163
- Vrard et al. (2018) Vrard, M., Kallinger, T., Mosser, B., et al. 2018, A&A, 616, A94
- Yang & Liu (2019) Yang, H. & Liu, J. 2019, ApJS, 241, 29
- Zwintz et al. (2020) Zwintz, K., Neiner, C., Kochukhov, O., et al. 2020, arXiv e-prints, arXiv:2009.04784
Appendix A Comparison of temperature, radius and distance values from different data sources
Figures 19–21 compare the temperature and radius values, and the distances of all Kepler stars used throughout this paper originating from D17, YL19 and Hon et al. (2019) using temperature, radii and distances from KIC DR25 and TIC catalogs, and from Berger et al. (2018).
Appendix B Flaring giants and contaminating dwarfs in the Kepler field
| KIC No. | Kpmag | [K] | lum. class | [d] | no. of flares | binarity | |
|---|---|---|---|---|---|---|---|
| 1573138 | 12.341 | 4838 Kp | 2.871 Kp | 4.687 | 113 | ||
| 1872340 | 12.770 | 5454 | 3.674 | GIANTa𝑎aa𝑎aBeside the GIANT evolutionary status mark the 19 most flaring giant stars with constructed FFDs. | 10.884 | 90 | |
| 2142183 | 13.642 | 4738 G | 1.206 G | 3.637 | 113 | ||
| 2441154 | 10.326 | 4480 | 8.669 | GIANT | 32.653 | 16 | SB |
| 2585397 | 10.974 | 4975 Kp | 8.554 Kp | 49.048 | 14 | ||
| 2852961 | 10.146 | 4797 | 10.836 | GIANT | 35.715 | 59 | SB1 |
| 2968811 | 13.469 | 4220 | 3.504 | GIANTa𝑎aa𝑎aBeside the GIANT evolutionary status mark the 19 most flaring giant stars with constructed FFDs. | 14.814 | 118 | |
| 3122450 | 13.891 | 4945 | 12.288 | GIANT | 44.901 | 23 | |
| 3324644 | 12.812 | 4451 | 3.897 | GIANT | 2.875 | 42 | |
| 3560427 | 13.775 | 4544 | 6.433 | GIANT | 32.054 | 14 | |
| 3561372 | 13.191 | 4414 | 5.671 | GIANT | 15.115 | 33 | |
| 4068539 | 13.569 | 4862 | 2.818 | GIANTa𝑎aa𝑎aBeside the GIANT evolutionary status mark the 19 most flaring giant stars with constructed FFDs. | 13.226 | 92 | |
| 4157933 | 12.362 | 5567 | 3.547 | GIANTa𝑎aa𝑎aBeside the GIANT evolutionary status mark the 19 most flaring giant stars with constructed FFDs. | 6.914 | 139 | |
| 4180534 | 13.018 | 4496 | 0.999 | DWARF | 3.944 | 154 | |
| 4263801 | 13.795 | 5206 | 1.883 | DWARF | 4.304, 4.187 | 169 | |
| 4273689 | 11.266 | 5159 | 3.309 | GIANTa𝑎aa𝑎aBeside the GIANT evolutionary status mark the 19 most flaring giant stars with constructed FFDs. | 29.301 | 134 | |
| 4562996 | 13.013 | 5739 | 1.761 | DWARF | 15.474 | 29 | |
| 4680688 | 13.476 | 4846 | 8.037 | GIANT | 9.190 | 19 | |
| 4750889 | 13.448 | 5092 | 5.148 | GIANT | 17.567 | 27 | |
| 4920178 | 13.860 | 4452 | 5.922 | GIANT | 55.359 | 18 | |
| 4937206 | 16.710 | 4605 | 0.851 | DWARF | 4.030 | 26 | |
| 5080290 | 9.507 | 5091 | 9.439 | GIANT | 6 | ||
| 5181824 | 13.345 | 4732 | 9.231 | GIANTa𝑎aa𝑎aBeside the GIANT evolutionary status mark the 19 most flaring giant stars with constructed FFDs. | 6.861 | 79 | |
| 5281818 | 12.309 | 5900 | 4.922 | GIANT | 4.287 | 41 | |
| 5286780 | 13.963 | 4919 G | 0.687 G | 8.625 | 12 | ||
| 5296446 | 12.631 | 5611 | 4.574 | GIANT | 14.288 | 3 | |
| 5428626 | 13.980 | 4664 G | 0.880 G | 2.607 | 128 | ||
| 5480528 | 13.061 | 4882 | 3.603 | GIANTa𝑎aa𝑎aBeside the GIANT evolutionary status mark the 19 most flaring giant stars with constructed FFDs. | 5.506 | 116 | |
| 5482181 | 14.047 | 4889 | 3.779 | GIANT | 8.799 | 15 | |
| 5808398 | 11.455 | 4710 | 6.484 | GIANT | 145.81 | 3 | |
| 5821762 | 12.298 | 5205 | 13.125 | GIANT | 9.252 | 11 | unclear |
| 6192231 | 12.796 | 4777 Kp | 2.716 Kp | 33.296 | 76 | ||
| 6206885 | 13.875 | 4644 | 4.133 | GIANT | 15.925 | 40 | |
| 6219880 | 13.060 | 5965 | 1.246 | DWARF | 15.692 | 22 | |
| 6233558 | 12.596 | 4617 | 6.854 | GIANT | 29.247 | 39 | |
| 6445442 | 13.194 | 4785 | 13.458 | GIANT | 45.032 | 1 | |
| 6619942 | 10.859 | 4598 | 18.979 | GIANT | 10.627 | 3 | |
| 6707805 | 12.447 | 5613 | 5.261 | GIANTa𝑎aa𝑎aBeside the GIANT evolutionary status mark the 19 most flaring giant stars with constructed FFDs. | 22.216 | 103 | SB2 |
| 6861498 | 13.419 | 4670 | 5.498 | GIANT | 89.276 | 16 | |
| 7363468 | 12.386 | 5230 | 6.836 | GIANT | 61.445 | 35 | |
| 7433177 | 12.993 | 4442 | 6.550 | GIANT | 5.935 | 25 | |
| 7676676 | 13.853 | 4774 | 2.539 | GIANTa𝑎aa𝑎aBeside the GIANT evolutionary status mark the 19 most flaring giant stars with constructed FFDs. | 15.979 | 86 | |
| 7696356 | 13.472 | 5044 | 5.396 | GIANT | 40.657 | 64 | |
| 7740188 | 12.581 | 4419 | 3.028 | GIANTa𝑎aa𝑎aBeside the GIANT evolutionary status mark the 19 most flaring giant stars with constructed FFDs. | 9.094 | 130 | |
| 7838958 | 12.560 | 5360 | 5.727 | GIANTa𝑎aa𝑎aBeside the GIANT evolutionary status mark the 19 most flaring giant stars with constructed FFDs. | 27.369 | 119 | |
| 7848068 | 13.501 | 5072 | 2.509 | GIANT | 41.152 | 49 | |
| 7869590 | 10.876 | 4370 | 7.337 | GIANT | 40.568 | 47 | SB1 |
| 7969754 | 12.269 | 4554 | 6.696 | GIANT | 69.106 | 17 | SB |
| 8022670 | 12.471 | 4573 | 3.290 | GIANT | 4.126 | 55 | |
| 8231401 | 13.824 | 4833 | 5.073 | GIANT | 46.540 | 11 | |
| 8259835 | 13.112 | 4651 | 0.915 | DWARF | 4.427 | 124 | |
| 8515227 | 11.176 | 4778 | 11.653 | GIANT | 28.157 | 23 | SB3 |
| 8517303 | 11.430 | 4547 | 8.679 | GIANT | 53.385 | 9 | SB1 |
| 8713822 | 14.258 | 5095 | 1.702 | DWARF | 3.223 | 41 | |
| 8749284 | 12.190 | 5089 | 4.628 | GIANT | 3.192 | 88 | unclear |
| 8774912 | 12.995 | 4585 | 0.792 | DWARF | 3.796 | 105 | |
| 8776850 | 12.691 | 5172 | 1.027 | DWARF | 5.080 | 174 | |
| 8780458 | 13.589 | 4430 | 1.060 | DWARF | 2.086 | 93 | |
| 8894773 | 13.833 | 4845 | 0.910 | DWARF | 1.892 | 106 | |
| 8915957 | 10.918 | 4910 | 12.811 | GIANT | 47.004 | 11 | |
| 8951096 | 13.336 | 4879 | 6.628 | GIANT | 9.074 | 9 | |
| 9093349 | 13.642 | 5130 Kp | 4.000 Kp | 5.480 | 251 | ||
| 9116222 | 13.390 | 5526 | 2.715 | DWARFb𝑏bb𝑏bBeside the DWARF evolutionary status these stars are probably subgiants, see Section 5.2, Fig. 9 | 7.443 | 260 | |
| 9237305 | 12.644 | 5107 | 2.074 | GIANTa𝑎aa𝑎aBeside the GIANT evolutionary status mark the 19 most flaring giant stars with constructed FFDs. | 23.458, 29.136 | 95 | |
| 9419002 | 12.411 | 5322 | 4.857 | GIANTa𝑎aa𝑎aBeside the GIANT evolutionary status mark the 19 most flaring giant stars with constructed FFDs. | 25.640 | 104 | |
| 9474208 | 15.941 | 3603 | 0.688 | DWARF | 7.739 | 64 | |
| 9716554 | 12.655 | 5120 | 5.779 | GIANT | 68.318 | 1 | |
| 9752982 | 12.224 | 4923 G | 0.888 G | 13.270 | 12 | ||
| 9770992 | 10.531 | 4784 | 13.892 | GIANT | 17.817 | 25 | SB2 |
| 9992402 | 15.208 | 4715 | 0.916 | DWARF | 3.573 | 17 | |
| 10603977 | 13.651 | 4933 | 2.728 | GIANTa𝑎aa𝑎aBeside the GIANT evolutionary status mark the 19 most flaring giant stars with constructed FFDs. | 17.962 | 112 | |
| 10646009 | 12.697 | 4493 | 4.634 | GIANTa𝑎aa𝑎aBeside the GIANT evolutionary status mark the 19 most flaring giant stars with constructed FFDs. | 5.412 | 80 | |
| 10666510 | 10.258 | 4790 | 2.074 | GIANTa𝑎aa𝑎aBeside the GIANT evolutionary status mark the 19 most flaring giant stars with constructed FFDs. | 20.845 | 165 | |
| 10875937 | 14.092 | 4546 | 3.407 | GIANT | 6.251 | 53 | |
| 11087027 | 10.881 | 4854 | 11.157 | GIANT | 30.427 | 10 | RV-stable |
| 11135986 | 13.944 | 4830 | 2.899 | GIANTa𝑎aa𝑎aBeside the GIANT evolutionary status mark the 19 most flaring giant stars with constructed FFDs. | 8.692 | 173 | |
| 11146520 | 12.422 | 4608 | 8.618 | GIANT | 34.217 | 2 | SB1 |
| 11407895 | 11.870 | 5732 | 6.231 | GIANT | 9.206 | 5 | |
| 11515713 | 12.889 | 5589 | 2.847 | DWARFb𝑏bb𝑏bBeside the DWARF evolutionary status these stars are probably subgiants, see Section 5.2, Fig. 9 | 19.849, 23.210 | 186 | |
| 11551404 | 11.105 | 4703 | 2.944 | GIANTa𝑎aa𝑎aBeside the GIANT evolutionary status mark the 19 most flaring giant stars with constructed FFDs. | 11.120 | 155 | SB2 |
| 11554998 | 11.779 | 4301 | 9.231 | GIANT | 30.335 | 20 | SB1 |
| 11568624 | 13.754 | 4407 | 0.983 | DWARF | 1.646 | 49 | |
| 11668891 | 13.722 | 4576 | 7.883 | GIANT | 19.097 | 8 | |
| 11753121 | 13.814 | 5335 | 0.802 | DWARF | 22.410 | 11 | |
| 11962994 | 13.984 | 4604 | 6.943 | GIANT | 12.872 | 4 | |
| 11970692 | 13.516 | 4705 | 3.944 | GIANTa𝑎aa𝑎aBeside the GIANT evolutionary status mark the 19 most flaring giant stars with constructed FFDs. | 28.116 | 98 |
| KIC No. | Kpmag | [K] | lum. class. | [d] | no. of flares | remarks | |
|---|---|---|---|---|---|---|---|
| 2019477 | 13.330 | 5647 | 2.733 | DWARF | — | 2 | = KOI-6083 with two planets (1) |
| 3245458 | 13.795 | 5980 | 1.085 | DWARF | 12-16 | 9 | blend (2) |
| 3659584 | 13.045 | 4595 | 7.346 | GIANT | 68.41 | 1 | large ampl. rot. mod. (3) |
| 4752302 | 12.687 | 4811 | 3.615 | GIANT | — | 1 | oscillations (?) Hon et al. (2019) |
| 5093168 | 13.421 | GIANT | 2.799 | 21 | two stars (4) | ||
| 5961988 | 14.139 | 5837 | 1.115 | DWARF | — | 12 | blend (5) |
| 6190679 | 9.030 | 4570 | 15.147 | GIANT | 76.9 | 1 | oscillations (?) Hon et al. (2019) |
| 6364525 | 10.993 | 5040 | 2.659 | GIANT | — | 5 | (6) |
| 6863731 | 11.611 | 5104 | 4.029 | GIANT | 17 | 2 | very small ampl., oscill. (?) Hon et al. (2019) |
| 6869726 | 13.763 | 4855 | 1.074 | DWARF | 0.722 | 4 | too short period (7) |
| 7272363 | 13.128 | 5058 | 3.833 | GIANT | — | 2 | oscillations (?) Hon et al. (2019) |
| 7292720 | 13.773 | 4822 | 4.539 | GIANT | — | 1 | oscillations (?) Hon et al. (2019) |
| 8106192 | 13.373 | 4763 | 6.366 | GIANT | — | 1 | oscillations (?) Hon et al. (2019) |
| 8112102 | 13.852 | 5150 | 7.691 | GIANT | 9.45 | 5 | blend? (8) |
| 9592627 | 16.955 | 5150 | 0.911 | DWARF | 3.598 | 1 | small amplitude regular variability (9) |
| 9835672 | 8.694 | 4197 | 33.135 | GIANT | — | 1 | oscillations (?) Hon et al. (2019) |
| 10421610 | 12.990 | 5826 | 1.001 | DWARF | 13.5 | 134 | looks as a single object, many flares (10) |
| KIC No. | [K] | [K] | [Fe/H] | remarka𝑎aa𝑎aABS=absorption, EM=emission, V=variable, H=huge, S=strong, W=weak; | KIC No. | [K] | [K] | [Fe/H] | remarka𝑎aa𝑎aABS=absorption, EM=emission, V=variable, H=huge, S=strong, W=weak; | ||
|---|---|---|---|---|---|---|---|---|---|---|---|
| TICv8 | LAMOST | TICv8 | LAMOST | ||||||||
| 1573138 | 4838 | 5182 | 3.93 | 0.07 | V? EM | 8776850 | 5172 | 5140 | 4.53 | 0.12 | ABS |
| 1872340 | 5454 | 5454 | 3.80 | 0.34 | ABS | 5185 | 4.55 | 0.11 | ABS | ||
| 2585397 | 4975 | 5218 | 2.98 | 0.18 | ABS | 5179 | 4.58 | 0.09 | ABS | ||
| 2852961 | 4797 | 4747 | 2.22 | 0.31 | ABS | 8780458 | 4430 | 4427 | 4.47 | 0.13 | W ABS |
| 4157933 | 5567 | – | – | – | ABS | 8894773 | 4845 | 4845 | 4.37 | 0.23 | filled in |
| 4180534 | 4496 | 4496 | 4.32 | 0.20 | filled in | 8915957b𝑏bb𝑏bThis should be an identification problem because the LAMOST spectra indicate a main-sequence F-star. | 4910 | 7001 | 4.25 | 0.39 | H ABS |
| 4263801 | 5206 | 5211 | 3.80 | 0.12 | ABS | 6972 | 4.28 | 0.42 | H ABS | ||
| 4750889 | 5092 | – | – | – | ABS | 8951096 | 4879 | 4827 | 2.71 | 0.54 | ABS |
| 5281818 | 5900 | 5900 | 3.57 | 0.10 | S ABS | 9093349 | 5130 | 4971 | 3.87 | 0.17 | filled in |
| 5296446 | 5611 | 5616 | 3.50 | 0.10 | ABS | 9116222 | 5526 | 5526 | 3.69 | 0.20 | ABS |
| 5808398 | 4710 | 4536 | 3.00 | 0.20 | ABS | 9237305 | 5107 | 5220 | 3.94 | 0.33 | ABS |
| 6192231 | 4777 | 5398 | 4.07 | 0.32 | ABS | 9419002 | 5322 | 5388 | 3.45 | 0.04 | S ABS |
| 6219880 | 5965 | 5972 | 4.42 | 0.12 | ABS | 9716554 | 5120 | 5257 | 3.35 | 0.36 | S ABS |
| 7363468 | 5230 | 5237 | 3.09 | 0.05 | ABS | 9752982 | 4923 | 5191 | 4.73 | 0.09 | ABS |
| 5225 | 3.09 | 0.07 | ABS | 10603977 | 4933 | 4933 | 3.80 | 0.09 | filled in | ||
| 7433177 | 4442 | 5031 | 3.37 | 0.09 | W ABS | 10646009 | 4493 | 4505 | 3.10 | 0.12 | EM |
| 7676676 | 4774 | 4774 | 3.72 | 0.24 | EM | 10666510 | 4790 | 4784 | 3.68 | 0.35 | W ABS |
| 4920 | 3.82 | 0.35 | ABS | 4797 | 3.75 | 0.33 | filled in | ||||
| 7740188 | 4419 | 4741 | 3.57 | 0.24 | filled in | 11135986 | 4830 | – | – | – | EM |
| 4812 | 3.61 | 0.21 | W ABS | 11407895 | 5732 | 5796 | 3.43 | 0.01 | S ABS | ||
| 7848068 | 5072 | 5072 | 3.80 | 0.20 | ABS | 11515713 | 5589 | 5589 | 3.88 | 0.18 | ABS |
| 7869590 | 4370 | 4420 | 2.57 | 0.09 | filled in? | 11551404 | 4703 | 5046 | 3.77 | 0.08 | W ABS |
| 4392 | 2.58 | 0.19 | ABS | 5181 | 3.95 | 0.01 | filled in | ||||
| 8022670 | 4573 | 4623 | 3.13 | 0.27 | S EM | 11554998 | 4301 | 4386 | 2.42 | 0.25 | W ABS |
| 4525 | 3.04 | 0.35 | S EM | 4431 | 2.46 | 0.22 | W ABS | ||||
| 4366 | 2.96 | 0.41 | S EM | 4422 | 2.51 | 0.25 | W ABS | ||||
| 8231401 | 4833 | – | – | – | ABS | 11753121 | 5335 | 5335 | 4.65 | 0.16 | ABS |
| 8517303 | 4547 | – | – | – | ABS | 5437 | 4.66 | 0.17 | ABS | ||
| 8749284 | 5089 | 5089 | 3.25 | 0.18 | H EM? | 11962994 | 4604 | 4604 | 2.69 | 0.01 | ABS |
| 8774912 | 4585 | – | – | – | EM | ||||||
Appendix C Flare energy distributions and flare energyobserved flare duration correlations of the 19 most flaring stars and that of KIC 2852961.