Modeling Microglia Activation and Inflammation-Based Neuroprotectant Strategies During Ischemic Stroke
Abstract
Neural inflammation immediately follows the onset of ischemic stroke. During this process, microglial cells can be activated into two different phenotypes: the M1 phenotype, which can worsen brain injury by producing pro-inflammatory cytokines; or the M2 phenotype, which can aid in long term recovery by producing anti-inflammatory cytokines. In this study, we formulate a nonlinear system of differential equations to model the activation of microglia post-ischemic stroke, which includes bidirectional switching between the microglia phenotypes, as well as the interactions between these cells and the cytokines that they produce. Further, we explore neuroprotectant-based modeling strategies to suppress the activation of the detrimental M1 phenotype, while promoting activation of the beneficial M2 phenotype. Through use of global sensitivity techniques, we analyze the effects of the model parameters on the ratio of M1 to M2 microglia and the total number of activated microglial cells in the system over time. Results demonstrate the significance of bidirectional microglia phenotype switching on the ratio of M1 to M2 microglia, in both the absence and presence of neuroprotectant terms. Simulations further suggest that early inhibition of M1 activation and support of M2 activation leads to a decreased minimum ratio of M1 to M2 microglia and allows for a larger number of M2 than M1 cells for a longer time period.
Keywords: neuroinflammation, ischemic stroke, microglia activation, phenotype switching, neuroprotectants, parameter sensitivity.
Department of Mathematical Sciences, Worcester Polytechnic Institute, Worcester, MA, USA
* corresponding author: anarnold@wpi.edu
1 Introduction
Stroke is the second leading cause of death worldwide and the fifth leading cause of death in the United States, as well as a leading cause of disability [1, 2, 3, 4]. Ischemic strokes account for of all strokes and are caused by a blockage in a blood vessel due to thrombosis or embolism, resulting in oxygen deprivation of the brain [3]. During an ischemic stroke, cell death and damage occur in the affected brain area called the infarcted core [5, 6, 7]. Immediately following the onset of ischemia, the body naturally responds with inflammation, which can both worsen brain injury and help in long term recovery.
The goal of this study is to develop a mathematical model of the neuroinflammatory process during ischemic stroke to analyze both the beneficial and detrimental effects of inflammation. In particular, we introduce a new coupled system of nonlinear differential equations to model the dynamic interactions between microglia and cytokines, two of the main components involved in neuroinflammation following stroke onset. Neuroinflammation begins with the activation of microglia, a type of neuroglia residing in the central nervous system [8, 9, 10, 11, 6, 7]. This activation peaks around two to three days after stroke and persists for several weeks [12, 13]. Microglia maintain homeostasis of the brain by continuously monitoring their surrounding environment and responding to pathological signals released by neighboring brain cells [14, 7, 15]. Based on their type, activated microglia produce either anti-inflammatory cytokines or pro-inflammatory cytokines, thereby causing both beneficial and detrimental effects on the brain post-ischemia.
Microglia activation is characterized by two phenotypes: M1 and M2. The M1 phenotype (classical activation) is characterized by the secretion of pro-inflammatory cytokines, which can exacerbate the inflammatory response and lead to further brain damage. Pro-inflammatory cytokines include tumor necrosis factor alpha (TNF-), interleukin 1 beta (IL-), nitric oxide, interleukin 6 (IL-), and interleukin 12 (IL-) [6, 10, 16, 17, 18, 19, 20, 21]. Microglia can also be activated into the M2 phenotype (alternative activiation) and perform crucial roles in limiting inflammation by releasing anti-inflammatory cytokines, including interleukin 4 (IL-), interleukin 10 (IL-), and transforming growth factor beta (TGF-) [6, 10, 17, 18, 19, 22, 23, 16, 21].
M2 microglia have been shown to dominate at the early stages of inflammation, whereas M1 microglia activate more slowly and then become the dominant phenotype for the remainder of the neuroinflammatory process [9, 17]. Classical and alternative microglia activation is positively influenced by the presence of pro-inflammatory cytokines and anti-inflammatory cytokines, respectively [10, 21, 19, 24, 23]. Experimental studies have shown that anti-inflammatory cytokines inhibit microglia activation to the M1 phenotype and, on the other hand, pro-inflammatory cytokines inhibit microglia activation to the M2 phenotype [21, 10, 16, 6, 17]. Further, experimental studies have also shown that microglia may switch phenotypes from M1 to M2 and vice versa [25, 16, 26, 10, 27, 19, 13]. The switching from the M2 to M1 phenotype has been cited as an area in need of further research [15]. Mathematical models for applications other than ischemic stroke have considered interactions between microglia phenotypes but have not included the possibility of switching from the M2 to the M1 phenotype [18, 28, 24].
In this study, we develop a four-compartment model of microglia and cytokine interaction, which includes both the M1 and M2 phenotypes, pro-inflammatory and anti-inflammatory cytokines, and bidirectional phenotype switching between M1 and M2 microglia. Previous mathematical models studying intracellular processes of ischemic stroke inflammation have included terms representing general microglia activation, leukocytes, astrocytes, and neurons [11, 29, 30, 5, 31, 32]. However, these models do not consider the two microglia phenotypes or phenotype switching, which we include in this work to analyze both the beneficial and deleterious effects of microglia activation post ischemic stroke. We also study specifically the effects of M2 to M1 phenotype switching, which may lead to increased cell damage by bolstered production of pro-inflammatory substances in the brain.
Mathematical models of neuroinflammation have included the two microglia phenotypes for applications other than stroke, including traumatic brain injury (TBI), amyotrophic lateral sclerosis (ALS), hemorrhagic shock, and Alzheimer’s disease [24, 21, 18]. The models for TBI in [24] and for Alzheimer’s disease in [18] include switching from M1 to M2 but do not include switching from the M2 to the M1 phenotype. The model for ALS presented in [21] includes bidirectional switching between microglia phenotypes; however, to the authors’ knowledge, there are no current models of neuroinflammation during ischemic stroke which include bidirectional microglia phenotype switching. Further studies have explored the interactions between cytokines in general neural inflammation [8, 33] but have not included the interactions of microglia producing these substances. Multiple studies have also explored inflammation with macrophages, which behave in a similar manner to microglia, in applications such as myocardial infarction [34, 28].
Despite the widespread impact of ischemic stroke, there are currently only two clinical treatment strategies for clot removal. Tissue plasminogen activator (tPA)-induced thrombolysis is the only FDA-approved medication to restore blood flow in the brain following ischemia. During this treatment, tPA is intravenously administered to break up the clot within the blood vessel that is causing the ischemic stroke. This strategy is limited to a small subset of stroke patients due to its short treatment window [13, 35, 36, 37, 38]. An alternative to thrombolysis drug treatment is thrombectomy, a surgical procedure during which a clot retrieval device is used to mechanically remove the blood clot causing the ischemic stroke. Mathematical models for both thrombolysis drug treatment and thrombectomy have been developed, including: compartment models to evaluate the effects of tPA dose on the effectiveness of treatment [36, 37]; predictive models to identify subsets of patients who would be eligible for thrombolysis [35]; and a model of clot removal for mechanical thrombectomy [39]. Both of these treatment strategies increase the risk for hemorrhage post ischemic stroke [40, 41, 42].
A potential new therapeutic strategy may be to target the distinct microglia phenotypes and promote M2 activation while simultaneously suppressing M1 activation [12, 13, 43, 25, 7]. Recent experimental studies have explored the use of neuroprotective substances such as BHDPC, curcumin, miR-124, salidroside (SLDS), glycine, and celastrol to achieve this aim. An in vitro study showed that BHDPC, a novel neuroprotectant, was able to promote M2 phenotype polarization [44]. In a follow-up study, BHDPC was shown to reduce the amount of M1 microglial cells and enhance the amount of M2 microglia in middle cerebral artery occlusion-induced ischemic brain in mice after treatment with the drug [45]. Curcumin was shown to promote M2 microglia activation and inhibit pro-inflammatory responses both in vitro and in vivo in mice [46]. Injection with the microRNA miR-124 was shown to decrease of ratio of M1 to M2 microglia in a mouse model [47]. Intravenous SLDS injection decreased M1 microglial cells and increased M2 microglial cells post ischemic stroke in a mouse model [48]. The amino acid glycine was shown to promote M2 microglial cells in vitro and in vivo in Sprague-Dawley rats [49]. Celastrol was shown to decrease pro-inflammatory cytokines in several studies using rodent models [50, 51].
Inspired by neuroprotectant strategies, we further modify the model proposed in this work to include time-varying terms aiding in the activation of M2 microglia and inhibiting the activation of M1 microglia. We analyze the effects of these neuroprotectant-based terms on the total number of activated microglia in the system, with specific interest in the ratio of M1 to M2 microglia, for different simulated treatment onset times. Further, by employing global sensitivity techniques, we analyze the effects of the model parameters on the ratio of M1 to M2 cells and the total activated microglia in both the absence and presence of the neuroprotectant terms. Results emphasize the significance of the microglia phenotype switching rates with respect to model sensitivity when considering the ratio of M1 to M2 microglia, while the number of resting microglia and the microglia activation and mortality rates are more significant when considering the total activated microglia.
The paper is organized as follows. Section 2 describes the coupled system of nonlinear differential equations derived to model the interactions between the two microglia phenotypes and the pro- and anti-inflammatory cytokines. Section 3 reviews two global sensitivity analysis techniques, Morris elementary effects and the Sobol method, and provides numerical results when these techniques are applied to the model derived in Section 2. Section 4 details the neuroprotectant-based terms added to the model to suppress M1 microglia production and bolster M2 microglia production. This section also provides computational simulations of the modified model when the neuroprotectant onset times are varied and sensitivity analysis of the modified model. Section 5 features a discussion of the results and future work, and Section 6 gives a summary and conclusions of this work.
2 Model Description
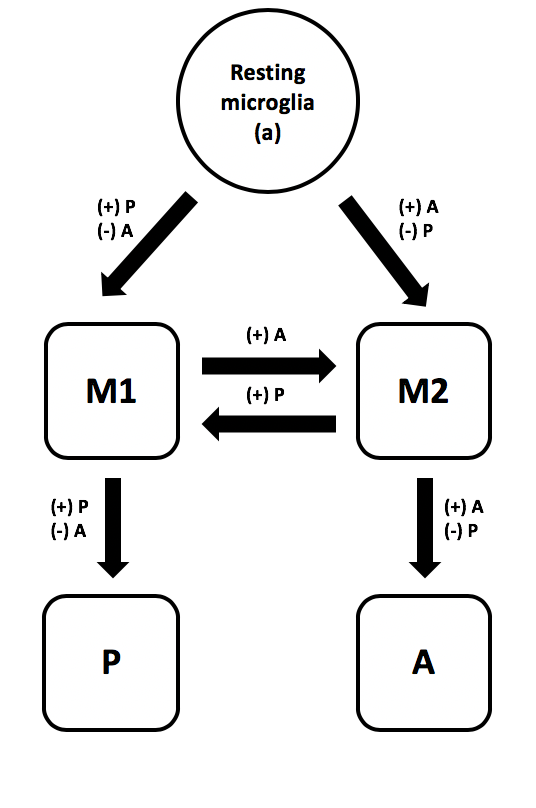
In this section we derive a simplified model of neural inflammation post-ischemic stroke, focusing on the interaction between the M1 and M2 microglia phenotypes and pro- and anti-inflammatory cytokines. We assume a constant source of resting microglia, which activates into the M1 or M2 phenotypes immediately following the onset of ischemic stroke. This activation is assumed to occur at a constant rate, influenced by the cytokine concentrations. Bidirectional switching can occur between the M1 and M2 microglia phenotypes. Pro-inflammatory () and anti-inflammatory () cytokines are produced by the M1 and M2 microglia, respectively, further influenced by the current concentrations of cytokines. Figure 1 gives a schematic representation of the model.
2.1 Microglia
The equations describing the change in M1 and M2 microglial cells are as follows:
| (1) |
| (2) |
where is the number of resting microglia, and are constant parameters for microglia phenotype switching, and , , , and are constant parameters for the activation and natural mortality of the microglial cells, respectively. The Hill functions and of the cytokines are of the form
| (3) |
and
| (4) |
where is taken to be either or (representing the pro-inflammatory or anti-inflammatory cytokines, respectively), and are constant exponents which control the steepness of the curves, and is the half maximal concentration of the respective cytokine. Note that has the form of an increasing sigmoidal curve, whereas is a decreasing sigmoidal curve. Similar Hill functions have been used in previous modeling of cytokines and cells [8, 24, 28, 18, 21, 34]. The following subsections detail the model terms for microglia activation and phenotype switching. Table 1 lists the descriptions, units, and nominal values of the corresponding model parameters.
Microglia activation
Following the onset of ischemic stroke, resting microglia can become polarized to the M1 and M2 phenotypes [10, 6, 17, 19, 21]. We assume that the resting microglia become activated to each phenotype at a rate that is influenced by the presence of cytokines. Activation of the microglia to the M1 phenotype is positively influenced by the concentration of pro-inflammatory cytokines [10, 21, 19, 24, 28] and negatively influenced by the concentration of anti-inflammatory cytokines [24, 19]. We use the Hill function to represent the saturating promotion of M1 microglia by the pro-inflammatory cytokines [14, 52]. Likewise, we use the Hill function to represent the saturating inhibition of M1 microglia by the anti-inflammatory cytokines. Similar terms are used to represent the saturating promotion of M2 microglia by anti-inflammatory cytokines [10, 24, 21, 19, 23] and the saturating inhibition of M2 microglia by the pro-inflammatory cytokines [17].
Microglia phenotype switching
There is evidence that microglia may switch phenotypes once activated; however, the switching from the M2 to M1 phenotype has been cited as an area for further research [15]. The proposed model includes bidirectional switching, so that we may analyze the effects of all possible interactions. To this end, we assume that once activated, microglia may switch from the M1 phenotype to the M2 phenotype [16, 21, 26, 24, 19, 20, 15, 13, 27, 10, 25] and from the M2 phenotype to the M1 phenotype [10, 16, 26, 19, 13, 27, 25]. Since switching from M1 to M2 is positivity influenced by the anti-inflammatory cytokines [16, 21], we multiply this term by the Hill function . Likewise, since switching from M2 to M1 is positively influenced by the pro-inflammatory cytokines [10, 16, 26], we multiply the corresponding term by .
2.2 Cytokines
The equations describing the concentration changes of pro-inflammatory () and anti-inflammatory () cytokines are as follows:
| (5) |
| (6) |
where , , , and are constant parameters related to the production and decay of pro-inflammatory and anti-inflammatory cytokines. The Hill functions and take the same form as in (3) and (4), respectively. The following subsection details the model terms relating to cytokine production, and Table 1 lists the relevant parameter descriptions, units, and nominal values.
Cytokine production
We assume that pro-inflammatory cytokines are produced by M1 cells at a rate , anti-inflammatory cytokines are produced by M2 cells at a rate , and their production is influenced by the presence of both the pro- and anti-inflammatory cytokines in the system [10, 16, 6, 17, 18, 21, 19]. In particular, the concentration of pro-inflammatory cytokines supports additional pro-inflammatory cytokines production and suppresses the production of anti-inflammatory cytokines [21, 10, 16, 6, 17], which we model through the use of the Hill functions in and in . Further, the presence of anti-inflammatory cytokines encourages more anti-inflammatory cytokines to be produced and suppresses the production of pro-inflammatory cytokines [21, 10, 16, 6, 17], which we model through the terms in and in . The Hill functions account for the saturating effects of these interactions [14, 52].
2.3 Model Summary and Simulation Results
In summary, the proposed model describing the interactions between the M1 and M2 microglia phenotypes and pro-inflammatory and anti-inflammatory cytokines comprises Equations (1), (2), (5), and (6). The complete system of coupled nonlinear differential equations is given by
| (7) |
| Index | Parameter | Description | Nominal Value | Units |
|---|---|---|---|---|
| Number of resting microglia | cells | |||
| Activation rate of microglia to | ||||
| Activation rate of microglia to | ||||
| Production rate of | ||||
| Production rate of | ||||
| Hill coefficient for in | unitless | |||
| Half-maximal concentration of | ||||
| Hill coefficient for in | unitless | |||
| Half-maximal concentration of | ||||
| Rate of switch | ||||
| Rate of switch | ||||
| Mortality rate of | ||||
| Mortality rate of | ||||
| Natural decay rate of | ||||
| Natural decay rate of | ||||
| Hill coefficient for in | unitless | |||
| Hill coefficient for in | unitless |
Table 1 lists the index, description, nominal value, and unit for each parameter included in Model (7). Nominal parameter values were chosen to obtain model outputs consistent with experimental findings [44, 45, 46, 50, 51, 47, 48, 49]. In particular, simulations with nominal parameter values reflect dominance of M2 microglia early in the inflammatory process, followed by an eventual takeover of the M1 microglia [9, 17].
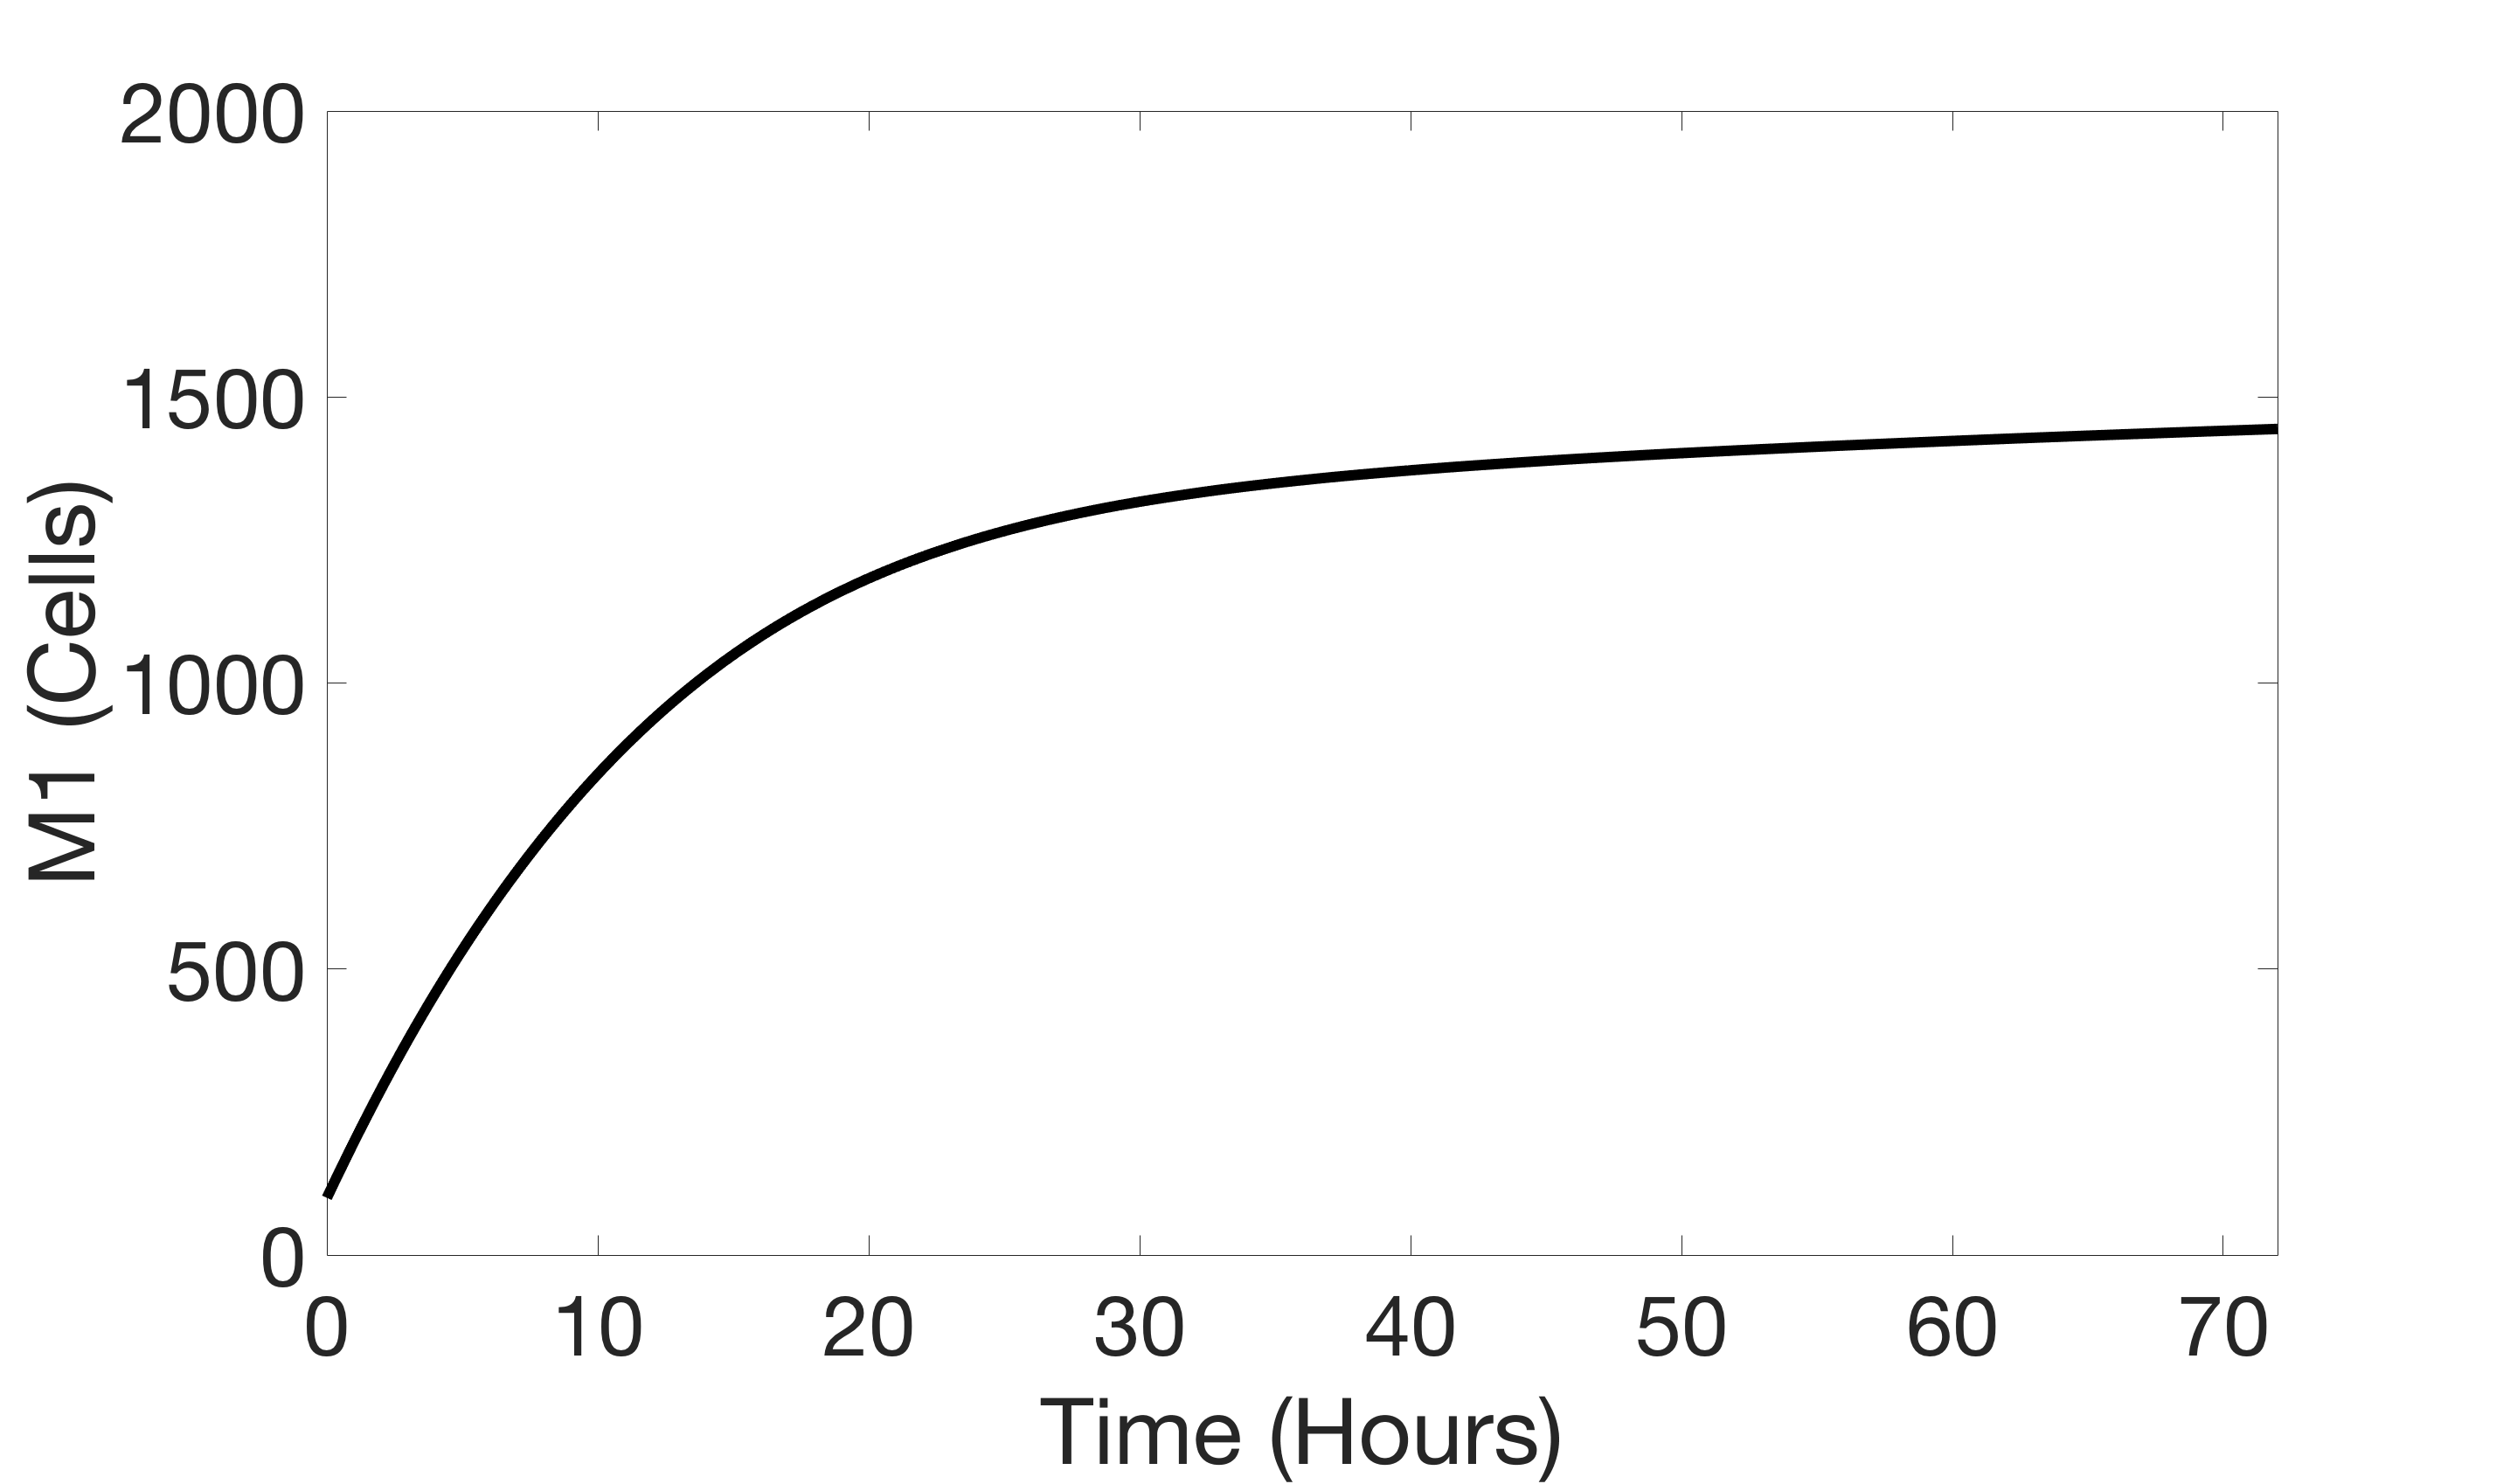
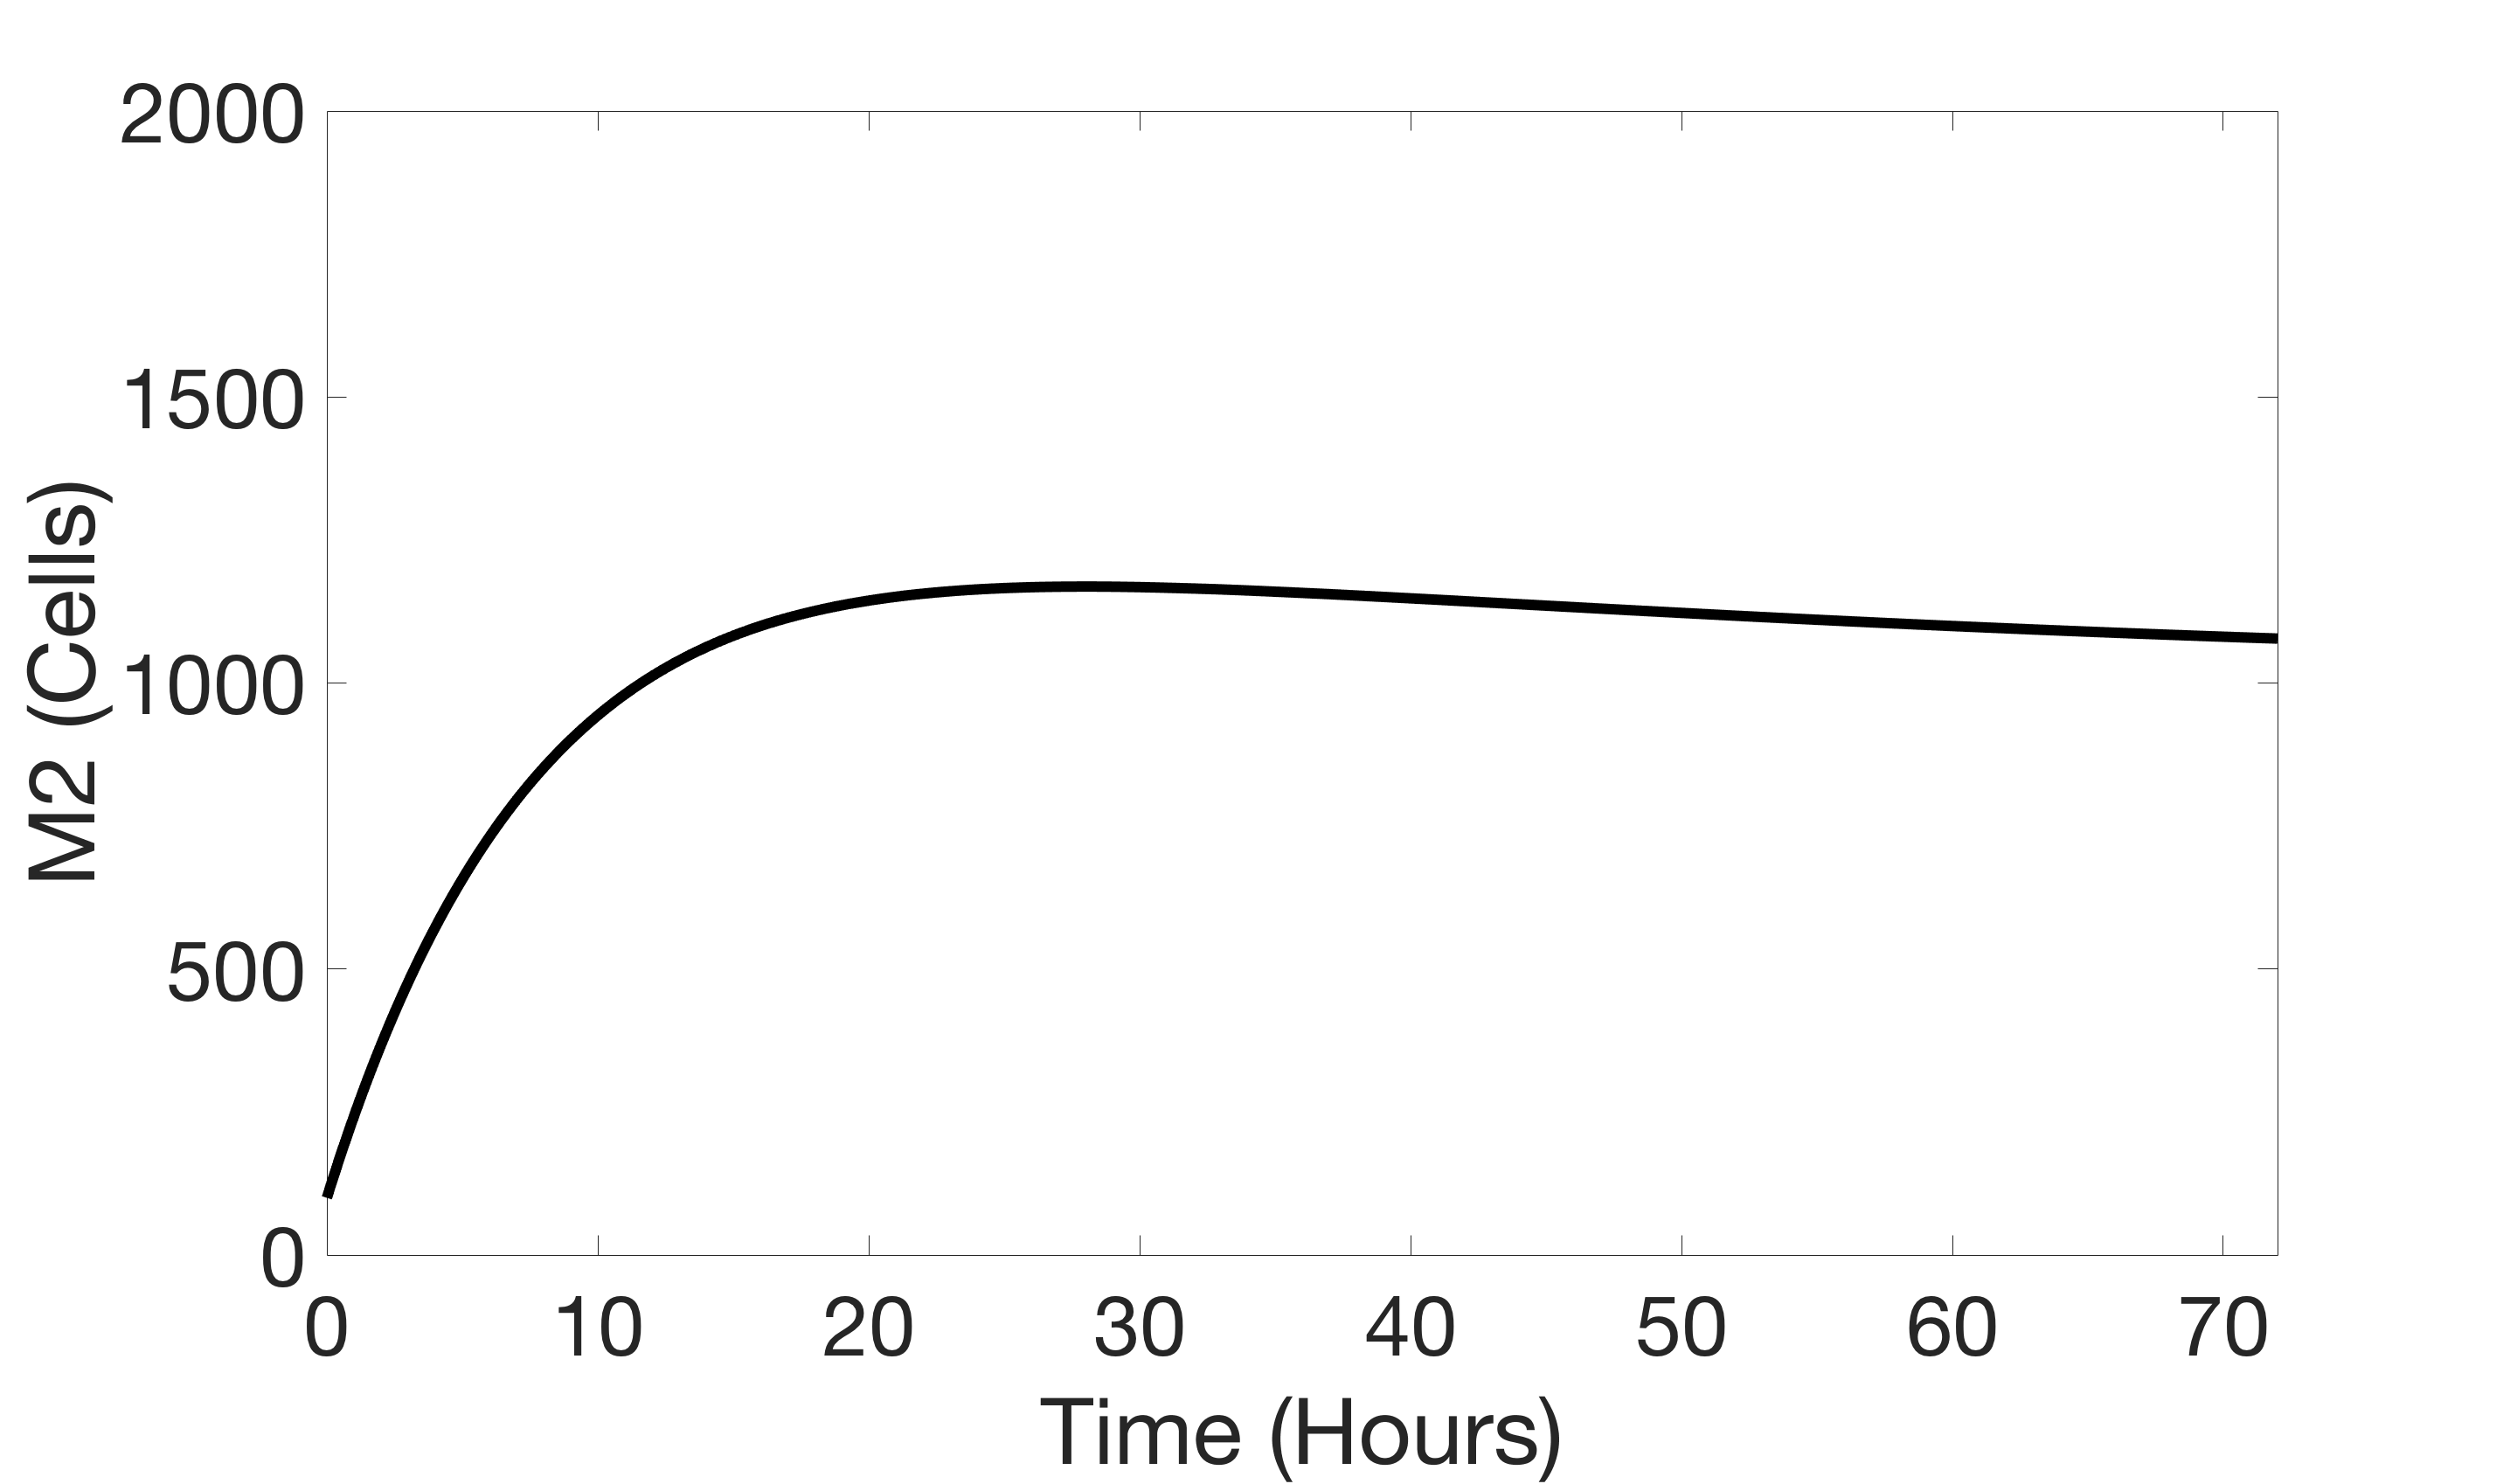
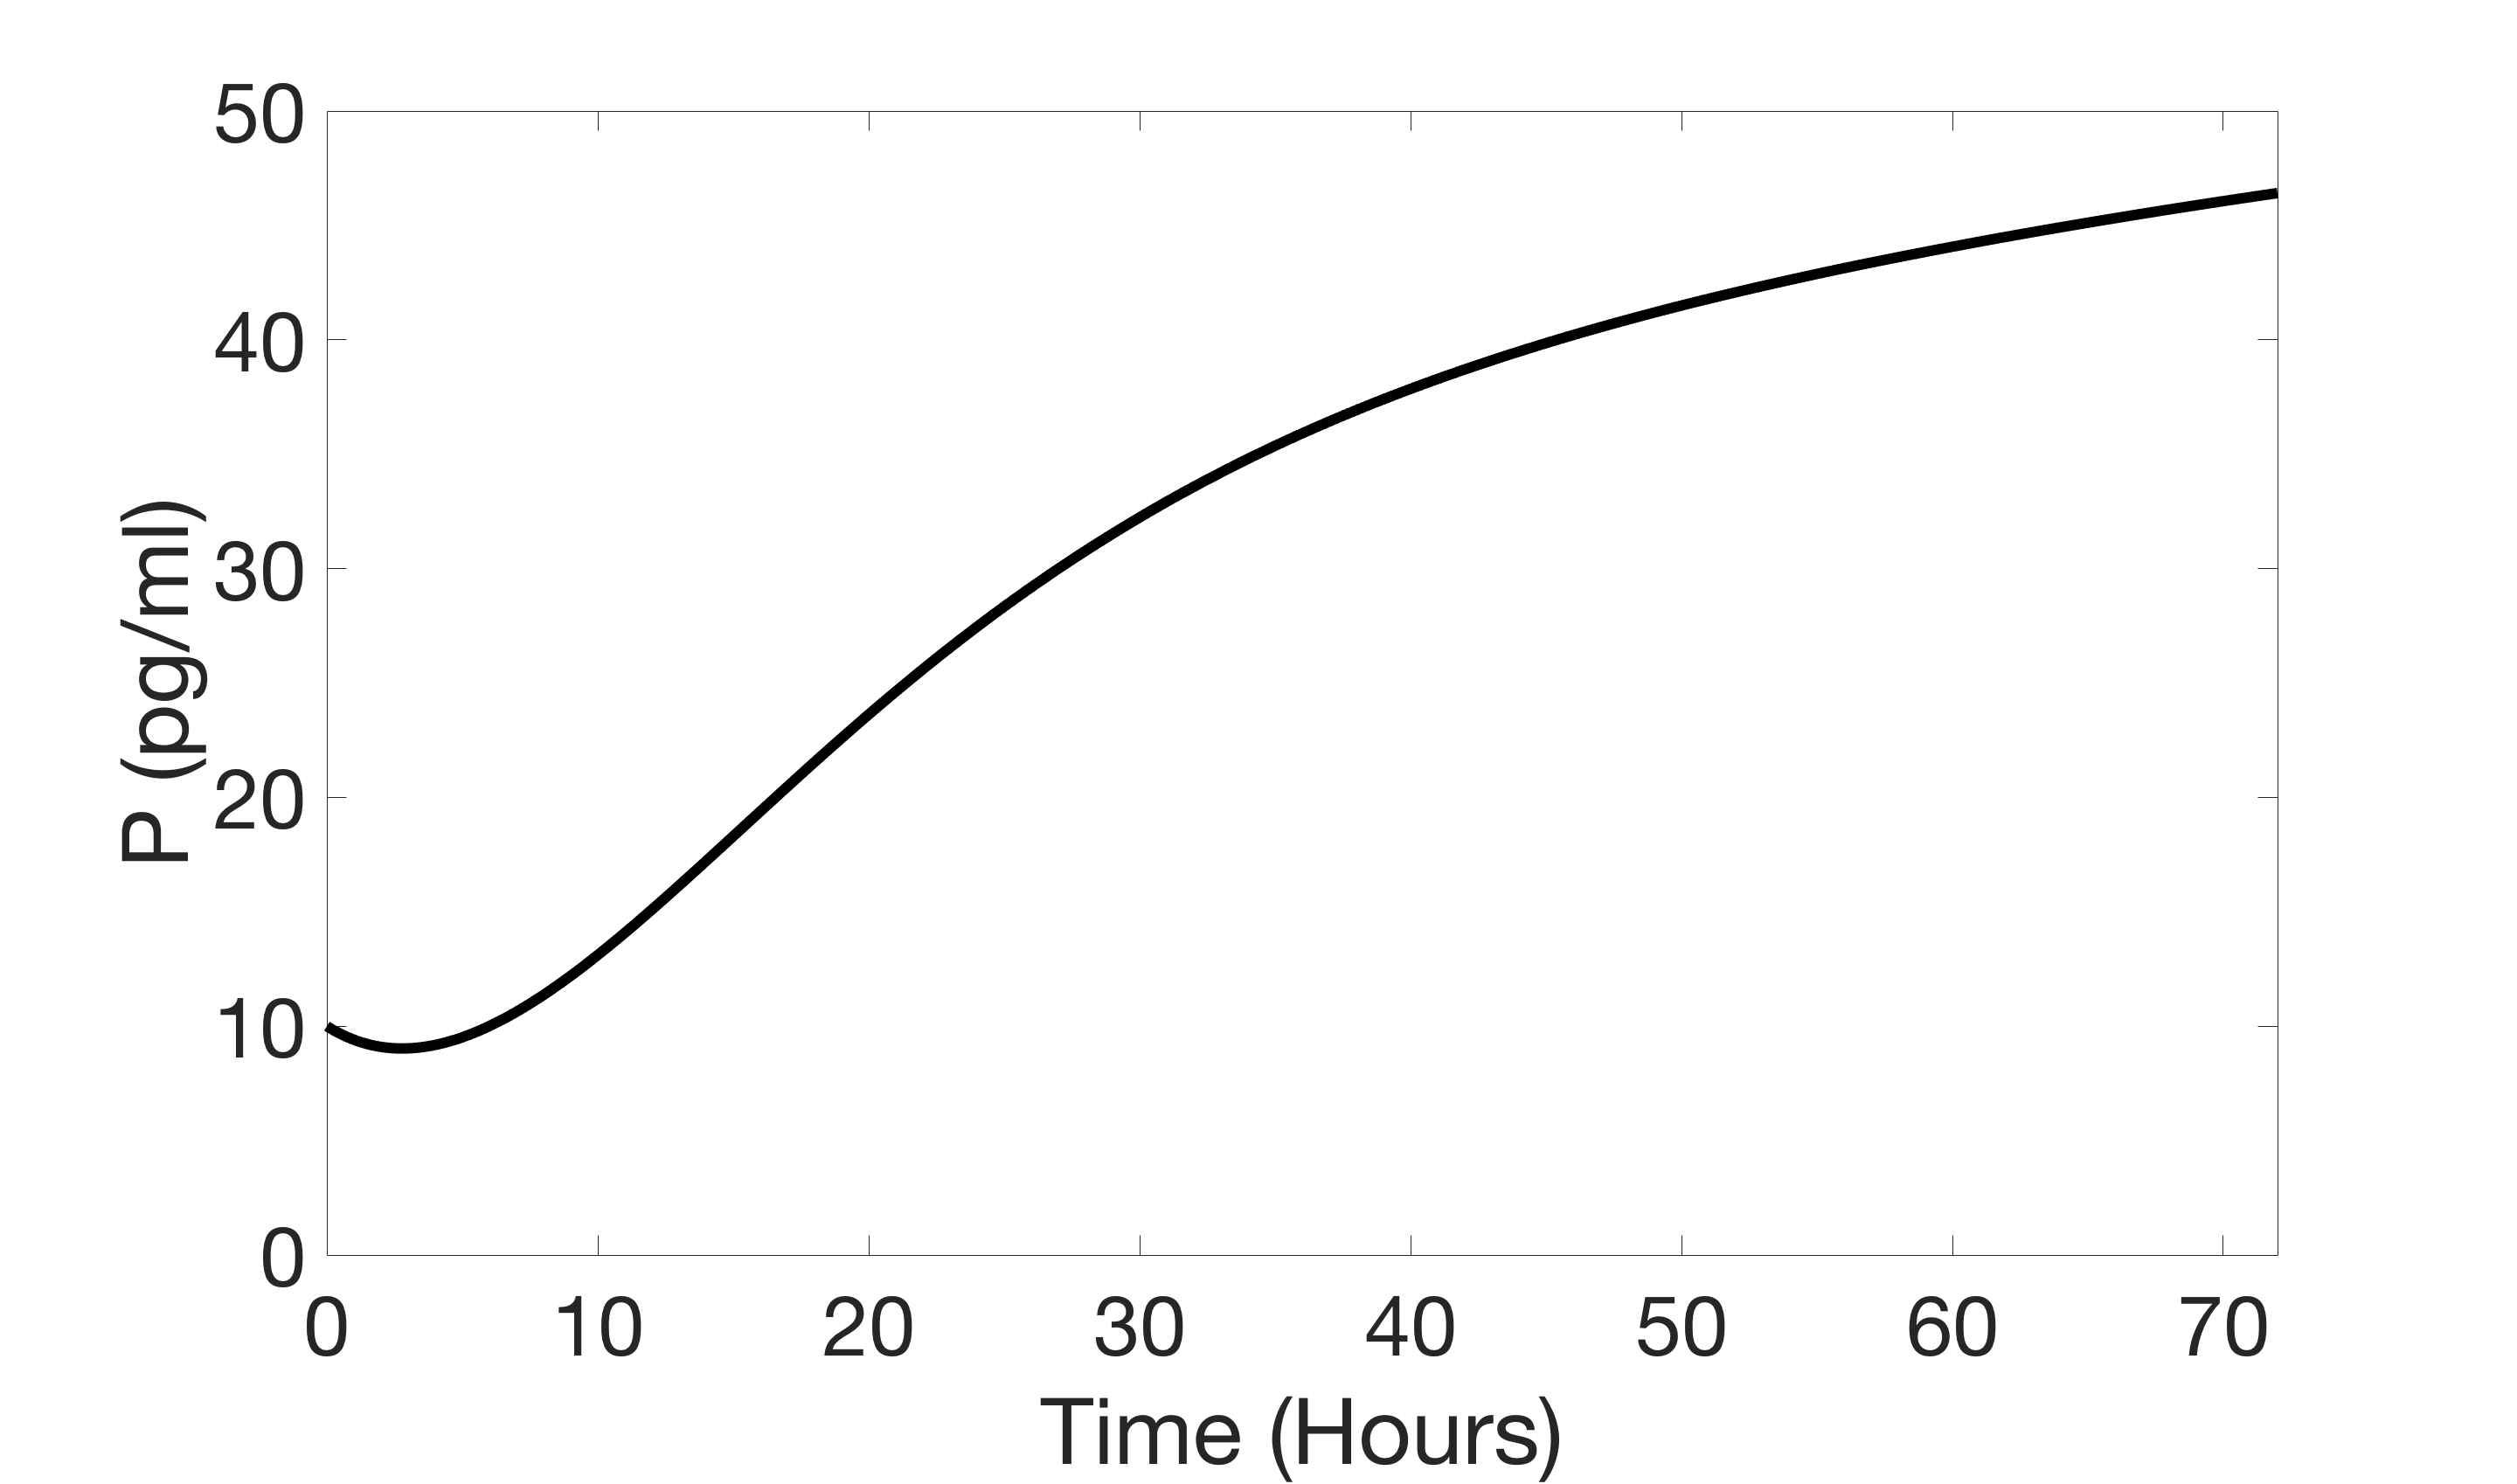
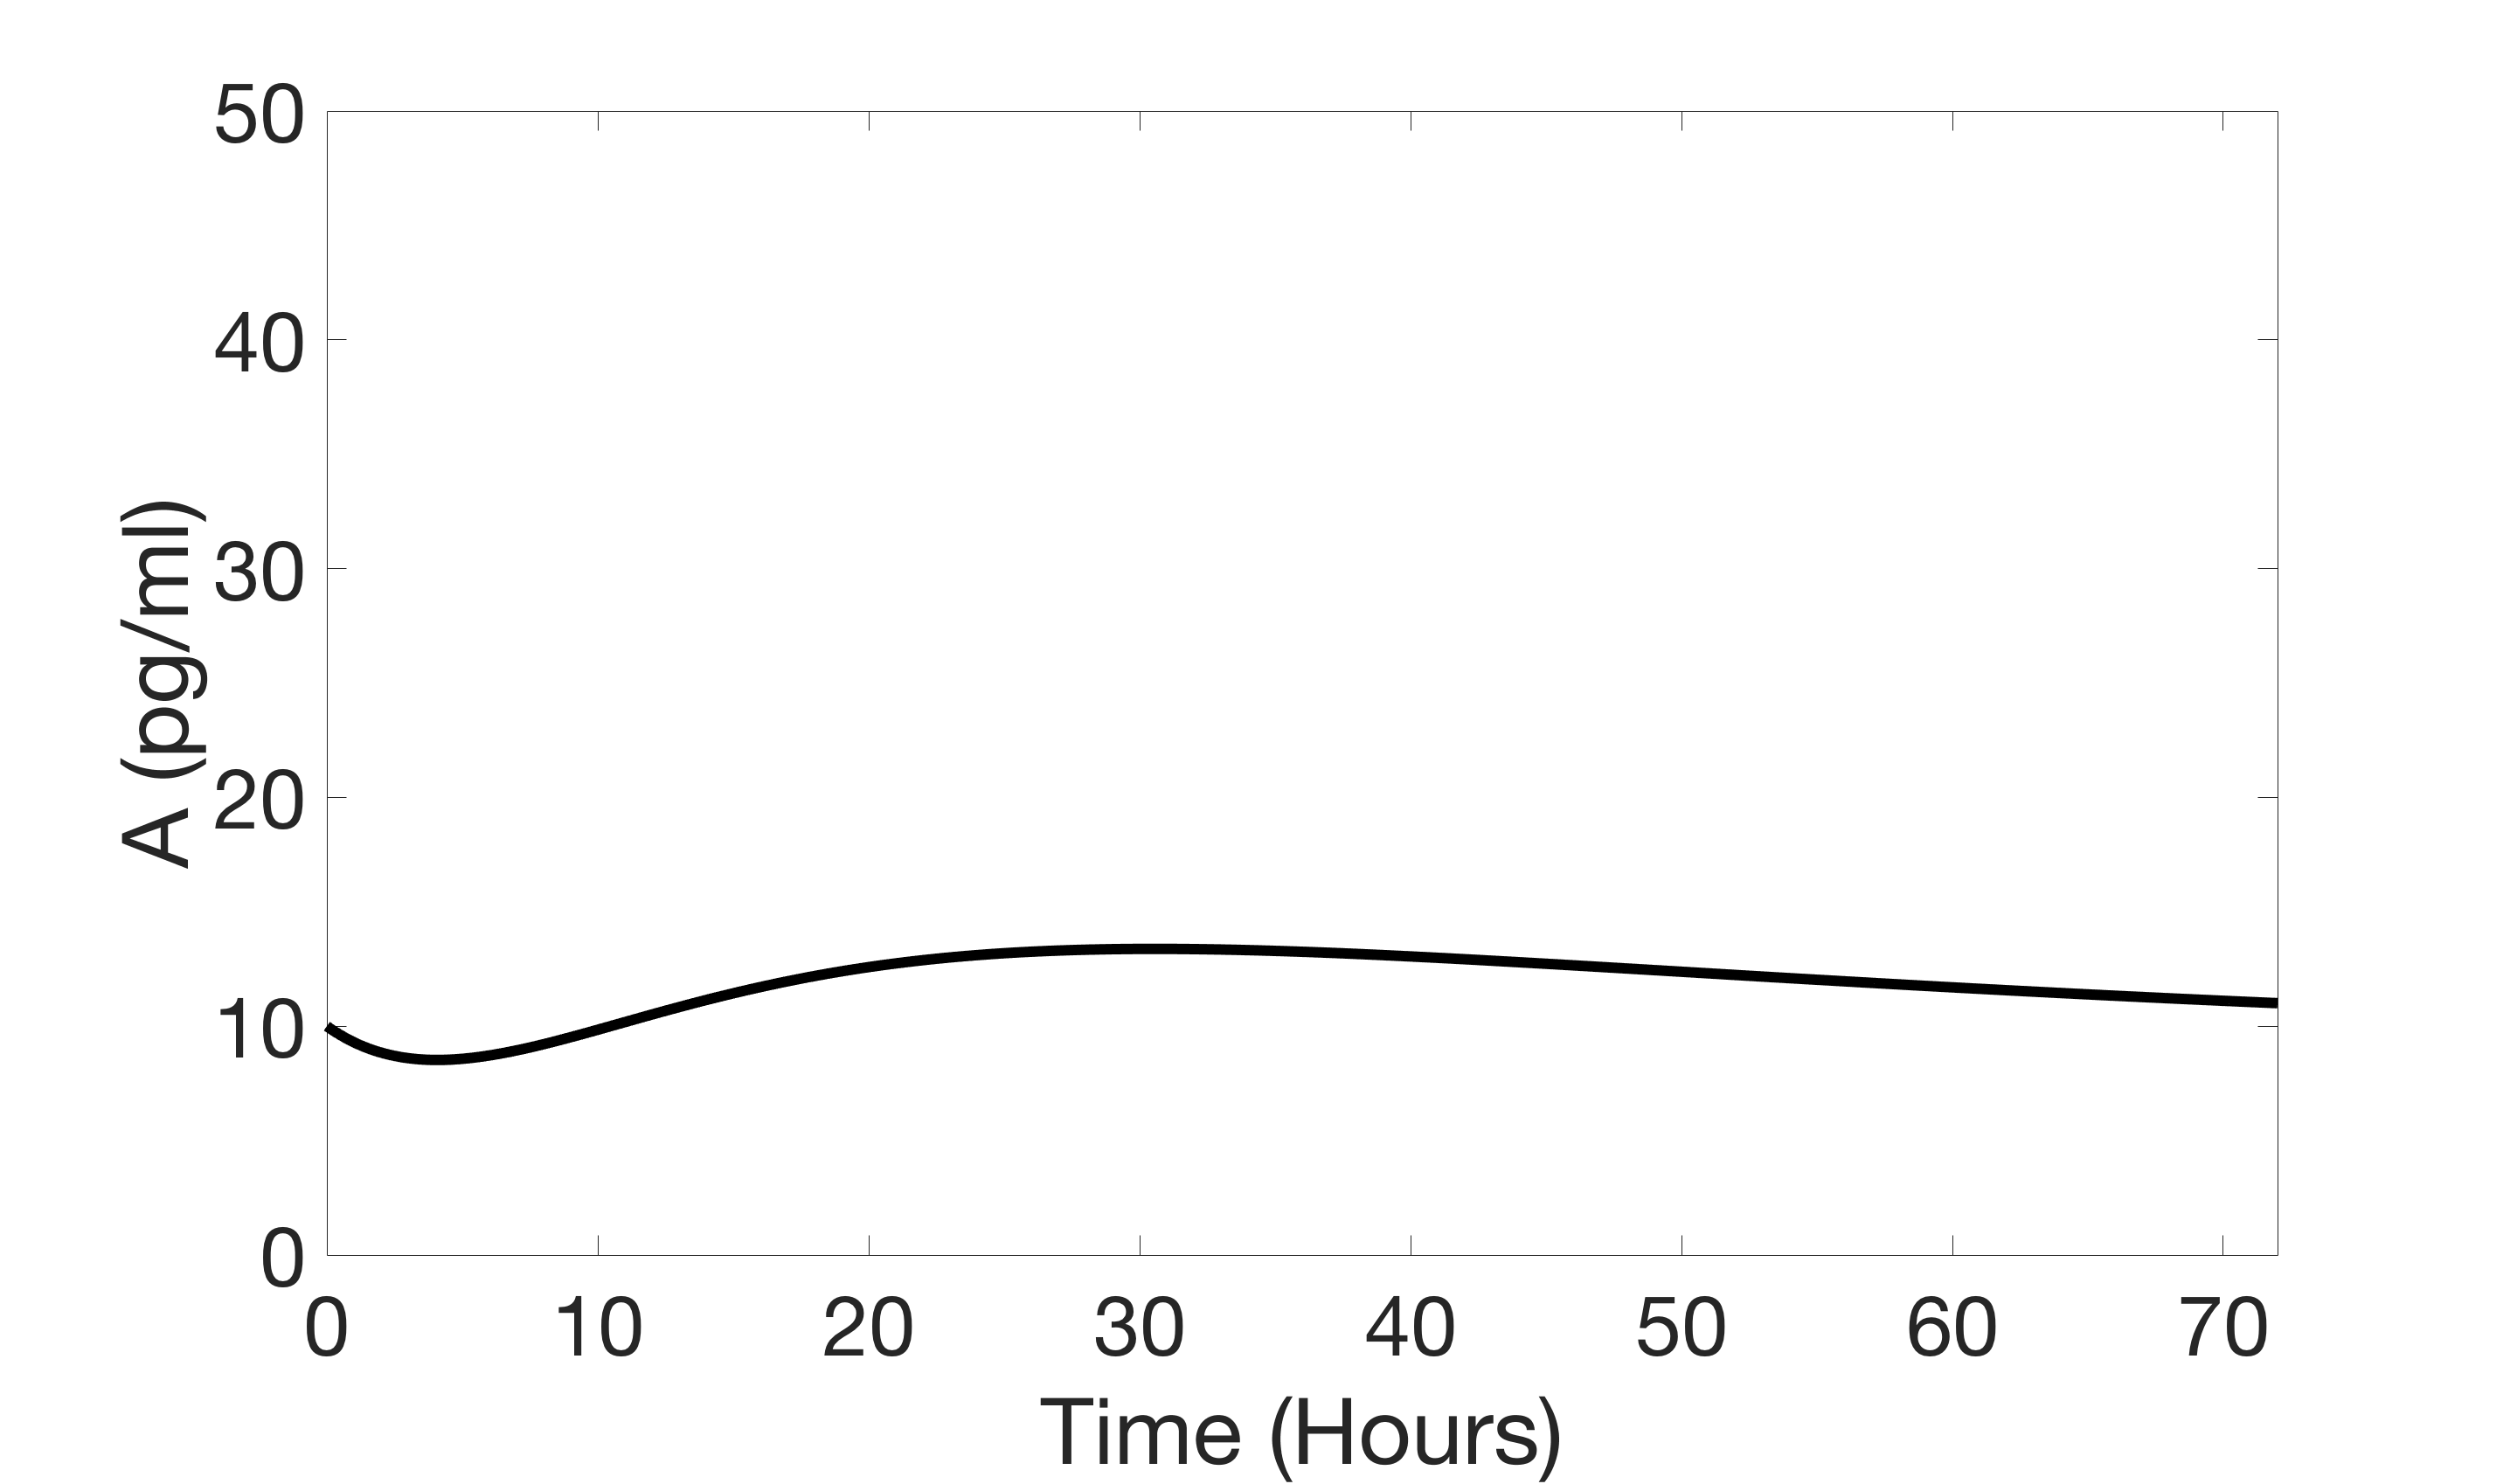
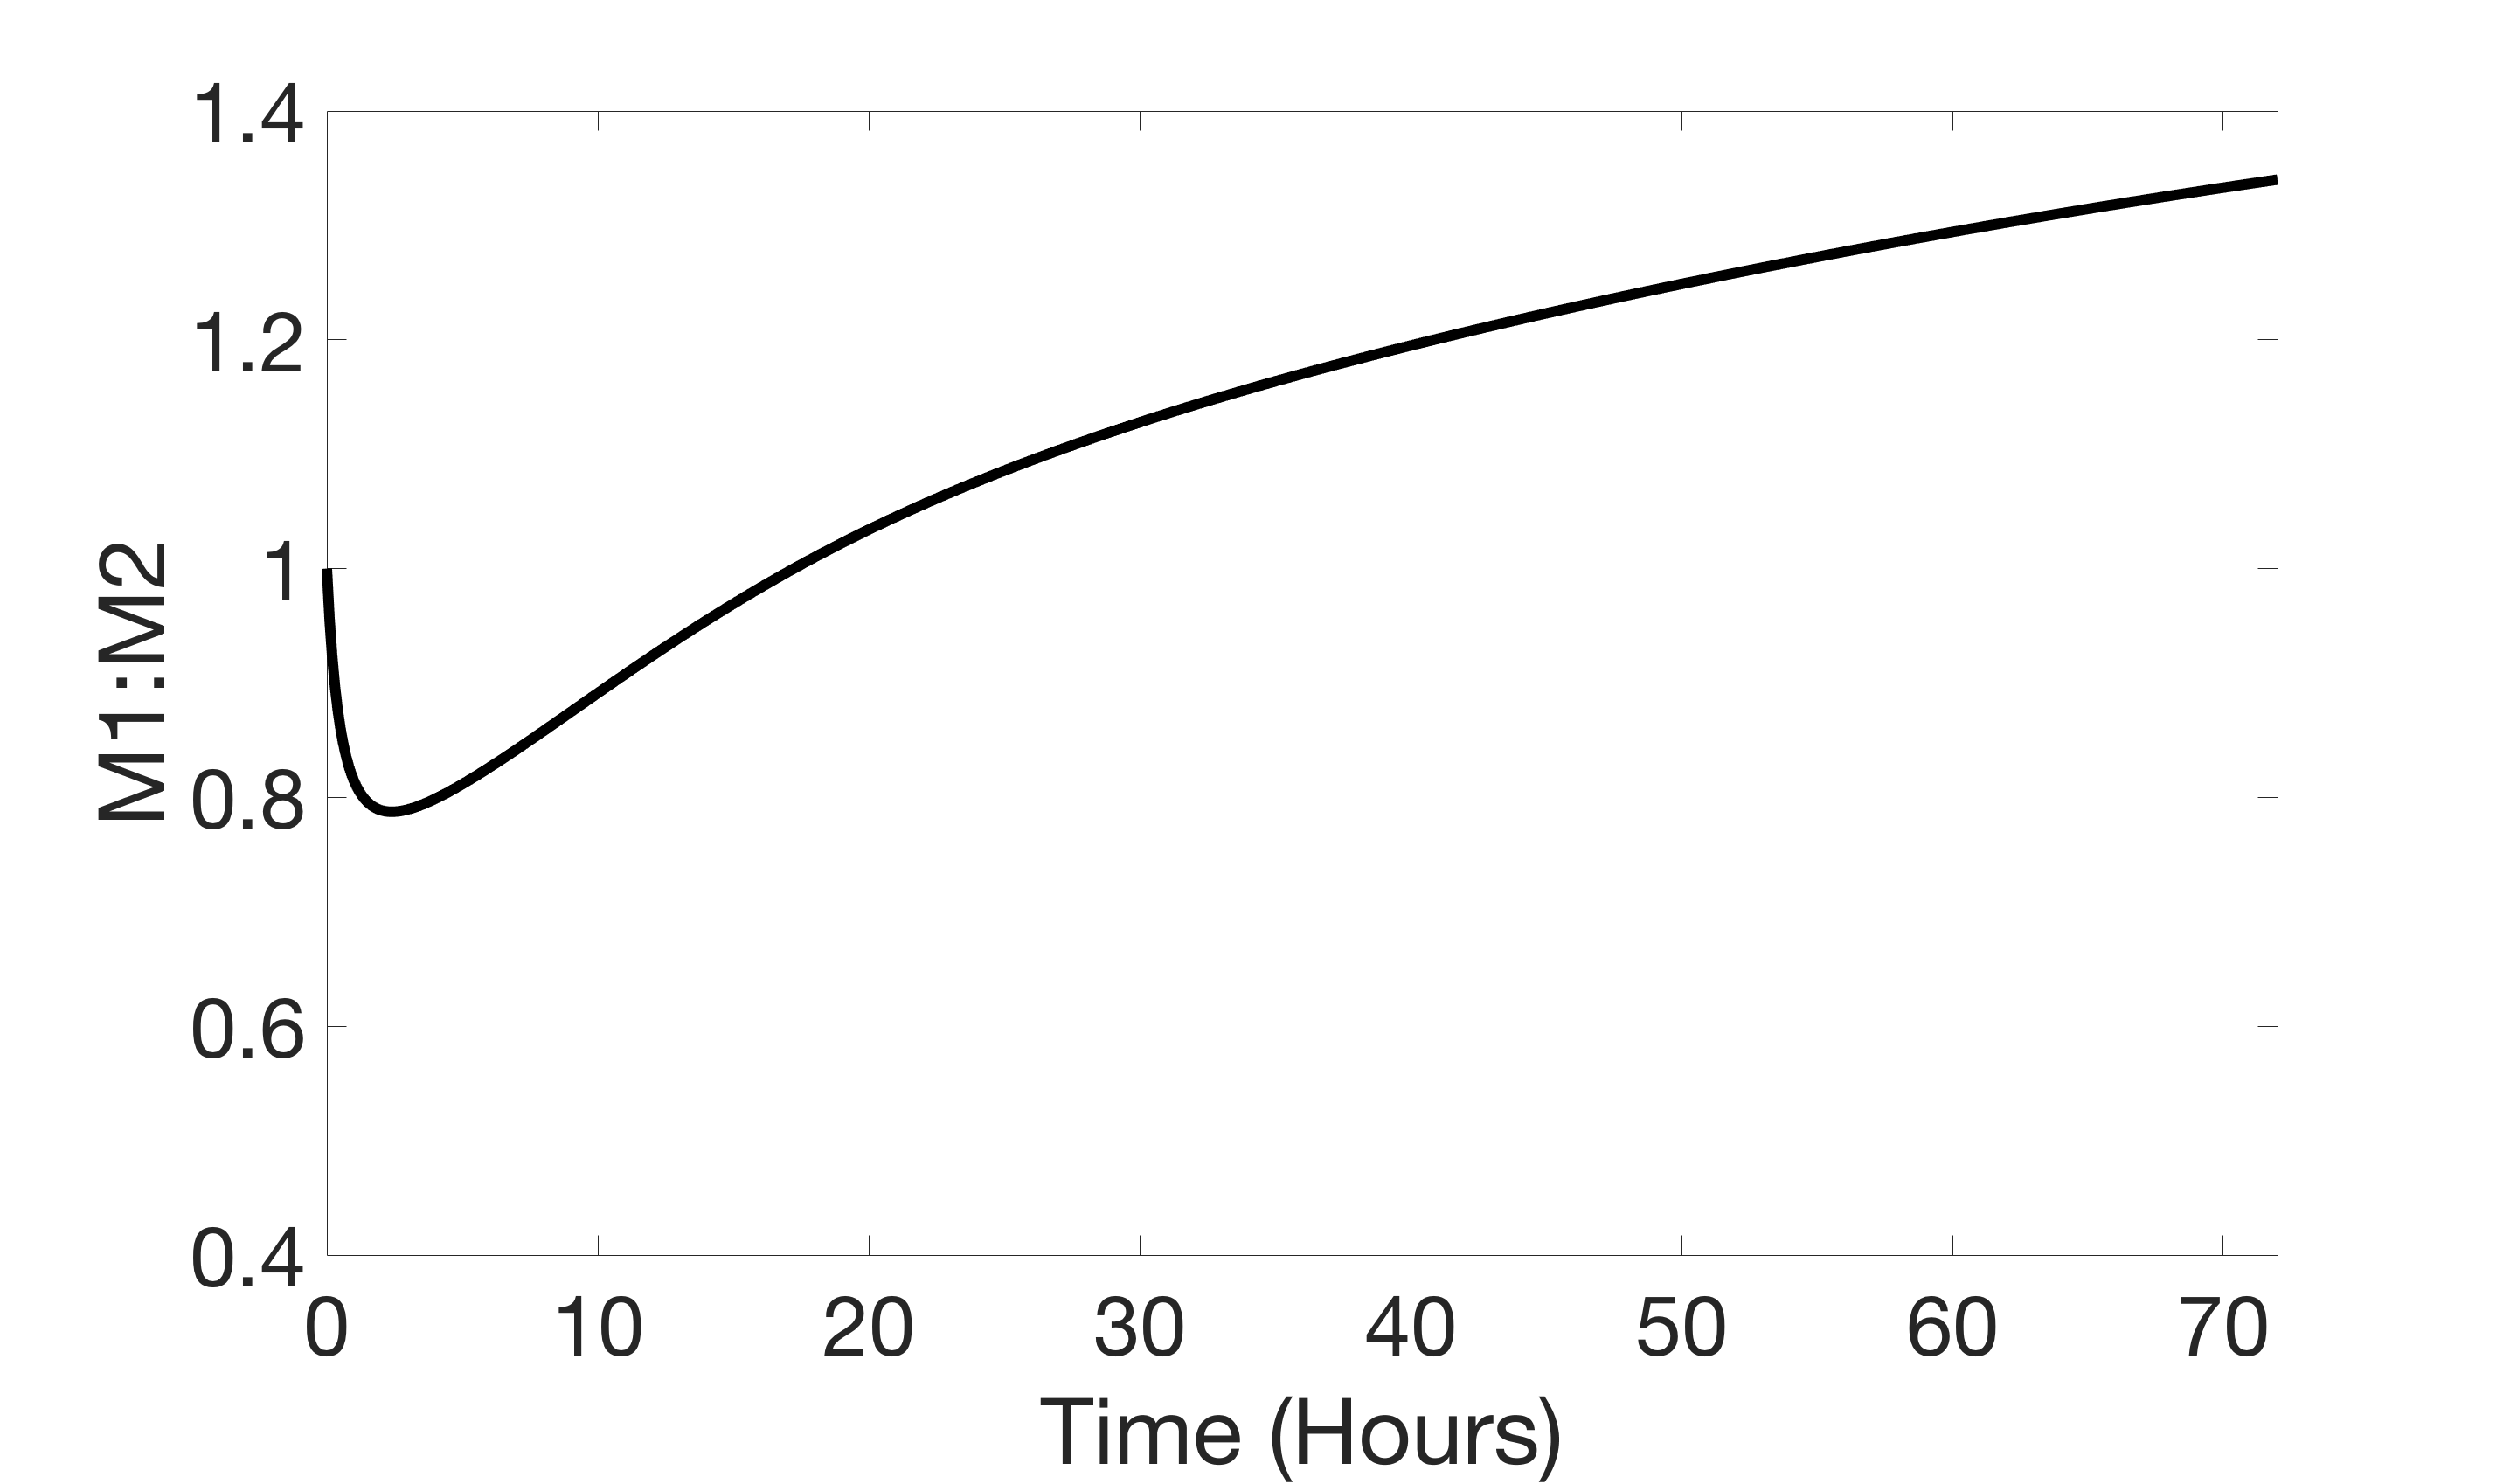
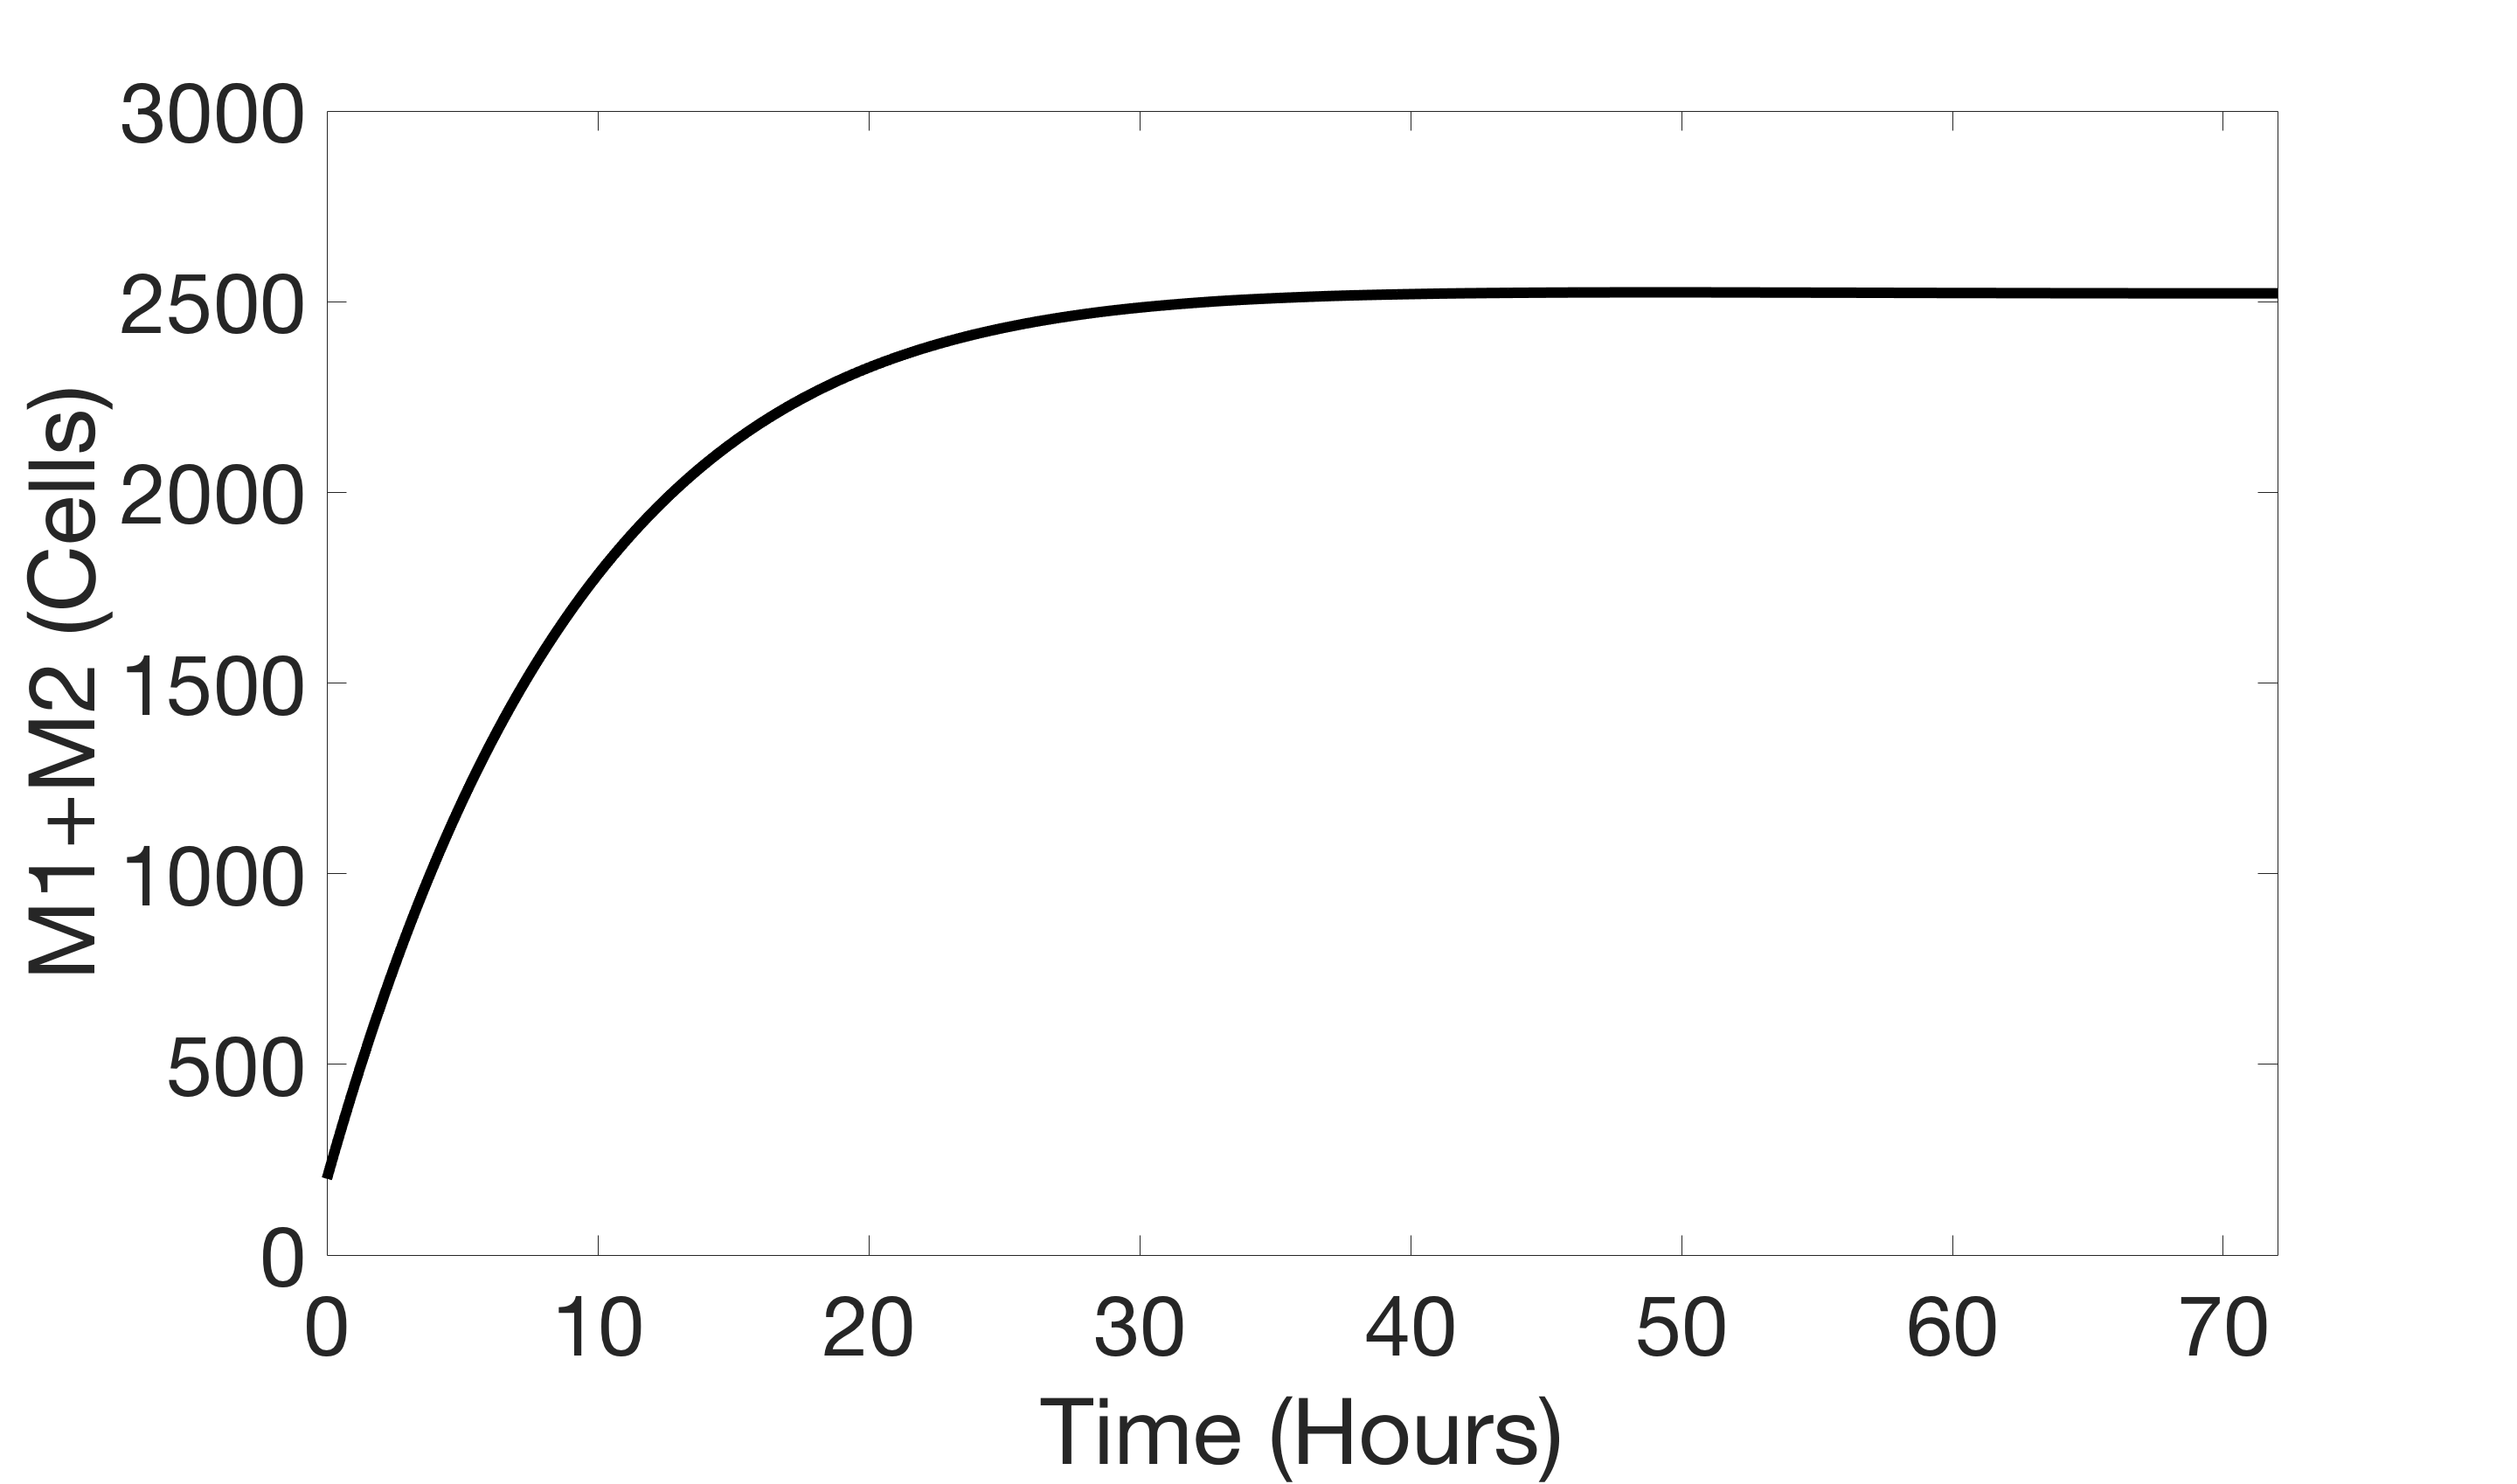
Numerical simulations were performed using MATLAB® programming language. Specifically, ode15s was utilized to compute the numerical solution of Model (7) using the nominal parameters in Table 1 and the initial conditions cells, cells, , and . Figure 2 shows the resulting model output for the numbers of M1 and M2 microglia and the concentrations of pro-inflammatory and anti-inflammatory cytokines, as well as the ratio of M1 to M2 cells () and the total number of activated microglia (), over a hour time period.
Note in Figure 2 that the M2 phenotype dominates until around hours. After this time period, the ratio becomes greater than one, indicating that there are more M1 microglia than M2 microglia. At hours, the ratio of M1 to M2 microglia is approximately . The minimum ratio is approximately and occurs at hours. We also observe that after a short time the concentration of pro-inflammatory cytokines is significantly larger than that of the anti-inflammatory cytokines. We verify that these values are within experimentally observed ranges of cytokines post ischemic stroke [28, 52, 53]. While not shown, note that when the switching from M1 to M2 microglia is turned off, the M1 microglia dominate from the beginning, and the M2 microglia and anti-inflammatory cytokines approach zero. Similarly, when the switching from M2 to M1 is turned off, the M2 microglia and anti-inflammatory cytokines dominate.
3 Sensitivity Analysis
Since the behavior of Model (7) is greatly influenced by the choice of values for the 17 model parameters, we utilize sensitivity analysis techniques in order to study each parameter’s contribution to model output. In particular, we apply two global sensitivity analysis techniques: the Morris method of elementary effects, and the Sobol method. Global sensitivity approaches aim to quantify how uncertainty and variability in model output can be attributed to uncertainties in the inputs. We summarize Morris elementary effects and Sobol sensitivity analysis below, describing specifically the application to this work; for more details on these methods, see [54, 55, 56, 57, 58].
For each method, consider the nonlinear input-output relation
| (8) |
where is a scalar response variable and each is a model parameter whose index () corresponds to the index listed in Table 1. Since we are interested in how the parameters affect the number of activated microglia, in particular the ratio of M1 to M2 microglia and the total activated microglia, we consider the following two response variables:
| (9) |
| (10) |
Parameters are admitted to vary over a specified space. In this study, each parameter’s admissible space is taken to be the interval of around the nominal value given in Table 1.
3.1 Morris Elementary Effects
The Morris method of elementary effects quantifies the effect of varying one parameter at a time on a model output. The interval is divided into levels, and parameters are randomly sampled from these levels. In this work, we let . Parameters are perturbed one at a time by the increment
| (11) |
For each parameter , we generate two vectors which differ only in the th entry. Parameters are then rescaled to their admissible parameter space, and elementary effects are computed by
| (12) |
where is the parameter vector and is the th unit vector. This process is repeated for samples, and the absolute mean and variance are computed via the formulas
| (13) |
and
| (14) |
The absolute mean in (13) provides an estimate of the absolute value of the average of elementary effects over all samples. The variance in (14) measures how far each elementary effect is from the mean. Since large variances indicate dependence on neighboring input values, the variance gives an estimate of the combined effects of the interactions of each parameter with other parameters. In this work, we use the absolute mean to rank the sensitivity of the parameters.
3.2 Sobol Method
Sobol sensitivity analysis is a variance-based method which quantifies how much of the variability in the model output can be attributed to each individual parameter or parameter interactions. To implement the Sobol method in this work, parameters are randomly sampled from their respective parameter space a total of times. Half of these samples form the rows of a matrix , which has dimensions (where 17 is the number of parameters), and the other half form the rows of a matrix , a nonidentical matrix. Seventeen additional matrices, denoted as , are generated such that each corresponds to the parameter and has its th row taken as the th row of and its remaining rows taken from .
A scalar model output is generated for each row of the matrices , , and for all by first running a forward simulation of the model with parameter values set to the entries in the respective row and then computing the response variable (8). This results in scalar response vectors of size for each matrix, denoted by , , and , where
| (15) |
and the output function is taken to be either (9) or (10), respectively.
The first-order sensitivity indices, , and total-order sensitivity indices, , are computed using the formulas
| (16) |
and
| (17) |
respectively, where
| (18) |
and here . The first-order sensitivity indices in (16) measure the fractional contribution of a single parameter to the output variance, while the total-order sensitivity indices in (17) measure the contribution of a single parameter and this parameter’s interactions with the other parameters to the output variance. We use the total-oder sensitivity indices to achieve an overall sensitivity ranking of the parameters.
3.3 Parameter Sensitivity Rankings
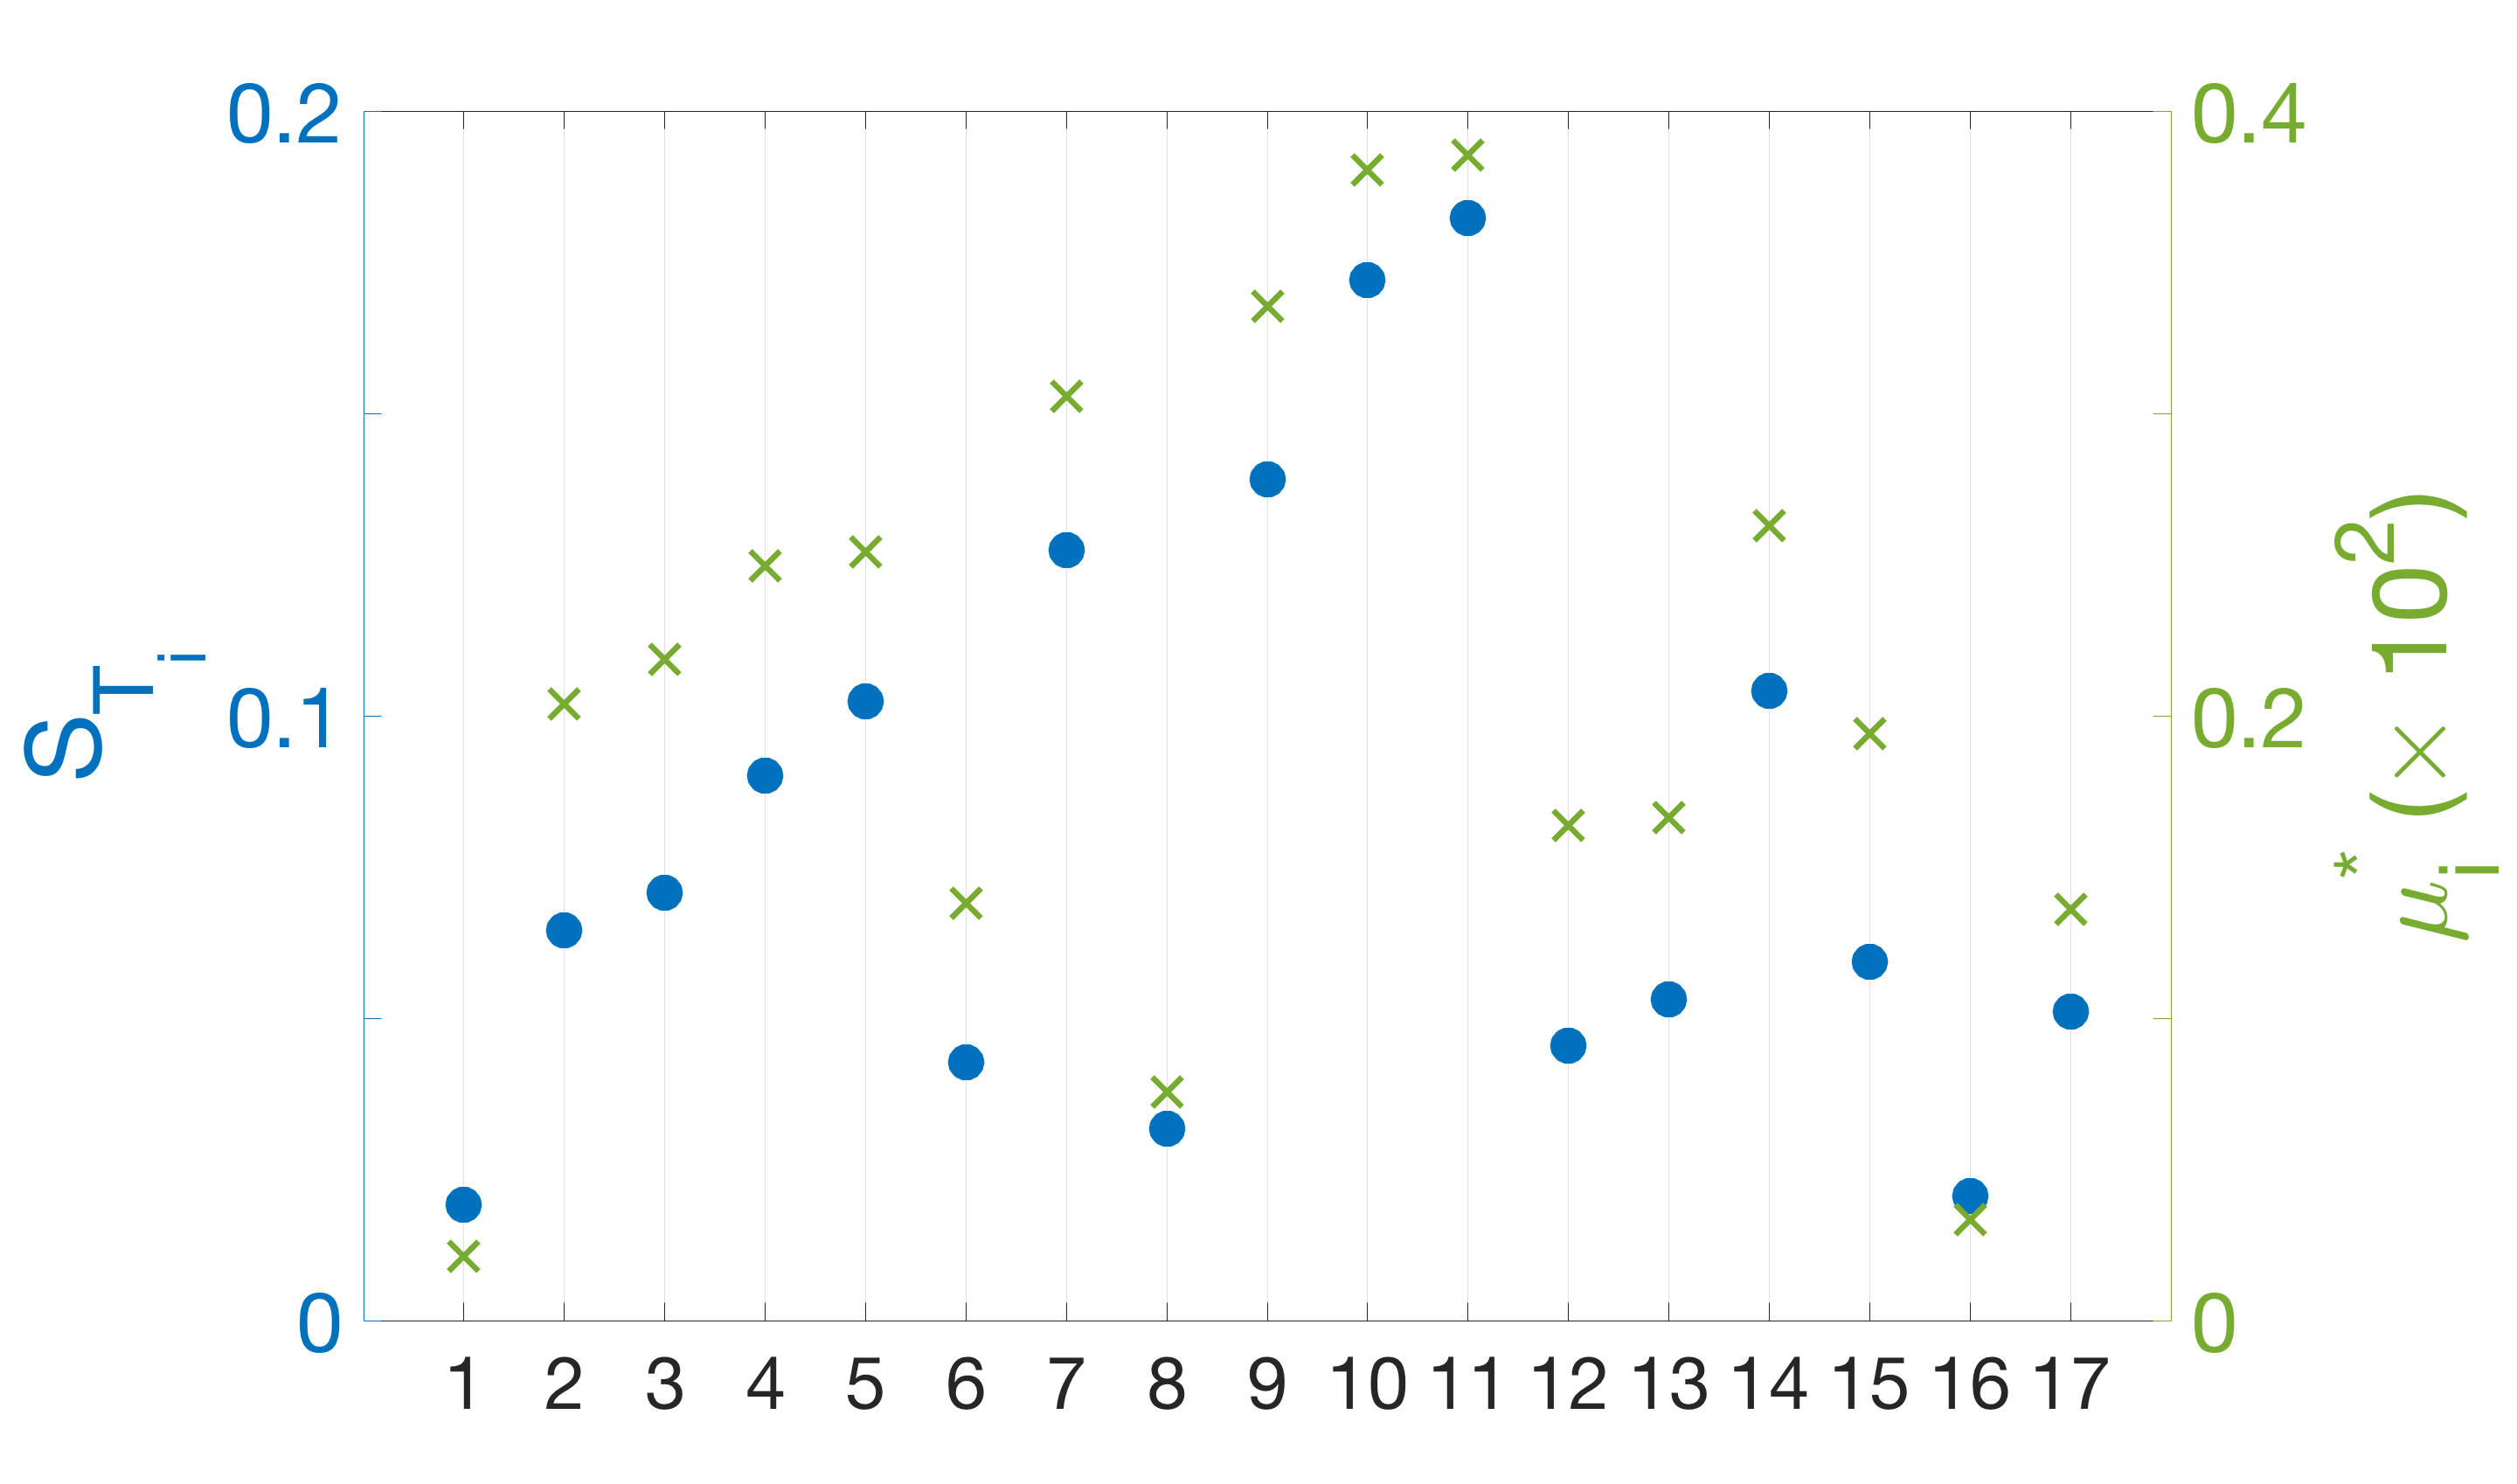
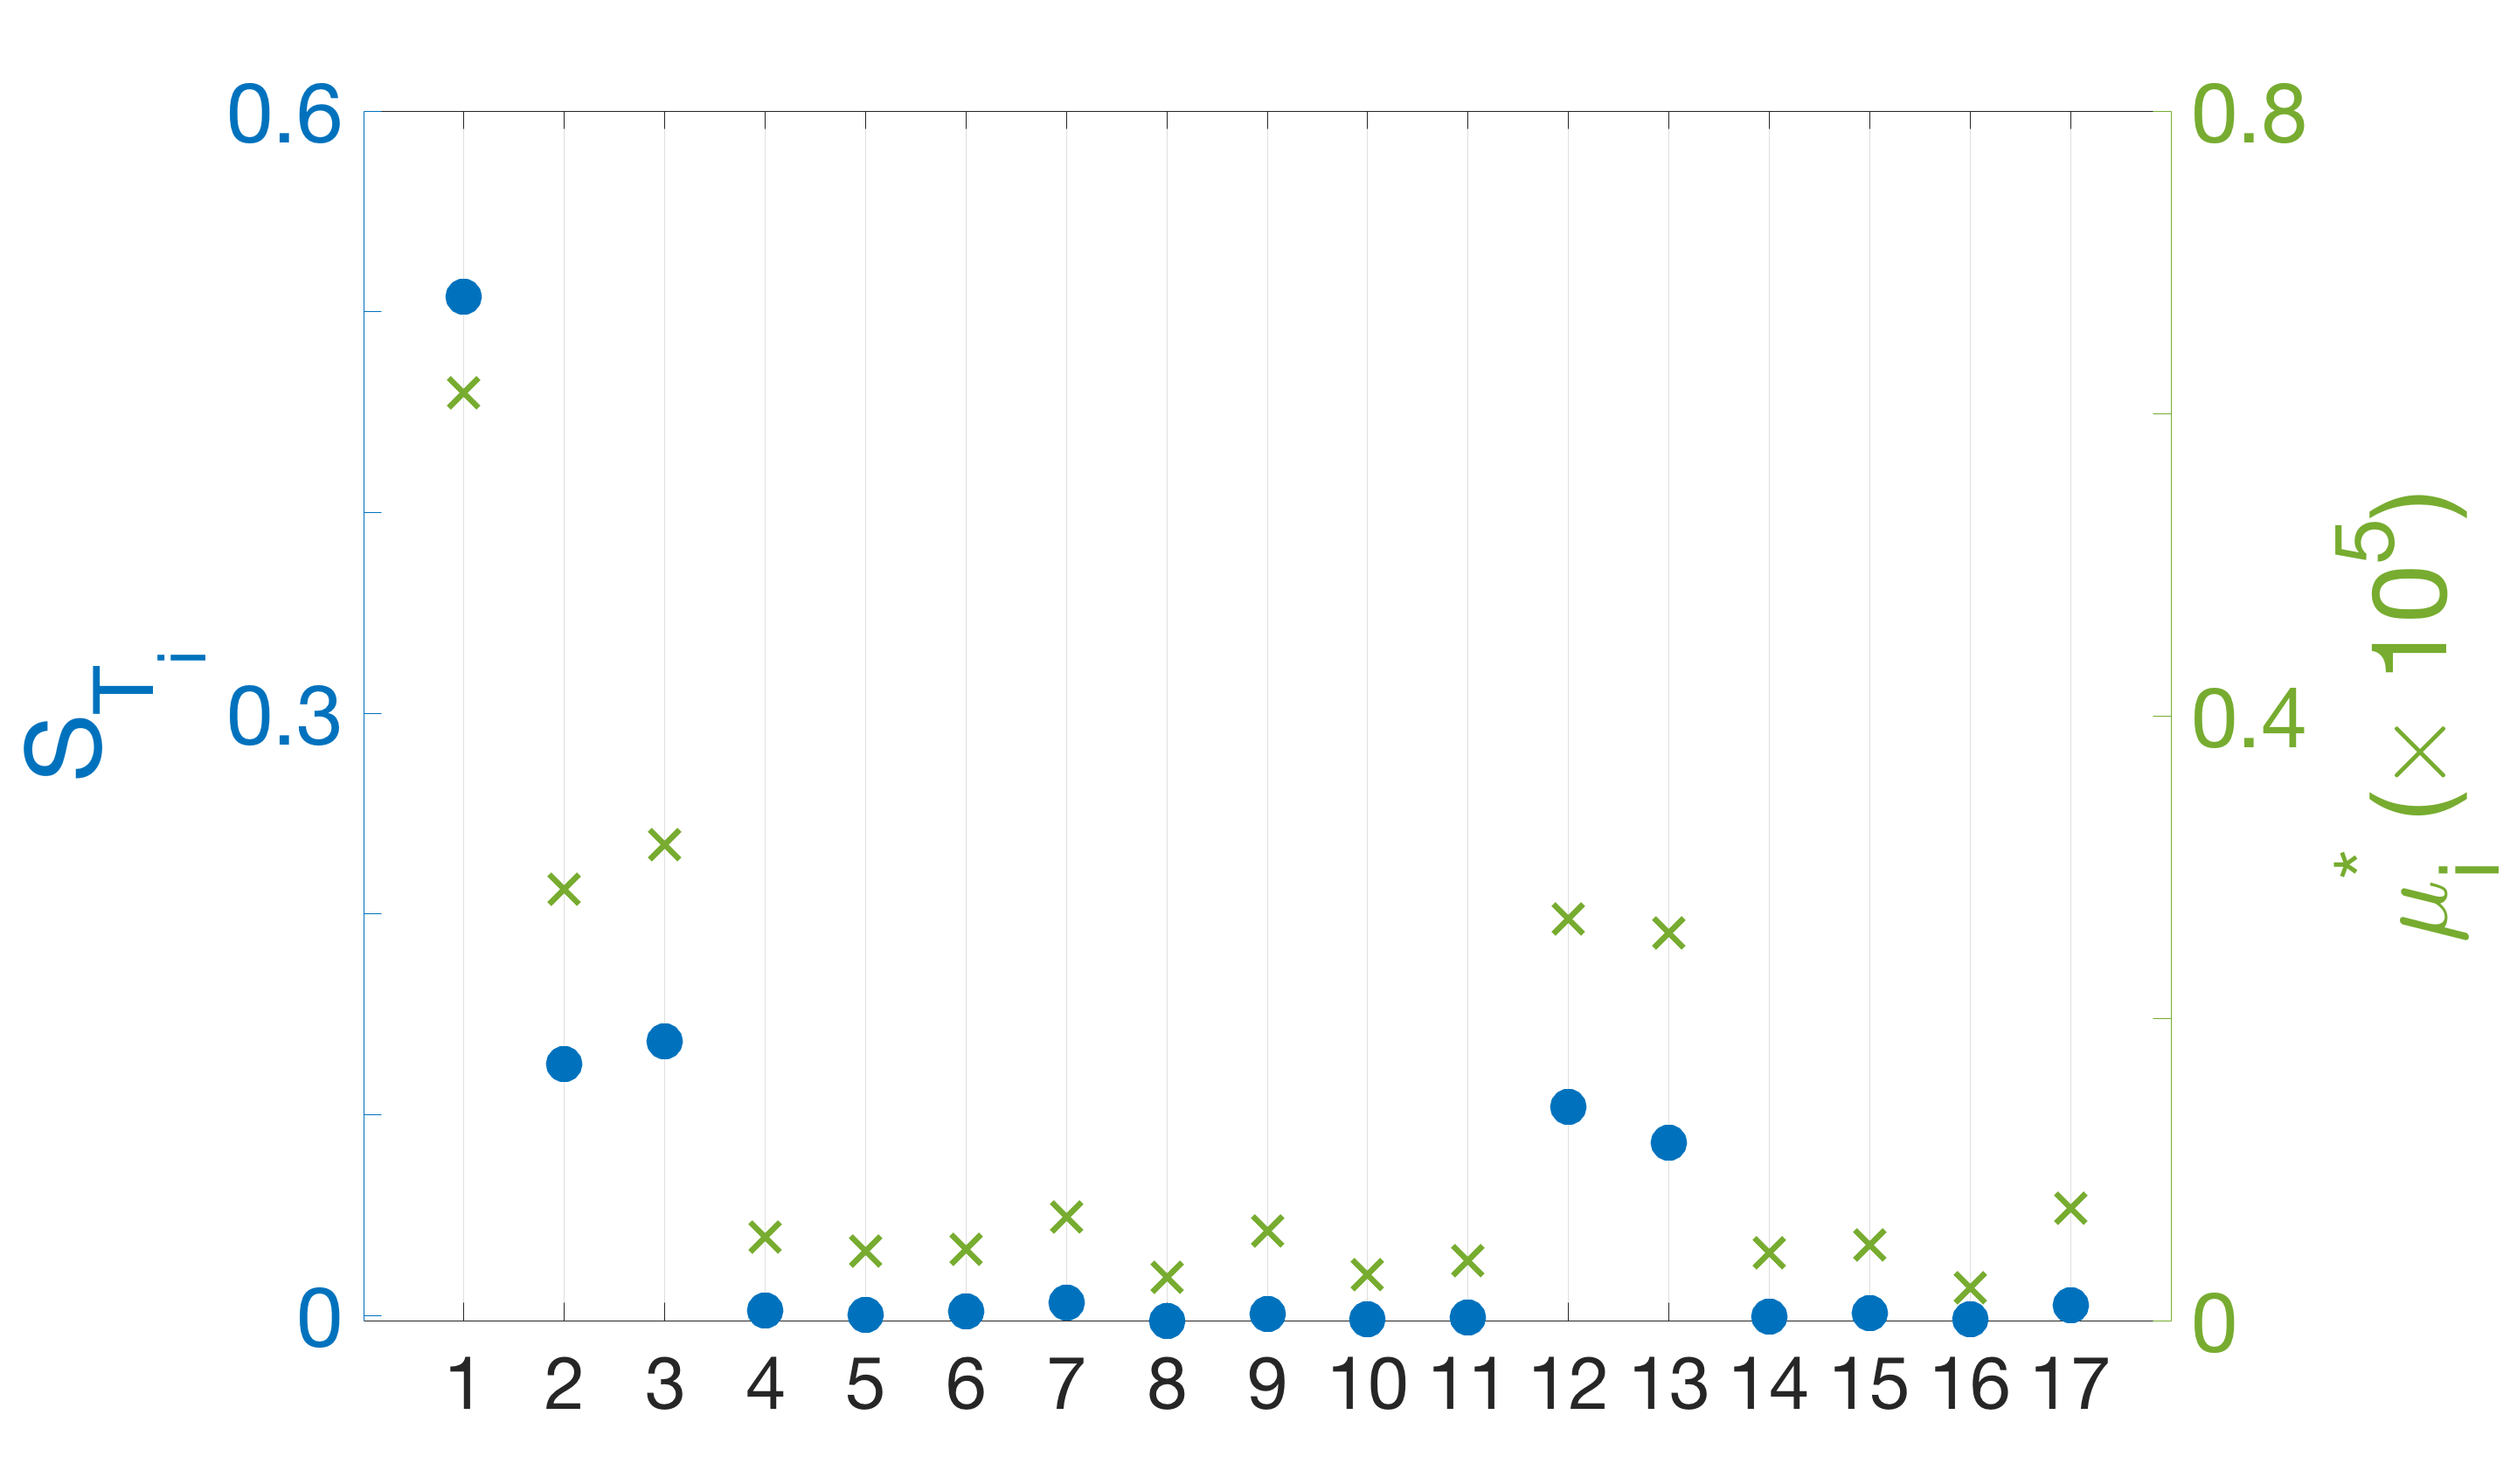
Figure 3 shows the resulting parameter sensitivity rankings using both the Morris and Sobol methods for the scalar responses given in (9) and (10). Parameters are ranked according to their Morris absolute means, in (13), and total-order Sobol sensitivity indices, in (17). Note that the sensitivity rankings are consistent between methods but depend on the response considered.
As shown in Figure 3(a), when considering the ratio of M1 to M2 microglia in (9), the microglia phenotype switching rates and are the most sensitive parameters with respect to both Morris and Sobol sensitivity measures. These are followed by the half-maximal concentrations and of the anti-inflammatory and pro-inflammatory cytokines, respectively. When instead considering the total activated microglia in (10), Figure 3(b) shows that most of the parameters have a total-order sensitivity index and an absolute mean very close to . The most sensitive parameter for this response is the number of resting microglia , followed by the microglia activation rates and and the microglia mortality rates and .
4 Modified Model for Neuroprotectant-Based Strategies
Promoting the activation of M2 microglia while simultaneously suppressing M1 microglia activation has been cited as a possible neuroprotectant strategy to aid during ischemic stroke [12, 13, 43, 25, 7] and has been the subject of several recent experimental studies [44, 45, 46, 50, 51, 47, 48, 49]. To simulate the effects of such neuroprotectant-based strategies on microglia activation, we modify Model (7) to include time-varying terms to inhibit the production of M1 microglia and bolster the production of M2 microglia cells.
In introducing these terms, we focus on analyzing the ratio of M1 to M2 microglia over a 72-hour window post stroke, which has been cited as an important time frame for treatment [12, 13, 16, 59, 47, 25, 10, 60]. Once being administered at a specified time during this window, we assume that the neuroprotectant will have a saturating effect on the activation of M1 and M2 microglial cells for 24 hours, after which the effects will diminish and activation will return to pre-treatment levels. We further assume that the neuroprotectant should be administered within 15 hours post stroke in order to extend the early dominance of the M2 phenotype over M1 seen in Model (7) for as long as possible before the number of M1 cells again dominates.
Based on these assumptions, we include the following two time-dependent terms:
| (19) |
which acts to inhibit M1 activation, and
| (20) |
which acts to promote M2 activation. Each term is a continuous piecewise sigmoidal function, where , , , and are constant parameters which control the shape of the respective sigmoid graphs, and is the onset time of simulated neuroprotectant-based treatment. Note that we account for a time delay of 5 hours in each sigmoid curve reaching its respective point of steepest decline or incline, and we shift the curves when by 38 hours in order to maintain continuity. These terms enter Model (7) as multiplicative factors, with multiplying the M1 activation term in (1) and multiplying the M2 activation term in (2). Corresponding parameter descriptions and nominal values are given in Table 2.
| Index | Parameter | Description | Nominal Value | Units |
|---|---|---|---|---|
| Minimum value of | unitless | |||
| Steepness of | unitless | |||
| Steepness of | unitless | |||
| Maximum value of | unitless | |||
| Time at which treatment is applied | hours |
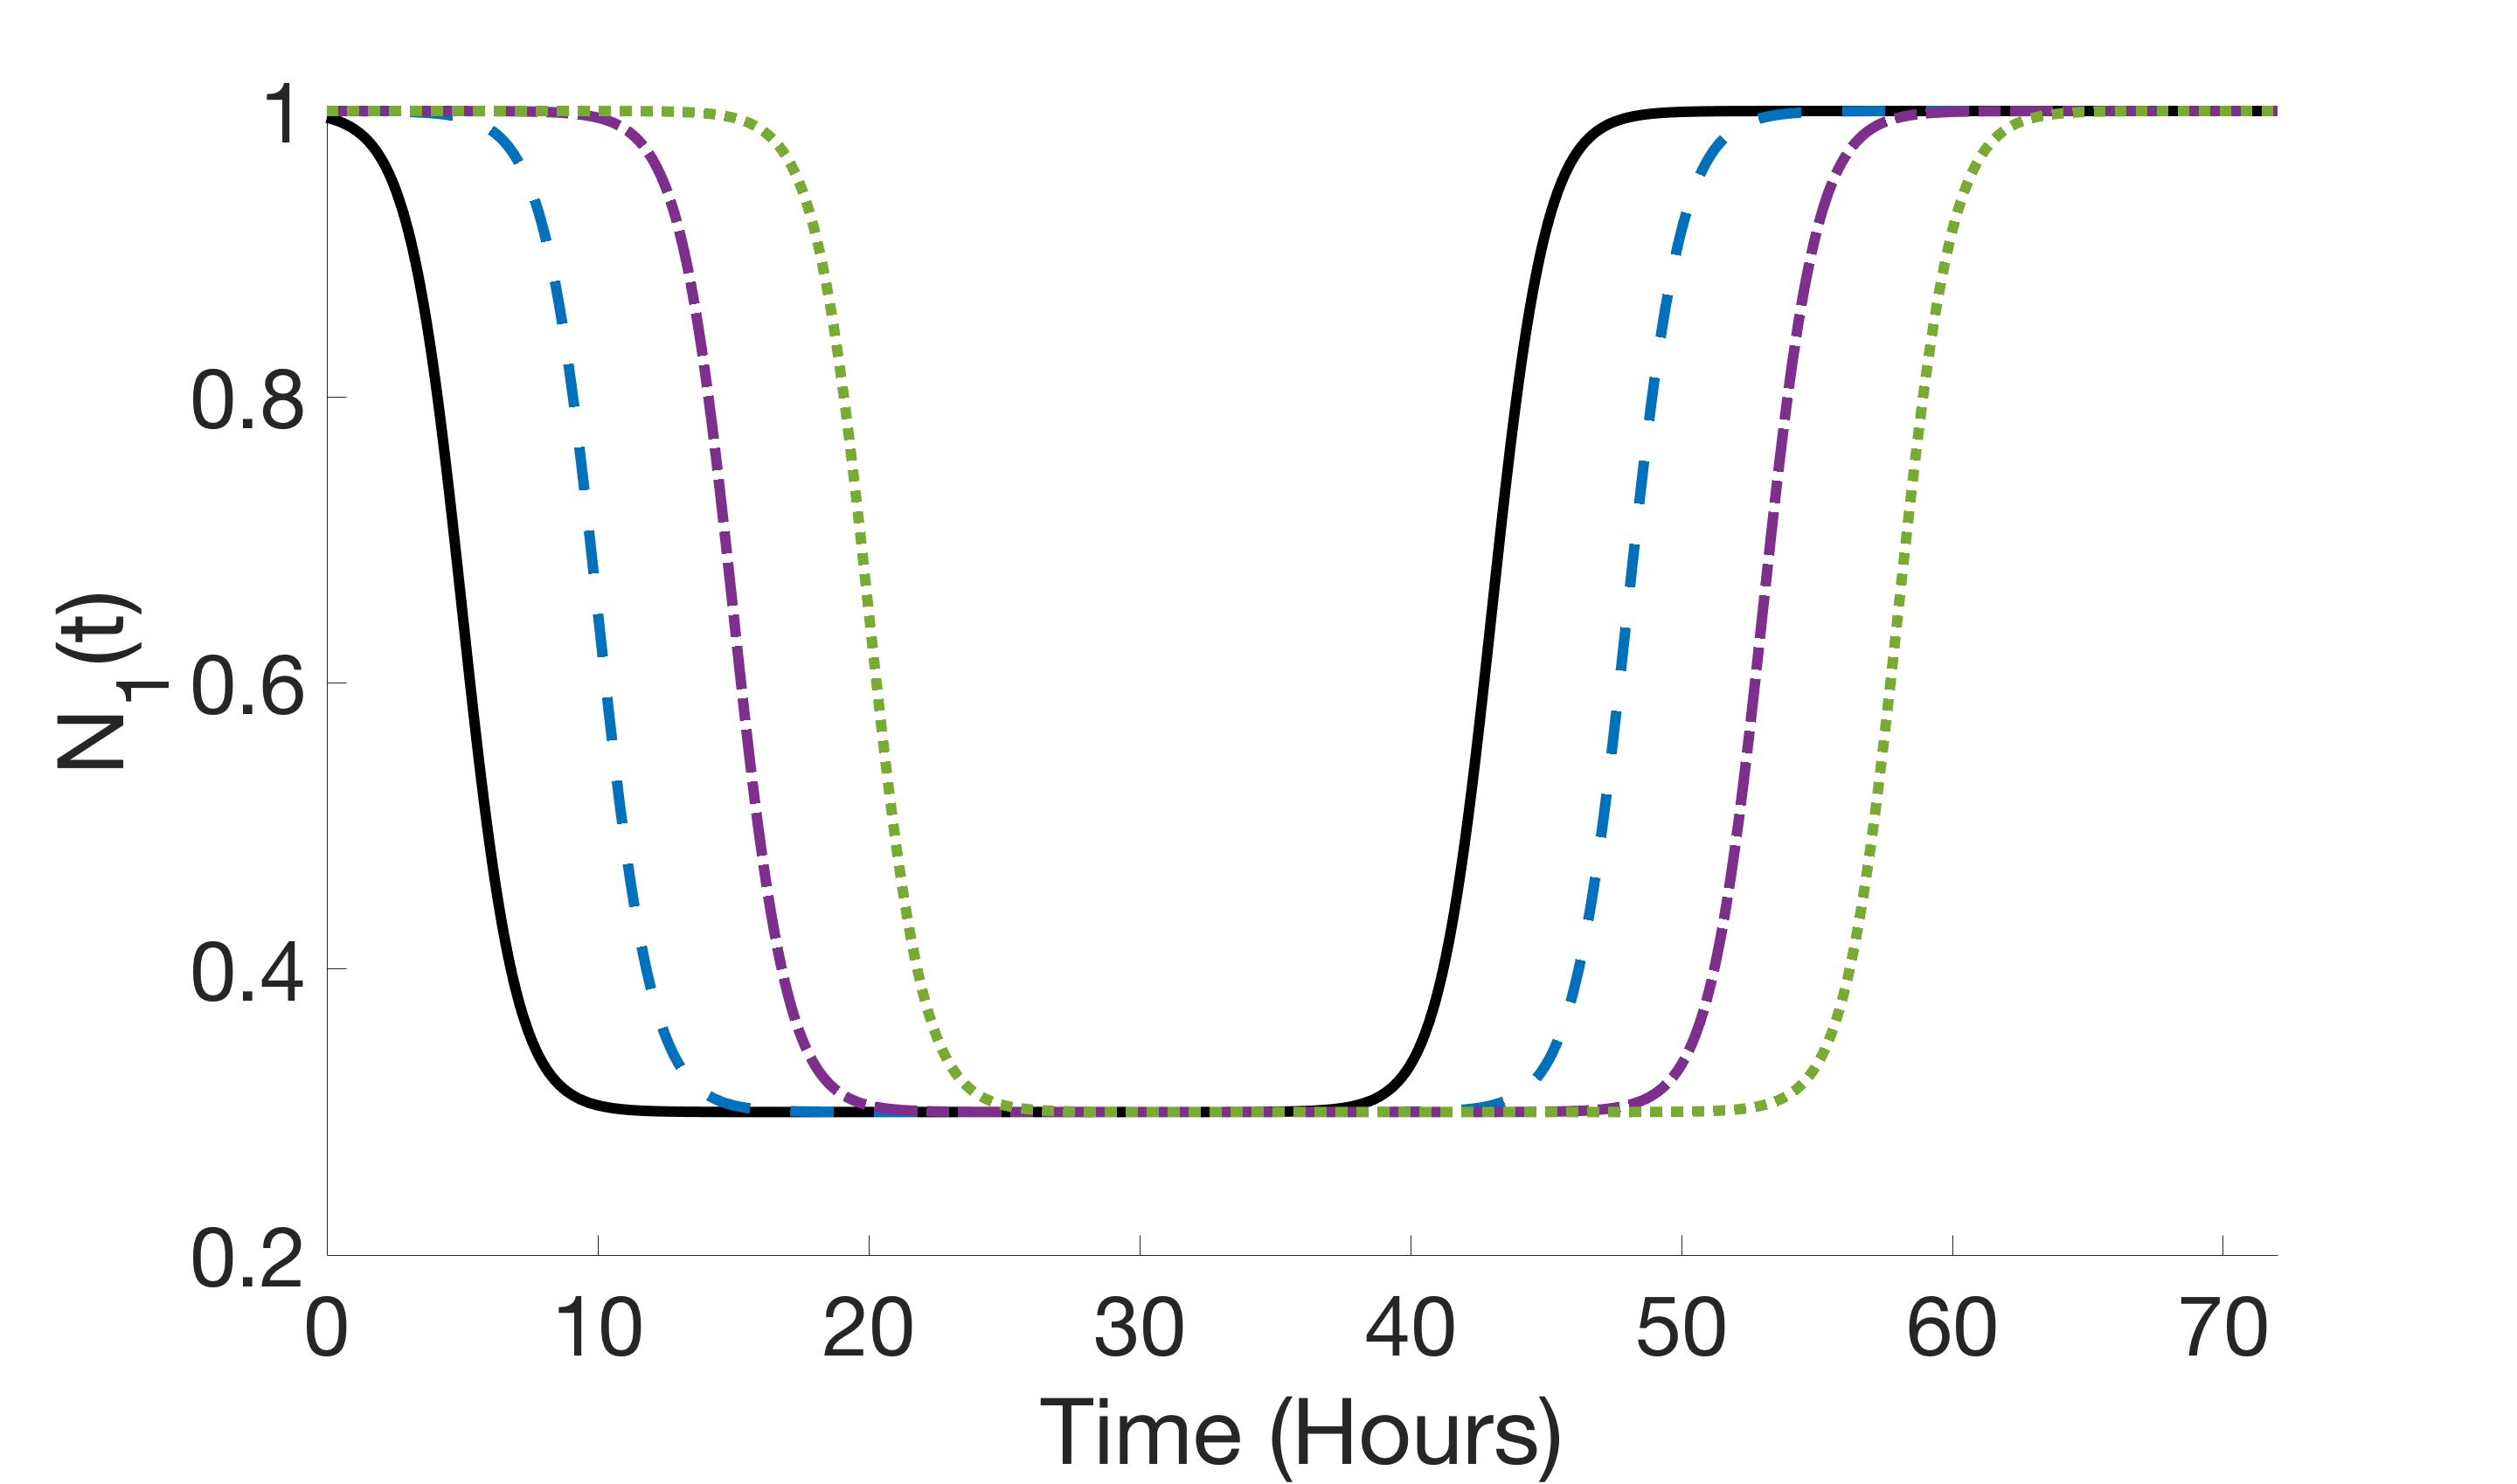
To inhibit the production of M1 microglial cells, has the form of a decreasing sigmoid curve until hours after the onset of treatment, where we assume that the effects of the neuroprotectant start to wear off. After hours post-treatment, becomes an increasing sigmoid curve until the M1 activation returns to pre-treatment level. The constant parameter is the minimum value of and represents how effective is in suppressing the activation of M1 cells. Note that if , would completely turn off the activation of resting microglia to the M1 phenotype. Figure 4(a) shows for onset times , 5, 10, and 15 hours.
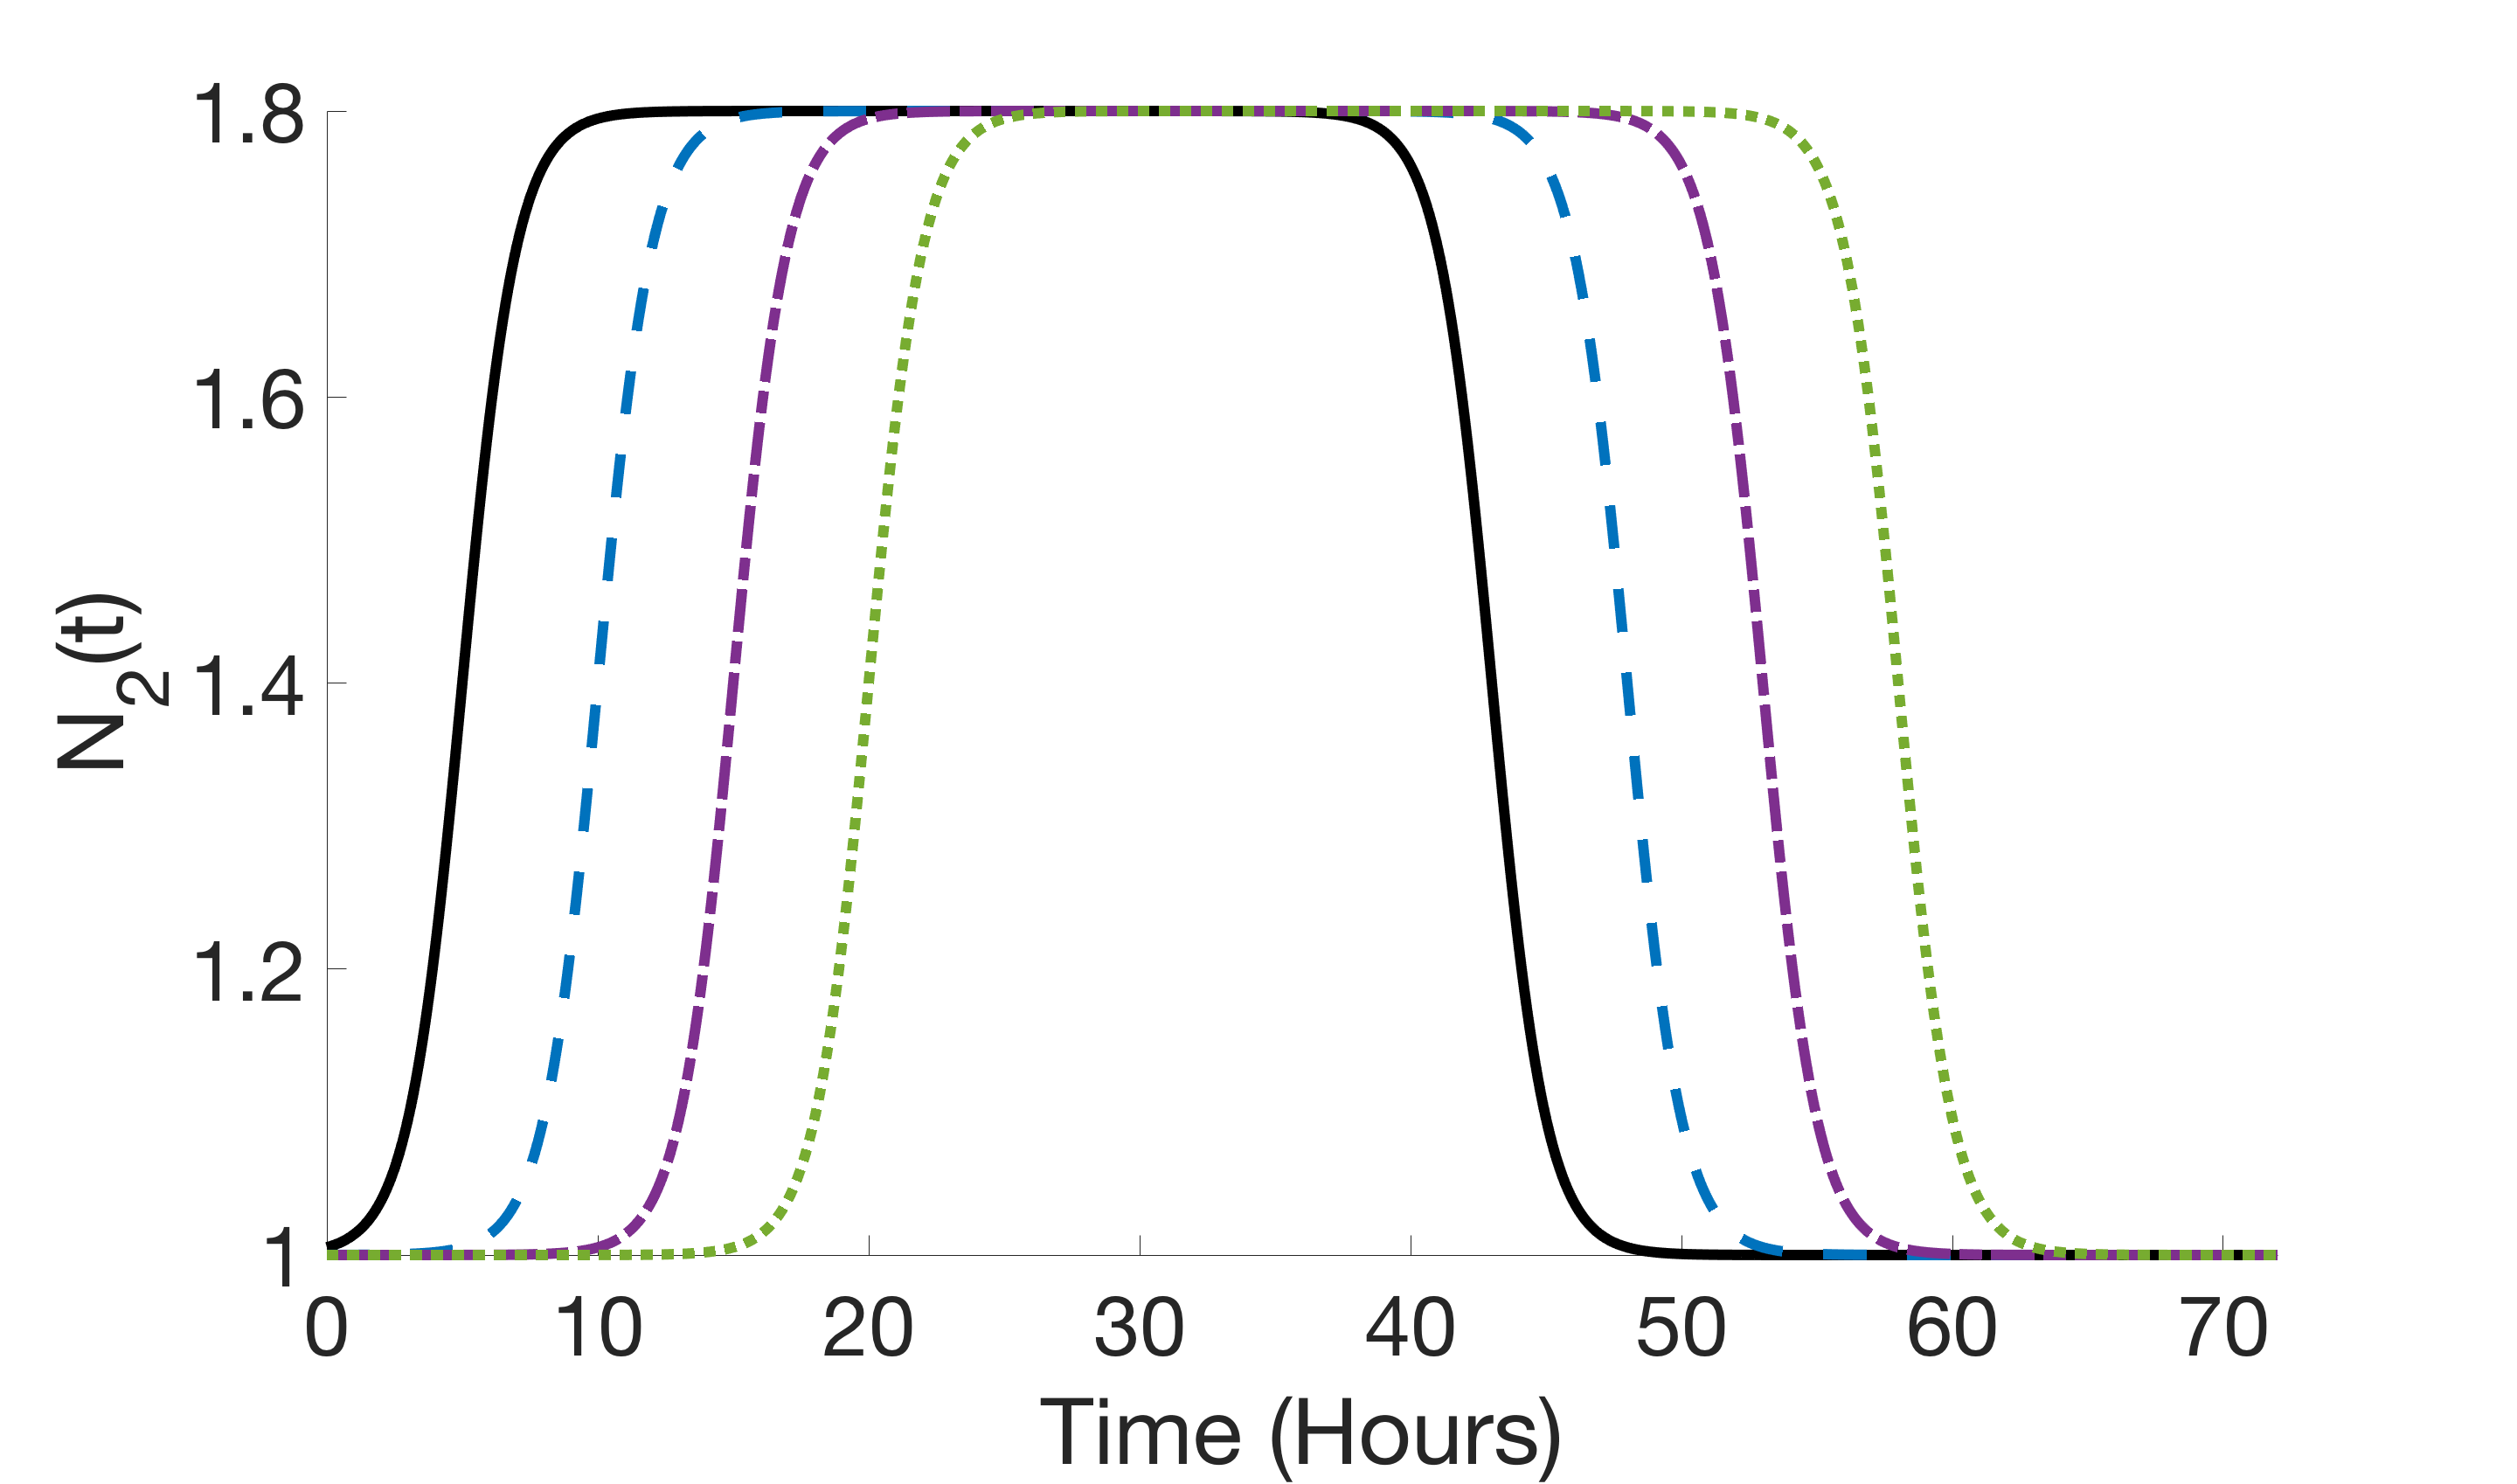
Conversely, to bolster the production of M2 microglia cells, has the form of an increasing sigmoid curve until hours after the onset of treatment, at which point we assume that the effects start to wear off. After hours post-treatment, transitions to a decreasing sigmoid curve until the M2 activation returns to pre-treatment level. The constant parameter is the maximum value of and represents how effective is in bolstering the activation of M2 cells. Note that if , would double the activation of resting microglia to the M2 phenotype. Figure 4(b) plots when , 5, 10, and 15 hours.
4.1 Modified Model Summary and Simulation Results
In summary, the modified model for suppressing the activation of the M1 phenotype and bolstering the activation of M2 microglia phenotype is given by the following system of equations:
| (21) |
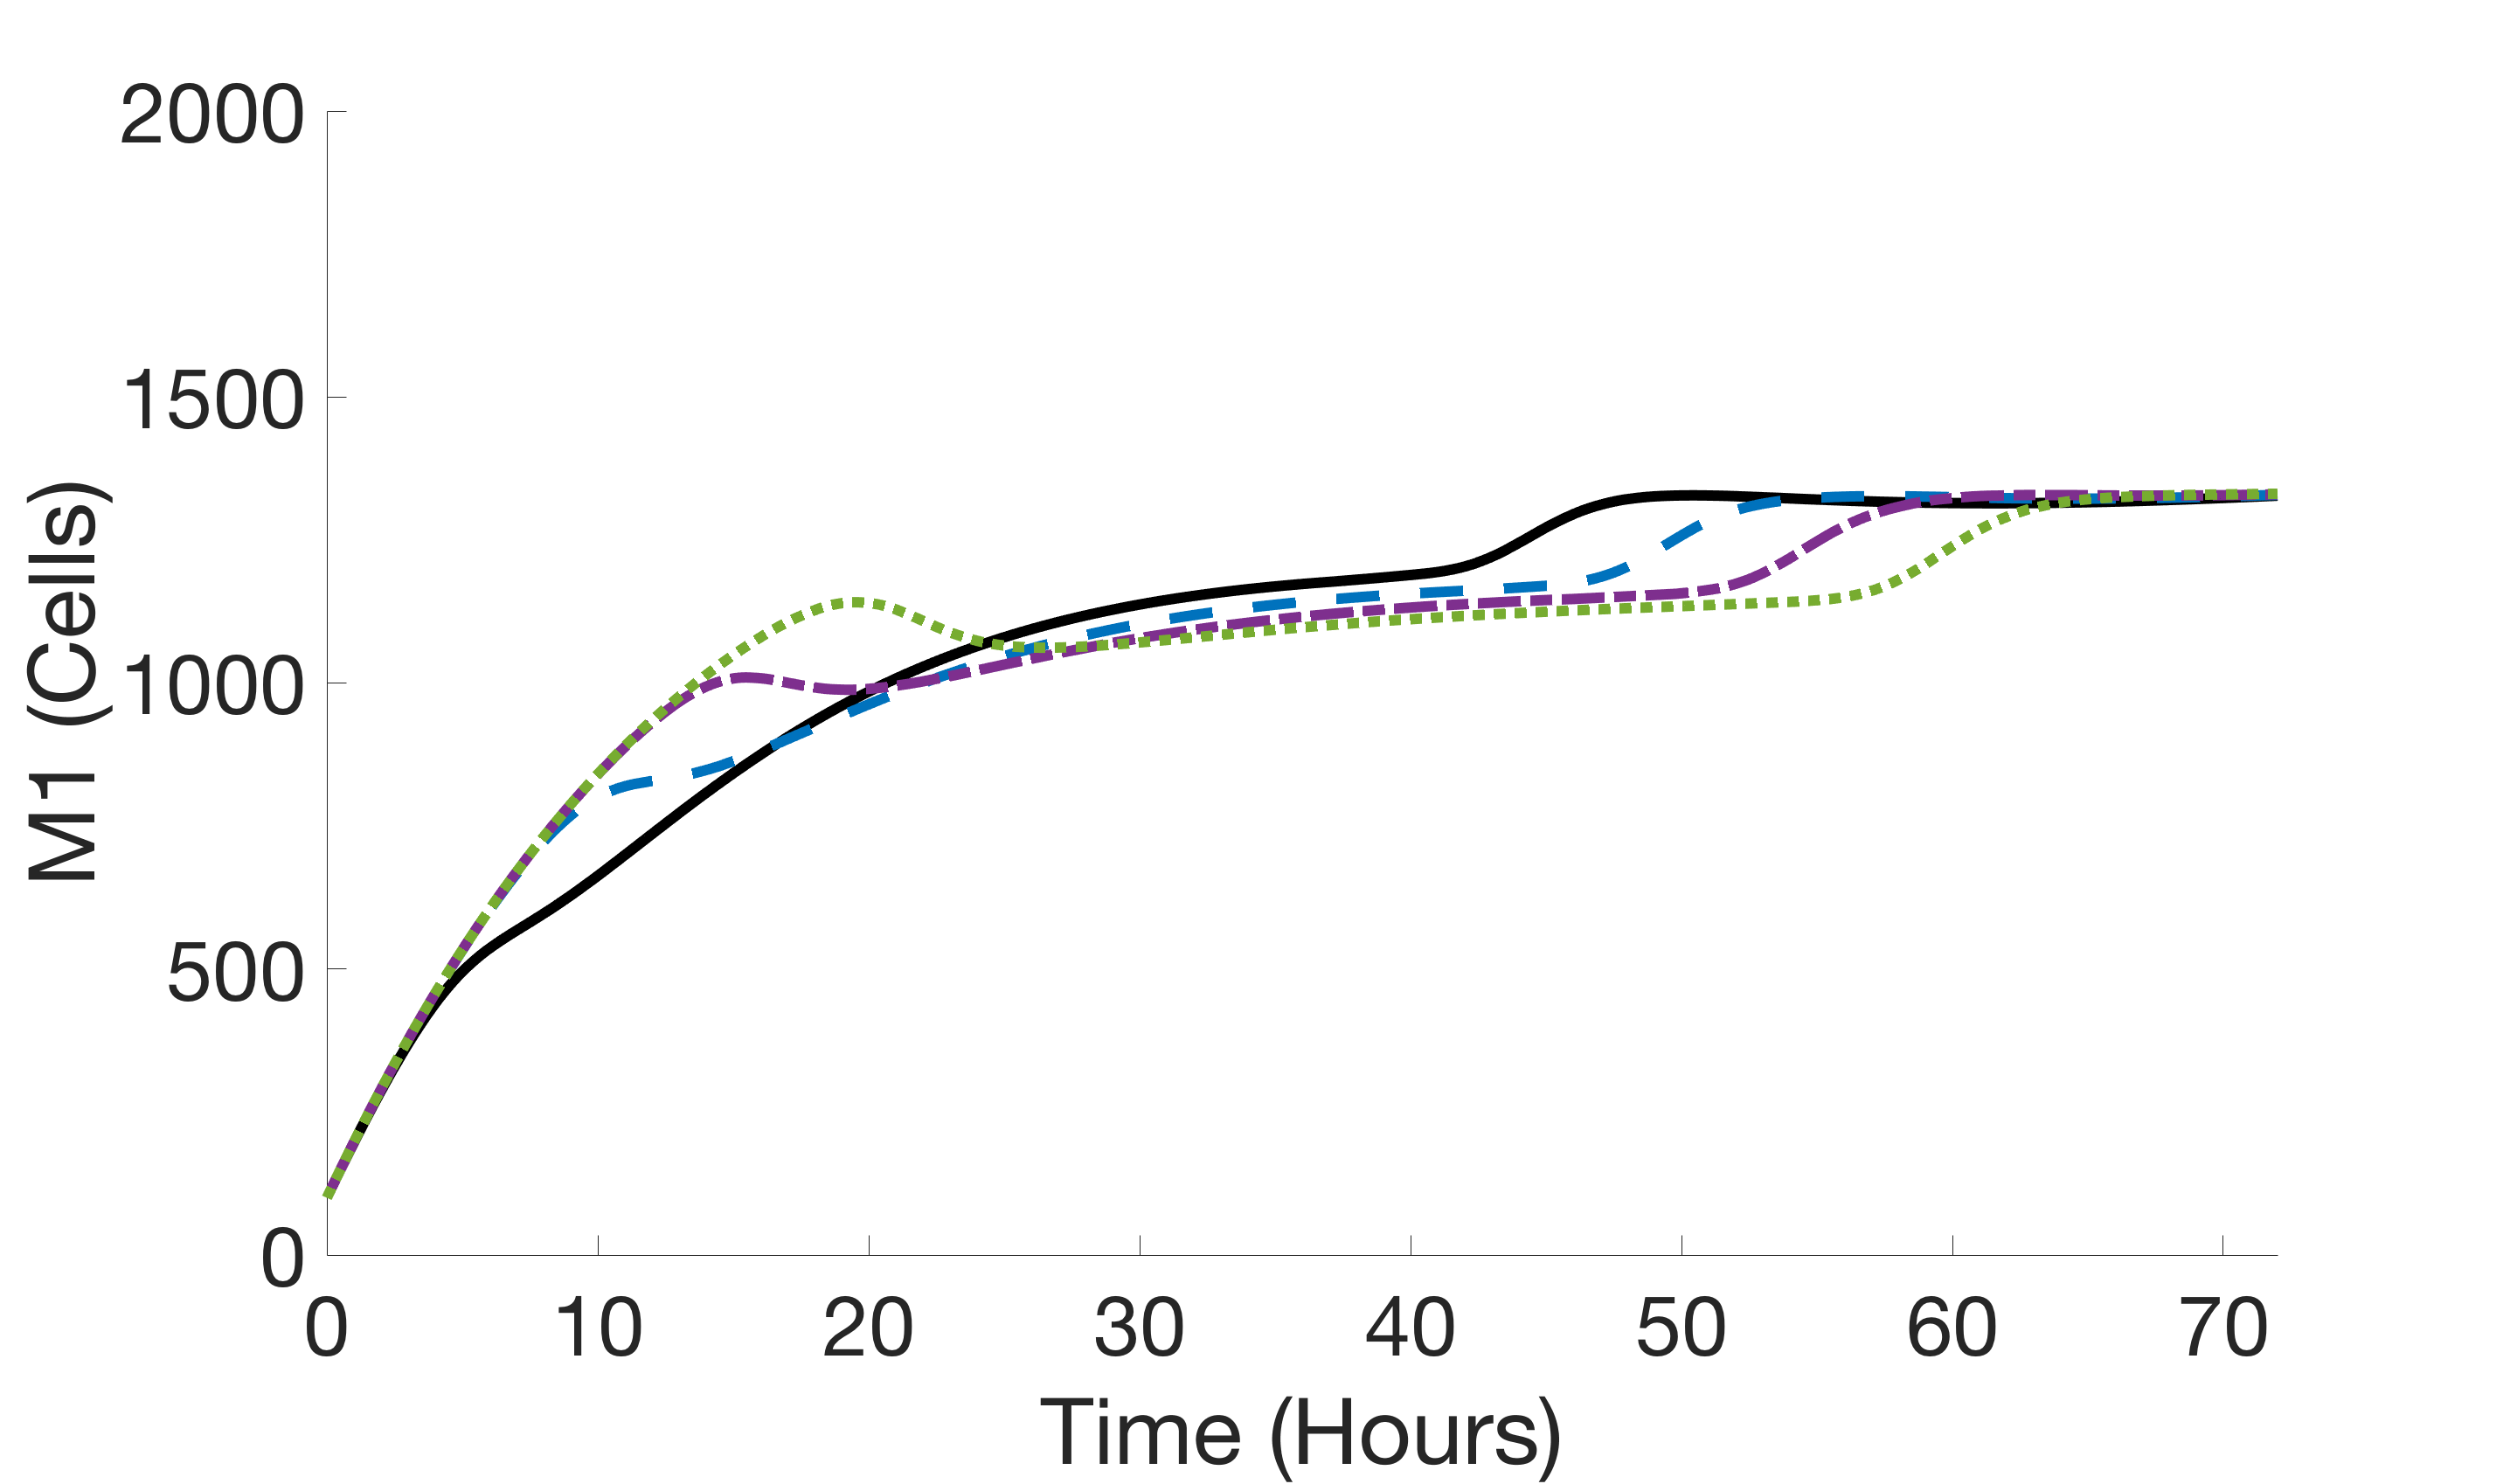
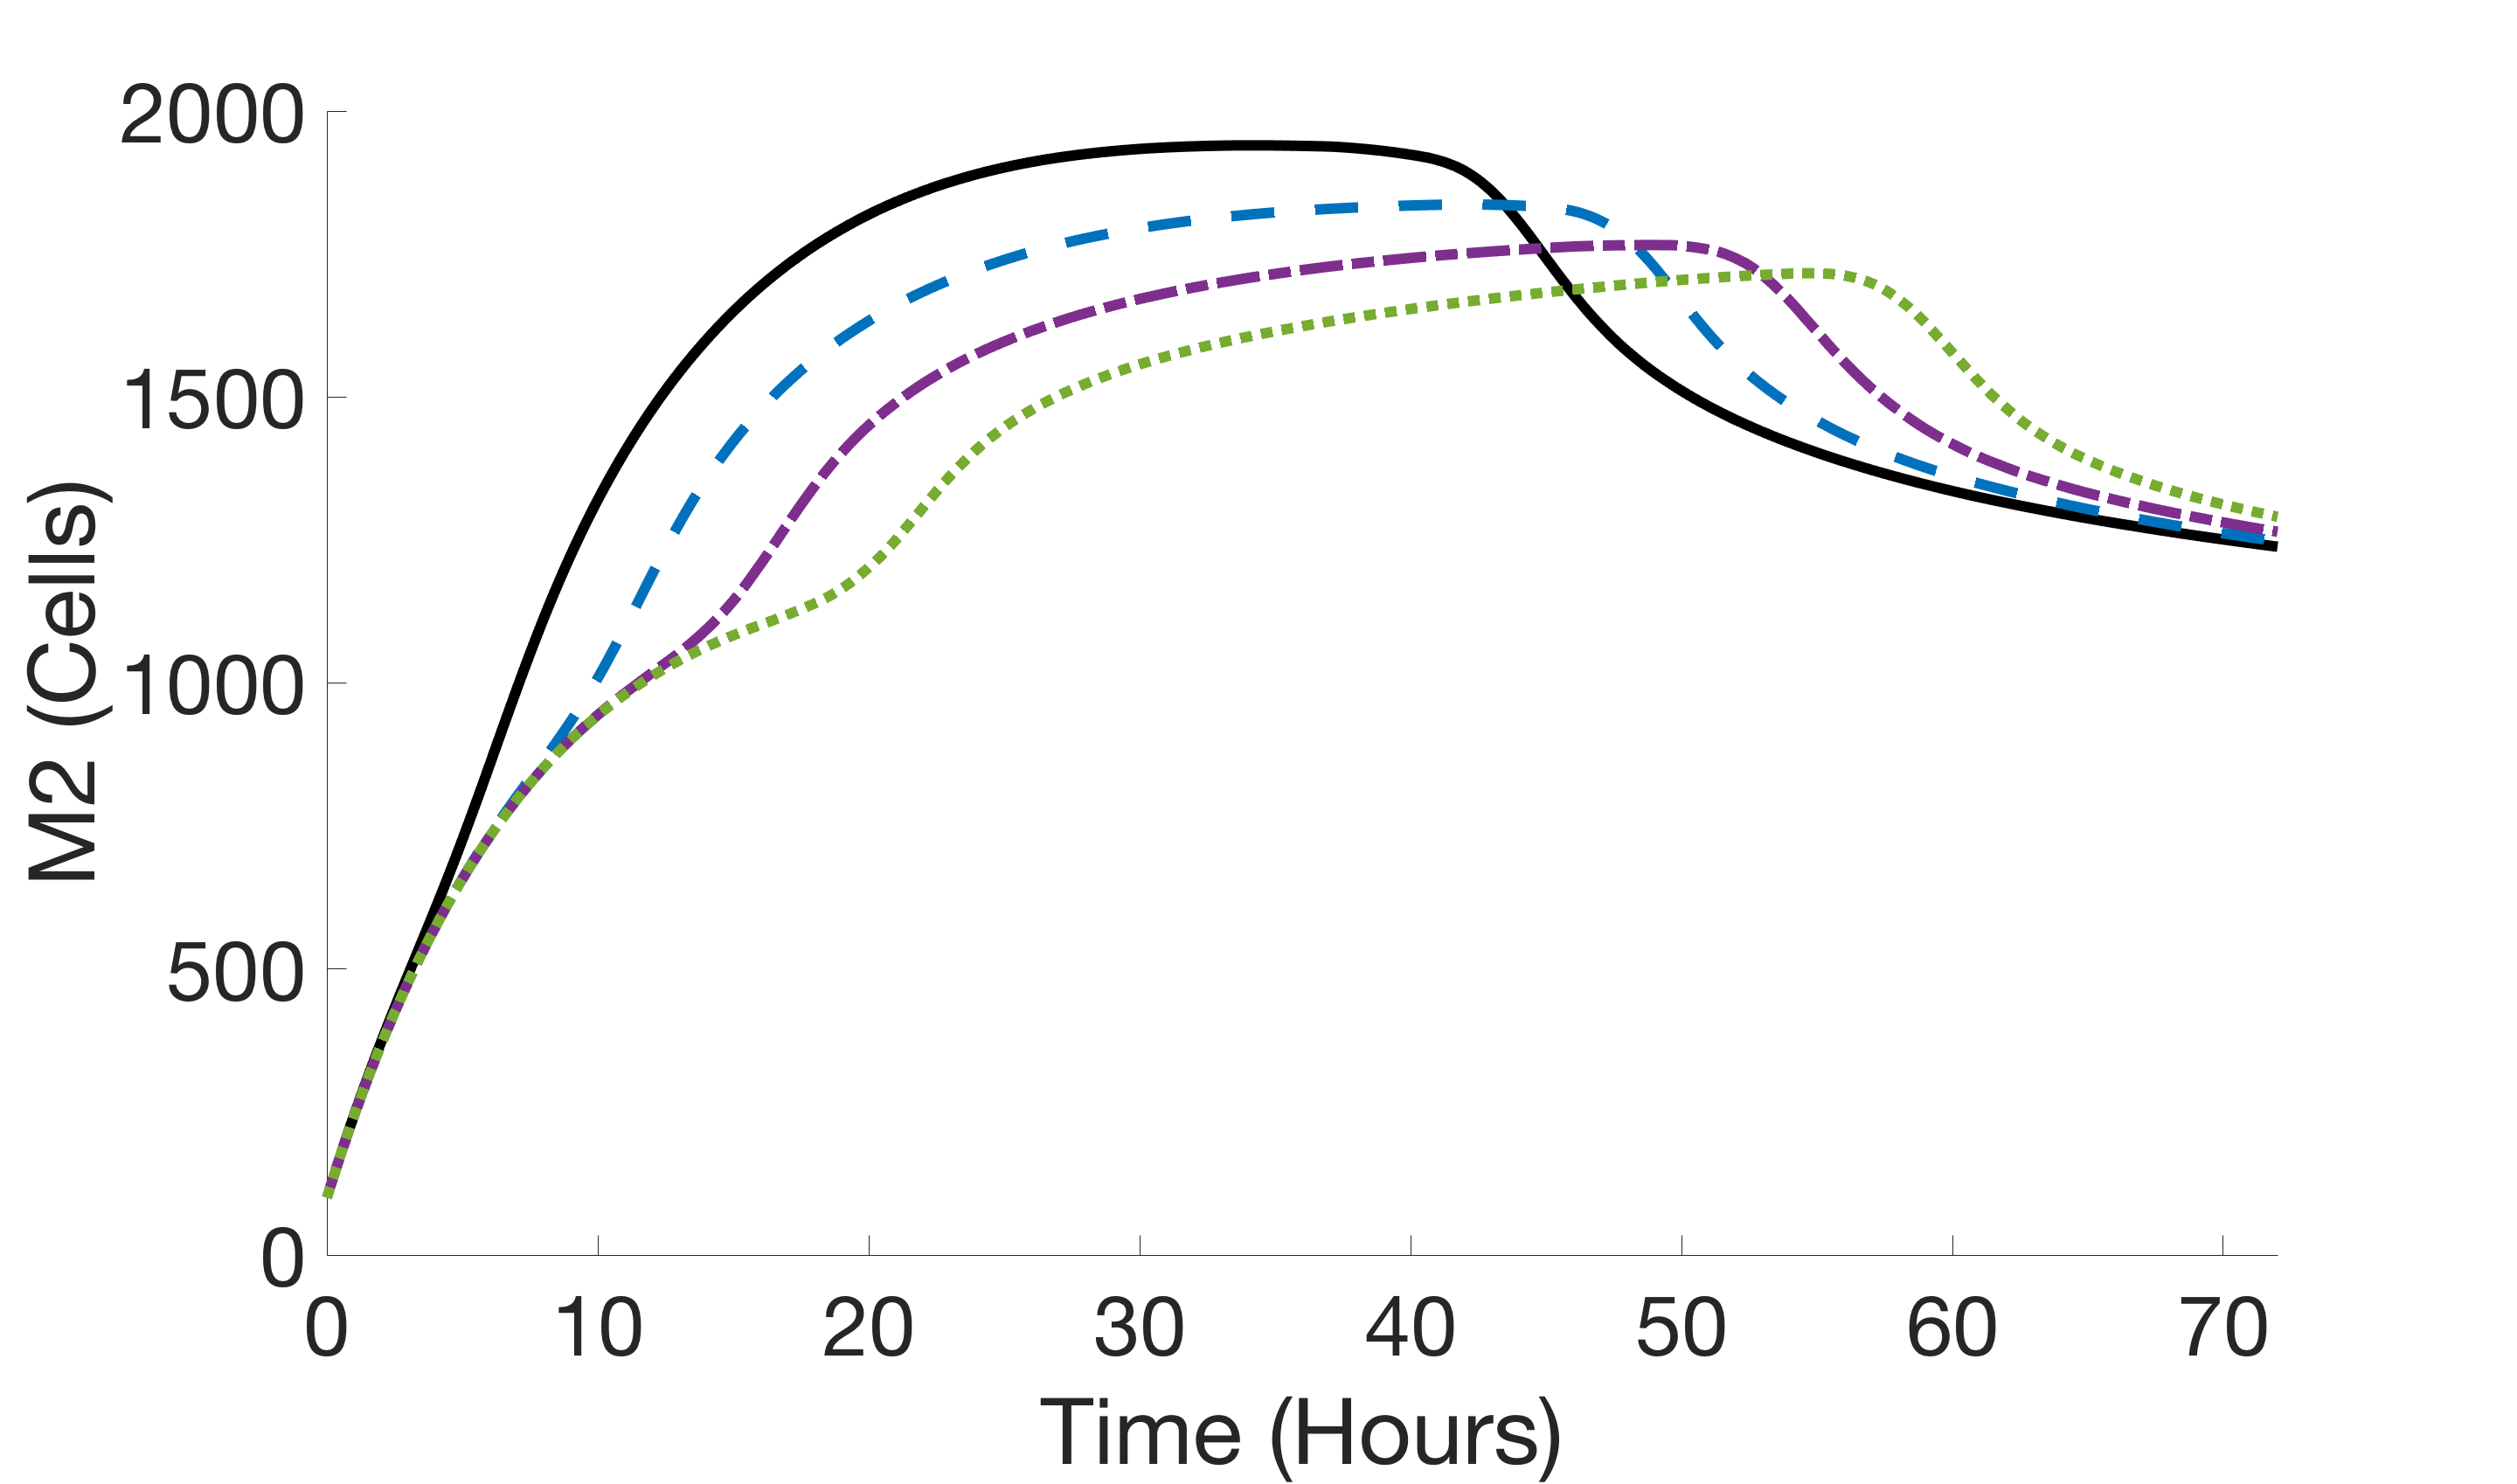
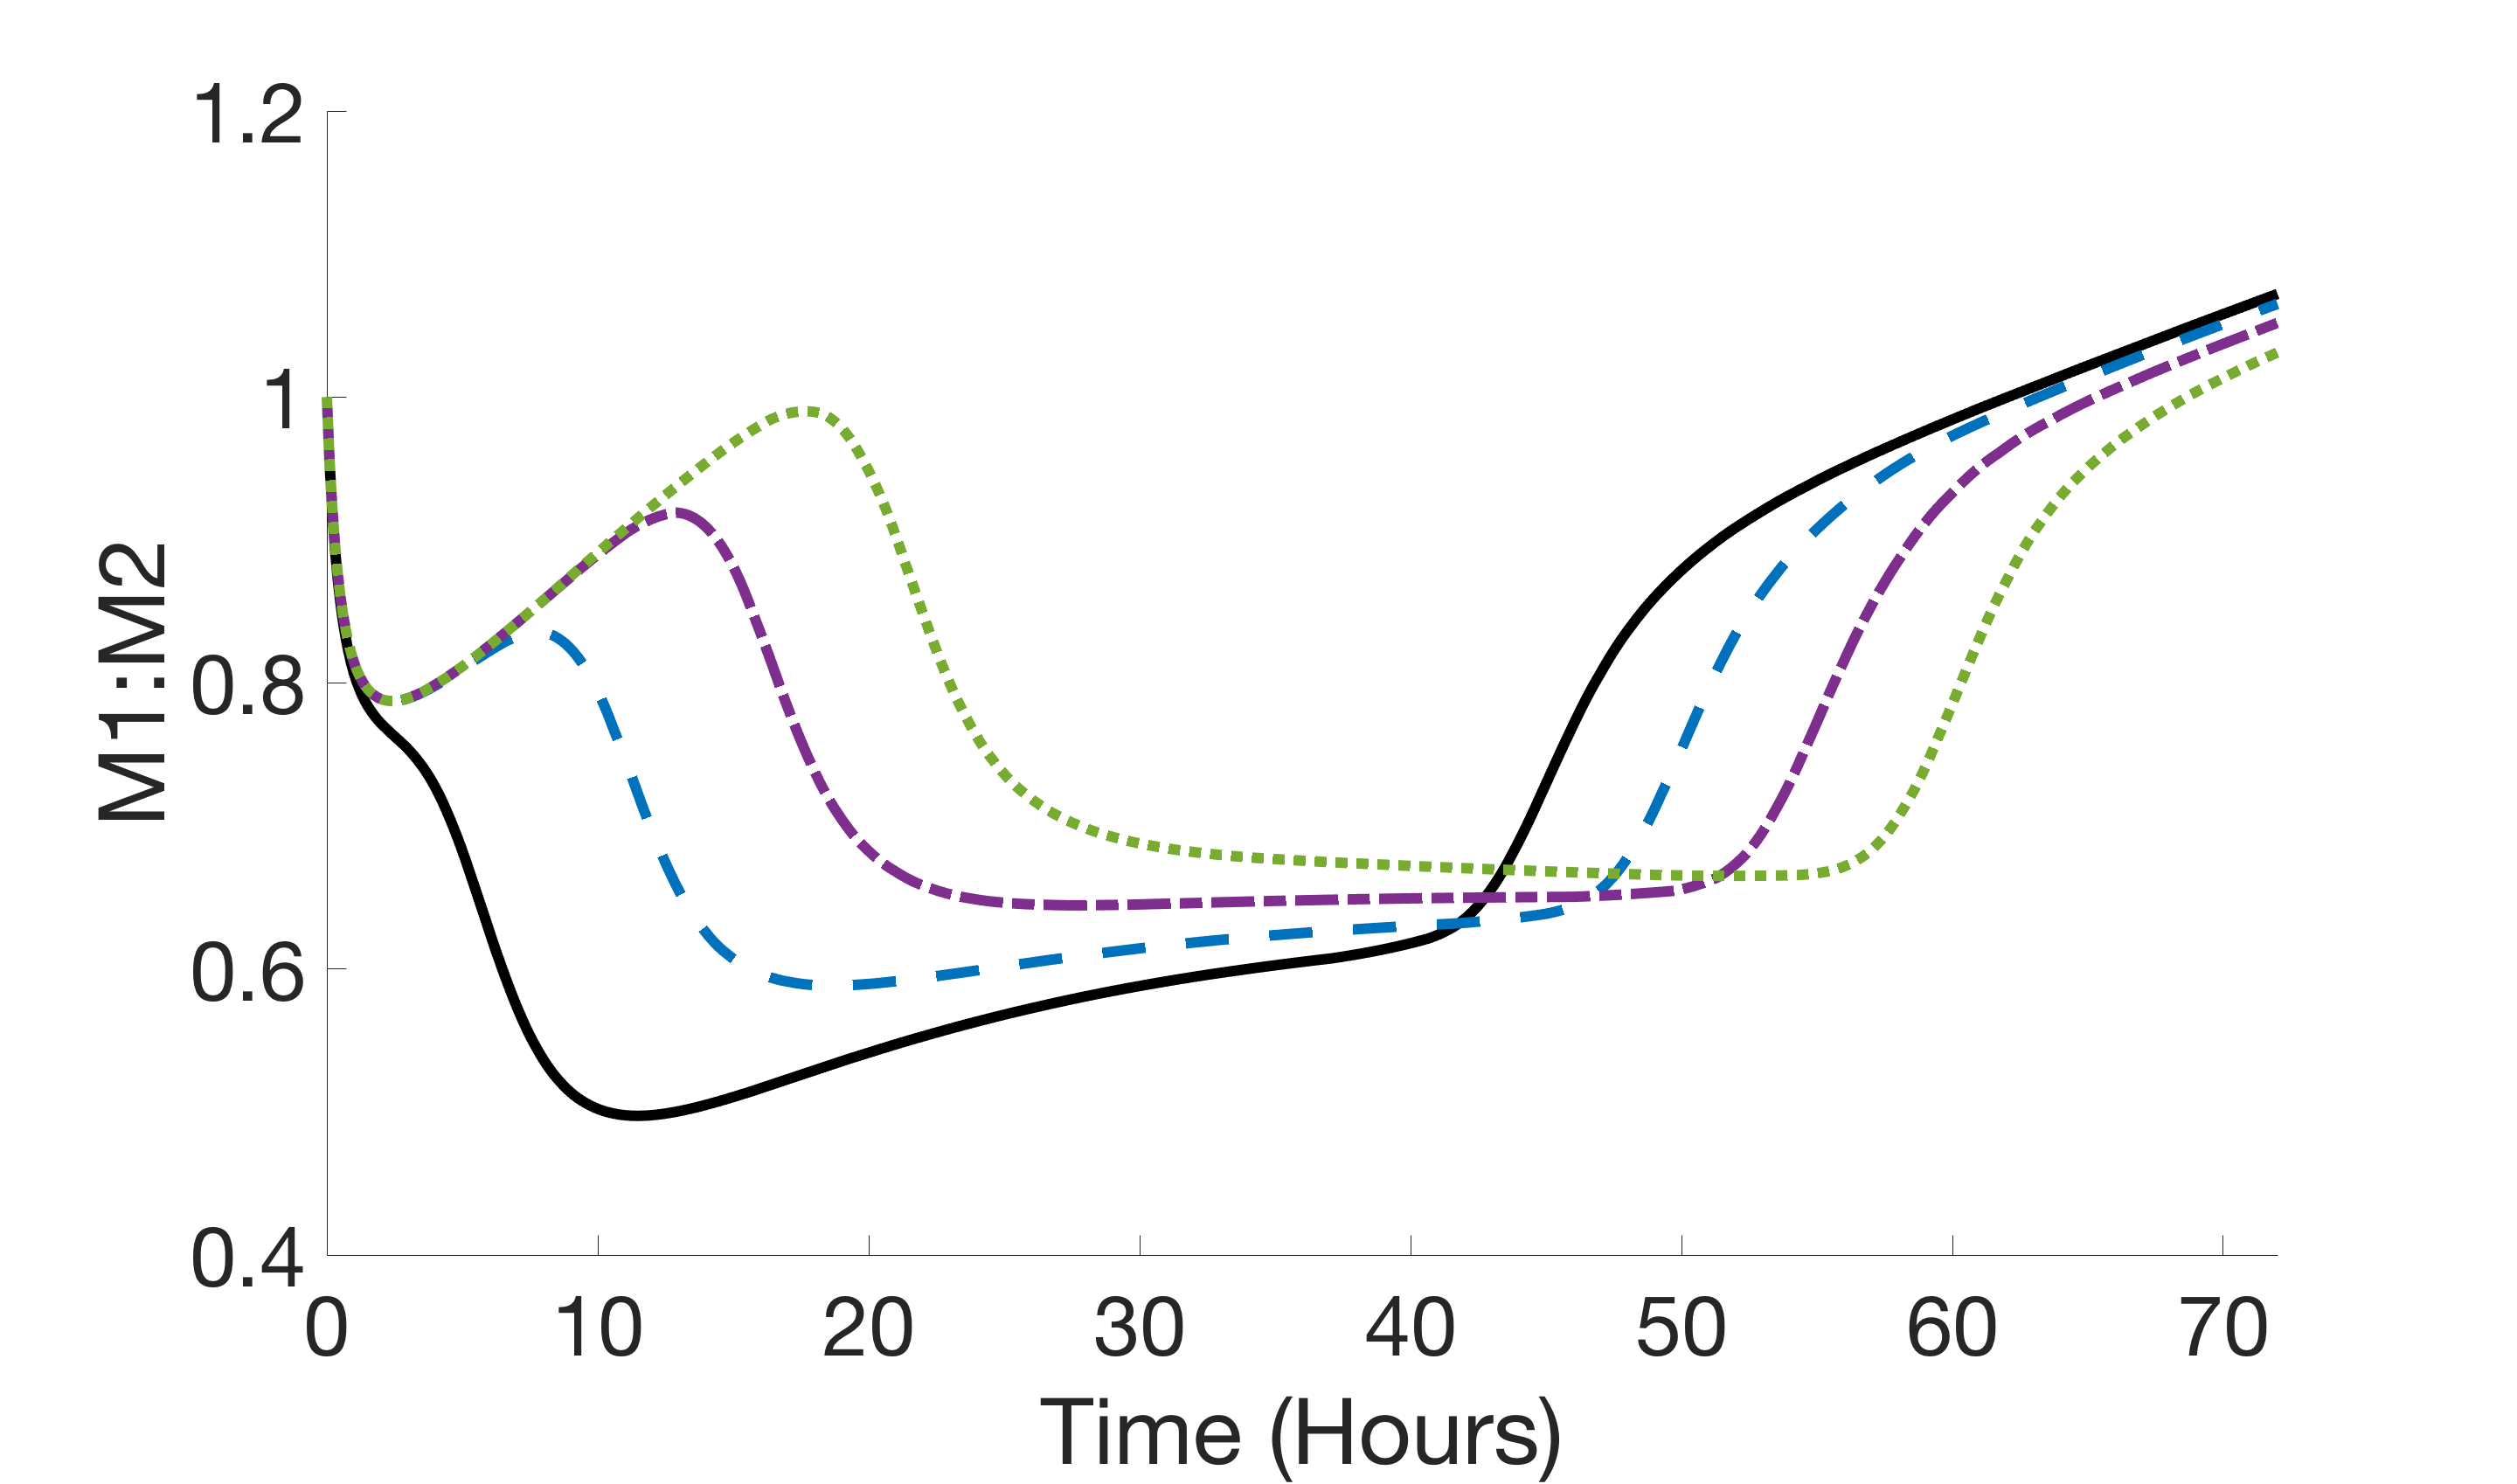
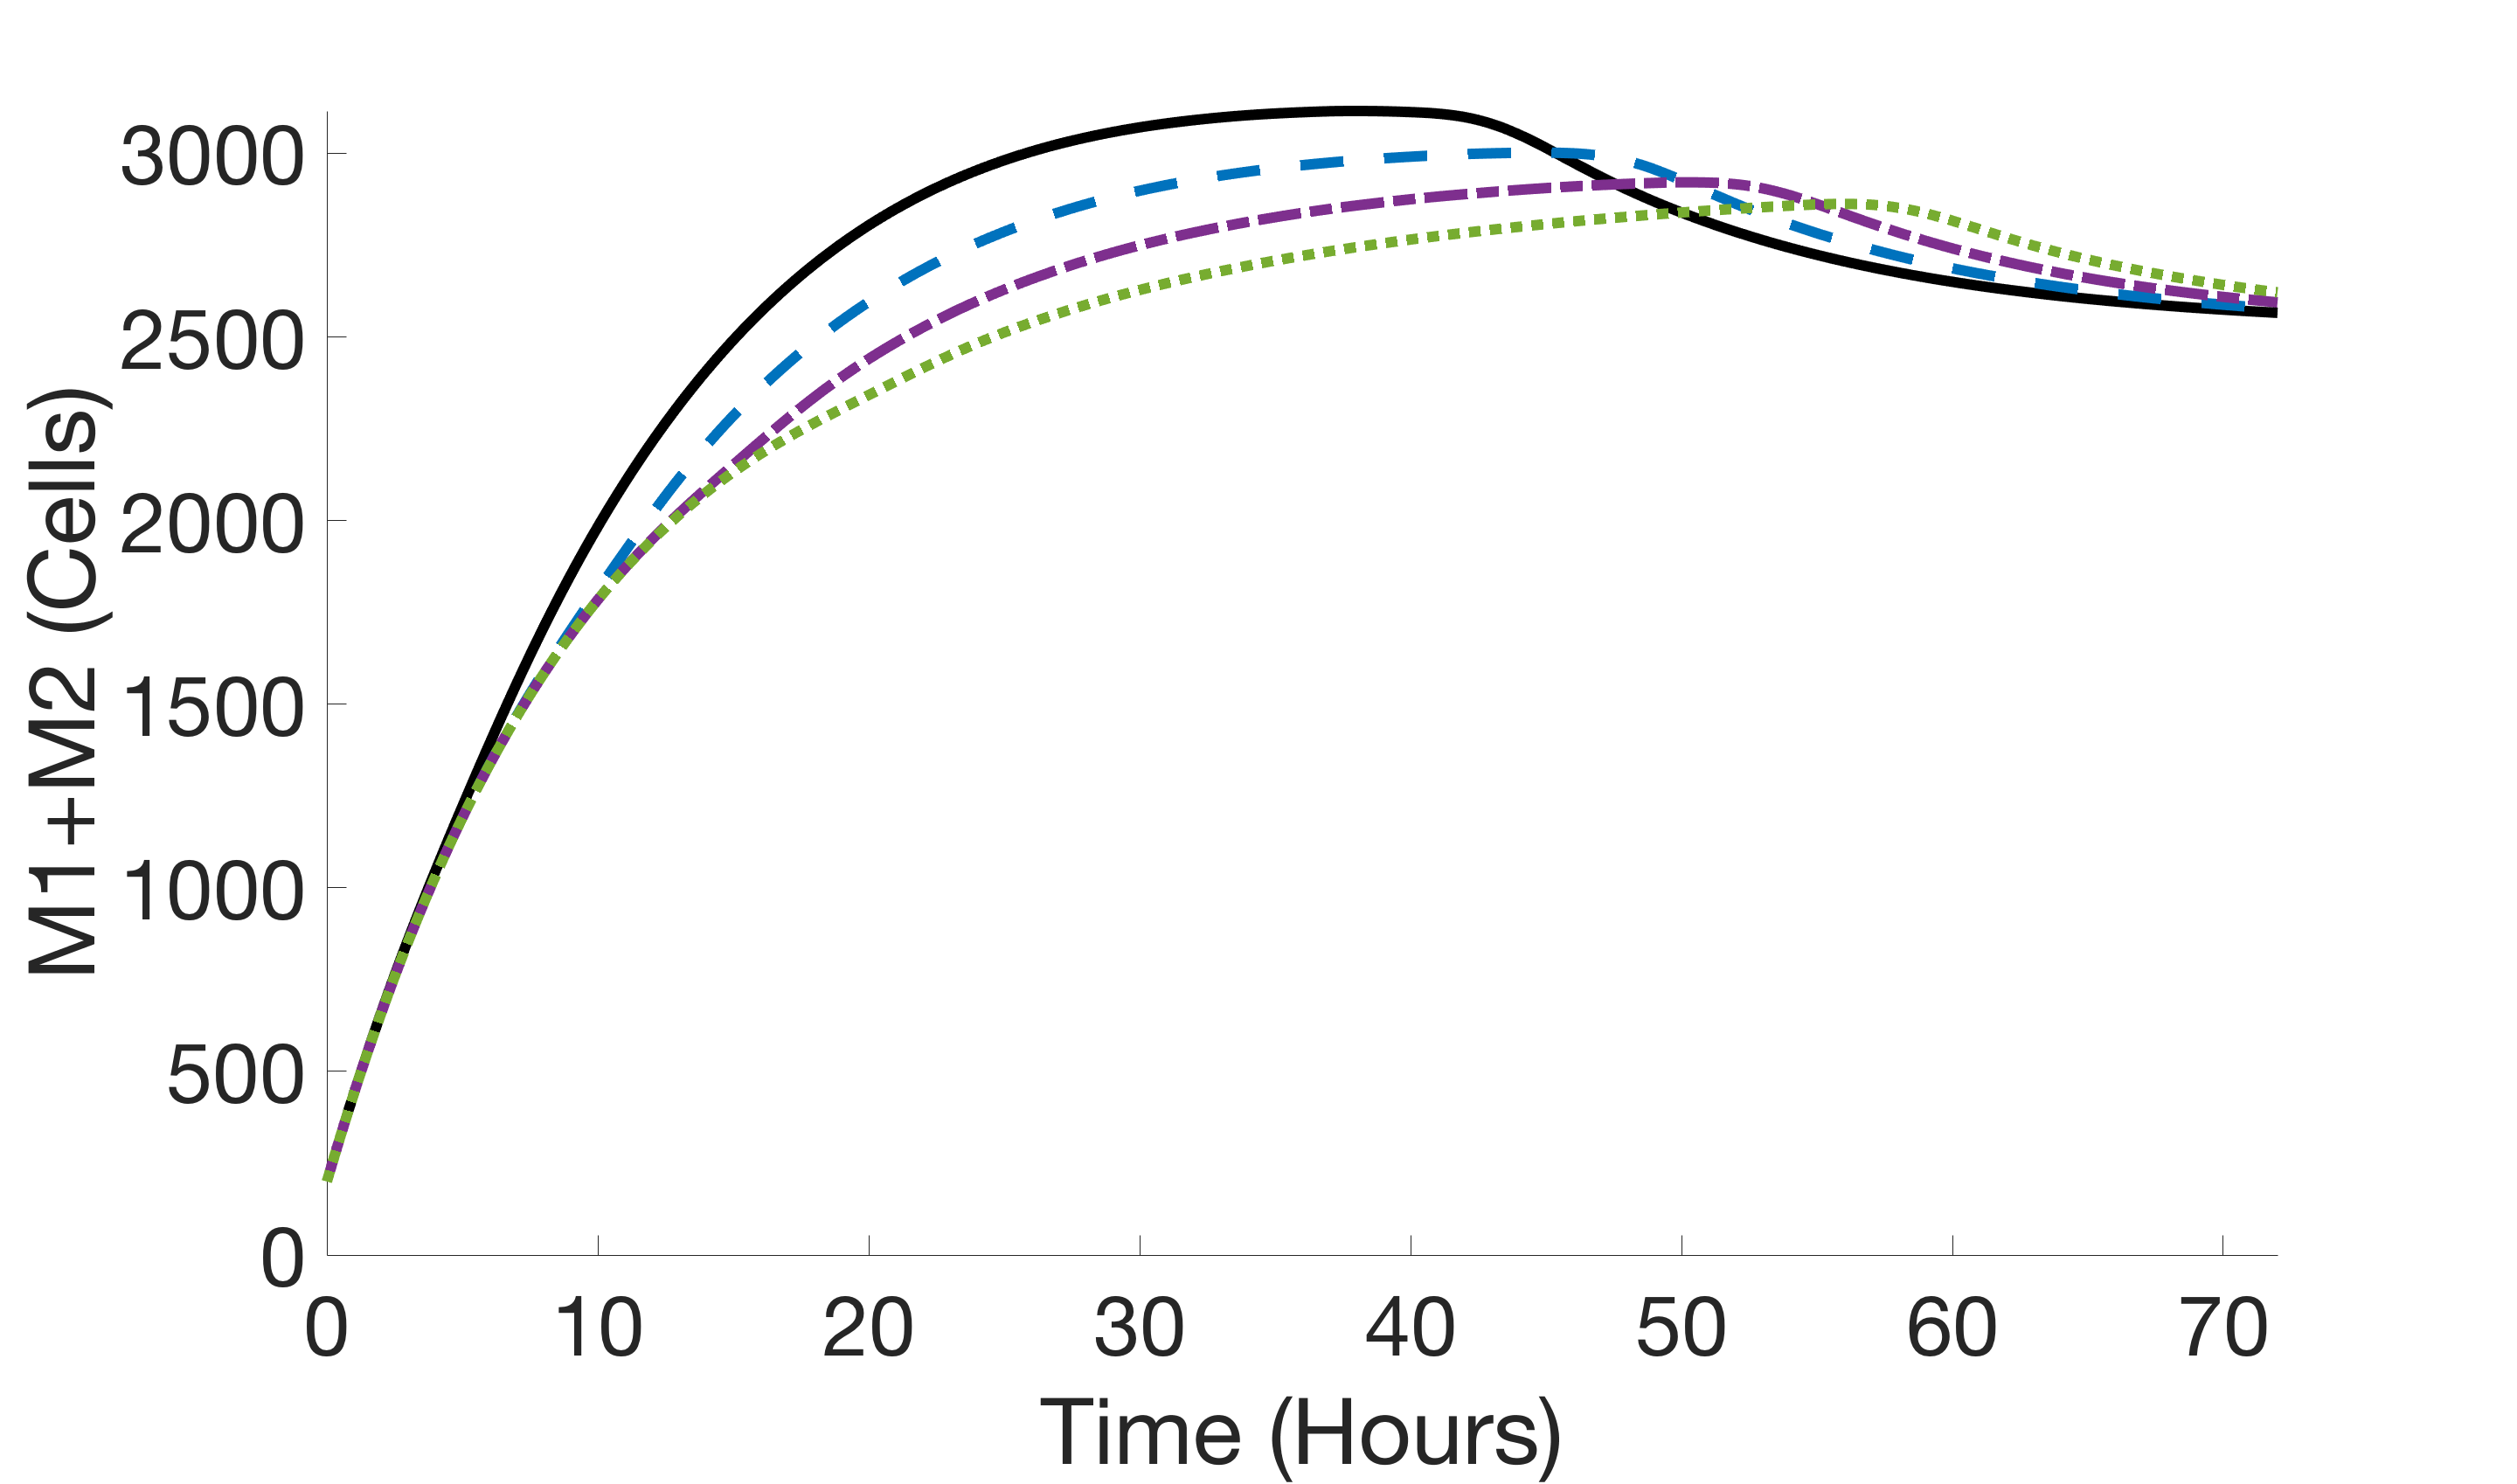
Figure 4 plots the neuroprotectant terms and over hours when the simulated treatment is administered at , 5, 10, and 15 hours, along with the corresponding plots of M1 and M2 cells, the ratio of M1 to M2 microglia, and total activated microglia resulting from Model (21). Note that in the presence of the neuroprotectant terms, the ratio of M1 to M2 microglia remains under one until around hours regardless of treatment onset time. Applying the neuroprotectant terms right away (i.e., ) results in the lowest ratio of M1 to M2 microglia. This minimum occurs at hours and is about , indicating that, at this time, there are around twice as many M2 microglial cells as there are M1. After this minimum is achieved, the ratio of microglial cells increases and ends at hours with the highest ratio of all the onset times considered. For the other onset times shown, a slightly different behavior is observed: The ratios increase prior to treatment onset and then decrease less drastically and level off. Ratios then increase and, by the end of the 72 hour period, all end up around one on an upward trend.
While not shown here, we note that onset times past the 15 hour mark (i.e., ) yield a similar behavior seen in Figure 4(e) when , 10, and 15 hours; however, the ratio of M1 to M2 microglial cells no longer stays under one prior to the simulated treatment onset. Instead, the ratios when increase prior to the onset time, reach a maximum ratio greater than one, and then decrease and level off. When the effects of the neuroprotectant begin to wear off, the ratios increase and end on an upward trend.

4.2 Sensitivity Analysis of Modified Model
We perform a similar sensitivity analysis on the modified model in (21), utilizing both the Morris and Sobol methods described in Section 3 to quantify how uncertainty and variability in model output can be attributed to uncertainties in the inputs when adding in the neuroprotectant terms. As before, we consider as scalar response variables the ratio of the M1 to M2 microglia as in (9) and the total activated microglia as in (10).
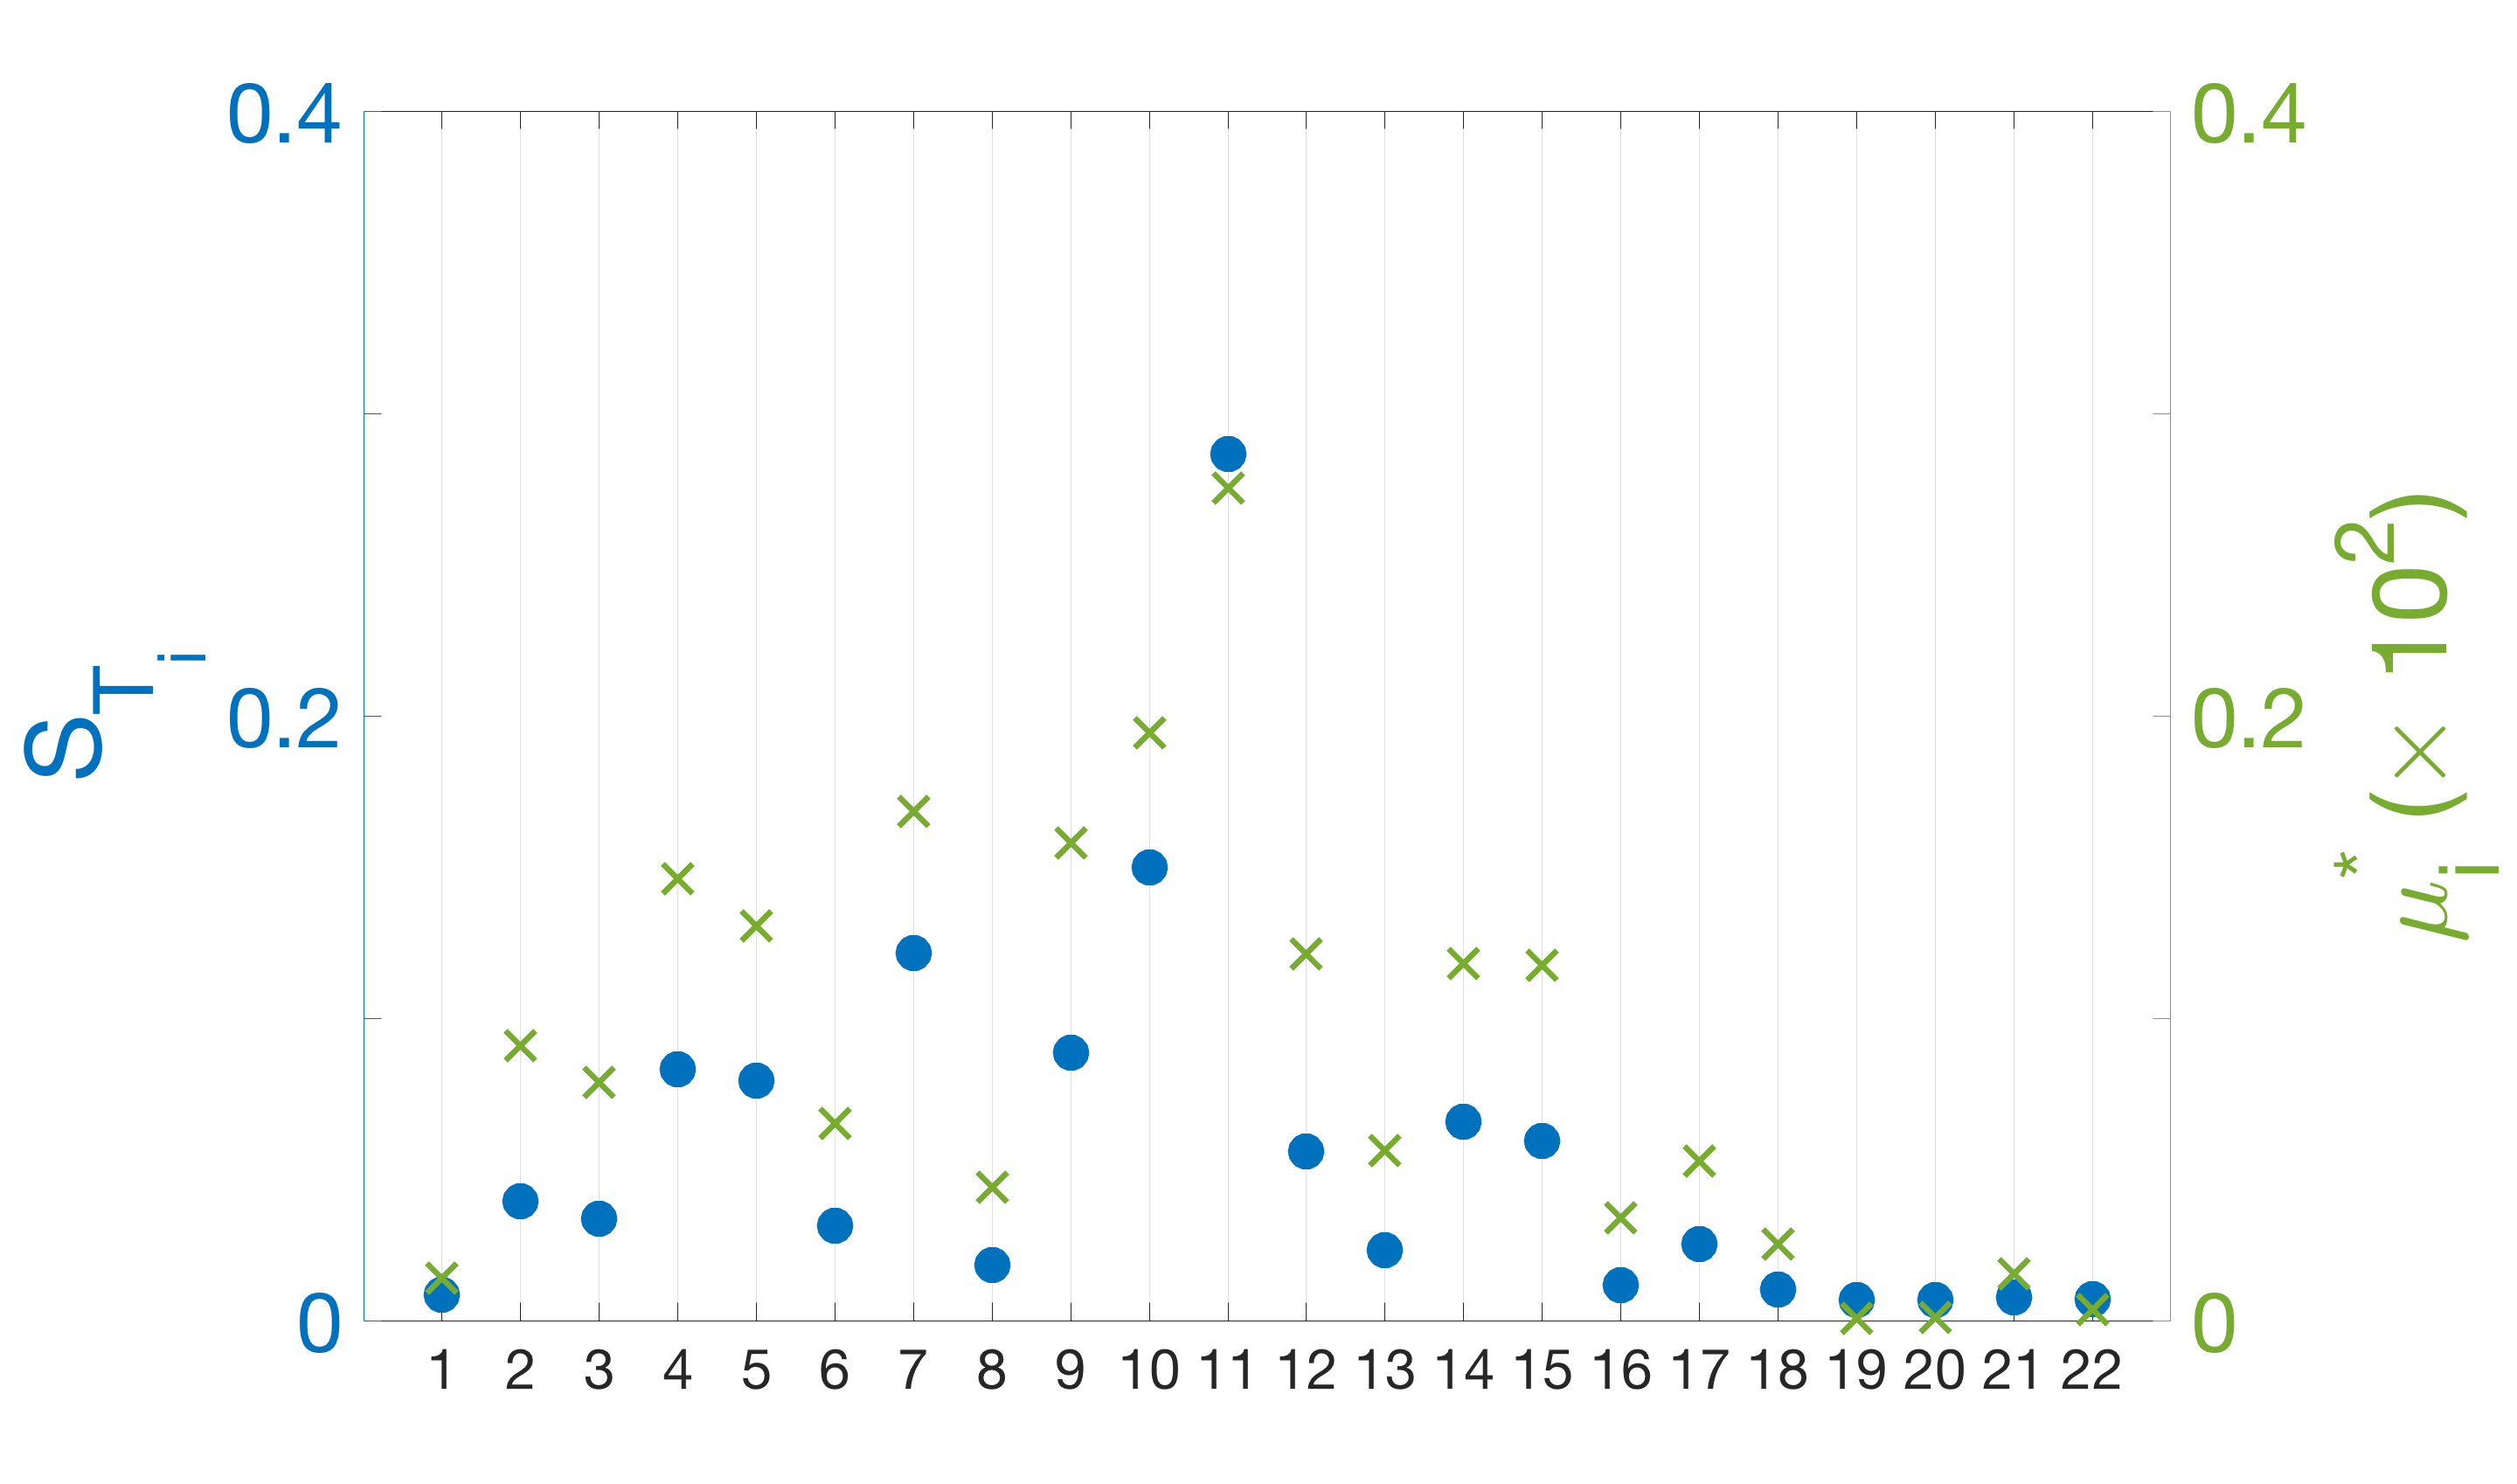
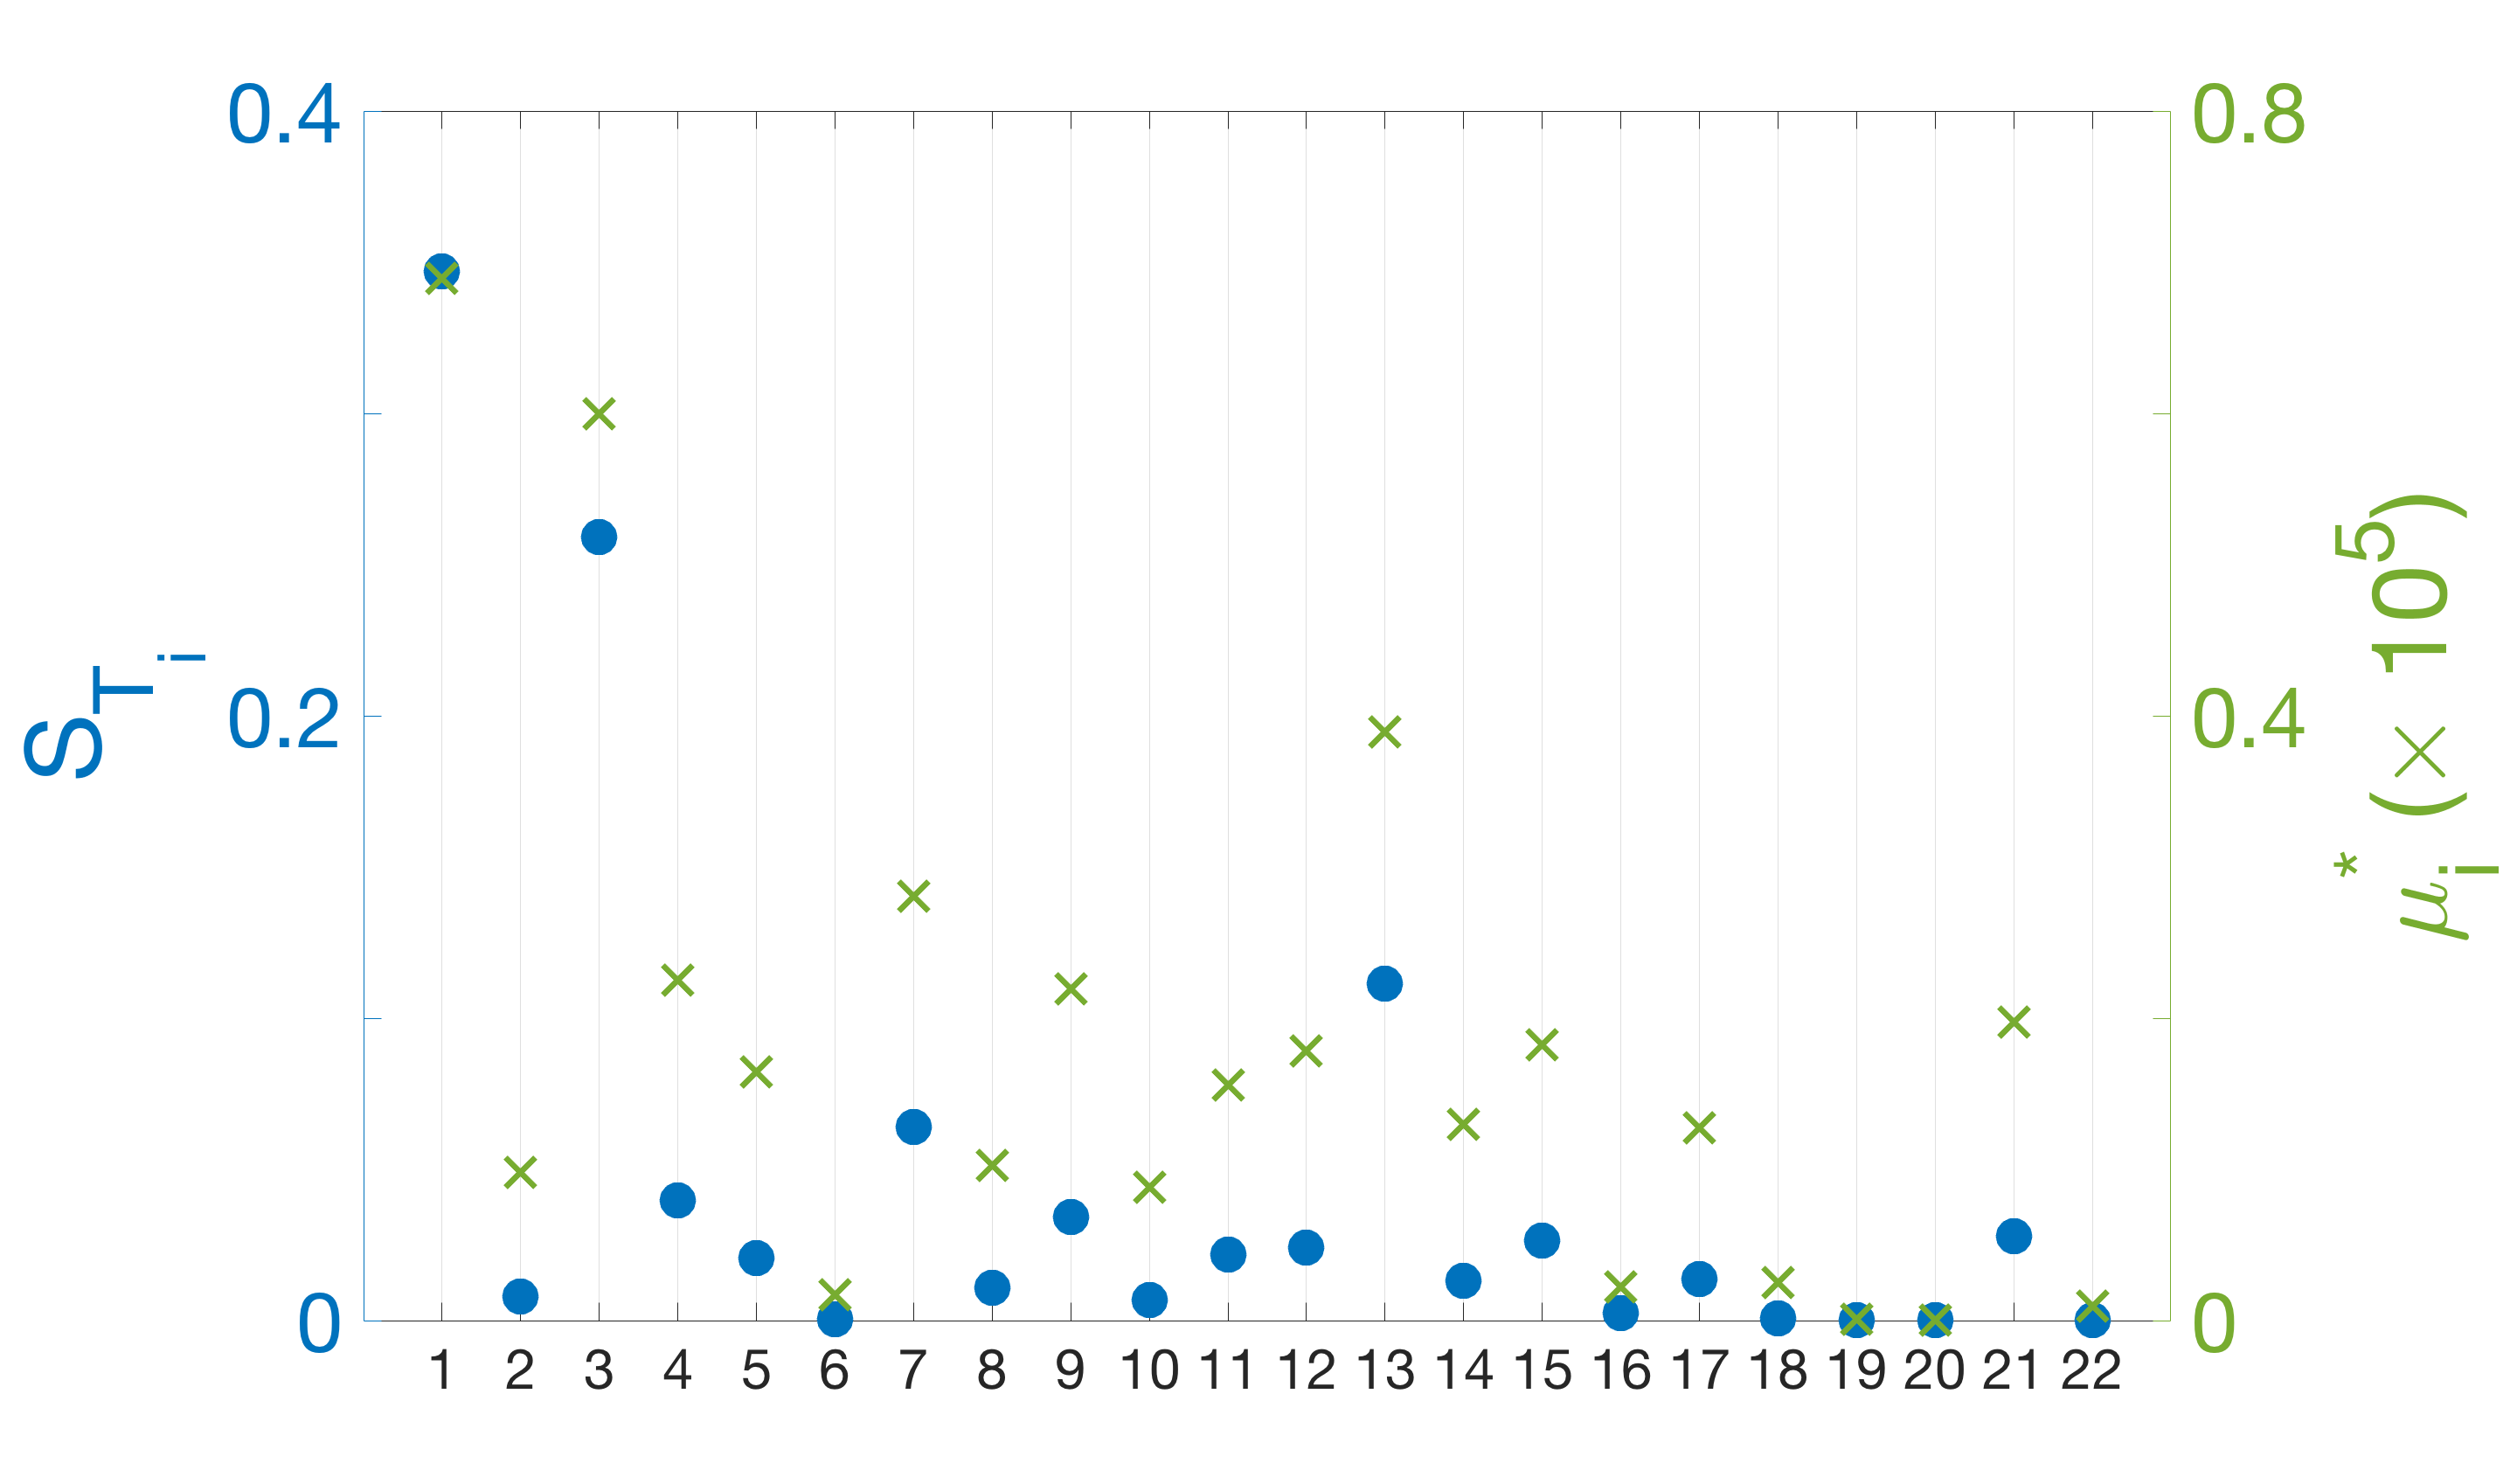
Figure 5 shows the resulting parameter sensitivity rankings from the Morris elementary effects and Sobol sensitivity analysis when . Similar results hold when is varied across the admissible treatment time. In Figure 5(a), when considering the ratio of M1 to M2 microglia in (9), the switching rate of M2 to M1 microglia stands out as being the most sensitive, followed by the opposite switching rate and half-maximal concentration of pro-inflammatory cytokines. The parameters relating to the neuroprotectant terms (indexed 18-22) are much less sensitive in comparison.
In Figure 5(b), when considering the total activated microglia in (10), the number of resting microglia remains the most sensitive parameter. The activation rate of the M2 microglia becomes the second most sensitive parameter, followed by the natural mortality rate . Note that out of the neuroprotectant term parameters, the maximum value of the term supporting M2 activation is the most sensitive.
5 Discussion
In this work, we develop a system of four coupled nonlinear differential equations describing the dynamics of activated microglia and cytokines during ischemic stroke. In particular, this model considers the switching of activated microglia between the M1 and M2 phenotypes (in both directions) and lumped compartments representing pro-inflammatory and anti-inflammatory cytokines. Inspired by possible neuroprotectant strategies, additional time-dependent terms are included to aid in the activation of beneficial M2 microglia and inhibit the activation of detrimental M1 microglia.
Simulations using nominal parameter values show that the model captures experimentally observed behavior of M1 and M2 microglial cells and cytokines post ischemic stroke. Numerical results further emphasize the importance of bidirectional switching between microglia phenotypes, in particular when considering the ratio of M1 to M2 microglia. Global sensitivity analysis results indicate that the parameters relating to phenotype switching in both directions are the two most influential parameters in the absence of terms to suppress M1 microglia and bolster M2 microglia. In the presence of these terms, the switching from M2 to M1 stands out as being the most sensitive parameter. These results indicate that the rate of switching between phenotypes in both directions is influential on the overall ratio of M1 to M2 microglia in the system.
By including terms to suppress the activation of M1 microglia and bolster the activation of M2 microglia, the model results in similar ratios of M1 to M2 microglia as observed in experimental studies for neuroprotectants. In particular, in numerical simulations using nominal parameter values, the modified model with neuroprotectant-inspired terms maintains a ratio of M1 to M2 cells below one for around 62 to 68 hours depending on the onset time. This is a significant extension of M2 cell dominance over results using the baseline model – in the absence of neuroprotectant-based terms, the ratio remained under one for only the first 17 hours. Further, early onset time of the neuroprotectant terms leads to a decreased minimum ratio of M1 to M2 microglia, which suggests possible early reduction in the detrimental effects of neuroinflammation by maintaining a larger amount of M2 cells for a longer time period.
When considering the total amount of activated microglia in the system, global sensitivity results intuitively show that model parameters relating to the M1 and M2 microglial cells are the most sensitive. These include the number of resting microglia and the activation and mortality rates of the M1 and M2 cells, while model sensitivity with respect to phenotype switching and cytokine production is negligible. Similar results are seen in both the absence and presence of the neuroprotectant terms, however the parameters relating to M2 become more sensitive than those for M1 when neuroprotective terms are included.
When instead considering the ratio of M1 to M2 microglia, parameters involving phenotype switching and cytokines arise as being the most sensitive. In particular, in the absence of the neuroprotectant terms, parameters relating to the half-maximal concentrations of anti-inflammatory and pro-inflammatory cytokines follow the switching parameters as the most sensitive, while the number of resting microglia is the least sensitive. Similar sensitivity rankings hold in the presence of the neuroprotectant terms, while the parameters relating to the neuroprotectant-inspired functions are notably some of the least sensitive parameters.
Since neuroprotectant strategies aim to decrease the ratio of M1 to M2 microglial cells while not necessarily altering the total number of activated microglia, it is of interest to further study model terms and parameters relating to the switching between microglia phenotypes, as well as those relating to cytokines. The proposed model can be extended to include separate compartments to account for interactions between microglia and specific pro-inflammatory cytokines (e.g., TNF-) and anti-inflammatory cytokines (e.g., IL-4, IL-10).
Future work will be performed to estimate model parameters based on experimental data measuring the ratio of M1 to M2 microglia in the absence and presence of neuroprotectant treatment, including the use of time-varying parameter estimation techniques to estimate the and terms for specific neuroprotectants without assuming the piecewise sigmoidal forms. Further, compartments for additional intracellular components (including neurons, astrocytes, and macrophages) will be included to study their interactions with the microglial cells and effects on the ratio of M1 to M2 microglia. Additional terms may be included to model existing thrombolysis drug treatment and explore computational simulation of combination strategies with tPA and novel neuroprotectants.
6 Conclusion
Neural inflammation is a natural response following the onset of ischemic stroke, propagated by the activation of microglia. Resting microglia can become classically activated into the M1 phenotype and produce detrimental substances or alternatively activated into the M2 phenotype and produce beneficial substances. In this study, we formulate a nonlinear system of differential equations to model the interactions between the two microglia phenotypes and the cytokines that each phenotype produces during inflammatory response. Additionally, we include terms suppressing the activation of M1 microglia and bolstering the production of M2 microglia to simulate possible neuroprotectant strategies. Model simulations and global sensitivity analysis results highlight the significance of bidirectional microglia phenotype switching on the ratio of M1 to M2 microglia, in both the absence and presence of neuroprotectant-inspired terms. Simulation results further demonstrate that early onset of terms to inhibit M1 activation and support M2 activation leads to a decreased minimum ratio of M1 to M2 microglia and allows the M2 microglia to dominate the number of M1 microglia for a longer time window.
Acknowledgments
This work was partially supported by WPI’s Presidential Fellowship (S. Amato) and by the National Science Foundation under grant number NSF/DMS-1819203 (A. Arnold).
Declaration of Competing Interest: None.
References
- [1] W Johnson, O Onuma, M Owolabi, and S Sachdev. Stroke: A global response is needed. Bulletin of the World Health Organization, 94(9):634–634A, 2016.
- [2] PK Singh. World Stroke Day 2019. https://www.who.int/southeastasia/news/speeches/detail/world-stroke-day-2019, October 2019.
- [3] American Stroke Association. About stroke. https://www.stroke.org/en/about-stroke, 2020.
- [4] Centers for Disease Control and Prevention. Stroke facts. https://www.cdc.gov/stroke/facts.htm, 2020.
- [5] AJH Newton and WW Lytton. Computer modeling of ischemic stroke. Drug Discovery Today: Disease Models, 19:77–83, 2016.
- [6] RA Taylor and LH Sansing. Microglial responses after ischemic stroke and intracerebral hemorrhage. Clinical and Developmental Immunology, 2013:746068, 2013.
- [7] MA Yenari, TM Kauppinen, and RA Swanson. Microglial activation in stroke: Therapeutic targets. Neurotherapeutics, 7(4):378–391, 2010.
- [8] WD Anderson, HK Makadia, AD Greenhalgh, JS Schwaber, S David, and R Vadigepalli. Computational modeling of cytokine signaling in microglia. Molecular BioSystems, 11(12):3332–3346, 2015.
- [9] X Hu, P Li, Y Guo, H Wang, RK Leak, S Chen, Y Gao, and J Chen. Microglia/macrophage polarization dynamics reveal novel mechanism of injury expansion after focal cerebral ischemia. Stroke, 43(11):3063–3070, 2012.
- [10] R Orihuela, CA McPherson, and GJ Harry. Microglial M1/M2 polarization and metabolic states. British Journal of Pharmacology, 173(4):649–665, 2016.
- [11] CD Russo, JB Lagaert, G Chapuisat, and MA Dronne. A mathematical model of inflammation during ischemic stroke. In ESAIM: Proceedings, volume 30. EDP Sciences, 2010.
- [12] Y Lee, SR Lee, SS Choi, HG Yeo, KT Chang, and HJ Lee. Therapeutically targeting neuroinflammation and microglia after acute ischemic stroke. BioMed Research International, 2014:297241, 2014.
- [13] R Guruswamy and A ElAli. Complex roles of microglial cells in ischemic stroke pathobiology: New insights and future directions. International Journal of Molecular Sciences, 18(3):496, 2017.
- [14] JH Byrne, R Heidelberger, and MN Waxham. From Molecules to Networks: An Introduction to Cellular and Molecular Neuroscience. Academic Press, 2014.
- [15] D Boche, VH Perry, and JAR Nicoll. Activation patterns of microglia and their identification in the human brain. Neuropathology and Applied Neurobiology, 39(1):3–18, 2013.
- [16] X Hu, RK Leak, Y Shi, J Suenaga, Y Gao, P Zheng, and J Chen. Microglial and macrophage polarization—new prospects for brain repair. Nature Reviews Neurology, 11(1):56–64, 2015.
- [17] Y Tang and W Le. Differential roles of M1 and M2 microglia in neurodegenerative diseases. Molecular Neurobiology, 53(2):1181–1194, 2016.
- [18] W Hao and A Friedman. Mathematical model on Alzheimer’s disease. BMC Systems Biology, 10(1):108, 2016.
- [19] Y Nakagawa and K Chiba. Role of microglial M1/M2 polarization in relapse and remission of psychiatric disorders and diseases. Pharmaceuticals, 7(12):1028–1048, 2014.
- [20] JD Cherry, JA Olschowka, and MK O’Banion. Neuroinflammation and M2 microglia: The good, the bad, and the inflamed. Journal of Neuroinflammation, 11(1):98, 2014.
- [21] H Shao, Y He, KCP Li, and X Zhou. A system mathematical model of a cell–cell communication network in amyotrophic lateral sclerosis. Molecular BioSystems, 9(3):398–406, 2013.
- [22] A Ledeboer, JJP Brevé, S Poole, FJH Tilders, and AMV Dam. Interleukin-10, interleukin-4, and transforming growth factor- differentially regulate lipopolysaccharide-induced production of pro-inflammatory cytokines and nitric oxide in co-cultures of rat astroglial and microglial cells. Glia, 30(2):134–142, 2000.
- [23] X Liu, J Liu, S Zhao, H Zhang, E Cai, M Cai, X Ji, RK Leak, Y Gao, J Chen, and X Hu. Interleukin-4 is essential for microglia/macrophage M2 polarization and long-term recovery after cerebral ischemia. Stroke, 47(2):498–504, 2016.
- [24] LE Vaughan, PR Ranganathan, RG Kumar, AK Wagner, and JE Rubin. A mathematical model of neuroinflammation in severe clinical traumatic brain injury. Journal of Neuroinflammation, 15(1):345, 2018.
- [25] SC Zhao, LS Ma, ZH Chu, H Xu, WQ Wu, and F Liu. Regulation of microglial activation in stroke. Acta Pharmacologica Sinica, 38(4):445–458, 2017.
- [26] T Tanaka, K Murakami, Y Bando, and S Yoshida. Interferon regulatory factor 7 participates in the M1-like microglial polarization switch. Glia, 63(4):595–610, 2015.
- [27] C Qin, LQ Zhou, XT Ma, ZW Hu, S Yang, M Chen, DB Bosco, LJ Wu, and DS Tian. Dual functions of microglia in ischemic stroke. Neuroscience Bulletin, 35:921–933, 2019.
- [28] Y Wang, T Yang, Y Ma, GV Halade, J Zhang, ML Lindsey, and YF Jin. Mathematical modeling and stability analysis of macrophage activation in left ventricular remodeling post-myocardial infarction. BMC Genomics, 13:S21, 2012.
- [29] MA Dronne, JP Boissel, and E Grenier. A mathematical model of ion movements in grey matter during a stroke. Journal of Theoretical Biology, 240(4):599–615, 2006.
- [30] P Orlowski, M Chappell, CS Park, V Grau, and S Payne. Modelling of pH dynamics in brain cells after stroke. Interface Focus, 1(3):408–416, 2011.
- [31] VL Rayz, L Boussel, MT Lawton, G Acevedo-Bolton, L Ge, WL Young, RT Higashida, and D Saloner. Numerical modeling of the flow in intracranial aneurysms: Prediction of regions prone to thrombus formation. Annals of Biomedical Engineering, 36(11):1793–1804, 2008.
- [32] T Lelekov-Boissard, G Chapuisat, JP Boissel, E Grenier, and MA Dronne. Exploration of beneficial and deleterious effects of inflammation in stroke: dynamics of inflammation cells. Philosophical Transactions of the Royal Society A: Mathematical, Physical and Engineering Sciences, 367(1908):4699–4716, 2009.
- [33] A Torres, T Bentley, J Bartels, J Sarkar, D Barclay, R Namas, G Constantine, R Zamora, JC Puyana, and Y Vodovotz. Mathematical modeling of posthemorrhage inflammation in mice: Studies using a novel, computer-controlled, closed-loop hemorrhage apparatus. Shock, 32(2):172–178, 2009.
- [34] H Malek, MM Ebadzadeh, R Safabakhsh, A Razavi, and J Zaringhalam. Dynamics of the HPA axis and inflammatory cytokines: Insights from mathematical modeling. Computers in Biology and Medicine, 67:1–12, 2015.
- [35] DM. Kent, HP Selker, R Ruthazer, E Bluhmki, and W Hacke. The stroke-thrombolytic predictive instrument: A predictive instrument for intravenous thrombolysis in acute ischemic stroke. Stroke, 37(12):2957–2962, 2006.
- [36] A Piebalgs, B Gu, D Roi, K Lobotesis, S Thom, and XY Xu. Computational simulations of thrombolytic therapy in acute ischaemic stroke. Science Reports, 8:15810, 2018.
- [37] B Gu, A Piebalgs, Y Huang, C Longstaff, AD Hughes, R Chen, SA Thom, and XY Xu. Mathematical modelling of intravenous thrombolysis in acute ischaemic stroke: Effects of dose regimens on levels of fibrinolytic proteins and clot lysis time. Pharmaceutics, 11(3):111, 2019.
- [38] J Minnerup, BA Sutherland, AM Buchan, and C Kleinschnitz. Neuroprotection for stroke: Current status and future perspectives. International Journal of Molecular Sciences, 13(9):11753–11772, 2012.
- [39] G Romero, ML Martinez, J Félez, G Pearce, and ND Perkinson. Applicability of the GP device to the Circle of Willis arteries by using a mathematical model. In 2011 UkSim 13th International Conference on Computer Modelling and Simulation, pages 48–53. IEEE, 2011.
- [40] C Motto, A Ciccone, E Aritzu, E Boccardi, CD Grandi, A Piana, and L Candelise. Hemorrhage after an acute ischemic stroke. Stroke, 30(4):761–764, 1999.
- [41] A Shoamanesh, CS Kwok, PA Lim, and OR Benavente. Postthrombolysis intracranial hemorrhage risk of cerebral microbleeds in acute stroke patients: A systematic review and meta-analysis. International Journal of Stroke, 8(5):348–356, 2013.
- [42] U Neuberger, P Kickingereder, S Schönenberger, S Schieber, PA Ringleb, M Bendszus, J Pfaff, and MA Möhlenbruch. Risk factors of intracranial hemorrhage after mechanical thrombectomy of anterior circulation ischemic stroke. Neuroradiology, 61(4):461–469, 2019.
- [43] MD Ginsberg. Neuroprotection for ischemic stroke: Past, present and future. Neuropharmacology, 55(3):363–389, 2008.
- [44] C Li, T Chen, H Zhou, Y Feng, MPM Hoi, D Ma, C Zhao, Y Zheng, and SMY Lee. BHDPC is a novel neuroprotectant that provides anti-neuroinflammatory and neuroprotective effects by inactivating NF-B and activating PKA/CREB. Frontiers in Pharmacology, 9:614, 2018.
- [45] C Li, Y Bian, Y Feng, F Tang, L Wang, MPM Hoi, D Ma, C Zhao, and SMY Lee. Neuroprotective effects of BHDPC, a novel neuroprotectant, on experimental stroke by modulating microglia polarization. ACS Chemical Neuroscience, 10(5):2434–2449, 2019.
- [46] Z Liu, Y Ran, S Huang, S Wen, W Zhang, X Liu, Z Ji, X Geng, X Ji, H Du, RK Leak, and H Xiaoming. Curcumin protects against ischemic stroke by titrating microglia/macrophage polarization. Frontiers in Aging Neuroscience, 9:233, 2017.
- [47] SH Taj, W Kho, M Aswendt, FM Collmann, C Green, J Adamczak, A Tennstaedt, and M Hoehn. Dynamic modulation of microglia/macrophage polarization by miR-124 after focal cerebral ischemia. Journal of Neuroimmune Pharmacology, 11(4):733–748, 2016.
- [48] X Liu, S Wen, F Yan, K Liu, L Liu, L Wang, S Zhao, and X Ji. Salidroside provides neuroprotection by modulating microglial polarization after cerebral ischemia. Journal of Neuroinflammation, 15(1):1–11, 2018.
- [49] R Liu, XY Liao, MX Pan, JC Tang, SF Chen, Y Zhang, PX Lu, LJ Lu, YY Zou, XP Qin, LH Bu, and Q Wan. Glycine exhibits neuroprotective effects in ischemic stroke in rats through the inhibition of M1 microglial polarization via the NF-B p65/Hif-1 signaling pathway. The Journal of Immunology, 202(6):1704–1714, 2019.
- [50] M Jiang, X Liu, D Zhang, Y Wang, X Hu, F Xu, M Jin, F Cao, and L Xu. Celastrol treatment protects against acute ischemic stroke-induced brain injury by promoting an IL-33/ST2 axis-mediated microglia/macrophage M2 polarization. Journal of Neuroinflammation, 15(1):78, 2018.
- [51] Y Li, D He, X Zhang, Z Liu, X Zhang, L Dong, Y Xing, C Wang, H Qiao, C Zhu, and Y Chen. Protective effect of celastrol in rat cerebral ischemia model: Down-regulating p-JNK, p-c-Jun and NF-B. Brain Research, 1464:8–13, 2012.
- [52] G Kleiner, A Marcuzzi, V Zanin, L Monasta, and G Zauli. Cytokine levels in the serum of healthy subjects. Mediators of Inflammation, 2013:434010, 2013.
- [53] C Ferrarese, P Mascarucci, C Zoia, R Cavarretta, M Frigo, B Begni, F Sarinella, L Frattola, and MGD Simoni. Increased cytokine release from peripheral blood cells after acute stroke. Journal of Cerebral Blood Flow & Metabolism, 19(9):1004–1009, 1999.
- [54] A Saltelli, S Tarantola, F Campolongo, and M Ratto. Sensitivity Analysis in Practice: A Guide to Assessing Scientific Models. Wiley Online Library, 2004.
- [55] MT Wentworth, RC Smith, and HT Banks. Parameter selection and verification techniques based on global sensitivity analysis illustrated for an HIV model. SIAM/ASA Journal on Uncertainty Quantification, 4(1):266–297, 2016.
- [56] RC Smith. Uncertainty Quantification: Theory, Implementation, and Applications. SIAM, Philadelphia, 2013.
- [57] CH Olsen, JT Ottesen, RC Smith, and MS Olufsen. Parameter subset selection techniques for problems in mathematical biology. Biological Cybernetics, 113(1-2):121–138, 2019.
- [58] J Wu, R Dhingra, M Gambhir, and JV Remais. Sensitivity analysis of infectious disease models: Methods, advances and their application. Journal of The Royal Society Interface, 10(86):20121018, 2013.
- [59] Q Wang, XN Tang, and MA Yenari. The inflammatory response in stroke. Journal of Neuroimmunology, 184(1-2):53–68, 2007.
- [60] AG Dyker and KR Lees. Duration of neuroprotective treatment for ischemic stroke. Stroke, 29(2):535–542, 1998.