∎
22email: konstantinos.spiliotis@uni-rostock.de 33institutetext: J. Starke 44institutetext: Institute of Mathematics, University of Rostock, D-18057 Rostock, Germany
44email: jens.starke@uni-rostock.de 55institutetext: D. Franz 66institutetext: Oscar-Langendorff-Institute of Physiology, Rostock University Medical Center, Rostock, Germany
66email: denise.franz@uni-rostock.de 77institutetext: A. Richter 88institutetext: Institute of Pharmacology, Pharmacy and Toxicology, Faculty of Veterinary Medicine, University of Leipzig, Leipzig, Germany
88email: angelika.richter@vetmed.uni-leipzig.de 99institutetext: R. Köhling 1010institutetext: Oscar-Langendorff-Institute of Physiology, Rostock University Medical Center, Rostock, Germany
1010email: ruediger.koehling@uni-rostock.de
Deep brain stimulation for movement disorder treatment: Exploring frequency-dependent efficacy in a computational network model
Abstract
A large scale computational model of the basal ganglia (BG) network is proposed to describes movement disorder including deep brain stimulation (DBS). The model of this complex network considers four areas of the basal ganglia network: the subthalamic nucleus (STN) as target area of DBS, globus pallidus, both pars externa and pars interna (GPe-GPi), and the thalamus (THA). Parkinsonian conditions are simulated by assuming reduced dopaminergic input and corresponding pronounced inhibitory or disinhibited projections to GPe and GPi. Macroscopic quantities can be derived which correlate closely to thalamic responses and hence motor programme fidelity. It can be demonstrated that depending on different levels of striatal projections to the GPe and GPi, the dynamics of these macroscopic quantities switch from normal conditions to parkinsonian. Simulating DBS on the STN affects the dynamics of the entire network, increasing the thalamic activity to levels close to normal, while differing from both normal and parkinsonian dynamics. Using the mentioned macroscopic quantities, the model proposes optimal DBS frequency ranges above 130 Hz.
Keywords:
mathematical modelling neuronal network basal ganglia movement disorders deep brain stimulation (DBS) synchronization1 Introduction
1.1 Basal ganglia connectivity
Parkinson’s disease (PD) and dystonia, including different types, belong to the most common movement disorders, and hence pose a considerable health burden Ches96 ; Def10 ; deLau06 . It is generally accepted that they arise from a dysfunction of the basal ganglia (BG), shown as simplified circuitry in Fig. 1 and result in hypokinetic or hyperkinetic symptoms, depending on which part of the circuitry is affected. In this circuitry, in general, cortical, mainly glutamatergic projections are thought to activate GABAergic medium spiny neurons (MSN) and interneurones of corpus striatum (striatum in Fig. 1). From the medium spiny, inhibitory neurones, the so-called direct pathway projects to globus pallidus pars interna (GPi). The inhibition of GPi leads to activation of thalamus (via disinhibition); one can thus speculate that the thalamus more or less faithfully responds to initial cortical signals (to initiate movement). In the so-called indirect pathway, the activation of striatum inhibits the globus pallidus pars externa (GPe) which projects to the subthalamic nucleus (STN), enhancing its activity. An increased STN activation, in turn, will lead to an increment of GPi activity, resulting in an inhibition of the thalamus (and hence reduction of locomotive activity Cal14 ), see also Fig. 1. Parkinson’s disease as a paradigmatic form of hypokinetic syndrome, due to degeneration of the substantia nigra (SN in Fig. 1). It is characterised by rigidity, tremor and hypokinesia, i.e. the inability to start movements fluently DeLong90 ; Mai17 . Looking at the circuitry, the motor symptoms can reasonably well be explained by a loss of both activating and inhibitory projections of the SN to the striatum, leading to disinhibition in the so-called indirect (striatum - GPe - STN - GPi - THA), and over-activation in the so-called direct pathways (striatum - GPi - THA) Cal14 . Hyperkinetic syndromes, characterised by involuntary movements or muscle contractions, in turn, are generally thought to originate from functional or structural damage or degeneration of striatum (dystonia or choreatic syndromes) and of STN; ballistic syndromes. Again, the simplified circuitry depicted in Fig. 1 can serve to explain the functional outcome of e.g. striatal over-activation speculated to result in a shift of balance toward the so-called direct pathway in dystonias (Wich11, ).
1.2 Role of activity patterns
While the simplified circuitry suggests relatively straight-forward explanations for the emergence of hyper- or hypokinetic syndromes, in fact it does not take into consideration the patterning of activity - although information in the nervous system is actually conveyed by spatio-temporal activity patterns. Pattern propagation, however, will typically depend on non-linear couplings among the interacting compartments of the system Bev02 . Hence, one cannot assume that inhibitory or excitatory activity will straight-forwardly propagate across the network. Importantly, both in PD and in dystonia, changes in oscillatory activity patterns in the basal ganglia and the cortex seem to be markers of the diseases Eus07 . Thus, in PD, synchronised beta-band activity in both cortex and STN seems to be associated with hypokinesia Cro12 ; Kuhn08 . This prominent beta-band synchronisation is speculated to be caused by a shift of network interactions among the different basal ganglia nuclei Schwab2013 . Indeed, a shift from complex spatio-temporal activity coupling between GPe and STN to strongly correlated and rhythmic patterns seems to underlie the pathophysiology of PD Bev02 . Synchronous abnormal patterns of activity of this local circuit should also be reflected in similar changes regarding the activity of the basal ganglia output and thalamic activity.
1.3 Deep brain stimulation
Deep brain stimulation (DBS) has been deemed to be the most important innovation in movement disorder therapy, and has revolutionised treatment for PD, dystonia and essential tremor patients, first having been approved for the latter condition by the FDA (Food and Drug Administration, USA) in 1997 (Kra19, ). Moreover, DBS is currently being introduced also for the therapy of mental disorders such as depression and obsessive-compulsive disorder Holtz11 . DBS clearly improves motors symptoms in PD, and often in dystonias Deus06 . For PD, we know that the efficiency of the treatment depends strongly on the frequency of the stimulus; high frequency stimulation (HFS), Hz McCon12 improves motor symptoms, while low frequencies are ineffective or worsen the clinical situation Koe19 . Until now, the main mechanism of DBS remains elusive Kra19 ; Ash17 ; Udu15 . The main hypotheses put forward so far are a) an inactivation of the target nuclei b) changes in transmitter release c) neuroprotective and electrostatic effects (i.e. structural plasticity), and network effects resulting in firing pattern alterations. While it seems clear that DBS does not cause a total silencing of neuronal activity of the target nuclei, but rather complex responses including sequences of prolonged activation / activity reduction Luo16 possibly because of a dissociation between somatal and axonal activation HOL00 . One of the most attractive explanations at the moment is the disruption of hypersynchronised oscillations Kuhn08 . Indeed, recordings from animal models suggest that DBS in the STN results in more periodic and regular firing at higher frequencies in the thalamus Xu08 .
1.4 Predicting network dynamics under DBS using computational approaches
From a computational perspective, one of the main obstacles to explain or predict DBS effects on network activity is the lack of a coherent framework which could bridge the different scales Deco08 ; Siet16 of network models - ranging from microscopic (cellular activity) to macroscopic (symptom)Pav12 ; Pav15 . An intermediate level, the mesoscopic, is related with dynamics of specific networks of neurons in different nuclei of the basal ganglia. These mesoscopic networks constitute the bridge between micro and macro scales. Examples of these network dynamics and variations of activity pattern are confirmed in a number of animal model studies in Parkinson models. Thus, DBS in the STN leaves firing rates unaltered in GPe, and increases firing rate in the thalamus (i.e. the nucleus the GPE projects on). While single unit recordings thus indicate changes in firing rates in projection areas of the STN during DBS, one overarching motive of all observations is that DBS effectively changes firing patterns McCon12 ; Xu08 ; So12 ; so17 ; Dorv10 as essential element for therapeutic success.
More specifically, in McCon12 , DBS leads to reduced low-frequency neuronal oscillations, increased neuronal oscillations at the stimulation frequency, and increased phase locking with the stimulus pulses. Moreover, coherence within and across the GPe and SNr during HFS was reduced in the band of pathological low-frequency oscillations and increased in the stimulation frequency band. These findings provide evidence that effective high-frequency DBS suppresses low-frequency network oscillations and entrains neurons in the basal ganglia. Therefore, these results support the hypothesis that the effectiveness of HFS stems from its ability to override pathological firing patterns in the basal ganglia by inducing a new regularized pattern of synchronous neuronal activity.
In this spirit we propose a computational large-scale biophysical model related to the Parkinson disease (PD) and DBS treatment. Based on the work presented in Ter02 ; Rub04 and using complex network theoryBass06 ; Wat98 ; Bull09 , four areas of the BG; the globus pallidus (partes externa / interna) (GPe-GPi), the subthalamic nucleus (STN) and the thalamus, are modelled. We show, in accordance with dopaminergic dysfunction occurring during Parkinson’s disease, how different levels of striatal inhibition to BG areas switch the system dynamics from “normal” to a “parkinsonian”, i.e. switching from faithful transfer of information through the network, to disturbed. The model can also reproduce the action of DBS in the STN, and discloses how high-frequency stimulation (HFS) influences the whole network in a computational view. Specifically, during DBS conditions, the model reveals a de-synchronisation or declustering of GPe and GPi activity which is projected to the thalamus. Defining and quantifying the response efficacy of thalamic activation during DBS, we deduce ranges of stimulation frequencies optimal for therapeutic success. Our model uses a significantly large number of neurons and connections (approx. two orders of magnitude larger compared to Ter02 ; Rub04 ; So12 ) which makes the model more realistic and allows us to describe the behaviour of the neural network macroscopically. Although the detailed description is on the microscale (level of neurons), a macroscopic analysis is of interest, specifically the mean activity of interconnected neurons. The results of the macroscopic analysis suggests that a strong nonlinear response is obtained in the basal ganglia network, similar to resonating mechanical systems. The following analysis proposes optimal frequencies above 130Hz, suggesting the investigation of DBS treatment over 130Hz in animal experiments.
2 Mathematical modelling of Basal Ganglia Neurons
The model of the basal ganglia network consists of four interconnected areas the subthalamic nucleus (STN), the globus pallidus internal (GPi) and external (GPe) and thalamus (THA), see Fig. 1. In this section we formulate the mathematical description for the neurons in each area of the basal ganglia (BG) and the thalamus.
In the model, the STN plays a key role as DBS is applied there to treat Parkinsons’s disease. The dynamics of each STN, GPe and GPi neuron are governed by a Hodgkin Huxley formalism and the current balance equation for the membrane potential readsTer02 ; Bev99 ; Popo19 :
| (1) | |||
| (2) | |||
| (3) |
where is the membrane capacity, is the membrane potential of the -th neuron, denote the gating variables and is the intracellular concentration of calcium. For all basal ganglia areas the currents are described below: The leak currents the potassium calcium and sodium currents are given by , and , while the low threshold T-type calcium current for STN is . In the case of GPe, GPi neurons, the low threshold calcium current has the form , reducing the bursting activity of the GPe compared to STN neurons. The current underlying the after-hyperpolarizing potential has the form .
The current in eq. (1) models deep brain stimulation in STN neurons only and has the value without DBS treatment. The current is applied in STN, GPe and GPi, but with different physiological meaning. In the case of STN neurons, the simulating the afferent synaptic input from cortexTer02 , while in the case of GPe and GPi the represents the incoming signal from striatum with different levels of inhibition of GPe and GPi, respectively.
In eq. (2) the equilibrium state is for , while for the equilibrium state of T current the following form is used: The voltage dependent time scale has the form , for STN and for GPe and GPi Ter02 .
Fig. 2 depicts the dynamics of one (uncoupled) STN neuron, firing at a frequency of 3Hz (all values of parameters are given in table 1, see also Ter02 ). When a negative current is applied for short time, the neuron is hyperpolarized accordingly. Due to the presence of hyperpolarization-activated currents (HCN currents), a rebound burst occurs after the current injection.
According to experimental findings Ple99 ; kita91 , GP neurons are characterized in contrast to STN cells with similar ionic currents but different parameters and the resulting dynamical properties are similar to experimental data in Ple99 ; kita91 . The main attributes are a spontaneous firing activity at a frequency of 30Hz Coop00 ; kita91 , (see also Ter02 and the references there in), and a rebound response to a hyperpolarizing current Ter02 ; kita91 ; Coop00 . Simulations of one GPe/GPi neuron are shown in Fig. 3, where the GP neuron fires at a frequency of 30Hz at rest shown in subfigure 3(a). Fig. 3(b) depicts the dynamics for small negative resulting in intermittent bursting activity. A small depolarizing current, in turn, results in fast tonic discharges at nearly twice the resting discharge frequency 3(c). The entire tuning curve depicting responses to different levels of current injections is depicted in 3(d).
2.1 Description of the basal ganglia synaptic connectivity
The coupling between the neurons is described by the synaptic current . In the model, GPe and GPi neurons are connected through a Watts and Strogatz (WS) small-world topology Wat98 ; Bull09 ; Stam2007 ; Gaf16 ; Sant14 ; Net04 ; Ber17 ; Fang17 , where neurons nearby are densely connected, additionally a small number of large distance connections exist. Following the experimental findings Gout18 which suggest sparse connections in the STN area, we chose a modified small world topology with substantially smaller intra-striatal connectivity. The detailed description of the network structure is given in sec. 2.3.
The small-world network is considered in the synaptic currents defined by the activation variable , which are given by Lai02 ; Erm12 ; Com09 :
| (4) |
where is a smooth approximation of step function, i.e. .
Typically, fast synapses are of order while for slow synapses holds and , meaning that fast synapses activate and deactivate following fast time scales, while the slow synapses activate fast, and deactivate slowly Lai02 ; Erm12 ; Term05 .
The excitatory and inhibitory synaptic currents for the -th neuron are given, respectively, by
| (5) |
with , and
| (6) |
with . where has the value 1 or 0, depending on whether the neuron is connected or not. The summation is taken over all presynaptic neurons.
In the case of STN neurons the current, is given by the summation , indicates the internal excitation between the STN neurons and the incoming inhibition from the GPe neurons, respectively. The excitatory glutaminergic connections within the STN are expressed by which follows the eq. (5), while the inhibitory current is given by eq. (6) and express the inhibition from the GPe area.
The synaptic current for the GPe region is defined by , where the first term express the interlayer inhibitory interaction of GPe neurons (i.e. follows eq. (6)), while describes excitation from STN neurons. For the GPi region the current is given by , where the first two terms and are inhibitory connections, connections from GPi to itself and from GPe to GPi, respectively, while describes excitations from STN neurons. The values of the parameters are given in table 1, see also tables 1, 2 of Ter02 .
2.2 Modelling and simulations of neurons in the thalamus
Modelling the basal ganglia network, the crucial behaviour of the model is the response of thalamic neurons to synaptic input from GPi neurons. The following section hence addresses this question. Here, a movement-programme associated sensory-motor cortex input to the thalamus is simulated by a repetitive periodic synaptic activation. This is modelled by 5 pA, 5 ms current injections, at 40 Hz (as depicted in Fig. 4), of the form Rub04 : , combined with GP neuronal input (resulting, in turn, from basal ganglia network activity) as main parameters determining thalamic firing.
The mathematical description of thalamic neurons is given in the following equation
| (7) |
where is the membrane capacity and is the membrane potential of the -th neuron. The leak current has the form the other ionic currents, i.e. potassium and sodium, are given by and , while the low threshold T type calcium current is described by . The gating variables follow the differential equation with first order kinetics as in eq. (2)
| (8) |
The equilibrium function has the form for and the voltage dependent time scale for the gating variable is , while for is defined as with and . The current represents the inhibition of GPi area to thalamus and has the form of eq. (6). For detailed description of thalamic neurons and for the arithmetic values of parameters, see Rub04 and table 2.
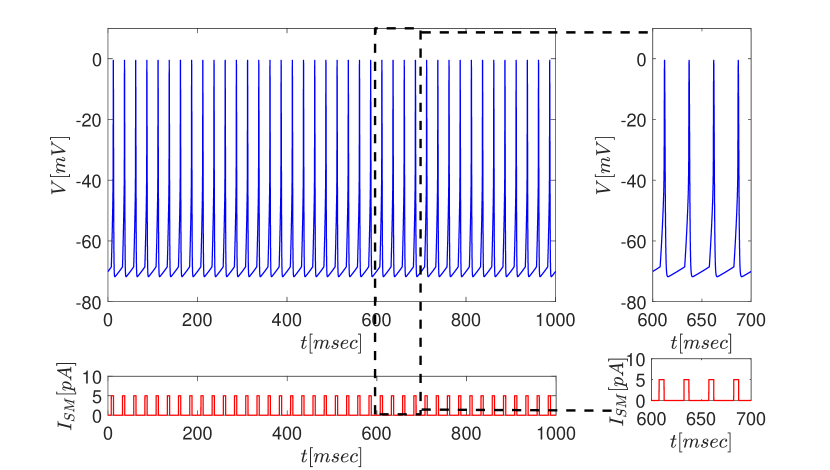
As Fig. 4 shows, within an isolated cortico-thalamic interaction, the thalamus follows cortical input absolutely faithfully. The next obvious question is how the basal ganglia network input will modify this strictly coupled cortico-thalamic interplay.
2.3 Network structure
For modelling and analysis STN neurons, GPe neurons, GPi neurons were used, while the thalamus was represented by neurons. Following Wat98 ; Bass06 ; Bull09 ; Stam2007 ; Spil11 , the GPe/GPi layers were modelled as separate small world networks i.e. the connections of neurons follow a small-world topology. In such small world complex networks Mark03 , not only does each neuron (node) in the network interact with its nearest neighbours, but there are also few randomly chosen remote connections Wat98 . For the construction of nuclei networks (GPe and GPi) the value was used, while remote connections were created according to Wat98 with . Fig. 5 shows a characteristic snapshot of the network. For the STN, we chose a modified approach with reduced intra-striatal connectivity, as it has been already mentioned in sec. 2.1, matching experimental findings which suggest sparse connections Gout18 ; Amm10 . Specifically, 80% of STN neurons do not have any coupling and only the 20% of the remaining STN neurons having collaterals within the other STN neurons Gout18 . For these neurons the distance of axonal endings with collaterals within the STN, showing that roughly 30% of all synapses lie within a 200 µm radius, and another 45% within the 200-400 µm radius. The other 20% are contacts which occur farther away, i.e. µm. In this sense, the 20% of neurons, which form STN connections, have both local and remote connections similar to small world property (i.e. 20% of neurons only showing an average of 25 connections each Gout18 ). Finally, the case of denser connectivity between STN neuron is also studied in section 4.5 and the results are shown in Fig. 11.
The coupling between the layers is achieved in the following way: Each GPe neuron is connected to one STN neuron and vice versa. Furthermore, each STN neuron is communicating with one GPi neuron. In addition to excitatory inputs, the GPe also sends inhibitory signals to the GPi according to small world topology, see Fig. 5. Each thalamic neuron, in turn, is receiving inhibitory inputs from three GPi neurons. Since the main interest of this study focuses on the impact of the basal-ganglia output activity on thalamic response to sensorimotor signals (shaping the thalamocortical interplay), this model does not include intrathalamic connections.

3 Macroscopic description of basal ganglia dynamics
3.1 Synchronisation analysis of basal ganglia dynamics
In the following, a nonlinear dynamical system of the form
| (9) |
is considered, where is a nonlinear vector field. For a periodic (or oscillatory) solution the property
| (10) |
holds with period , where defines a periodic orbit in the phase space. If the periodic orbit shows normal hyperbolicity Izhi04 , the system of eqs. (9) can be transformed into an angle or phase equation for the angle , i.e.
| (11) |
where is the natural frequency of the oscillator.
Coupled oscillators described as system of differential equations (9) are of particular interest in neuroscience. Under certain conditions, identical or nearly identical interacting oscillators converge to a common frequency and synchronise Str01 . If the coupling strength is small, then each oscillator stays almost at its natural frequency. Increasing the coupling strength beyond a specific threshold, a group or cluster of oscillators shows synchronisation properties Str01 .
For two coupled oscillators, this phase-locking is expressed as:
| (12) |
The case and or corresponds to phase and antiphase synchronisation, respectively. The appearance of synchronisation between two oscillators depends on two crucial parameters: The distance between the natural frequencies and and the coupling strength . High values of frequency distance decrease the synchronisation, while higher coupling strengths tend to synchronise the oscillators. In the two-parameter space , the areas where the phase locking, i.e., the synchronisation, appears as ‘Arnold’ tongues Low16 .
The weak coupling of oscillators Izhi04 is formulated by
| (13) |
where represents the coupling strength. The summation is over the coupling between and , namely the adjacent of the oscillators. Similarly, there is a transformation which allows to express the dynamics in phase variables, i.e.
| (14) | ||||
| (15) |
where . The weakly coupled system in phase form, i.e. eq. (15), shows a phase-locked solution if there is a constant integer matrix , such that with Izhi04 . Furthermore, the coupling oscillators are synchronised (in-phase) when
| (16) |
Following the approach of Kuramoto ARENAS08 ; Kur84 ; Kur84B ; Ber17 which is applied when oscillators are near supercritical Andronov-Hopf bifurcation, in case of a fully connected network eq. (15), we obtain
| (17) |
while with arbitrary connectivity i.e. a complex network topology
| (18) |
where the coefficient is derived from the network adjacency matrix Ber17 . Immediately, the macroscopic emergent dynamics (in terms of phase) can be obtained by taking the mean value of all phase populations (in exponential form, ). This defines the synchronisation index , i.e. Kur84 ; Str01
| (19) |
This index is used in the following sections as a measure describing the level of synchronised patterns within the GPi.
The synchronisation index acts as order parameter with range . In the case of perfect synchronisation, i.e. eq. (16), the index can be written
| (20) |
while the case of corresponds to incoherent phase movement. The phase used in eq. (19) of the -th neuron can be approximated linearly according to the following equation
| (21) |
where, corresponds to -th firing time of the -th neuron. Another option to compute the phase without assuming a linear dependence of the angle on time, see eq. (21) is the Hilbert transform, applied by Gabor in Gab46 . For a given function , the Hilbert transform is defined as
| (22) |
with denoting the Cauchy principal value. The complex signal is defined in order to extract the phase, where is the amplitude and the phase of the complex signal , respectively. The instantaneous phase is defined as:
| (23) |
The synchronisation index eq. (19) will be computed in the next section to characterise the network activity for the cases of normal, parkinsonian and DBS treatment.
An alternative macroscopic quantity which can be used to estimate neuronal activity is the mean synaptic activity index . It is defined by
| (24) |
where is the synaptic variable as it is defined from eq. (4). Coupling theoretical modelling tasks with experimental data, the synchronisation property in essence reflects local field potentials (LFP) in the sense that the flow of the extracellular current generating the LFP representing summed postsynaptic potentials from local cell groups (similar to eq. (24), see Buz04 ; Popo19 ; Manos18 ; Popo18 ). In the next section this mean synaptic activity will be used to measure the transfer of neuronal activity (current flow information) from the basal ganglia output, i.e., from GPi to thalamus.
4 Simulating different functional states of the basal ganglia network
Three cases of dynamic network behaviours were studied. In all cases the thalamus receives a periodic sensorimotor input (simulated by periodic 5 pA current injections Rub04 ) which represents the signal for the initiation of movement. In addition, a continuous input current to STN is applied in order to obtain rhythmic activity (simulating afferent synaptic input from cortex Ter02 ). During the first, normal case, see Fig. 1 (b), basal ganglia network activity allows a relatively faithful response of thalamus, closely following the sensorimotor cortex input. The second case considered is the parkinsonian state, depicted schematically in Fig. (1(c)), with resulting overall increase in inhibitory projections to the thalamus. The third case considers the situation of therapeutic intervention with deep brain stimulation (DBS) to STN, which is simulated as a high-frequency current injection into STN neurons, resulting in switching the entire network dynamics and restoring functional thalamic output close to normal behaviour.
In order to capture the transitions and to measure qualitatively the impact of the network dynamics, we additionally defined macroscopic variables or observables such as the synchronisation index and the average synaptic activity, focusing on GPi as output region of the basal ganglia network.
All simulations are made with Matlab 2020a using the solver ode23, a adaptive time step integration Runge Kutta scheme. The order of the method is three and the default relative and absolute tolerances in matlab are used.
4.1 Modelling the normal state
Parameters were tuned to simulate normal-healthy conditions as shown in Fig. 1(b). Inhibitory signals from the striatum to the GPe are described by the current whereas from striatum to GPi the current has the value pA. Fig. 6 depicts the time dependent activity of all nuclei under normal conditions. The STN neurons fire irregularly at around 4-7 Hz, i.e. close to values reported int he literature (cf. Bev99 Rubin et al 2012), see Fig. 6(a). The GPe activity is plotted in Fig. 6(b). It is characterised by high-frequency irregular bursting firing with individual clustering of action potential series (which is not visible on population scale, but only on the level of a single neuron as shown in the right column). Overall, there is little correlation between STN and GPe activity. Similar dynamics appear in GPi, which in turn, also shows high-frequency firing. Looking more closely, there is, however, an underlying weak rhythmicity at approx. 12 Hz, i.e. in the -band, see Fig. 6, and also 13(a). The resulting time-dependent activity plot of all neurons in the thalamus is shown in Fig. 6(d), demonstrating that under these conditions, the thalamus faithfully responds to sensorimotor input (Fig. 6(e)), without however being tightly phase-locked as in the case of single neuron, Fig. 4. Accordingly, the thalamic response efficacy (a macroscopic variables which measures the response of the thalamic neurons to sensorimotor input, with values in the interval [0,1] and the value 1 corresponds to a whole thalamus activation, exact definition in sec. 6) (see Fig. 15) in section 6) is approximately 0.5 under normal conditions. In conclusion, the GABAergic synaptic output from the GPi to the thalamus converts thalamic responses (otherwise phase locked to the cortical input) to more loosely firing of the thalamus, without subduing it altogether as in the parkinsonian state (see Fig. 7).
4.2 Modelling the parkinsonian state
As outlined above, in Parkinson’s disease, a degeneration of nigrostriatal dopaminergic neurons, accompanied by a reduction in the number of dendritic spines of striatal medium spiny neurons Gag17 ; Fio16 , leads to a loss of dopamine in the striatum. The resulting overall reduction of D1/D2 receptor-mediated activity affects the direct/indirect pathway functionality. In the direct pathway, the (D1) receptors malfunction results in disfacilitation of striatal projection neurons, and as a consequence a reduced inhibition of the GPi neurons. Thus, the disinhibited GPi increases its neuronal activity,sending higher levels of inhibition to the thalamus.
In the indirect pathway, loss of D2-receptor activation will disinhibit striatal projection neurons. These, in turn, now decrease the activity of the GPe, to which they project. By inhibiting the GPe, the activation of STN is increased, and the overactive STN will enhance the neuronal activity in the GPi - which again leads to even more pronounced thalamic inhibition, see Fig. 1(c).
Consistent with this concept, the model assumes a decrease in the level of inhibition of GPi neurons . This is modelled by increasing depolarising current from 4 to 8 pA (corresponding to dis-inhibition). At the same time, the model assumes an increase in the level of inhibition of GPe neurons (therefore, depolarising current is decreased from 5 to 3pA). Fig. 7 shows the dynamics of the network in time of the four areas: Under parkinsonian conditions, the time-dependent activity of all neurons in STN is changed compared to the normal state: Firing becomes more regular, and occurs at higher frequency (approx. 11 Hz). For the GPe Fig. 7(b), the consequence is a lower burst frequency, almost following the STN activation (see insets). Fig. 7(c) shows that in GPi, the altered activity is translated to high-frequency bursting, with an underlying enhanced rhythmicity in -activity (13-15 Hz) compared to the normal condition, see also Fig. 13(b). As a result, inhibition to the thalamus strongly increases, and the thalamus is no longer able to transmit signals in response to sensorimotor input, as its firing becomes very sparse.
4.3 Modelling the effects of DBS
The network structure and the conductances were kept invariant with respect to parkinsonian conditions. DBS treatment was simulated by a high frequency current of 184 Hz, applied to all STN neurons (this value resulted after the analysis in section 6 and is suggested as candidate for an optimal DBS frequency in experiments). The high frequency current is modelled as periodic short pulses of the form Rub04
| (25) |
In all three basal ganglia nuclei, DBS induces dramatic alternations in firing dynamics. Regarding the STN, neurons follow the strong DBS signal and fire tonically at stimulation frequency, see Fig. 8(a). In GPe, this results in regular bursting of neurons at about 90 Hz, i.e. at 3x higher frequency than normal, and 4x higher frequency than under parkinsonian conditions, respectively. In GPi, in turn, the increased activity in GPe nearly normalises the firing to slightly irregular firing at 30 Hz (compare insets in this figure and 6), and thus strongly reduces firing frequency compared to the parkinsonian state (which ranged around 50-80 Hz) see Fig. 8. In summary, there is an overall loss of synchronisation between STN, GPE and GPi, and at the same time STN and GPe now fire tonically. With the reduction of the high-frequency tonic firing of the GPi, the thalamus is disinhibited and resumes firing, following the sensorimotor input relatively closely.
4.4 STN-GPi interaction: synchronisation changes and local travelling waves formation
Different spatio-temporal patterns of activation in STN on the one hand, and GPi on the other, can be observed under normal, parkinsonian and DBS conditions. Fig. 9 depicts the whole neuronal activity of STN and GPi regions in the case of to weak-sparse connectivity between STN neurons. In normal case (a) and (b), both ares STN and GPi show irregular patterns. Instead, in parkinsonian case (c) and(d), the regions show higher synchronous activation. This is also confirmed in Fig. 10: This raster plot shows the sparse, but very synchronous firing in STN in the parkinsonian case, with local travelling waves, restricted to a few neurons and demonstrating some clustering of neuronal activity. A reasonable interpretation for this is that in the parkinsonian state, the reduced inhibition from GPe to the STN leads to a higher spatial synchronisation between these nuclei, resulting in increased order in the pattern formation.
Which consequence does this have for the activity in the GPi?
This nucleus receives both input from the STN (indirect pathway) and from the striatum (direct pathway), and hence one would expect two competing activity patterns. Under parkinsonian conditions, in turn, the inhibitory control of the direct pathway is reduced. Hence the activity in the GPi is more pronounced, as also confirmed in Fig. 10, which shows series of quasi synchronous activations of GPi neurons, with local travelling waves forming small clusters. Under DBS conditions, the massive synchronisation in the STN (abolishing all travelling waves and imposing a 184 Hz rhythm on nearly all neurons) is mirrored in a closely-matching synchronised activity pattern in the GPi, but at lower frequency of around 60Hz, again overriding all other activity. This presumably results in a nearly tonic activation of inhibitory neurons, to which the thalamic neurons desensitise, as will be discussed below.
4.5 Effects of dense STN connectivity
Since the degree of conncetivity among STN neurons is still under debate Stein19 , in a next step also a higher connectivity was considered. The increment of connectivity, i.e., higher number of connections between STN neurons, leads to different spatio-tempral pattern. Fig. 11 shows the normal, parkinsonian and DBS states. The qualitatively difference here is the strong connectivity within STN. Each neuron now has mutual connections with other neurons with mean number of connections equal to 20. The STN structure is described as a small world topology. Under normal and parkinsonian conditions, the basal ganglia network depicts strongly correlating travelling waves, which propagate, and are more variable in the normal state. The travelling wave represents a propagation of similar activity levels along one direction, i.e. as activity peaks in neighbouring neurons in a co-moving frame, preserving the activity shape. Also with this much higher intra-STN connectivity, the parkinsonian state is characterised by increased synchronisation in GPi. Under DBS, rhythmic activity of STN in turn is reflected in less synchronisation in GPI. Thus, the model is rather robust with respect to GPi output, within a wide range of STN connectivity.
5 Synchronisation and synaptic activity indices characterise transitions of network dynamics
In order to shed light on the transitions between the different states, and to examine the appearance of distinct patterns in our model, we analysed both the level of synchronisation within the GPi (computing the synchronisation index ), and the levels of synaptic GABAergic projection activity from the GPi to the thalamus (defining GPi activity index ).
The theory of phase synchronisation Izhi04 ; Erm12 ; Tass99 ; Piko01 ; Kur84 described in section 3.1, allows us to characterise and analyse different attributes and the dynamics which results from the mathematical model. The main observables are the synchronisation index defined in eq. (19) and the mean GPi synaptic activity index defined in eq. (24) and depicted in Figs. 12 and 13. We further performed a Fourier analysis of the mean GPi activity index, in order to measure the dominant frequencies (rhythms) and we determined its slope of the power spectrum to estimate the distribution of frequencies in the power spectrum (see Fig. 14).
5.1 Macroscopic dynamics in the normal state
Considering the healthy, normal state, as Fig. 12(a) shows, synchronisation within the GPi is generally low (around 0.5). The synchronisation index shows oscillatory behaviour (at around 12 Hz). The local maxima of the synchronisation index thus correspond to increased synchronous activation of GPI neurons in the low range. The GPi activity results in an overall periodic, but sparse inhibitory drive to the thalamus. Corresponding to this behaviour, the mean synaptic GPi activity phasically oscillates around 0.2 (even if the microscopic behaviour of neurons form bursting clusters) see, Fig. 13(a). This rhythm lies within the lower frequencies (i.e. and lower band), as the spectrum analysis reveals, see Fig. 14(a) with a first peak at 7 Hz and a higher peak at around 11 Hz. This rhythmic peak is centered relatively narrowly around this dominating frequencies, since the slope of linear approximation is relatively steep (around Hz/sec), meaning that the higher frequencies do not contribute in the magnitude of the power spectrum.
5.2 Macroscopic dynamics in the parkinsonian state
Under parkinsonian conditions, the GPi neurons are generally much more active than in the normal state. Thus, the synchronisation is very high (close to 1). This index reflects prolonged intervals of high activity, interrupted only briefly by small decrements in synchronisation levels. This indicates that neurons are synchronised during the prolonged and accentuated bursting in GPi in the parkinsonian state. As a result, the synaptic, inhibitory projection to the thalamus remains periodic, but predominantly strong, and is again only slightly reduced during short burst intervals, see Fig. 13(b). The mean GPi synaptic activity (fluctuating around 0.7) is commensurate with this high synchronisation, which is supported by prolonged bursting of GPi neurons, only periodically interrupted by brief periods of reduced activity. The Fourier analysis reveals a dominant /low activity with a strong peak at 10Hz, and a secondary at 18Hz, i.e., higher rhythm than the normal conditions. Importantly, the frequency spectrum of this bursting is much broader, as indicated by the corresponding linear approximation the slope increasing to Hz/sec. This reflects also higher frequencies contributing to the total power.
5.3 Macroscopic dynamics during DBS
Simulating DBS, the macroscopic activities (as the indices and show) change dramatically (depending on a specific range of frequencies), introducing a state dissimilar to both normal or parkinsonian states. The synchronisation index within the GPi shows a dynamic development over time, starting at values of 0.9, and then decreasing to 0.5, during the first 500 ms of tonic irregular firing in the GPi. After this period, the system adapts and oscillates at high frequencies between values 0.8 and close to 1, i.e. it remains in a relatively high synchronisation state. Similar dynamics emerge regarding the mean GPi synaptic activity, with a first transient period of 500 ms where the synaptic drive is decreased (to 0.2), and a second period ( ms) where high synaptic activity is maintained (with fluctuations around a mean of 0.6, i.e. higher than under normal conditions, and slightly lower than under parkinsonian). Surprisingly, this would appear to impose a strong inhibitory drive to the thalamus, see Fig. 13(c). This, however, differs from the parkinsonian condition as it is tonic high-frequency, and not repeating bursting blocks appearing at frequency. This qualitative change in rhythmicity is crucial: While a relatively high inhibitory tonic drive seems to suggest strong thalamic inactivation, the contrary is the case. Due to the fact that the input to the thalamus is not rhythmic, but high-frequency tonic (peak power at 184 Hz), the GABAergic synapses are deactivated (see eqs. (4). Indeed, the frequency analysis of the GPi activity shows a main peak seeming to resonate with the external DBS stimulus (around 60Hz), and corresponding harmonics. Importantly, the peaks in the lower (normal state) and higher (parkinsonian state) band disappear, while the slope changes back to a value around -3.1 Hz, close to the normal case. Although this slope is close to normal conditions, it now reflects a narrow high-frequency band, and not unclustered activity.
Taken together, the findings underscore the importance of synchronous regular and brief, clustered burst firing in the GPi for successful inhibition in the thalamus, which normally takes place at frequency. Although DBS thus does not restore normal rhythmicity in the GPi, the thalamic activity is disinhibited by the loss of synchronisation and clustering within the GPi.
6 DBS efficiency depends on stimulation frequency
As the previous considerations show, the macroscopic indices and , which are defined in eq. (19) and (24) respectively, allow to describe the effects of DBS stimulation and to compare the different states (normal, parkinsonian, and DBS).
One critical parameter of the DBS result is the thalamic response with respect the sensorimotor cortical signal. Faithful thalamic activation will send strong excitatory signals to cortex, see Fig. 1(a), alleviating in this way the parkinsonian symptoms. Naturally, under normal conditions the thalamic response should neither be completely uncoupled (with respect to the sensorimotor cortical signal), as under parkinsonian conditions (see Fig. 7(d)), nor completely coupled as in an isolated cortico-thalamic system (Fig. 4). Indeed, under normal conditions, as shown in Fig. 6(d), the thalamus follows the cortical input relatively closely, but not in absolute synchrony.
In order to quantify the thalamic response to cortical input, under normal conditions or DBS with various stimulation frequencies, we define the response efficacy of thalamic neurons as a mean value of the fraction of activated thalamic neurons during simulated cortical activation. This simulation, as already discussed in Fig. 4, comprised sensorimotor current injections of length (5 ms) defined by the interval , with frequency of 40 Hz. The mathematical formulation of response efficacy is thus defined as:
| (26) |
where is the proportion of activated neurons, i.e. the number of activated neurons within the time interval of divided by the whole number of thalamic neurons . The summation is taken over the number of intervals , for times ms, (i.e. ). Under normal conditions, as expected, is approximately 0.5, i.e. suggesting a coupling to cortical input at a value offering the broadest dynamic range.
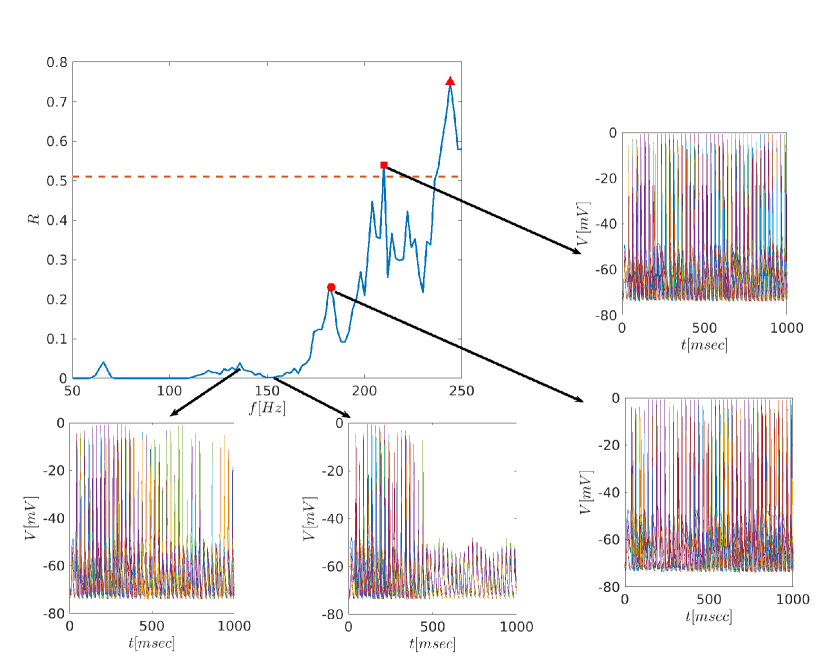
Under DBS at various frequencies, shows a non-linear behaviour, starting at 0 for low DBS frequencies (around 50 Hz) to values with small peaks for frequencies around 70 and 130 Hz. Very prominent peaks are found around 184 Hz, 210 Hz and 244 Hz. Thus, there are three dominant optima at where the DBS maximises the thalamic response close to normal values of . As Fig. 8 thus shows, the frequency of DBS is critical for thalamic firing outcome. At low frequencies (i.e. 50-150 Hz), only few frequency bands can be found at which . Consequently, the effects on thalamic activation are only transient at e.g. 50 Hz and 150 Hz (see Fig. 15). Exceptions are the small peaks at 70 and 130 Hz; Fig. 15, reasonably stable responses can thus be seen at 130 Hz. Only from 160 Hz onward, stable thalamic firing can be achieved by DBS. Interestingly, this is very similar to experimental findings in hemiparkinsonian rats: low frequency DBS stimulation up to 75 Hz actually result only in transient effects, while permanent reductions of circling behaviour (the parkinsonian equivalent in this animal model) were only achieved at DBS frequencies 130 Hz so17 .
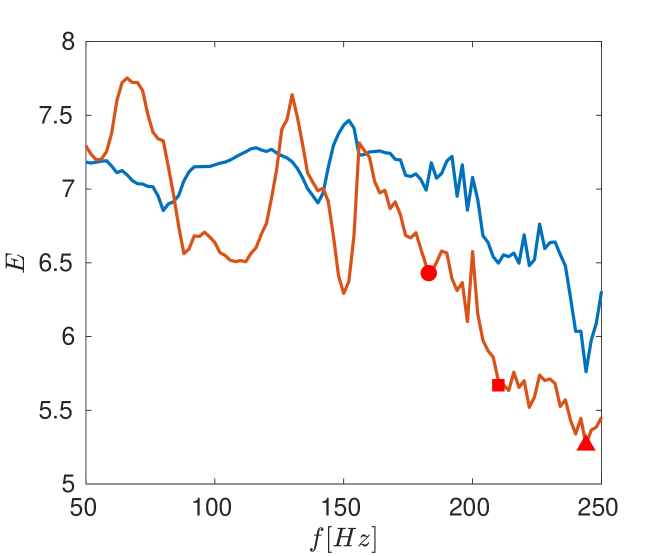
Computing the Shannon entropy for the macroscopic variables we confirm the optimal DBS frequency. As suggested by Dorv08 ; Arle18 ; Deco12 , an optimised DBS frequency can be achieved by regularisation of the whole basal ganglia activityDorv08 , i.e. minimisation of the entropy and thus a more ordered state.
We thus compute the Shannon Entropy , by
| (27) |
where express the macroscopic variable of interest (here ). Calculating the entropy for different frequencies, we obtain Fig. 16. As can be deduced from this figure, one DBS optimum frequencies indeed be at a frequency of 184, 210 Hz, where entropy values of both synchronisation and synaptic GPi activities reach a local minimum (and also, thalamic response efficacy is highest, cf. Fig. 15). A similar minimum can be found when increasing further at 244 Hz, which would require more energy for the DBS stimulation, likely raising the possibility of energy-dependent side effects.
7 Discussion and Conclusions
A large scale basal ganglia computational model has been used to study network dynamics in movement disorders. The network model consists of 1700 interactive neurons with approximately 30000 connections (representing the microscopic level). For different values of parameters, the model reproduces phase transitions for normal, parkinsonian and DBS, in the emergent dynamics which are captured with suitable macroscopic indices (for example the change from oscillatory to bursting behaviour of mean synaptic activity in Fig. 13(a)and(b)). Importantly, transitions produced by the model are consistent with the physiology and experimental observations of aberrant functionality of direct and indirect pathways.
Experimental findings of animal studies, regarding the impact of STN-DBS on GPe, GPi and thalamic firing could closely be replicated (qualitatively). Specifically, in the transition from normal to parkinsonian state shown in Figs. 6 and 7, the model alters the dynamics of GPe and GPi neurons due to varying levels of striatal inhibition. Remarkably, similar alternations in GPe/GPi dynamics were observed in Galv08 (Fig. 2 therein) in monkeys and mice treated with MPTP (methyl-4-phenyl-1,2,3,6-tetrahydropyridine)Galv08 ; Oga85 .
Furthermore, under DBS, in the model, the GPi and GPe fire tonically at high frequency, following STN firing at stimulation frequency (184 Hz), abolishing synchronised activity. This corresponds to the findings of McCon12 , who showed that STN stimulation results in a sharp power peak at the same frequency also in GPe, and with findings of Wang et al. Wang18 where DBS disrupts pallidal beta oscillations and the cortical coherence in Parkinson disease.
Regarding the -band hypersynchrony hypothesis of Parkinson’s disease Kuhn08 , the model thus importantly shows that DBS actually abolishes -band synchrony, which also in the model is prevalent in GP without stimulation. Hence, the model faithfully replicates what is known from clinical and animal model studies both on the cellular and on the network activity pattern levels. The model produces clusters of local travelling waves, more pronounced in the parkinsonian state. Remarkably, in the experimental findings of Cag15 , it has been found that the analysis of local field potential recordings from the subthalamic nucleus and globus pallidus of patients with Parkinson’s disease show beta band propagation waves within the globus pallidus.
Further, the model predicts that a faster firing GPi projections under DBS will result in regular firing of the thalamus, which in turn will essentially follow the cortical input - while under PD conditions, in fact thalamic firing was very sparse and irregular, and did not faithfully mirror cortical signals. These results are supported by studies in a parkinsonian animal model in rhesus monkeys Xu08 , where STN-DBS (as in Fig. 8) produces a change in the pattern and periodicity of neuronal activity in the basal ganglia thalamic network, resulting in a regular, higher-frequency firing pattern in the thalamus.
Moreover, macroscopic properties can be derived from our model. Since these essentially mirror local field potential activity, these properties can be used to test predictive modelling in future studies. For example in HE10 similar changes in the critical exponent a (which characterises the distribution of power spectrum) were found. They explain these differences by different areas of activation during the experiments. In our case, this exponent is the slope of the linear approximation in Fig. 14. Our analysis shows that the slope can be distinguish between normal parkinsonian and DBS state. Further, the model also allows to extract variables such as a macroscopic synchronisation and GPi synaptic activity indices which theoretically allow for predicting the probability of transition into parkinsonian state, which might pave the way for feedback control of DBS in the future Popo18 ; Popo19 ; Manos18 .
Beyond this, the detailed analysis of the macroscopic parameters, and derived values such as entropy also allow for an optimisation of DBS. As an outcome measure, the response efficacy of thalamic neurons reflects the degree of thalamic activity correlating to cortical input, which under normal conditions is 0.5. Critically, raising stimulation frequency beginning with 50 Hz, the first prominent entropy local minima of the two mesoscopic parameters precisely coincide with the first peak of the response efficacy close to normal values ( 0.23) at 184 Hz and more efficient frequencies over the 200Hz. Although these frequencies are not identical to the most commonly used one in clinical settings (i.e. 130 Hz), the optimum obtained in this study is close. More importantly, the model, and more specifically the response efficacy qualitatively very much reproduces data from animal studies in hemiparkinsonian rats so17 , where clinical improvement was seen only with increasing DBS frequencies from 75 Hz onward, with two optima at 130 and 260 Hz, and less efficacious frequencies in between. Our results confirm the experimental findings of so17 showing that DBS above 130Hz is more effective in hemiparkinsonian rats. Our mathematical model extends previous computational work So12 ; Dorv10 by using a larger number of neurons for each basal ganglia areas and complex small world connectivity. Additionally, we propose different approximations in the DBS frequency. The frequency analysis of Dorv10 differs from our investigation since they focus on perturbations around 130 Hz (Fig. 1 and 2 in Dorv10 ). In So12 the activation patterns of local cells and fibers passage are studied with respect the fidelity of thalamus. Our model suggests that the basal ganglia network behaviour to DBS stimulate frequency has a strong nonlinear response similar to resonating mechanical systems with optimal frequencies above 130Hz, suggesting the investigation of DBS treatment beyond the 130Hz. In summary, the mathematical model and the analysis is considered a powerful tool to explore the effects of parameter-dependent changes of DBS and to optimise the medical treatment.
8 Outlook
One major future topic will be the study of network topological variations and the impact on the emergent dynamics. Thus, the functional effects of neuro-anatomical changes observed in Parkinson’s disease Prak16 , such as massive decreases of dendritic length of medium spiny neurons Step05 , could be modelled.
Considering movement disorders beyond Parkinsons’s disease, the model could also be extended to further elements of the basal ganglia, to gauge the effect of alterations in cortico-striatal communication such as those observed in dystonic hamsters Kohl04 , where alternations in excitability in dystonic tissue was described to be related to both changes in intrinsic neuronal properties, and presynaptic release probability at glutamatergic synapses.
In future work, it will be important to investigate the parameter dependence of network dynamics, using numerical bifurcation tools for multiscale problems Spil11 ; Mars14 ; Moon15 ; Schm18 , for an in-depth understanding of the functional network changes occurring in movement disorders.
Funding
The authors thank the DFG for support through the Collaborative Research Center CRC 1270 (Deutsche Forschungsgemeinschaft, Grant/ Award Number: SFB 1270/1–299150580).
Acknowledgments
KS would like to acknowledge George Georgiou and Constantinos Siettos for their help, discussions and encouragement during the early stages of this research. All authors thank Susann Dittmer for her help drawing Fig. 1.
| STN | value | GPe/GPi | value |
|---|---|---|---|
| 2.25 nS/ | 0.1 nS/ | ||
| 45.0 nS/ | 30 nS/ | ||
| 37.5 nS | 120 nS/ | ||
| 0.5 nS/ | 0.5 nS/ | ||
| 0.5 nS/ | 0.15 nS/ | ||
| 9.0 nS/ | 30.0 nS/ | ||
| -60.0 mV | -55.0 mV | ||
| -80.0 mV | -80.0 mV | ||
| 55.0 mV | 55.0 mV | ||
| 140.0 mV | 120.0 mV | ||
| 500.0 msec | 0.27 msec | ||
| 100.0 msec | 0.27 msec | ||
| 17.5 msec | 0.05 msec | ||
| 1.0 msec | .05 msec | ||
| 1.0 msec | 1.0 msec | ||
| 40.0 msec | 30.0 msec | ||
| 15.0 | 30.0 | ||
| 22.5 | 20 | ||
| -30.0 | -37 | ||
| -39.0 | -58 | ||
| -32.0 | -50 | ||
| -67.0 | -70 | ||
| -63.0 | 63.0 | ||
| 0.4 | 0.4 | ||
| -39.0 | 39.0 | ||
| -57.0 | -40.0 | ||
| -80.0 | -40.0 | ||
| 68.0 | - | ||
| 15 | 10 | ||
| -31 | -12 | ||
| 8 | 14 | ||
| -2 | -2 | ||
| 7.8 | 2 | ||
| -0.1 | - | ||
| -3 | -37 | ||
| -26 | -37 | ||
| -2.2 | - | ||
| 0.75 | 0.05 | ||
| 0.75 | 0.05 | ||
| 0.12 | 2 | ||
| 5 | 2 | ||
| 1 | 0.08 | ||
| -39 | -57 | ||
| 200 | - | - | |
| .6 msec | - | - | |
| 6 msec | - | - |
| THA | value |
|---|---|
| 0.05 nS/ | |
| 5 nS/ | |
| 3 nS | |
| 5 nS/ | |
| 0.5 nS/ | |
| -70.0 mV | |
| -90.0 mV | |
| 50.0 mV | |
| 140.0 mV | |
| 0 mV | |
| 500.0 msec | |
| 100.0 msec | |
| 17.5 msec | |
| 1.0 msec | |
| 40.0 msec | |
| 15.0 | |
| -41.0 | |
| -84.0 | |
| -37.0 | |
| -60.0 | |
| 4 | |
| 4 | |
| 7 | |
| 6.2 | |
| 5 | |
| 5 msec | |
| 25 msec |
References
- (1) Amadeus Steiner, L., Barreda Tomás, F., Planert, H., Alle, H., Vida, I., Geiger, J.: Connectivity and dynamics underlying synaptic control of the subthalamic nucleus. Journal of Neuroscience 39(13), 2470–2481 (2019)
- (2) Ammari, R., Lopez, C., Bioulac, B., Garcia, L., Hammond, C.: Subthalamic nucleus evokes similar long lasting glutamatergic excitations in pallidal, entopeduncular and nigral neurons in the basal ganglia slice. Neuroscience 166(3), 808–818 (2010)
- (3) Arenas, A., Díaz-Guilera, A., Kurths, J., Moreno, Y., Zhou, C.: Synchronization in complex networks. Physics Reports 469(3), 93–153 (2008)
- (4) Arle, J., Mei, L., Carlson, K., Shils, J.: Theoretical effect of dbs on axonal fibers of passage: Firing rates, entropy, and information content. Stereotactic and Functional Neurosurgery 96(1), 1–12 (2018)
- (5) Ashkan, K., Rogers, P., Bergman, H., Ughratdar, I.: Insights into the mechanisms of deep brain stimulation. Nature Reviews Neurology 13(9), 548–554 (2017)
- (6) Bassett, D., Bullmore, E.: Small-world brain networks. Neuroscientist 12(6), 512–523 (2006)
- (7) Bertalan, T., Wu, Y., Laing, C., Gear, C., Kevrekidis, I.: Coarse-grained descriptions of dynamics for networks with both intrinsic and structural heterogeneities. Frontiers in Computational Neuroscience 11 (2017)
- (8) Bevan, M., Magill, P., Terman, D., Bolam, J., Wilson, C.: Move to the rhythm: Oscillations in the subthalamic nucleus-external globus pallidus network. Trends in Neurosciences 25(10), 525–531 (2002)
- (9) Bevan, M., Wilson, C.: Mechanisms underlying spontaneous oscillation and rhythmic firing in rat subthalamic neurons. Journal of Neuroscience 19(17), 7617–7628 (1999)
- (10) Bullmore, E., Sporns, O.: Complex brain networks: Graph theoretical analysis of structural and functional systems. Nature Reviews Neuroscience 10(3), 186–198 (2009)
- (11) Buzsáki, G.: Large-scale recording of neuronal ensembles. Nature Neuroscience 7(5), 446–451 (2004)
- (12) Cagnan, H., Duff, E., Brown, P.: The relative phases of basal ganglia activities dynamically shape effective connectivity in parkinson’s disease. Brain 138(6), 1667–1678 (2015)
- (13) Calabresi, P., Picconi, B., Tozzi, A., Ghiglieri, V., Di Filippo, M.: Direct and indirect pathways of basal ganglia: A critical reappraisal. Nature Neuroscience 17(8), 1022–1030 (2014)
- (14) Chesselet, M.F., Delfs, J.: Basal ganglia and movement disorders: An update. Trends in Neurosciences 19(10), 417–422 (1996)
- (15) Compte, A., Brunel, N., Goldman-Rakic, P., Wang, X.J.: Synaptic mechanisms and network dynamics underlying spatial working memory in a cortical network model. Cerebral Cortex 10(9), 910–923 (2000)
- (16) Cooper, A., Stanford, I.: Electrophysiological and morphological characteristics of three subtypes of rat globus pallidus neurone in vitro. Journal of Physiology 527(2), 291–304 (2000)
- (17) Crowell, A., Ryapolova-Webb, E., Ostrem, J., Galifianakis, N., Shimamoto, S., Lim, D., Starr, P.: Oscillations in sensorimotor cortex in movement disorders: An electrocorticography study. Brain 135(2), 615–630 (2012)
- (18) De Santos-Sierra, D., Sendiña-Nadal, I., Leyva, I., Almendral, J., Anava, S., Ayali, A., Papo, D., Boccaletti, S.: Emergence of small-world anatomical networks in self-organizing clustered neuronal cultures. PLoS ONE 9(1) (2014)
- (19) Deco, G., Jirsa, V., Robinson, P., Breakspear, M., Friston, K.: The dynamic brain: From spiking neurons to neural masses and cortical fields. PLoS Computational Biology 4(8) (2008)
- (20) Deco, G., Senden, M., Jirsa, V.: How anatomy shapes dynamics: A semi-analytical study of the brain at rest by a simple spin model. Frontiers in Computational Neuroscience 6, 1–7 (2012)
- (21) Defazio, G.: The epidemiology of primary dystonia: Current evidence and perspectives. European Journal of Neurology 17(SUPPL. 1), 9–14 (2010)
- (22) DeLong, M.: Primate models of movement disorders of basal ganglia origin. Trends in Neurosciences 13(7), 281–285 (1990)
- (23) Deuschl, G., Schade-Brittinger, C., Krack, P., Volkmann, J., Schäfer, H., Bötzel, K., Daniels, C., Deutschländer, A., Dillmann, U., Eisner, W., Gruber, D., Hamel, W., Herzog, J., Hilker, R., Klebe, S., Kloß, M., Koy, J., Krause, M., Kupsch, A., Lorenz, D., Lorenzl, S., Mehdorn, H., Moringlane, J., Oertel, W., Pinsker, M., Reichmann, H., Reuß, A., Schneider, G.H., Schnitzler, A., Steude, U., Sturm, V., Timmermann, L., Tronnier, V., Trottenberg, T., Wojtecki, L., Wolf, E., Poewe, W., Voges, J.: A randomized trial of deep-brain stimulation for parkinson’s disease. New England Journal of Medicine 355(9), 896–908 (2006)
- (24) Dorval, A., Kuncel, A., Birdno, M., Turner, D., Grill, W.: Deep brain stimulation alleviates parkinsonian bradykinesia by regularizing pallidal activity. Journal of Neurophysiology 104(2), 911–921 (2010)
- (25) Dorval, A., Russo, G., Hashimoto, T., Xu, W., Grill, W., Vitek, J.: Deep brain stimulation reduces neuronal entropy in the mptp-primate model of parkinson’s disease. Journal of Neurophysiology 100(5), 2807–2818 (2008)
- (26) Ermentrout, B., Terman, D.: Neural networks as spatio-temporal pattern-forming systems. Springer, New York (2012)
- (27) Eusebio, A., Brown, P.: Oscillatory activity in the basal ganglia. Parkinsonism and Related Disorders 13(SUPPL. 3), S434–S436 (2007)
- (28) Fang, J., Chen, H., Cao, Z., Jiang, Y., Ma, L., Ma, H., Feng, T.: Impaired brain network architecture in newly diagnosed parkinson’s disease based on graph theoretical analysis. Neuroscience Letters 657, 151–158 (2017)
- (29) Fiore, V., Rigoli, F., Stenner, M.P., Zaehle, T., Hirth, F., Heinze, H.J., Dolan, R.: Changing pattern in the basal ganglia: Motor switching under reduced dopaminergic drive. Scientific Reports 6 (2016)
- (30) Gabor, D.: Theory of communication. J. IEE London 93, 429–457 (1946)
- (31) Gafarov, F.: Emergence of the small-world architecture in neural networks by activity dependent growth. Physica A: Statistical Mechanics and its Applications 461, 409–418 (2016)
- (32) Gagnon, D., Petryszyn, S., Sanchez, M., Bories, C., Beaulieu, J., De Koninck, Y., Parent, A., Parent, M.: Striatal neurons expressing d1 and d2 receptors are morphologically distinct and differently affected by dopamine denervation in mice. Scientific Reports 7 (2017)
- (33) Galvan, A., Wichmann, T.: Pathophysiology of parkinsonism. Clinical Neurophysiology 119(7), 1459–1474 (2008)
- (34) Gouty-Colomer, L.A., Michel, F., Baude, A., Lopez-Pauchet, C., Dufour, A., Cossart, R., Hammond, C.: Mouse subthalamic nucleus neurons with local axon collaterals. Journal of Comparative Neurology 526(2), 275–284 (2018)
- (35) He, B.J., Zempel, J.M., Snyder, A.Z., Raichle, M.E.: The temporal structures and functional significance of scale-free brain activity. Neuron 66(3), 353–369 (2010)
- (36) Holsheimer, J., Dijkstra, E., Demeulemeester, H., Nuttin, B.: Chronaxie calculated from current-duration and voltage-duration data. Journal of Neuroscience Methods 97(1), 45–50 (2000)
- (37) Holtzheimer, P., Mayberg, H.: Deep brain stimulation for psychiatric disorders. Annual Review of Neuroscience 34, 289–307 (2011)
- (38) Izhikevich, E., Kuramoto, Y.: Weakly coupled oscillators. Encyclopedia of Mathematical Physics: Five-Volume Set pp. 448–453 (2004)
- (39) Kita, H., Kitai, S.: Intracellular study of rat globus pallidus neurons: membrane properties and responses to neostriatal, subthalamic and nigral stimulation. Brain Research 564(2), 296–305 (1991)
- (40) Koeglsperger, T., Palleis, C., Hell, F., Mehrkens, J., Bötzel, K.: Deep brain stimulation programming for movement disorders: Current concepts and evidence-based strategies. Frontiers in Neurology 10 (2019)
- (41) Krack, P., Volkmann, J., Tinkhauser, G., Deuschl, G.: Deep brain stimulation in movement disorders: From experimental surgery to evidence-based therapy. Movement Disorders 34(12), 1795–1810 (2019)
- (42) Kuramoto, Y.: Chemical Oscillations, Waves, and Turbulence. Springer, New York (1984)
- (43) Kuramoto, Y.: Cooperative dynamics of oscillator community –a study based on lattice of rings –. Progress of Theoretical Physics 79 (1984)
- (44) Köhling, R., Koch, U.R., Hamann, M., Richter, A.: Increased excitability in cortico-striatal synaptic pathway in a model of paroxysmal dystonia. Neurobiology of Disease 16(1), 236–245 (2004)
- (45) Kühn, A., Kempf, F., Brücke, C., Doyle, L., Martinez-Torres, I., Pogosyan, A., Trottenberg, T., Kupsch, A., Schneider, G.H., Hariz, M., Vandenberghe, W., Nuttin, B., Brown, P.: High-frequency stimulation of the subthalamic nucleus suppresses oscillatory activity in patients with parkinson’s disease in parallel with improvement in motor performance. Journal of Neuroscience 28(24), 6165–6173 (2008)
- (46) Laing, C., Chow, C.: A spiking neuron model for binocular rivalry. Journal of Computational Neuroscience 12(1), 39–53 (2002)
- (47) de Lau, L., Breteler, M.: Epidemiology of parkinson’s disease. Lancet Neurology 5(6), 525–535 (2006)
- (48) Lowet, E., Roberts, M., Bonizzi, P., Karel, J., De Weerd, P.: Quantifying neural oscillatory synchronization: A comparison between spectral coherence and phase-locking value approaches. PLoS ONE 11(1) (2016)
- (49) Luo, F., Kiss, Z.: Cholinergic mechanisms of high-frequency stimulation in entopeduncular nucleus. Journal of Neurophysiology 115(1), 60–67 (2016)
- (50) Maiti, P., Manna, J., Dunbar, G., Maiti, P., Dunbar, G.: Current understanding of the molecular mechanisms in parkinson’s disease: Targets for potential treatments. Translational Neurodegeneration 6(1) (2017)
- (51) Manos, T., Zeitler, M., Tass, P.: Short-term dosage regimen for stimulation-induced long-lasting desynchronization. Frontiers in Physiology 9(APR) (2018)
- (52) Marschler, C., Faust-Ellsässer, C., Starke, J., Van Hemmen, J.: Bifurcation of learning and structure formation in neuronal maps. EPL 108(4) (2014)
- (53) McConnell, G., So, R., Hilliard, J., Lopomo, P., Grill, W.: Effective deep brain stimulation suppresses low-frequency network oscillations in the basal ganglia by regularizing neural firing patterns. Journal of Neuroscience 32(45), 15657–15668 (2012)
- (54) Moon, S., Cook, K., Rajendran, K., Kevrekidis, I., Cisternas, J., Laing, C.: Coarse-grained clustering dynamics of heterogeneously coupled neurons. Journal of Mathematical Neuroscience 5(1), 1–20 (2015)
- (55) Netoff, T., Clewley, R., Arno, S., Keck, T., White, J.: Epilepsy in small-world networks. Journal of Neuroscience 24(37), 8075–8083 (2004)
- (56) Newman, M.: The structure and function of complex networks. SIAM Review 45(2), 167–256 (2003)
- (57) Ogawa, N., Hirose, Y., Ohara, S., Ono, T., Watanabe, Y.: A simple quantitative bradykinesia test in mptp-treated mice. Research Communications in Chemical Pathology and Pharmacology 50(3), 435–441 (1985)
- (58) Pavlides, A., Hogan, S., Bogacz, R.: Computational models describing possible mechanisms for generation of excessive beta oscillations in parkinson’s disease. PLoS Computational Biology 11(12), e1004609 (2015)
- (59) Pavlides, A., John Hogan, S., Bogacz, R.: Improved conditions for the generation of beta oscillations in the subthalamic nucleus-globus pallidus network. European Journal of Neuroscience 36(2), 2229–2239 (2012)
- (60) Pikovsky, A., Rosenblum, M., Kurths, J.: Synchronization: A Universal Concept in Nonlinear Sciences. Cambridge University Press (2001)
- (61) Plenz, D., Kital, S.: A basal ganglia pacemaker formed by the subthalamic nucleus and external globus pallidus. Nature 400(6745), 677–682 (1999)
- (62) Popovych, O., Tass, P.: Multisite delayed feedback for electrical brain stimulation. Frontiers in Physiology 9(FEB) (2018)
- (63) Popovych, O., Tass, P.: Adaptive delivery of continuous and delayed feedback deep brain stimulation - a computational study. Scientific Reports 9(1) (2019)
- (64) Prakash, K., Bannur, B., Chavan, M., Saniya, K., Kumar, S., Rajagopalan, A.: Neuroanatomical changes in parkinson’s disease in relation to cognition: An update. Journal of Advanced Pharmaceutical Technology and Research 7(4), 123–126 (2016)
- (65) Rubin, J., Terman, D.: High frequency stimulation of the subthalamic nucleus eliminates pathological thalamic rhythmicity in a computational model. Journal of Computational Neuroscience 16(3), 211–235 (2004)
- (66) Schmidt, H., Avitabile, D., Montbrió, E., Roxin, A.: Network mechanisms underlying the role of oscillations in cognitive tasks. PLoS Computational Biology 14(9) (2018)
- (67) Schwab, B., Heida, T., Zhao, Y., Marani, E., van Gils, S., van Wezel, R.: Synchrony in parkinson’s disease: Importance of intrinsic properties of the external globus pallidus. Frontiers in Systems Neuroscience 7 (2013)
- (68) Siettos, C., Starke, J.: Multiscale modeling of brain dynamics: from single neurons and networks to mathematical tools. Wiley Interdisciplinary Reviews: Systems Biology and Medicine 8(5), 438–458 (2016)
- (69) So, R., Kent, A., Grill, W.: Relative contributions of local cell and passing fiber activation and silencing to changes in thalamic fidelity during deep brain stimulation and lesioning: A computational modeling study. Journal of Computational Neuroscience 32(3), 499–519 (2012)
- (70) So, R., McConnell, G., Grill, W.: Frequency-dependent, transient effects of subthalamic nucleus deep brain stimulation on methamphetamine-induced circling and neuronal activity in the hemiparkinsonian rat. Behavioural Brain Research 320, 119–127 (2017)
- (71) Spiliotis, K., Siettos, C.: A timestepper-based approach for the coarse-grained analysis of microscopic neuronal simulators on networks: Bifurcation and rare-events micro- to macro-computations. Neurocomputing 74(17), 3576–3589 (2011)
- (72) Stam, C., Reijneveld, J.: Graph theoretical analysis of complex networks in the brain. Nonlinear Biomedical Physics 1 (2007)
- (73) Stephens, B., Mueller, A., Shering, A., Hood, S., Taggart, P., Arbuthnott, G., Bell, J., Kilford, L., Kingsbury, A., Daniel, S., Ingham, C.: Evidence of a breakdown of corticostriatal connections in parkinson’s disease. Neuroscience 132(3), 741–754 (2005)
- (74) Strogatz, S.: Exploring complex networks. Nature 419(1), 268–276 (2001)
- (75) Tass, P.: Phase resetting in medicine and biology – stochastic modelling and data analysis. r. Springer, Berlin Heidelberg New York (1999)
- (76) Terman, D.: An introduction to dynamical systems and neuronal dynamics. Lecture Notes in Mathematics 1860, 21–68 (2005)
- (77) Terman, D., Rubin, J., Yew, A., Wilson, C.: Activity patterns in a model for the subthalamopallidal network of the basal ganglia. Journal of Neuroscience 22(7), 2963–2976 (2002)
- (78) Udupa, K., Chen, R.: The mechanisms of action of deep brain stimulation and ideas for the future development. Progress in Neurobiology 133, 27–49 (2015)
- (79) Wang, D., de Hemptinne, C., Miocinovic, S., Ostrem, J., Galifianakis, N., Luciano, M., Starr, P.: Pallidal deep-brain stimulation disrupts pallidal beta oscillations and coherence with primary motor cortex in parkinson’s disease. Journal of Neuroscience 38(19), 4556–4568 (2018)
- (80) Watts, D., Strogatz, S.: Collective dynamics of ’small-world’ networks. Nature 393(6684), 440–442 (1998)
- (81) Wichmann, T., Dostrovsky, J.: Pathological basal ganglia activity in movement disorders. Neuroscience 198, 232–244 (2011)
- (82) Xu, W., Russo, G., Hashimoto, T., Zhang, J., Vitek, J.: Subthalamic nucleus stimulation modulates thalamic neuronal activity. Journal of Neuroscience 28(46), 11916–11924 (2008)