Ba star
Characterizing the companion AGBs using surface chemical composition of barium stars ††thanks: Based on data collected using HCT/HESP, UVES and FEROS
Abstract
Barium stars are one of the important probes to understand the origin and evolution of slow neutron-capture process elements in the Galaxy. These are extrinsic stars, where the observed s-process element abundances are believed to have an origin in the now invisible companions that produced these elements at their Asymptotic Giant Branch phase of evolution. We have attempted to understand the s-process nucleosynthesis, as well as the physical properties of the companion stars through a detailed comparison of observed elemental abundances of 10 barium stars with the predictions from AGB nucleosynthesis models, FRUITY. For these stars, we have presented estimates of abundances of several elements, C, N, O, Na, Al, -elements, Fe-peak elements and neutron-capture elements Rb, Sr, Y, Zr, Ba, La, Ce, Pr, Nd, Sm and Eu. The abundance estimates are based on high resolution spectral analysis. Observations of Rb in four of these stars have allowed us to put a limit to the mass of the companion AGB stars. Our analysis clearly shows that the former companions responsible for the surface abundance peculiarities of these stars are low-mass AGB stars. Kinematic analysis have shown the stars to be members of Galactic disk population.
keywords:
stars: Abundances - stars: chemically peculiar - stars: nucleosynthesis - stars: individual1 Introduction
Understanding the nucleosynthesis and evolution of Asymptotic Giant Branch (AGB) stars are of primary importance as they are the major factories of some key elements in the Universe (Busso et al. 1999, Herwig 2005). They are the predominant sites for the slow neutron-capture nucleosyntesis, and major contributors of elements heavier than iron; upto half of all the heavy elements are produced through s-process (Busso et al. 1999). There are certain isotopes like 86Sr, 96Mo, 104Pd, 116Sn etc., which are known to be produced only through the s-process. It has been estimated that a third of the total carbon content in the Galaxy is produced in AGB stars, which is about the same amount as produced in CCSNe and Wolf-Rayet stars (Dray et al. 2003). Besides these, the intermediate-mass AGB stars are the major producers of 14N in the Galaxy (Henry et al. 2000, Merle et al. 2016).
The exact physical conditions and nucleosynthetic processes occuring at the interior of AGB stars are not clearly understood that hinders a better understanding of the contribution of these stars to the Galactic chemical enrichment. This demands a need for detailed chemical composition studies for an extended sample of AGB stars. However, the spectra of the AGB stars are complicated as it is overwhelmed with the molecular contributions arising due to their low photospheric temperature. This makes the derivation of exact elemental abundance difficult. In this regard, the extrinsic stars, which are known to have received products of AGB phase of evolution via binary mass transfer mechanisms, form vital tools to trace the AGB nucleosynthesis. The important classes of such extrinsic stars are barium stars as the analysis of their generally hotter spectra is more accurate (Bidelman & Keenan 1951), CH stars (Keenan 1942) and CEMP-s stars (Beers & Christlieb 2005). Most of them are radial velocity variables (McClure et al. 1980, McClure 1983, 1984, McClure & Woodsworth 1990, Udry et al. 1998a,b, Lucatello et al. 2005) associated with a now invisible white dwarf companion.
Detailed studies on barium stars include Allen & Barbuy (2006a), Smiljanic et al. (2007), de Castro et al. (2016), Yang et al. (2016) and many others. However, these studies have not included abundances of several heavy elements such as Rb for all the stars and also for C, N and O. In this work, we have undertaken to carry out a detailed spectroscopic analysis for a sample of ten barium/CH star candidates and derived whenever possible the abundances of C, N, O and the neutron density dependent [Rb/Zr] abundance ratio to investigate the neutron source in the former companion AGB stars. There are two important neutron sources for the s-process in the He intershell of AGB stars: 13C(, n)16O reaction during the radiative inter-pulse period and 22Ne(, n)25Mg reaction during the convective thermal pulses. 13C(, n)16O reaction is the dominant neutron source in low-mass AGB stars with initial mass 3 M⊙. The temperature T 90 106 K required for the operation of this reaction is provides a neutron density Nn 108 cm-3 in a timescale of 103 years (Straniero et al. 1995, Gallino et al. 1998, Goriely & Mowlavi 2000, Busso et al. 2001). A temperature 300106 K, required for the activation of 22Ne source is achieved during the TPs in intermediate-mass AGB stars (initial mass 4 M⊙). It produces a neutron density Nn 1013 cm-3 in a timescale of 10 years. The temperature required for the 22Ne source is reached in low-mass stars during the last few TPs providing Nn 1010 - 1011 cm-3 (Iben 1975, Busso et al. 2001). The Rb is produced only when the Nn 5 108 cm-3, otherwise Sr, Y, Zr etc. are produced. Hence, the [Rb/Zr] ratio can be used as an indicator of mass of AGB stars. We could determine Rb abundance in four of our program stars; HD 32712, HD 36650, HD 179832 and HD 211173.
In section 2, we describe the source of the spectra used in this study. Section 3 describes the methodology used for the determination of atmospheric parameters, elemental abundances and radial velocities. A discussion on the stellar mass determination is also provided in the same section. A comparison of our result with the literature values are presented in section 3. In section 4, we discuss the procedures adopted for the abundance determination of different elements. Section 5 provides a discussion on abundance uncertainties. Section 6 provides the discussion on the elemental abundance ratios and their interpretations based on the existing nucleosynthesis theories. This section also provides a comparison of the observational data with the FRUITY models of Cristallo et al. (2009, 2011, 2015b) and a parametric model based analysis. A discussion on the individual stars are also given in the same section. Conclusions are drawn in section 7.
2 OBJECT SELECTION, DATA ACQUISITION AND DATA REDUCTION
The objects analyzed in this study are taken from the CH star catalog of Bartkevicius (1996). Six of them are also found listed in the barium star catalog of Lü (1991). These stars lie among the typical CH stars in the color – magnitude ((B-V) v/s MV) diagram. The spectra of these objects are acquired from three different sources. For HD 219116, HD 154276 and HD 147609, the high resolution spectra () were obtained on October 2015, May 2017 and June 2017 using the high resolution fiber fed Hanle Echelle SPectrograph (HESP) attached to the 2m Himalayan Chandra Telescope (HCT) at the Indian Astronomical Observatory, Hanle. The wavelength coverage of the HESP spectra spans from 3530 - 9970 Å. The Data are reduced following the standard procedures using various tasks in Image Reduction and Analysis Facility (IRAF111IRAF is distributed by the National Optical Astronomical Observatories, which is operated by the Association for Universities for Research in Astronomy, Inc., under contract to the National Science Foundation) software. For HD 24035 and HD 207585 high resolution spectra () are obtained with the UVES (Ultraviolet and Visual Echelle Spectrograph) of the 8.2m Very Large Telescope (VLT) of ESO at Cerro Paranal, Chile. A high resolution spectrum of HD 219116 is also obtained from UVES/VLT. The wavelength coverage of the UVES spectra spans from 3290 - 6650 Å. For HD 32712, HD 36650, HD 94518, HD 211173 and HD 179832, high resolution spectra () are obtained with the FEROS (Fiber-fed Extended Range Optical Spectrograph) of the 1.52 m telescope of ESO at La Silla, Chile. The wavelength coverage of the FEROS spectra spans from 3520 - 9200 Å. Basic data of the program stars along with the source of spectra are given in the Table 1. A few sample spectra are shown in Figure 1.

| Star | RA | Dec. | B | V | J | H | K | Exposure | Date of obs. | Source |
|---|---|---|---|---|---|---|---|---|---|---|
| (seconds) | of spectrum | |||||||||
| HD 24035 | 03 43 42.53 | 36 32.80 | 9.74 | 8.51 | 6.567 | 6.043 | 5.919 | 900 | 05/04/2002 | UVES |
| HD 32712 | 05 01 34.91 | 58 31 15.05 | 9.71 | 8.55 | 6.634 | 6.054 | 5.912 | 1200 | 11/11/1999 | FEROS |
| HD 36650 | 05 27 42.92 | 68 04 27.16 | 9.91 | 8.79 | 6.812 | 6.297 | 6.190 | 1200 | 10/11/1999 | FEROS |
| HD 94518 | 10 54 12.20 | 31 09 34.58 | 8.95 | 8.36 | 7.182 | 6.891 | 6.824 | 900 | 02/01/2000 | FEROS |
| HD 147609 | 16 21 51.99 | +27 22 27.19 | 9.69 | 9.18 | 8.211 | 8.035 | 7.948 | 2400(3) | 01/06/2017 | HESP |
| HD 154276 | 17 03 49.15 | +17 11 21.08 | 9.80 | 9.13 | 7.911 | 7.624 | 7.549 | 2400(3) | 06/05/2017 | HESP |
| HD 179832 | 19 16 30.00 | 49 13 13.01 | 9.46 | 8.44 | 6.660 | 6.163 | 6.031 | 600 | 14/07/2000 | FEROS |
| HD 207585 | 21 50 34.71 | 24 11 11.68 | 10.50 | 9.78 | 8.633 | 8.341 | 8.301 | 240 | 24/04/2002 | UVES |
| HD 211173 | 22 15 57.01 | 31 51 38.52 | 9.43 | 8.49 | 6.810 | 6.332 | 6.218 | 600 | 14/07/2000 | FEROS |
| HD 219116 | 23 13 30.24 | 17 22 08.71 | 10.29 | 9.25 | 7.602 | 7.137 | 7.012 | 240 | 19/05/2002 | UVES |
| 2400(3) | 30/10/2015 | HESP |
The numbers in the parenthesis with exposures indicate the number of frames taken.
3 STELLAR ATMOSPHERIC PARAMETERS AND RADIAL VELOCITY ESTIMATION
We have estimated the photometric temperature of the program stars using the temperature calibration equations of Alonso et al. (1994, 1996) for dwarfs and Alonso et al. (1999, 2001) for giants, and following the detailed procedures as described in our earlier papers (Goswami et al. 2006, 2016). We made use of the 2MASS J, H, K magnitudes taken from SIMBAD (Cutri et al. 2003) for this calculation. The photometric temperature estimates had been used as an initial guess for deriving the spectroscopic effective temperature of each object.
To determine the stellar atmospheric parameters, we have used a set of clean, unblended Fe I and Fe II lines with excitation potential in the range 0.0 - 6.0 eV and equivalent width 20 - 180 mÅ. IRAF software is used for the equivalent width measurement. A pseudo continuum (at 1) is fitted to the observed spectrum using the spline function. The equivalent width is measured for each spectral line by fitting a Gaussian profile. An initial model atmosphere was selected from the Kurucz grid of model atmosphere with no convective overshooting (http://cfaku5.cfa.hardvard.edu/) using the photometric temperature estimate and the guess of log g value for giants/dwarfs. A final model atmosphere was adopted by the iterative method from the initially selected one, using the most recent version of the radiative transfer code MOOG (Sneden 1973) based on the assumptions of Local Thermodynamic Equilibrium (LTE).
The effective temperature is determined by the method of excitation equilibrium, forcing the slope of the abundances from Fe I lines versus excitation potentials of the measured lines to be zero. The micro-turbulent velocity at a fixed effective temperature is determined by demanding that there will be no dependence of the derived Fe I abundance on the reduced equivalent width of the corresponding lines. Micro-turbulent velocity is fixed at a value which gives zero slope for the plot of equivalent width versus abundances of Fe I lines. The surface gravity, log g value is determined by means of ionization balance, that is by forcing the Fe I and Fe II lines to produce the same abundance at the selected effective temperature and microturbulent velocity. The estimated abundances from Fe I to Fe II lines as a function of excitation potential and equivalent widths, respectively, are shown in figures that are made available as on-line materials.
A comparison of our results with the literature values whenever available shows a close match well within the error limits.
Radial velocities of the program stars are calculated using a set of clean and unblended lines of several elements. In Table 2 we present the derived atmospheric parameters and radial velocities of the program stars. Our radial velocity estimates are used to study the kinematic properties of the stars. A table giving the results from kinematic analysis is presented in the Appendix (Table 14). Three objects in our sample, HD 24035, HD 147609 and HD 207585 are confirmed binaries with orbital periods of 377.83 0.35 days (Udry et al. 1998a), 672 2 days (Escorza et al. 2019), and 1146 1.5 days ( Escorza et al. 2019) respectively. Our estimated radial velocity (1.56 km-1 ) for HD 24035 is slightly higher than the range of radial velocities found in literature (2.14 to 19.81) for this object. However, for HD 207585 (65.9 km-1) and HD 147609 (18.17 -1), our estimates fall well within the range of velocities available in literature, i.e., (52.2 to 74.1) and (19.2 to 11.9) respectively.
| Star | Teff | log g | [Fe I/H] | [Fe II/H] | Vr | Vr | |
|---|---|---|---|---|---|---|---|
| (K) | cgs | (km s-1) | (km s-1) | (km s-1) | |||
| HD 24035 | 4750 | 2.20 | 1.58 | 0.510.19 | 0.500.16 | 1.560.25 | 12.510.13 |
| HD 32712 | 4550 | 2.53 | 1.24 | 0.250.12 | 0.250.12 | +10.370.02 | +11.270.16 |
| HD 36650 | 4880 | 2.40 | 1.30 | 0.020.12 | 0.020.14 | +36.400.19 | +31.520.47 |
| HD 94518 | 5700 | 3.86 | 1.30 | 0.550.10 | 0.550.12 | +92.200.43 | 92.6890.015 |
| HD 147609 | 6350 | 3.50 | 1.55 | 0.280.16 | 0.280.12 | 18.171.47 | 17.110.82 |
| HD 154276 | 5820 | 4.28 | 0.63 | 0.090.13 | 0.100.14 | 64.171.42 | 55.940.17 |
| HD 179832 | 4780 | 2.70 | 0.99 | +0.230.04 | +0.220.06 | +6.730.03 | +7.640.13 |
| HD 207585 | 5800 | 3.80 | 1.00 | 0.380.12 | 0.380.11 | 65.970.07 | 60.101.20 |
| HD 211173 | 4900 | 2.60 | 1.15 | 0.170.10 | 0.170.09 | 27.840.25 | 28.190.63 |
| HD 219116 | 5050 | 2.50 | 1.59 | 0.450.11 | 0.440.11 | 40.900.25 | 11.007.30 |
In Columns 7 and 8 we present radial velocities from the respective spectra and SIMBAD respectively
We have determined the mass of the program stars from their
location in Hertzsprung-Russell diagram (Girardi et al. 2000 data base
of evolutionary tracks) using the spectroscopic temperature estimate,
Teff, and the luminosity, log.
log (L/L⊙)=0.4(Mbol⊙ - V - 5 - 5log () + AV - BC)
The visual magnitudes V are taken from Simbad and the parallaxes
from Gaia DR2 (https://gea.esac.esa.int/archive/). The bolometric
correction, BC, is calculated using the empirical calibrations of
Alonso et al. (1995) for dwarfs and Alonso et al. (1999) for giants.
The interstellar extinction AV is calculated using the calibration
equations given in Chen et al. (1998). From the estimated mass,
log g is calculated using
log (g/g⊙)= log (M/M⊙) + 4log (Teff/Teff⊙) - log (L/L⊙)
We have adopted the solar values log g⊙ = 4.44, Teff⊙ = 5770K and Mbol⊙ = 4.74 mag.
We have used z = 0.004 tracks for HD 24035 and HD 94518; z = 0.008 for HD 207585 and HD 219116; z = 0.019 for HD 32712, HD 36650, HD 147609, HD 154276 and HD 211173, and z = 0.030 for HD 179832. As an example, the evolutionary tracks for a few objects are shown in Figure 2. The mass estimates are presented in Table 3.
| Star name | Parallax | log(L/L⊙) | Mass(M⊙) | log g | log g (spectroscopic) | |
|---|---|---|---|---|---|---|
| (mas) | (cgs) | (cgs) | ||||
| HD 24035 | 4.6120.101 | 1.4010.05 | 1.3390.02 | 0.700.21 | 2.610.02 | 2.20 |
| HD 32712 | 2.6210.026 | 0.0810.022 | 1.8680.01 | 1.800.26 | 2.410.005 | 2.53 |
| HD 36650 | 2.6550.027 | 0.4740.023 | 1.7100.01 | 2.200.26 | 2.780.01 | 2.40 |
| HD 94518 | 13.7740.05 | 3.8720.01 | 0.3510.003 | 0.850.06 | 4.000.005 | 3.86 |
| HD 147609 | 4.3010.107 | 1.9550.055 | 1.1180.02 | 1.700.05 | 3.710.02 | 3.50 |
| HD 154276 | 11.5540.025 | 4.3390.005 | 0.1640.002 | 1.000.05 | 4.290.002 | 4.28 |
| HD 179832 | 2.9140.052 | 0.2160.041 | 1.8140.02 | 2.50.28 | 2.700.02 | 2.70 |
| HD 207585 | 5.31460.407 | 3.3130.165 | 0.5750.065 | 1.050.05 | 3.900.045 | 3.80 |
| HD 211173 | 3.3870.066 | 0.8390.042 | 1.5640.02 | 2.200.24 | 2.930.02 | 2.60 |
| HD 219116 | 1.5840.044 | 0.0020.06 | 1.9010.02 | 2.350.17 | 2.680.015 | 2.50 |

| Star | Teff | log g | [Fe I/H] | [Fe II/H] | Ref. | |
|---|---|---|---|---|---|---|
| (K) | (km s-1) | |||||
| HD 24035 | 4750 | 2.20 | 1.58 | 0.51 | 0.50 | 1 |
| 4700 | 2.50 | 1.30 | 0.23 | 0.28 | 2 | |
| 4500 | 2.00 | - | 0.14 | - | 3 | |
| HD 32712 | 4550 | 2.53 | 1.24 | 0.25 | 0.25 | 1 |
| 4600 | 2.10 | 1.30 | 0.24 | 0.25 | 2 | |
| HD 36650 | 4880 | 2.40 | 1.30 | 0.02 | 0.02 | 1 |
| 4800 | 2.30 | 1.50 | 0.28 | 0.28 | 2 | |
| HD 94518 | 5700 | 3.86 | 1.30 | 0.55 | 0.55 | 1 |
| 5859 | 4.20 | 4.15 | 0.56 | - | 4 | |
| 5859 | 4.15 | 1.20 | 0.49 | 0.50 | 5 | |
| 5709 | 3.86 | 2.23 | 0.84 | - | 6 | |
| HD 147609 | 6350 | 3.50 | 1.55 | 0.28 | 0.28 | 1 |
| 6411 | 3.90 | 1.26 | 0.23 | - | 7 | |
| 5960 | 3.30 | 1.50 | 8 | |||
| 6270 | 3.50 | 1.20 | - | - | 9 | |
| 6300 | 3.61 | 1.20 | - | - | 10 | |
| HD 154276 | 5820 | 4.28 | 0.63 | 0.09 | 0.10 | 1 |
| 5722 | 4.28 | 0.93 | 0.29 | - | 5 | |
| 5731 | 4.35 | 1.28 | 0.30 | - | 11 | |
| HD 179832 | 4780 | 2.70 | 0.99 | +0.23 | +0.22 | 1 |
| HD 207585 | 5800 | 3.80 | 1.00 | 0.38 | 0.38 | 1 |
| 5800 | 4.00 | - | 0.20 | - | 3 | |
| 5400 | 3.30 | 1.80 | 0.57 | - | 12 | |
| 5400 | 3.50 | 1.50 | 0.50 | - | 13 | |
| HD 211173 | 4900 | 2.60 | 1.15 | 0.17 | 0.17 | 1 |
| 4800 | 2.50 | - | 0.12 | - | 3 | |
| HD 219116 | 5050 | 2.50 | 1.59 | 0.45 | 0.44 | 1 |
| 4900 | 2.30 | 1.60 | 0.61 | 0.62 | 2 | |
| 4800 | 1.80 | - | 0.34 | - | 3 | |
| 5300 | 3.50 | 2.00 | 0.30 | - | 14 | |
| 5300 | 3.50 | - | 0.34 | - | 15 |
References: 1. Our work, 2. de Castro et al. (2016), 3. Masseron et al. (2010),
4. Battistini & Bensby (2015), 5. Bensby et al. (2014), 6. Axer et al. (1994),
7. Escorza et al. (2019) 8. Allen & Barbuy (2006a), 9. North et al. (1994a),
10. Thévenin & Idiart (1999), 11. Ramirez et al. (2013), 12. Luck & Bond (1991),
13. Smith & Lambert (1986a), 14. Smith et al. (1993), 15. Cenarro et al. (2007)
4 ABUNDANCE DETERMINATION
Abundances of most of the elements are determined from the measured equivalent width of lines of the neutral and ionized atoms using the most recent version of MOOG and the adopted model atmospheres. Absorption lines corresponding to different elements are identified by comparing closely the spectra of program stars with the Doppler corrected spectrum of the star Arcturus. The log and the lower excitation potential values of the lines are taken from the Kurucz database of atomic line lists. The equivalent width of the spectral lines are measured using various tasks in IRAF. A master line list including all the elements was generated. For the elements showing hyper-fine splitting and for molecular bands, spectrum synthesis of MOOG was used to find the abundances. Elements Sc, V, Mn, Co, Cu, Ba, La and Eu are affected by Hyper-fine Splitting. The hyper-fine components of Sc and Mn are taken from Prochaska & Mcwilliam 2000, V, Co and Cu from Prochaska et al. 2000, Ba from Mcwilliam 1998, La from Jonsell et al. 2006, Eu from Worely et al. 2013. All the abundances are found relative to the respective solar values (Asplund et al. 2009).
The abundance estimates are given in Tables 6 through 8 and the lines used for the the abundance estimation are presented in Tables 11 and 12. The detailed abundance analyses and discussion are given in the section 6.


5 ABUNDANCE UNCERTAINTIES
The uncertainties in the elemental abundances has two main components:
random error and systematic error. Random error arises from the
uncertainties in the line parameters such as measured equivalent width,
line blending and oscillator strength. Since the random error varies
inversely as the square-root of the number of lines, we can reduce
this error by using maximum possible number of lines. Systematic
error is due to the uncertainties in the adopted stellar atmospheric
parameters.
The total uncertainty in the elemental abundance log is
calculated as;
= + + +
+
where = .
is the standard deviation of the abundances derived from the N
number of lines of the particular species. The ’s are
the typical uncertainties in the stellar atmospheric parameters, which are
Teff 100 K, log g 0.2 dex, 0.2 kms-1 and [Fe/H] 0.1 dex. The abundance uncertainties arising
from the error of each stellar atmospheric parameters is estimated by
varying one parameter at a time by an amount equal to their corresponding
uncertainty, by keeping others the same and computing the changes in
the abundances. We have done this procedure for a representative star,
HD 211173, in our sample with the assumption that the uncertainties
due to different parameters are independent, following de Castro
et al. (2016), Karinkuzhi et al. (2018) and Cseh et al. (2018). The
estimated differential abundances is given in
Table 5. The procedure has been applied
to the abundances estimated from the equivalent width measurement as
well as the spectral synthesis calculation.
Finally, the uncertainty in [X/Fe] is calculated as,
= + .
| Element | Teff | Teff | log g | log g | [Fe/H] | [Fe/H] | ()1/2 | ()1/2 | ||||
|---|---|---|---|---|---|---|---|---|---|---|---|---|
| (+100 K) | (100 K) | (+0.2 dex) | (0.2 dex) | (+0.2 kms-1) | (0.2 kms-1) | (+0.1 dex) | (0.1 dex) | (+) | () | (+) | () | |
| C | 0.00 | 0.00 | +0.03 | 0.03 | 0.03 | +0.03 | +0.01 | 0.01 | 0.04 | 0.04 | 0.19 | 0.18 |
| N | +0.10 | 0.10 | 0.00 | 0.00 | +0.02 | 0.02 | +0.05 | 0.05 | 0.11 | 0.11 | 0.21 | 0.21 |
| O | 0.19 | +0.19 | +0.06 | 0.06 | 0.00 | 0.00 | 0.00 | 0.00 | 0.20 | 0.20 | 0.27 | 0.26 |
| Na I | +0.07 | 0.08 | 0.02 | +0.02 | 0.05 | +0.05 | 0.00 | +0.01 | 0.09 | 0.10 | 0.21 | 0.21 |
| Mg I | +0.06 | 0.05 | 0.00 | +0.01 | 0.06 | +0.07 | 0.00 | +0.01 | 0.08 | 0.09 | 0.21 | 0.20 |
| Al I | +0.06 | 0.07 | 0.00 | 0.00 | 0.02 | +0.02 | 0.00 | 0.00 | 0.06 | 0.07 | 0.20 | 0.19 |
| Si I | 0.03 | +0.03 | +0.04 | 0.04 | 0.03 | +0.03 | +0.01 | 0.01 | 0.06 | 0.06 | 0.20 | 0.20 |
| Ca I | +0.10 | 0.11 | 0.04 | +0.03 | 0.10 | +0.09 | 0.00 | 0.00 | 0.15 | 0.15 | 0.24 | 0.23 |
| Sc II | 0.02 | +0.02 | +0.09 | 0.09 | 0.09 | +0.08 | +0.02 | 0.03 | 0.13 | 0.13 | 0.22 | 0.21 |
| Ti I | +0.14 | 0.15 | 0.01 | +0.01 | 0.08 | +0.08 | 0.00 | 0.00 | 0.16 | 0.17 | 0.24 | 0.24 |
| Ti II | 0.02 | 0.00 | +0.07 | 0.08 | 0.10 | +0.09 | +0.02 | 0.03 | 0.13 | 0.12 | 0.23 | 0.22 |
| V I | +0.16 | 0.17 | 0.01 | 0.00 | 0.07 | +0.07 | 0.01 | +0.01 | 0.18 | 0.18 | 0.25 | 0.25 |
| Cr I | +0.13 | 0.13 | 0.02 | +0.02 | 0.13 | +0.12 | 0.00 | 0.00 | 0.18 | 0.18 | 0.26 | 0.25 |
| Cr II | 0.08 | +0.07 | +0.10 | 0.09 | 0.08 | +0.09 | +0.01 | 0.02 | 0.15 | 0.15 | 0.25 | 0.24 |
| Mn I | +0.09 | 0.10 | 0.02 | +0.01 | 0.16 | +0.14 | 0.01 | 0.00 | 0.18 | 0.17 | 0.26 | 0.24 |
| Fe I | +0.07 | 0.07 | 0.00 | 0.01 | 0.13 | +0.12 | +0.10 | 0.10 | 0.18 | 0.17 | – | – |
| Fe II | 0.09 | +0.07 | +0.10 | 0.10 | 0.10 | +0.09 | +0.10 | 0.10 | 0.20 | 0.18 | – | – |
| Co I | +0.07 | 0.07 | +0.02 | 0.03 | 0.06 | +0.06 | +0.01 | 0.02 | 0.09 | 0.10 | 0.20 | 0.20 |
| Ni I | +0.04 | 0.03 | +0.02 | 0.02 | 0.10 | +0.10 | +0.01 | 0.01 | 0.11 | 0.11 | 0.21 | 0.20 |
| Cu I | +0.09 | 0.09 | 0.01 | 0.00 | 0.15 | +0.12 | +0.03 | 0.02 | 0.18 | 0.15 | 0.25 | 0.23 |
| Zn I | 0.05 | +0.06 | +0.07 | 0.06 | 0.08 | +0.09 | +0.02 | 0.01 | 0.12 | 0.12 | 0.22 | 0.21 |
| Rb I | +0.10 | 0.10 | 0.00 | 0.00 | 0.03 | +0.03 | 0.00 | 0.00 | 0.10 | 0.10 | 0.21 | 0.20 |
| Sr I | +0.15 | 0.16 | 0.03 | +0.02 | 0.22 | +0.22 | 0.00 | +0.01 | 0.27 | 0.27 | 0.32 | 0.32 |
| Y I | +0.16 | 0.17 | 0.01 | 0.00 | 0.02 | +0.03 | 0.00 | +0.01 | 0.16 | 0.17 | 0.24 | 0.24 |
| Y II | 0.01 | 0.00 | +0.08 | 0.08 | 0.14 | +0.14 | +0.02 | 0.03 | 0.16 | 0.16 | 0.24 | 0.24 |
| Zr I | +0.17 | 0.19 | 0.01 | 0.00 | 0.03 | +0.03 | 0.01 | 0.00 | 0.17 | 0.19 | 0.25 | 0.26 |
| Zr II | 0.03 | +0.01 | +0.09 | 0.09 | 0.09 | +0.11 | +0.02 | 0.03 | 0.13 | 0.15 | 0.22 | 0.23 |
| Ba II | +0.02 | 0.03 | +0.05 | 0.06 | 0.19 | +0.15 | +0.03 | 0.04 | 0.20 | 0.17 | 0.27 | 0.24 |
| La II | +0.01 | 0.00 | +0.09 | 0.09 | 0.06 | +0.07 | +0.03 | 0.03 | 0.11 | 0.12 | 0.21 | 0.21 |
| Ce II | +0.01 | 0.01 | +0.09 | 0.08 | 0.11 | +0.15 | +0.04 | 0.03 | 0.15 | 0.17 | 0.23 | 0.25 |
| Pr II | +0.01 | 0.02 | +0.08 | 0.09 | 0.03 | +0.03 | +0.03 | 0.04 | 0.09 | 0.10 | 0.22 | 0.21 |
| Nd II | +0.01 | 0.02 | +0.08 | 0.09 | 0.09 | +0.09 | +0.03 | 0.04 | 0.12 | 0.11 | 0.22 | 0.21 |
| Sm II | +0.02 | 0.02 | +0.09 | 0.08 | 0.05 | +0.07 | +0.04 | 0.03 | 0.11 | 0.11 | 0.21 | 0.21 |
| Eu II | 0.02 | +0.01 | +0.09 | 0.09 | 0.03 | +0.04 | +0.03 | 0.03 | 0.10 | 0.10 | 0.21 | 0.20 |
6 Abundance analysis and DISCUSSION
6.1 Light element abundance analysis: C, N, O, 12C/13C, Na, Al, - and -peak elements
The [O I] line at 6300.304 Å is used to derive the oxygen abundances, whenever possible, otherwise, the resonance O I triplet lines at around 7770 Å are used. The O I triplet lines are known to be affected by the non-LTE effects (Eriksson & Toft 1979, Johnson et al. 1974, Baschek et al. 1977, Kiselman 1993, Amarsi et al. 2016). The corrections are made to the LTE abundance obtained with these lines following Bensby et al. (2004) and Afsar et al. (2012). The [O I] line at 6363.776 Å, is found to be blended and not usable for abundance determination in any of the stars. The spectrum synthesis fits of O I triplet lines for a few program stars are shown in Figure 3. All the three lines of the O I IR triplet gave the same abundance values, except for HD 147609. In the case of HD 147609, the lines at 7771 and 7774 Å, gave the same abundance and the line at 7775 Å, gave an abundance which is 0.15 dex lower. In this case, we have taken the average of the three values as the final oxygen abundance.
We have estimated the oxygen abundance in all the program stars except HD 24035. The derived abundance of oxygen is in the range 0.26[O/Fe]0.97. Oxygen is under abundant in HD 36650 and HD 211173 with [O/Fe] values 0.23 and 0.26 respectively. HD 32712 and HD 179832 show near-solar values. Purandardas et al. (2019) found [O/Fe]0.33 for a barium star in their sample, somewhat closer to our lower limit. A mild overabundance is found in the stars HD 154276 and HD 219116 with [O/Fe] values 0.38 and 0.21 respectively. In the other three stars, we found an [O/Fe]0.6, with HD 207585 showing the largest enhancement of 0.97. The first dredge-up (FDU) is not expected to alter the oxygen abundance.
The carbon abundances are derived using the spectral synthesis calculation of C2 band at 5165 Å, (Figure 4) for six objects. G-band of CH at 4300 Å, is used for two stars as the C2 band at 5165 Å, are not usable for the abundance determination. The objects for which we could estimate the carbon abundance using both C2 and CH bands, we find that the CH band returns a lower value for carbon by about 0.2 to 0.3 dex. We could determine the carbon abundance in all the objects except for HD 154276 and HD 179832. Carbon is found to be under abundant in most of the stars analyzed here. The [C/Fe] value ranges from 0.28 to 0.61. The stars HD 24035, HD 147609 and HD 207585 show a mild over abundance of carbon with values 0.41, 0.38 and 0.61 respectively, whereas it is near-solar in HD 32712 and HD 219116. HD 36650, HD 94518 and HD 211173 show mild under abundance with [C/Fe] values, 0.22, 0.28, 0.23 respectively. These values are consistent with those generally noticed in barium stars (Barbuy et al. 1992, North et al. 1994a).
With the estimated carbon abundances, we have derived the abundances of nitrogen using the spectrum synthesis calculation of 12CN lines at 8000 Å region in HD 32712, HD 36650, HD 94518 and HD 211173. In other objects, where this region is not usable or unavailable, CN band at 4215 Å is used. The molecular lines for CN and C2 are taken from Brooke et al. (2013), Sneden et al. (2014) and Ram et al. (2014).
The nitrogen abundance is estimated in seven of the program stars. Estimated [N/Fe] values range from 0.24 to 1.41 dex with HD 24035 and HD 94518 showing [N/Fe] 1.0 dex. Such higher values of nitrogen have already been noted in some barium stars by several authors (Smith 1984, Luck & Lambert 1985, Barbuy et al. 1992, Allen & Barbuy 2006a, Smiljanic et al. 2006, Merle at al. 2016, Karinkuzhi et al. 2018). Nitrogen enhancement with [N/Fe]1 is possible if the star is previously enriched by the pollution from a massive AGB companion experiencing Hot-Bottom Burning (HBB). In super-massive AGB stars nitrogen can be substantially produced at the base of the convective envelope when the temperature of the envelope exceeds 108 K (Doherty et al. 2014a).
We could derive the carbon isotopic ratio, 12C/13C, using the spectral synthesis calculation of the 12CN lines at 8003.292, 8003.553, 8003.910 Å, and 13CN features at 8004.554, 8004.728, 8004.781 Å, for four stars, HD 32712, HD 36650, HD 211173 and HD 219116. The values for this ratio are 20.0, 7.34, 20.0 and 7.34 respectively. Values in the range 7 - 20 (Barbuy et al. 1992, Smith et al. 1993, Smith 1984, Harris et al. 1985, Karinkuzhi et al. 2018), and 13 -33 (Tomkin & Lambert 1979, Sneden et al. 1981) are found in literature for barium stars.
The lower level of carbon enrichment and low 12C/13C ratio along with larger over abundance of nitrogen indicate that the matter has undergone CN processing and the products have been brought to the surface by the FDU. From their locations in HR diagram, the three stars for which we could estimate 12C/13C ratio are on the ascent of first giant branch (FGB). These stars have undergone the FDU at the beginning of FGB. It has been noted that less evolved barium stars show higher carbon abundance as they have not reached the FDU (Barbuy et al. 1992, Allen & Barbuy 2006a). Among our program stars, HD 207585 shows the maximum enhancement of carbon, which is on the subgiant branch. However, the star HD 94518 shows the least enrichment among the program stars despite being the less evolved one, dwarf barium star. According to Vanture (1992), if the accreted material is mixed to the hydrogen burning region of the star either during the main-sequence or the first ascent of the giant branch, certain nucleosynthesis can happen, thereby reducing the carbon abundance. Smiljanic et al. (2006) ascribes rotational mixing for reduction in the surface carbon abundance. Also, even though the star has not reached the stage of dredge-up, the difference in the mean molecular weight of the accreted material and the inherent stellar materials in the interiors can induce thermohaline mixing, and this could reduce the surface carbon abundance by an order of magnitude compared to the unaltered case (Stancliffe et al. 2007).
We have estimated the C/O ratios of the program stars except for HD 24035, HD 154276 and HD 179832. The estimated C/O1 as normally seen in barium stars (Table 13).
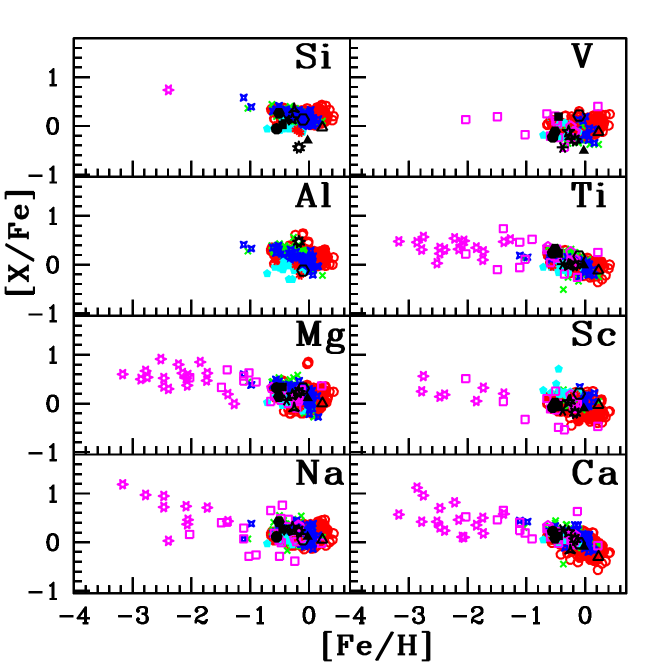
The estimated Na abundances in the range 0.05[Na/Fe]0.42 are similar to what is normally seen for disk stars, normal field giants and some barium stars (Antipova et al. 2004, de Castro et al. 2016, Karinkuzhi et al. 2018). Na, Mg and Al are produced in the carbon burning stages of massive stars (Woosely & Weaver 1995), hence the SN II are the probable sources of these elements in the disk. The thick and thin disk dwarf stars in the Galaxy do not show any trend in [Na/Fe] ratio with metallicity (Edvarsson et al. 1993, Reddy et al. 2003, Reddy et al. 2006). Similar pattern as the dwarf stars is observed in the case of field giants (Mishenina et al. 2006, Luck & Heiter 2007). Owing to the common origin, all the stars in the disk is expected to show similar abundance. An enhanced abundance of Na can be expected in AGB stars during the inter-pulse stage from 22Ne produced in the previous hot pulses via 22Ne(p, )23Na (NeNa chain) (Mowlavi 1999, Goriely & Mowlavi 2000). This Na can be brought to the surface during TDU. Hence an overabundance of Na may be expected in the barium stars. However Na enrichment can be expected in stars prior to the AGB phase. El Eid & Champagne (1995) and Antipova et al. (2004) related this over abundance of Na to the nucleosynthesis associated with the evolutionary stage of the star. According to them, Na is synthesized in the convective H-burning core of the main-sequence stars through NeNa chain. Later, this products are mixed to the surface during the FDU. As a result, it is possible to observe sodium enrichment in giants rather than in dwarfs. Boyarchuk et al. (2001), de Castro et al. (2016) found an anti-correlation of [Na/Fe] with log g. We could observe a similar trend in our sample. According to Denissenkov & Ivanov (1987), a star with a minimum mass of 1.5 will be able to raise the Na abundance through the NeNa chain even in the main-sequence itself. Even though the Na enriched material can be synthesized in AGB and subsequently transferred to the barium stars, there may be a non-negligible contribution to the Na enrichment from the barium star itself.
The derived abundance of aluminium in HD 154276 and HD 211173 return near-solar values for [Al/Fe], 0.12 and 0.11 respectively. Yang et al. (2016) found a range 0.22[Al/Fe]0.56, Allen & Barbuy (2006a) 0.1[Al/Fe]0.1, and de castro et al. (2016) 0.07[Al/Fe]0.43 for their sample of barium stars.
The estimated abundances of Mg are in the range 0.10[Mg/Fe]0.44. A Mg enrichment is expected to observe in the barium stars if the s-process over abundance is resulting from the neutrons produced during the convective thermal pulses through the reaction 22Ne(,n)25Mg. We could not find any enhancement for Mg in our sample when compared with values from the disk stars and normal giants. This discards the fact that the origin of neutron is 22Ne(,n)25Mg source.
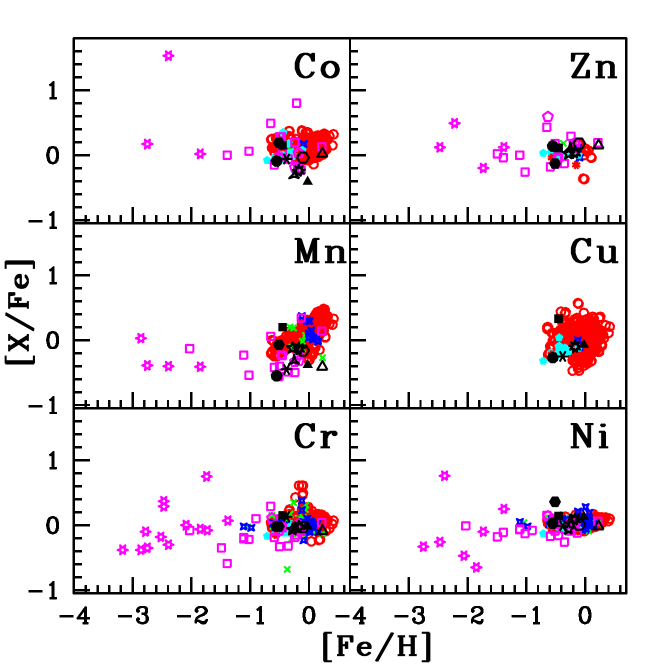
The estimated abundances for other elements, from Si, to Zn are found to be well-within the range as normally seen for disk stars.
6.2 Heavy element abundance analysis
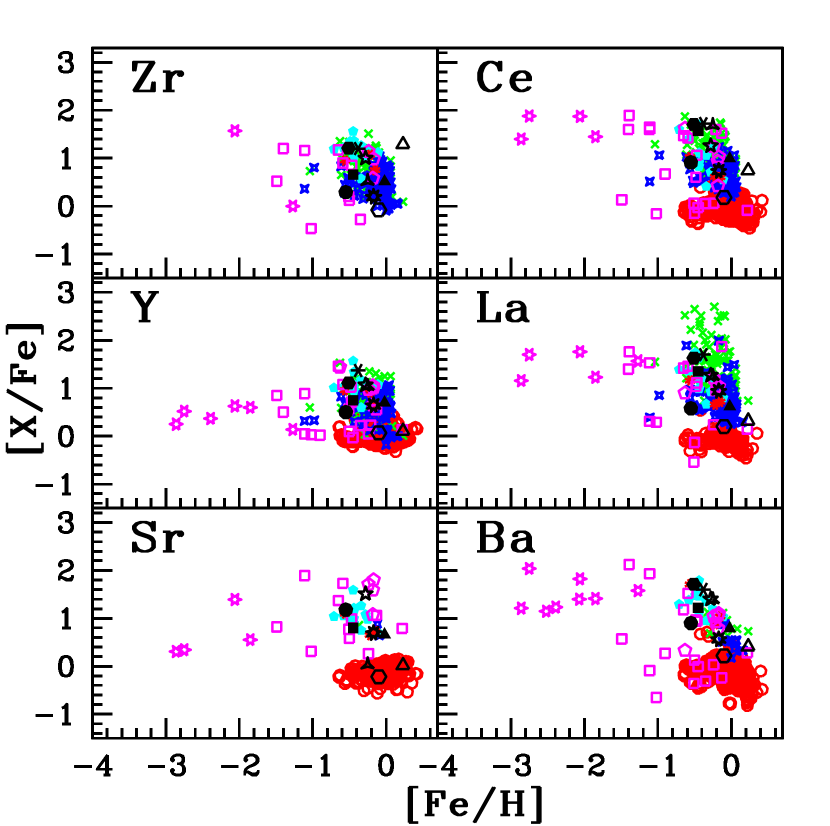
6.2.1 The light s-process elements: Rb, Sr, Y, Zr
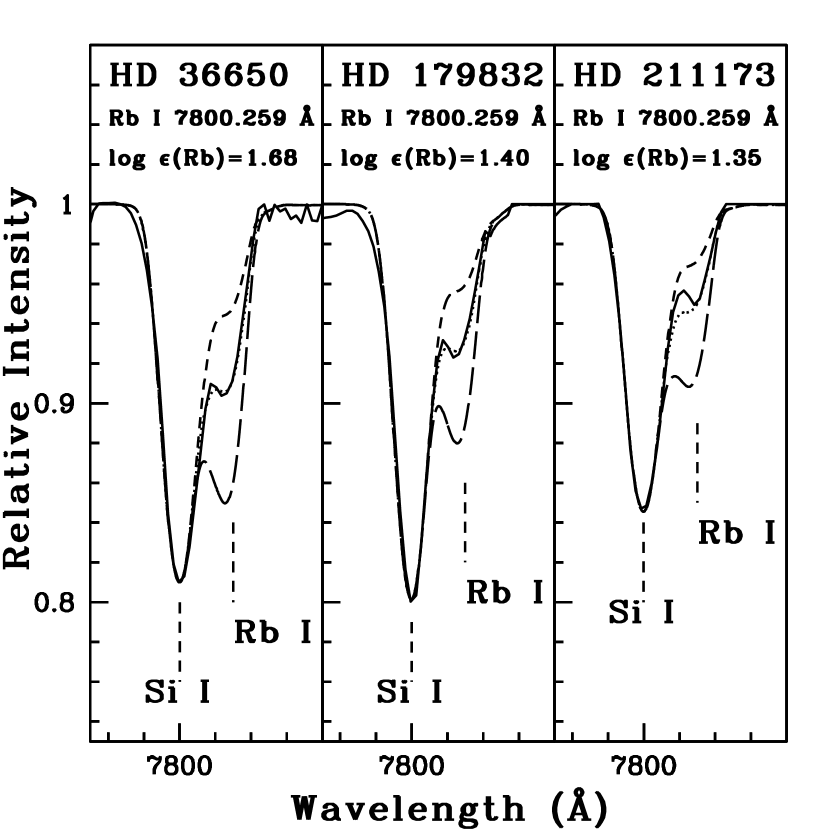
The abundance of Rb is derived using the spectral synthesis calculation of Rb I resonance line at 7800.259 Å in the stars HD 32712, HD 36650, HD 179832 and HD 211173. We could not detect the Rb I lines in the warmer program stars. The Rb I resonance line at 7947.597 Å is not usable for the abundance estimation. The hyperfine components of Rb is taken from Lambert & Luck (1976). The spectrum synthesis of Rb for the three program stars are shown in Figure 5. Rubidium is found to be under abundant in all the four program stars with [Rb/Fe] ranging from 1.35 to 0.82.
Strontium abundances are derived from the spectral synthesis calculation of Sr I line at 4607.327 Å whenever possible. HD 154276 shows a mild under abundance with value [Sr/Fe]0.22, while HD 32712 and HD 179832 show near-solar values. Other stars show enrichment with value [Sr/Fe]0.66.
The abundance of Y is derived from the spectral synthesis calculation of Y I line at 6435.004 Å in all the program stars except for HD 94518, HD 147609, HD 154276 and HD 179832 where no useful Y I line were detected. The spectral synthesis of Y II line at 5289.815 Å is used in HD 94518 while the equivalent width measurement of several lines of Y II is used in other stars. The abundances estimated from Y I lines range from 0.38 to 1.61, and that from Y II lines, 0.07 to 1.37.
The spectral synthesis of Zr I line at 6134.585 Å is used in all the stars except HD 94518, HD 147609 and HD 154276 where this line was not detected. We could detect useful Zr II lines in all the program stars except HD 36650 and HD 219116. In HD 24035, the equivalent width measurement of Zr II lines at 4317.321 and 5112.297 Å are used. Spectral synthesis calculation of Zr II line at 4208.977 Å is used in HD 94518, HD 147609 and HD 154276, line at 5112.297 Å is used in HD 32712, HD 179832, HD 207585 and HD 211173. The measurement using Zr I lines gives the value 0.38[Zr I/Fe]1.29 and Zr II lines return 0.08[Zr II /Fe]1.89. The spectrum synthesis of Zr for a few program stars are shown in Figure 6.

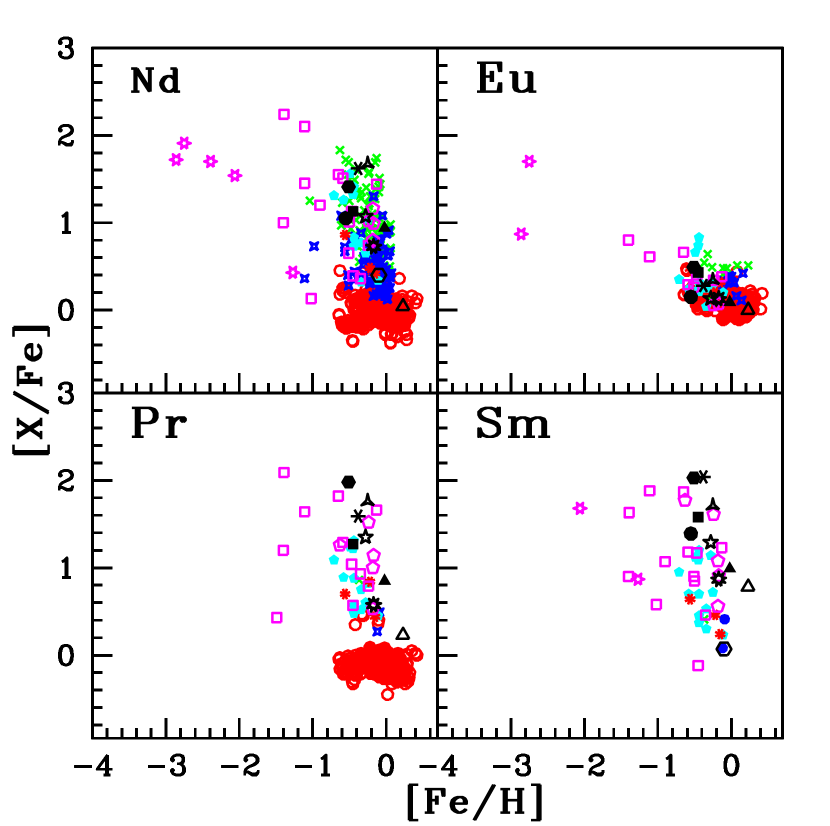
6.2.2 The heavy s-process elements: Ba, La, Ce, Pr, Nd
The abundance of Ba is derived from the spectral synthesis. Ba II lines at 5853.668, 6141.713 and 6496.897 Å are used in HD 154276, whereas, in all the other stars, we have used the line at 5853.668 Å. The spectrum synthesis fits for Ba for a few program stars are shown in Figure 7. Ba shows slight overabundance in HD 154276 with [Ba/Fe]0.22, while HD 179832 and HD 211173 show moderate enhancement with values 0.41 and 0.57 respectively. All other program stars show the overabundance of Ba in the range 0.79 to 1.71.

Lanthanum abundance is obtained from the spectral synthesis analysis of La II line at 4322.503 Å in HD 147609. For all other stars spectral synthesis analysis of La II line at 4921.776 Å is used. The estimated La abundances are in the range 0.20[La/Fe]1.70. HD 154276 shows a mild enhancement of La with [La/Fe]0.20. All other program stars are overabundant in La with [La/Fe] ranging from 0.52 to 1.70.
The abundances of Ce is obtained from the equivalent width measurement of several The star HD 154276 show near-solar abundance for Ce with [Ce/Fe]0.18, whereas all other stars are overabundant in Ce with [Ce/Fe]0.7.
The abundance of Pr is derived from the the equivalent width measurement of Pr II lines whenever possible. We could not estimate Pr abundance in HD 94518 and HD 154276 as there were no useful lines detected. HD 179832 is mildly enhanced in Pr with [Pr/Fe]0.23 while other stars show the enrichment in the range 0.85 to 1.98.
Abundance of Nd is estimated from the spectral synthesis calculation of Nd II lines at 4177.320 and 4706.543 Å in HD 154276. In all other stars, we have used the equivalent width measurement of several Nd II lines. A near-solar value is obtained for the Nd abundance in the star HD 179832 with [Nd/Fe]0.04, whereas a moderate enhancement is found in HD 154276 with [Nd/Fe]0.40. All other objects show an enrichment in Nd with [Nd/Fe]0.81.
6.3 The r-process elements: Sm, Eu
Samarium abundance is derived by the spectral synthesis of Sm II line at 4467.341 Å in HD 154276. The equivalent width measurement of several Sm II lines is used to obtain the Sm abundance in the rest of the program stars. All the good Sm lines are found in the bluer wavelength region of the spectra. The maximum number of Sm II lines used is eight, in HD 207585. The estimated Sm abundances give a near-solar value for HD 154276 with [Sm/Fe]0.07 while all other stars are enriched in Sm with values ranging from 0.78 to 2.04.
The Eu abundance is derived from the spectral synthesis of Eu II line at 4129.725 Å in HD 94518, HD 147609 and HD 207585. In all other stars except HD 154276, spectral synthesis calculation of Eu II line at 6645.064 Å is used. In HD 154276, no useful lines for abundance analysis is detected. The estimated Eu abundance covers the range 0.00[Eu/Fe]0.49. The r-process element Eu is not expected to show enhancement in Ba stars according to their formation scenario.
The observed abundance ratios when compared with their counterparts in other barium stars from literature, the light as well as the heavy element Eu are found to follow the Galactic trend.
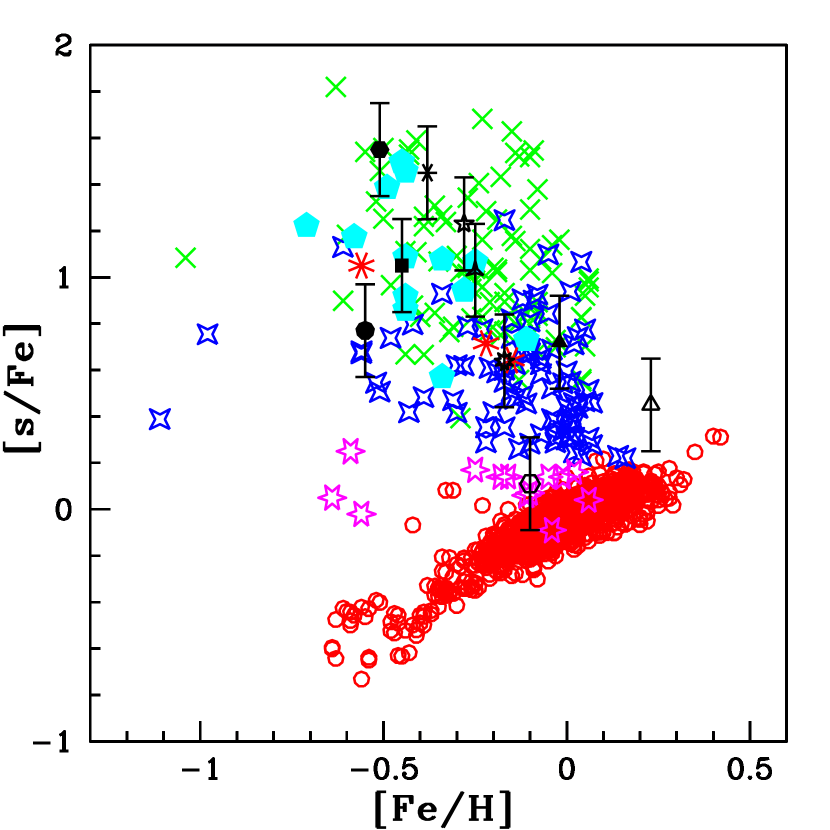
In order to find the s-process contents in the stars, we have estimated the mean abundance ratio of the s-process elements (Sr, Y, Zr, Ba, La, Ce, Nd ), [s/Fe], for our stars. The estimated values of [s/Fe] is provided in Table 13. The star HD 154276 shows the least value for [s/Fe] ratio. A comparison of [s/Fe] ratio observed in our program stars with that in Ba stars and normal giants from literature is shown in Figure 8. The stars which are rejected as Ba stars from the analysis of de Castro et al. (2016) are also shown for a comparison. The [s/Fe] value of HD 154276 falls among these rejected stars. Most of these rejected Ba stars are listed as marginal Ba stars in MacConnell et al. (1972). There is no clear mention in literature on how high should be the [s/Fe] value for a star to be considered as a Ba star. According to de Castro et al. (2018), this value is +0.25, while Sneden et al. (1981) found a value +0.21, Pilachowski (1977) found +0.50 and Rojas at al. (2013) found a value 0.34. If we stick on to the values of these authors, the star HD 154276 with [s/Fe] = 0.11, can not be consider as a Ba star. However, if we follow the criteria of Yang et al. (2016) that [Ba/Fe] should be atleast 0.17 for the star even to be a mild star, HD 154276 can be considered as a mild Ba star with [Ba/Fe]0.22.
A comparison of the heavy element abundances with the literature values whenever available are presented in Table 10. In most of the cases our estimates agree within error bars with the literature values.
| HD 24035 | HD 32712 | HD 36650 | |||||||||
|---|---|---|---|---|---|---|---|---|---|---|---|
| Z | solar log | log | [X/H] | [X/Fe] | log | [X/H] | [X/Fe] | log | [X/H] | [X/Fe] | |
| C | 6 | 8.43 | 8.33(syn) | 0.10 | 0.41 | 8.13(syn) | 0.3 | 0.05 | 8.19(syn) | 0.24 | 0.22 |
| N | 7 | 7.83 | 8.73(syn) | 0.90 | 1.41 | 8.10(syn) | 0.27 | 0.52 | 8.38(syn) | 0.55 | 0.57 |
| O | 8 | 8.69 | – | – | – | 8.42(syn) | 0.27 | 0.02 | 8.20(syn) | 0.49 | 0.47 |
| Na I | 11 | 6.24 | 6.150.17(4) | 0.09 | 0.42 | 6.200.13(4) | 0.04 | 0.21 | 6.330.08(4) | 0.09 | 0.11 |
| Mg I | 12 | 7.60 | 7.23(1) | 0.37 | 0.14 | 7.250.20(2) | 0.35 | 0.10 | 7.690.04(2) | 0.09 | 0.11 |
| Si I | 14 | 7.51 | 7.260.04(2) | 0.25 | 0.14 | 7.600.19(3) | 0.09 | 0.34 | 7.280.10(3) | 0.23 | 0.21 |
| Ca I | 20 | 6.34 | 5.910.13(10) | 0.43 | 0.08 | 5.920.09(11) | 0.42 | 0.17 | 6.230.12(16) | 0.11 | 0.09 |
| Sc II | 21 | 3.15 | 2.65(syn) | 0.50 | 0.01 | 2.95(syn) | 0.20 | 0.05 | 3.08(syn) | 0.12 | 0.10 |
| Ti I | 22 | 4.95 | 4.760.11(19) | 0.19 | 0.32 | 4.680.11(27) | 0.27 | 0.02 | 4.920.09(24) | 0.03 | 0.01 |
| Ti II | 22 | 4.95 | 4.680.03(2) | 0.27 | 0.24 | 4.750.11(5) | 0.20 | 0.05 | 4.970.14(7) | 0.02 | 0.04 |
| V I | 23 | 3.93 | 3.30(syn) | 0.63 | 0.12 | 3.46(syn) | 0.47 | 0.22 | 3.92(syn) | 0.53 | 0.51 |
| Cr I | 24 | 5.64 | 5.110.06(6) | 0.53 | 0.02 | 5.330.17(7) | 0.31 | 0.06 | 5.600.15(9) | 0.04 | 0.02 |
| Cr II | 24 | 5.64 | – | – | – | 5.720.17(4) | 0.08 | 0.33 | 5.540.08(3) | 0.10 | 0.08 |
| Mn I | 25 | 5.43 | 4.85(syn) | 0.58 | 0.07 | 4.86(syn) | 0.57 | 0.32 | 5.08(syn) | 0.40 | 0.38 |
| Fe I | 26 | 7.50 | 6.990.19(87) | 0.51 | - | 7.250.12(84) | 0.25 | - | 7.480.12(92) | 0.02 | - |
| Fe II | 26 | 7.50 | 7.000.16(7) | 0.50 | - | 7.250.15(9) | 0.25 | - | 7.480.14(6) | 0.02 | - |
| Co I | 27 | 4.99 | 4.67(syn) | 0.32 | 0.19 | 4.43(syn) | 0.56 | 0.31 | 4.86(syn) | 0.43 | 0.41 |
| Ni I | 28 | 6.22 | 6.070.14(13) | 0.15 | 0.36 | 6.040.18(11) | 0.18 | 0.07 | 6.330.10(11) | 0.11 | 0.13 |
| Cu I | 29 | 4.19 | – | – | – | – | – | – | 4.57(syn) | 0.09 | 0.07 |
| Zn I | 30 | 4.56 | 3.92(1) | 0.64 | 0.13 | 4.42(1) | 0.14 | 0.11 | – | – | – |
| Rb I | 37 | 2.52 | – | – | – | 1.14(syn) | 1.38 | 1.13 | 1.68(syn) | 0.84 | 0.82 |
| Sr I | 38 | 2.87 | – | – | – | 2.65(syn) | 0.22 | 0.03 | 3.78(syn) | 0.64 | 0.66 |
| Y I | 39 | 2.21 | 3.31(syn) | 1.1 | 1.61 | 2.52(syn) | 0.31 | 0.56 | 2.70(syn) | 0.49 | 0.51 |
| Y II | 39 | 2.21 | – | – | – | 3.000.15(6) | 0.79 | 1.04 | 2.890.13(10) | 0.68 | 0.70 |
| Zr I | 40 | 2.58 | 3.28(syn) | 0.7 | 1.21 | 2.85(syn) | 0.27 | 0.52 | 3.07(syn) | 0.49 | 0.51 |
| Zr II | 40 | 2.58 | 3.960.07(2) | 1.38 | 1.89 | 3.15(syn) | 0.57 | 0.82 | – | – | – |
| Ba II | 56 | 2.18 | 3.38(syn) | 1.20 | 1.71 | 3.32(syn) | 1.14 | 1.39 | 2.95(syn) | 0.77 | 0.79 |
| La II | 57 | 1.10 | 2.22(syn) | 1.12 | 1.63 | 2.10(syn) | 1.00 | 1.25 | 1.81(syn) | 0.60 | 0.62 |
| Ce II | 58 | 1.58 | 2.770.12(9) | 1.19 | 1.70 | 3.010.11(11) | 1.43 | 1.68 | 2.550.13(11) | 0.97 | 0.99 |
| Pr II | 59 | 0.72 | 2.190.18(6) | 1.47 | 1.98 | 2.140.18(6) | 1.42 | 1.67 | 1.550.13(3) | 0.83 | 0.85 |
| Nd II | 60 | 1.42 | 2.320.17(15) | 0.90 | 1.41 | 2.930.18(11) | 1.51 | 1.76 | 2.340.16(15) | 0.92 | 0.94 |
| Sm II | 62 | 0.96 | 2.480.13(4) | 1.52 | 2.03 | 2.420.17(6) | 1.46 | 1.71 | 1.930.12(6) | 0.97 | 0.99 |
| Eu II | 63 | 0.52 | 0.50(syn) | 0.02 | 0.49 | 0.61(syn) | 0.09 | 0.34 | 0.59(syn) | 0.07 | 0.09 |
Asplund (2009), The number inside the paranthesis shows the number of lines used for the abundance determination.
| HD 94518 | HD 147609 | HD 154276 | |||||||||
|---|---|---|---|---|---|---|---|---|---|---|---|
| Z | solar log | log | [X/H] | [X/Fe] | log | [X/H] | [X/Fe] | log | [X/H] | [X/Fe] | |
| C | 6 | 8.43 | 7.60(syn) | 0.83 | 0.28 | 8.53(syn) | 0.10 | 0.38 | – | – | – |
| N | 7 | 7.83 | 8.63(syn) | 0.80 | 1.35 | - | - | - | - | - | - |
| O | 8 | 8.69 | 8.79(syn) | 0.10 | 0.65 | 9.05(syn) | 0.36 | 0.64 | 8.91(syn) | 0.22 | 0.32 |
| Na I | 11 | 6.24 | 5.880.06(4) | 0.44 | 0.11 | 6.260.19(2) | 0.02 | 0.30 | 6.200.05(3) | 0.04 | 0.06 |
| Mg I | 12 | 7.60 | 7.370.12(4) | 0.23 | 0.32 | 7.490.08(4) | 0.11 | 0.17 | 7.810.06(3) | 0.21 | 0.31 |
| Al I | 13 | 6.45 | – | – | – | – | – | – | 6.230.08(2) | 0.22 | 0.12 |
| Si I | 14 | 7.51 | 6.900.20(4) | 0.61 | 0.06 | 7.370.05(4) | 0.14 | 0.14 | 7.540.05(5) | 0.03 | 0.13 |
| Ca I | 20 | 6.34 | 6.010.13(18) | 0.33 | 0.22 | 6.040.21(21) | 0.30 | 0.21 | 6.220.20(27) | 0.12 | 0.02 |
| Sc II | 21 | 3.15 | 2.72(syn) | 0.63 | 0.08 | 2.90(syn) | 0.25 | 0.03 | 3.25(syn) | 0.10 | 0.20 |
| Ti I | 22 | 4.95 | 4.640.13(12) | 0.31 | 0.24 | 4.660.06(10) | 0.29 | 0.01 | 5.020.17(27) | 0.07 | 0.17 |
| Ti II | 22 | 4.95 | 4.810.14(13) | 0.14 | 0.41 | 4.670.16(8) | 0.28 | 0.00 | 5.060.21(18) | 0.11 | 0.21 |
| V I | 23 | 3.93 | 3.15(syn) | 0.78 | 0.23 | 3.53(syn) | 0.40 | 0.12 | 3.90(syn) | 0.03 | 0.07 |
| Cr I | 24 | 5.64 | 5.070.14(15) | 0.57 | 0.02 | 5.290.15(9) | 0.35 | 0.07 | 5.510.20(11) | 0.13 | 0.03 |
| Cr II | 24 | 5.64 | 5.060.19(4) | 0.58 | 0.03 | 5.290.11(3) | 0.35 | 0.07 | 5.530.07(5) | 0.11 | 0.01 |
| Mn I | 25 | 5.43 | 4.61(syn) | 1.1 | 0.55 | 5.03(syn) | 0.40 | 0.12 | 5.170.15(6) | 0.26 | 0.16 |
| Fe I | 26 | 7.50 | 6.950.10(110) | 0.55 | - | 7.220.16(151) | 0.28 | - | 7.410.13(150) | 0.09 | - |
| Fe II | 26 | 7.50 | 6.950.12(15) | 0.55 | - | 7.220.12(20) | 0.28 | - | 7.400.14(15) | 0.10 | - |
| Co I | 27 | 4.99 | 4.52(syn) | 0.64 | 0.09 | – | – | – | 4.850.10(2) | 0.14 | 0.04 |
| Ni I | 28 | 6.22 | 5.700.15(26) | 0.52 | 0.03 | 5.880.11(14) | 0.34 | 0.06 | 6.130.15(19) | 0.09 | 0.01 |
| Cu I | 29 | 4.19 | 3.67(syn) | 0.82 | 0.27 | – | – | – | – | – | – |
| Zn I | 30 | 4.56 | 4.150.10(2) | 0.41 | 0.14 | 4.30 0.07(2) | 0.26 | 0.02 | 4.640.00(2) | 0.08 | 0.18 |
| Sr I | 38 | 2.87 | 3.59(syn) | 0.63 | 1.18 | 4.10(syn) | 1.23 | 1.51 | 2.55(syn) | 0.32 | 0.22 |
| Y II | 39 | 2.21 | 2.16(syn) | 0.05 | 0.50 | 3.000.14(9) | 0.79 | 1.07 | 2.180.19(4) | 0.03 | 0.07 |
| Zr II | 40 | 2.58 | 2.32(syn) | 0.26 | 0.29 | 3.30(syn) | 0.72 | 1.00 | 2.40(syn) | 0.18 | 0.08 |
| Ba II | 56 | 2.18 | 2.58(syn) | 0.35 | 0.90 | 3.30(syn) | 1.12 | 1.40 | 2.30(syn) | 0.12 | 0.22 |
| La II | 57 | 1.10 | 2.12(syn) | 0.08 | 0.58 | 2.09(syn) | 0.99 | 1.27 | 1.20(syn) | 0.10 | 0.20 |
| Ce II | 58 | 1.58 | 1.940.09(9) | 0.36 | 0.91 | 2.560.11(8) | 0.98 | 1.26 | 1.660.03(2) | 0.08 | 0.18 |
| Pr II | 59 | 0.72 | – | – | – | 1.79(1) | 1.07 | 1.35 | – | – | – |
| Nd II | 60 | 1.42 | 1.920.20(9) | 0.50 | 1.05 | 2.210.17(8) | 0.79 | 1.07 | 1.720.12(syn)(2) | 0.30 | 0.40 |
| Sm II | 62 | 0.96 | 1.800.08(4) | 0.84 | 1.39 | 1.97 0.19(4) | 1.01 | 1.29 | 0.93(syn) | 0.03 | 0.07 |
| Eu II | 63 | 0.52 | 0.12(syn) | 0.40 | 0.15 | 0.37(syn) | 0.15 | 0.13 | – | – | – |
Asplund (2009), The number inside the parenthesis shows the number of lines used for the abundance determination.
| HD 179832 | HD 207585 | HD 211173 | HD 219116 | |||||||||||
|---|---|---|---|---|---|---|---|---|---|---|---|---|---|---|
| Z | solar log | log | [X/H] | [X/Fe] | log | [X/H] | [X/Fe] | log | [X/H] | [X/Fe] | log | [X/H] | [X/Fe] | |
| C | 6 | 8.43 | – | – | – | 8.66(syn) | 0.23 | 0.61 | 8.03(syn) | 0.40 | 0.23 | 8.03(syn) | 0.43 | 0.02 |
| N | 7 | 7.83 | – | – | – | 8.20(syn) | 0.37 | 0.75 | 8.20(syn) | 0.37 | 0.54 | 7.85(syn) | 0.02 | 0.47 |
| O I | 8 | 8.69 | 8.93(syn) | 0.24 | 0.01 | 9.28(syn) | 0.59 | 0.97 | 8.26(syn) | 0.43 | 0.26 | 8.45(syn) | 0.24 | 0.21 |
| Na I | 11 | 6.24 | 6.520.13(2) | 0.28 | 0.05 | 6.110.11(4) | 0.13 | 0.25 | 6.300.14(4) | 0.06 | 0.23 | 6.050.16(4) | 0.19 | 0.26 |
| Mg I | 12 | 7.60 | 7.830.02(2) | 0.23 | 0.00 | 7.290.12(3) | 0.31 | 0.07 | 7.660.08(2) | 0.06 | 0.23 | 7.470.02(3) | 0.11 | 0.34 |
| Al I | 13 | 6.45 | – | – | – | – | – | – | 6.170.07(2) | 0.28 | 0.11 | – | – | – |
| Si I | 14 | 7.51 | 7.710.08(4) | 0.20 | 0.03 | 7.250.02(2) | 0.26 | 0.12 | 6.970.11(2) | 0.54 | 0.37 | 7.080.20(2) | 0.43 | 0.02 |
| Ca I | 20 | 6.34 | 6.270.06(9) | 0.07 | 0.30 | 6.220.17(11) | 0.12 | 0.26 | 6.230.17(15) | 0.11 | 0.06 | 6.020.14(16) | 0.34 | 0.13 |
| Sc II | 21 | 3.15 | 3.35(syn) | 0.20 | 0.03 | 2.63(syn) | 0.52 | 0.14 | 2.79(syn) | 0.36 | 0.19 | 2.66(syn) | 0.49 | 0.04 |
| Ti I | 22 | 4.95 | 5.060.07(4) | 0.11 | 0.12 | 4.580.15(7) | 0.37 | 0.01 | 4.770.11(27) | 0.18 | 0.01 | 4.730.09(21) | 0.22 | 0.23 |
| Ti II | 22 | 4.95 | 5.390.08(4) | 0.44 | 0.21 | 4.820.12(9) | 0.13 | 0.25 | 4.760.16(9) | 0.19 | 0.02 | 4.650.15(6) | 0.3 | 0.15 |
| V I | 23 | 3.93 | 4.03(syn) | 0.10 | 0.13 | 3.11(syn) | 0.82 | 0.44 | 3.47(syn) | 0.46 | 0.29 | 3.67(syn) | 0.26 | 0.19 |
| Cr I | 24 | 5.64 | 5.780.12(2) | 0.14 | 0.09 | 5.390.15(11) | 0.25 | 0.13 | 5.450.16(11) | 0.19 | 0.02 | 5.340.16(9) | 0.3 | 0.15 |
| Cr II | 24 | 5.64 | 5.710.02(2) | 0.07 | 0.16 | 5.380.15(4) | 0.26 | 0.12 | 5.240.16(4) | 0.4 | 0.23 | 5.200.09(2) | 0.44 | 0.01 |
| Mn I | 25 | 5.43 | 5.250.09(3) | 0.18 | 0.41 | 4.60(syn) | 0.83 | 0.45 | 5.13(syn) | 0.30 | 0.13 | 4.78(syn) | 0.65 | 0.2 |
| Fe I | 26 | 7.50 | 7.730.01(68) | 0.23 | - | 7.120.12(107) | 0.38 | - | 7.330.10(109) | 0.17 | - | 7.050.11(92) | 0.45 | - |
| Fe II | 26 | 7.50 | 7.720.04(9) | 0.22 | - | 7.120.11(12) | 0.38 | - | 7.330.09(11) | 0.17 | - | 7.060.12(9) | 0.44 | - |
| Co I | 27 | 4.99 | 5.240.08(6) | 0.25 | 0.02 | 4.55(syn) | 0.44 | 0.06 | 4.58(syn) | 0.41 | 0.24 | 4.690.10(7) | 0.3 | 0.15 |
| Ni I | 28 | 6.22 | 6.430.07(10) | 0.21 | 0.02 | 5.830.14(16) | 0.39 | 0.01 | 6.140.17(27) | 0.08 | 0.09 | 5.910.12(11) | 0.31 | 0.14 |
| Cu I | 29 | 4.19 | – | – | – | 4.36(syn) | 0.63 | 0.25 | 3.92(syn) | 0.27 | 0.10 | 4.09(syn) | 0.12 | 0.33 |
| Zn I | 30 | 4.56 | 4.940.11(2) | 0.38 | 0.15 | – | – | – | 4.430.02(2) | 0.13 | 0.04 | 4.04(1) | 0.56 | 0.11 |
| Rb I | 37 | 2.52 | 1.40(syn) | 1.12 | 1.35 | – | – | – | 1.35(syn) | 1.17 | 1.00 | – | – | – |
| Sr I | 38 | 2.87 | 3.12(syn) | 0.25 | 0.02 | – | – | – | 3.40(syn) | 0.53 | 0.70 | 3.13(syn) | 0.26 | 0.71 |
| Y I | 39 | 2.21 | – | – | – | 2.77(syn) | 0.56 | 0.94 | 2.42(syn) | 0.21 | 0.38 | 2.49(syn) | 0.28 | 0.73 |
| Y II | 39 | 2.21 | 2.550.05(5) | 0.34 | 0.11 | 3.200.08(9) | 0.99 | 1.37 | 2.690.07(8) | 0.48 | 0.65 | 2.510.09(3) | 0.30 | 0.75 |
| Zr I | 40 | 2.58 | 4.10(syn) | 1.52 | 1.29 | 3.30(syn) | 0.72 | 1.10 | 2.79(syn) | 0.21 | 0.38 | 2.79(syn) | 0.21 | 0.66 |
| Zr II | 40 | 2.58 | 4.25(syn) | 1.67 | 1.44 | 3.74(syn) | 0.82 | 1.20 | 2.80(syn) | 0.22 | 0.39 | – | – | – |
| Ba II | 56 | 2.18 | 2.82(syn) | 0.64 | 0.41 | 3.50(syn) | 1.22 | 1.60 | 2.58(syn) | 0.40 | 0.57 | 2.90(syn) | 0.77 | 1.22 |
| La II | 57 | 1.10 | 1.85(syn) | 0.75 | 0.52 | 2.47(syn) | 1.32 | 1.70 | 1.88(syn) | 0.78 | 0.95 | 2.00(syn) | 0.9 | 1.35 |
| Ce II | 58 | 1.58 | 2.550.11(2) | 0.97 | 0.74 | 2.920.16(14) | 1.34 | 1.72 | 2.150.10(11) | 0.57 | 0.74 | 2.700.20(10) | 1.12 | 1.57 |
| Pr II | 59 | 0.72 | 1.180.05(2) | 0.46 | 0.23 | 1.930.11(3) | 1.21 | 1.59 | 1.930.11(2) | 1.21 | 1.59 | 1.540.18(3) | 0.82 | 1.27 |
| Nd II | 60 | 1.42 | 1.690.04(2) | 0.27 | 0.04 | 2.660.10(19) | 1.24 | 1.62 | 1.980.17(14) | 0.56 | 0.73 | 2.100.12(10) | 0.68 | 1.13 |
| Sm II | 62 | 0.96 | 1.970.04(5) | 1.01 | 0.78 | 2.620.17(8) | 1.66 | 2.04 | 1.660.07(4) | 0.70 | 0.87 | 2.090.18(7) | 1.13 | 1.58 |
| Eu II | 63 | 0.52 | 0.75(syn) | 0.23 | 0.00 | 0.42(syn) | 0.10 | 0.28 | 0.48(syn) | 0.04 | 0.13 | 0.50(syn) | 0.02 | 0.43 |
Asplund (2009), The number inside the parenthesis shows the number of lines used for the abundance determination.
6.4 The [hs/ls] ratio as an indicator of neutron source
In Table 13, we have presented the estimated [ls/Fe], [hs/Fe] and [hs/ls] ratios for the program stars, where ls refers to the light s-process elements (Sr, Y and Zr) and hs to the heavy s-process elements (Ba, La, Ce and Nd).
The [hs/ls] ratio is a useful indicator of neutron source in the former AGB star. As the metallicity decreases, the neutron exposure increases. As a result, lighter s-process elements are bypassed in favour of heavy elements. Hence, [hs/ls] ratio increases with decreasing metallicity. The models of Busso et al. (2001) have shown the behaviour of this ratio with metallicity for AGB stars of mass 1.5 and 3.0 M⊙ for different 13C pocket efficiencies. According to these models, the maximum value of [hs/ls] is 1.2 which is at metallicities 1.0 and 0.8 for the 3 and 1.5 M⊙ models respectively for the standard 13C pocket efficeincy. In their models, Goriely & Mowlavi (2000), have shown the run of [hs/ls] ratio with meatallicity for different thermal pulses for AGB stars in the range 1.5-3M⊙. The maximum value of [hs/ls]0.6 occurs at metallicity 0.5. It was noted that, in all these models, the [hs/ls] ratio does not follow a linear anti-correlation with metallicity, rather exhibits a loop like behaviour. The ratio increases with decreasing metallicity upto a particular value of [Fe/H] and then starts to drop. Our [hs/ls] ratio has a maximum value of 1.15 which occurs at a metallicity of 0.25. The anti-correlation of [hs/ls] suggest the operation of 13C(, n)16O neutron source, since 13C(, n)16O is found to be anti-correlated with metallicity (Clayton 1988, Wallerstein 1997).
As seen from the Table 13, all the stars show positive values for [hs/ls] ratio. At metallicities higher than solar, a negative value is expected for this ratio and at lower metallicities, a positive value is expected for low-mass AGB stars where 13C(, n)16O is the neutron source (Busso et al. 2001, Goriely & Mowlavi 2000). However, it is possible that AGB stars with masses in the range 5-8M⊙ can also exhibit low [hs/ls] ratios considering the 22Ne(, n)25Mg neutron source (Karakas & Lattanzio 2014). The models of Karakas & Lattanzio (2014) predicted that the ls elements are predominantly produced over the hs elements for AGB stars of mass 5 and 6 M⊙. The [hs/ls] ratio is correlated to the neutron exposure. The 22Ne(, n)25Mg source has smaller neutron exposure compared to the 13C(, n)16O source. Hence, in the stars where 22Ne(, n)25Mg operates, we expect a lower [hs/ls] ratio. The lower neutron exposure of the neutrons produced from the 22Ne source together with the predictions of low [hs/ls] ratio in massive AGB star models have been taken as the evidence of operation of 22Ne(, n)25Mg in massive AGB stars. A Mg enrichment is expected in the stars where this reaction takes place. As none of our stars shows such an enrichment, we discard the possibility of 22Ne(, n)25Mg reaction as a possible neutron source for any of our program stars, with respect to [hs/ls] ratio. This is also supported by our estimates of Rb and Zr as discussed in the following section.
6.5 Rb as a probe to the neutron density at the s-process site
In addition to the [hs/ls] ratio, the abundance of rubidium can also provide clues to the mass of the companion AGB stars. The AGB star models predict higher Rb abundances for massive AGB stars where the neutron source is 22Ne(,n)25Mg reaction (Abia et al. 2001, van Raai et al. 2012). In the s-process nucleosynthesis path, the branching points at the unstable nuclei 85Kr and 86Rb controls the Rb production. The amount of Rb produced along this s-process path is determined by the probability of these unstable nuclei to capture the neutron before -decaying, which in turn depends on the neutron density at the s-process site (Beer & Macklin 1989, Tomkin & Lambert 1983, Lambert et al. 1995).
The production of 87Rb from 85Kr and 86Rb is possible only at higher neutron densities, Nn 5108 n/cm3, Sr, Y, Zr etc. are produced otherwise (Beer 1991, Lugaro & Chieffi 2011). The 87Rb isotope has magic number of neutrons and hence it is fairly stable against neutron capture. Also, the neutron capture cross-section of 87Rb is very small ( 15.7 mbarn at 30 KeV) compared to that of 85Rb ( 234 mbarn) (Heil et al. 2008a). Hence, once the nucleus 87Rb is produced, it will be accumulated. Therefore, the isotopic ratio 87Rb/85Rb could be a direct indicator of the neutron density at the s-process site, as a consequence help to infer the mass of the AGB star. But, it is impossible to distinguish the lines due to these two isotopes of Rb in the stellar spectra (Lambert & Luck 1976, García-Hernández et al. 2006). However, the abundance of Rb relative to other elements in this region of the s-process path, such as Sr, Y, and Zr, can be used to estimate the average neutron density of the s-process. Detailed nucleosynthesis models for the stars with masses between 5 - 9 M⊙ at solar metallicity predict [Rb/(Sr,Zr)]0 (Karakas et al. 2012). A positive value of [Rb/Sr] or [Rb/Zr] ratio indicates a higher neutron density, whereas a negative value indicates a low neutron density. This fact has been used an evidence to conclude that 13C(, n)16O reaction act as the neutron source in M, MS and S stars (Lambert et al. 1995) and C stars must be low-mass AGB stars with M3M⊙ (Abia et al. 2001). The observed [Rb/Zr] ratios in the AGB stars both in our Galaxy and the Magellanic Clouds show a value 0 for low-mass AGB stars and a value 0 for intermedaite-mass (4-6 M⊙) AGB stars (Plez et al. 1993, Lambert et al. 1995, Abia et al. 2001, García-Hernández et al. 2006, 2007, 2009, van Raai et al. 2012).
The estimated [Rb/Zr] and [Rb/Sr] ratios (Table 13) give negative values for our stars for which we could estimate these ratios. The observed [Rb/Fe] and [Zr/Fe] ratios are shown in Figure 9. The observed ranges of Rb and Zr in low- and intermediate-mass AGB stars (shaded regions) in the Galaxy and Magellanic Clouds are also shown for a comparison. It is clear that the abundances of Rb and Zr are consistent with the range normally observed in the low-mass AGB stars.
6.6 Comparison with FRUITY models and a parametric model based analysis
A publicly available (http://fruity.oa-teramo.inaf.it/, Web sites of the Teramo Observatory (INAF)) data set for the s-process in AGB stars is the FRANEC Repository of Updated Isotopic Tables & Yields (FRUITY) models (Cristallo et al. 2009, 2011, 2015b). These models cover the whole range of metallicity observed for Ba stars from z = 0.001 to z = 0.020 for the mass range 1.3 - 6.0 M⊙. The computations comprise of the evolutionary models starting from the pre-main sequence to the tip of AGB phase through the core He-flash. During the core H-burning, no core overshoot has been considered, a semi-convection is assumed during the core He-burning. The only mixing considered in this model is arising from the convection, additional mixing phenomena such as rotation is not considered here. The calculations are based on a full nuclear network considering all the stable and relevant unstable isotopes from hydrogen to bismuth. This includes 700 isotopes and about 1000 nuclear processes such as charged particle reactions, neutron captures, and -decays (Straniero et al. 2006, Görres et al. 2000, Jaeger et al. 2001, Abbondanno et al. 2004, Patronis et al. 2004, Heil et al. 2008b). The details of the input physics and the computational algorithms are provided in Straniero et al. (2006). In this model, 13C pocket is formed through time-dependent overshoot mechanisms, which is controlled by a free overshoot parameter () in the exponentially declining convective velocity function. This parameter is set in such a way that the neutrons released are enough to maximise the production of s-process elements. For the low-mass AGB star models (initial mass 4 M⊙), neutrons are released by the 13C(, n)16O reaction during the interpulse phase in radiative conditions, when temperatures within the pockets reaches T 1.0 108 K, with typical densities of 106 - 107 neutrons cm-3. However, in the case of the metal-rich models (z = 0.0138, z = 0.006 and z = 0.003), 13C is only partially burned during the interpulse; surviving part is ingested in the convective zone generated by the subsequent thermal pulse (TP) and then burned at T 1.5 108 K, producing a neutron density of 1011 neutrons cm-3. For larger z, 22Ne(, n)25Mg neutron source is marginally activated during the TPs; but for low z, it becomes an important source when most of the 22Ne is primary (Cristallo et al. 2009, 2011). For the intermediate-mass AGB star models, the s-process distributions are dominated by the 22Ne(, n)25Mg neutron source, which is efficiently activated during TPs. The contribution from the 13C(, n)16O reaction is strongly reduced in the massive stars. This is due to the lower extent of the 13C pocket in them. It is shown that the extent of 13C pocket decreases with increasing core mass of the AGB, due to the shrinking and compression of He-intershell (Cristallo et al. 2009). These massive models experience Hot Bottom Burning and Hot-TDUs at lower metallicities (Cristallo et al. 2015b).
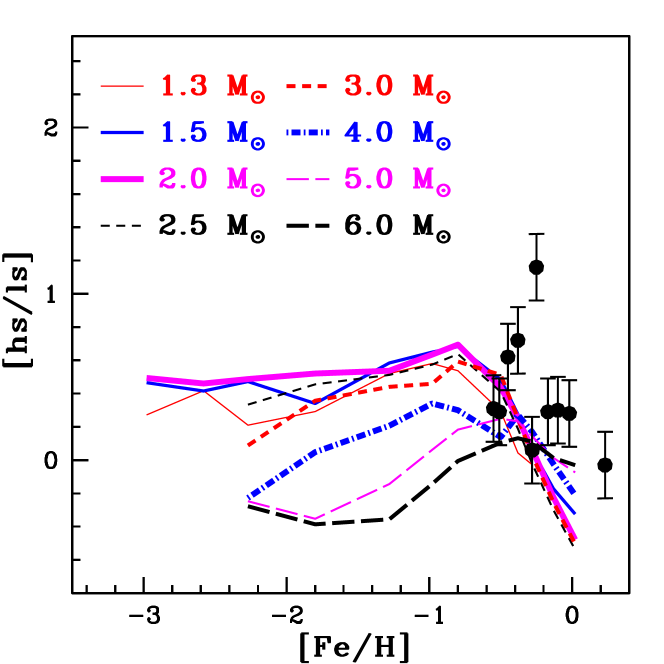
We have compared our observational data with the FRUITY model. The model predictions are unable to reproduce the [hs/ls] ratios characterizing the surface composition of the stars. A comparison of the observed [hs/ls] ratios with metallicity shows a large spread (Figure 10), somewhat similar to the comparison between the model and observational data as shown in Cristallo et al. (2011, Figure 12).
The observed discrepancy may be explained considering different 13C pocket efficiencies in the AGB models. In the FRUITY models a standard 13C pocket is being considered, however, it needs to be checked if a variation in the amount of 13C pocket would give a better match with the observed spread. Absence of stellar rotation in the current FRUITY models may also be a cause for the observed discrepancy. The rotation induced mixing alters the extend of 13C pocket (Langer et al. 1999), which in turn affects the s-process abundance pattern. However, a study made by Cseh et al. (2018) using the rotating star models available for the metallicity range of Ba stars (Piersanti et al. 2013) could not reproduce the observed abundance ratios of stars studied in de Castro et al. (2016).

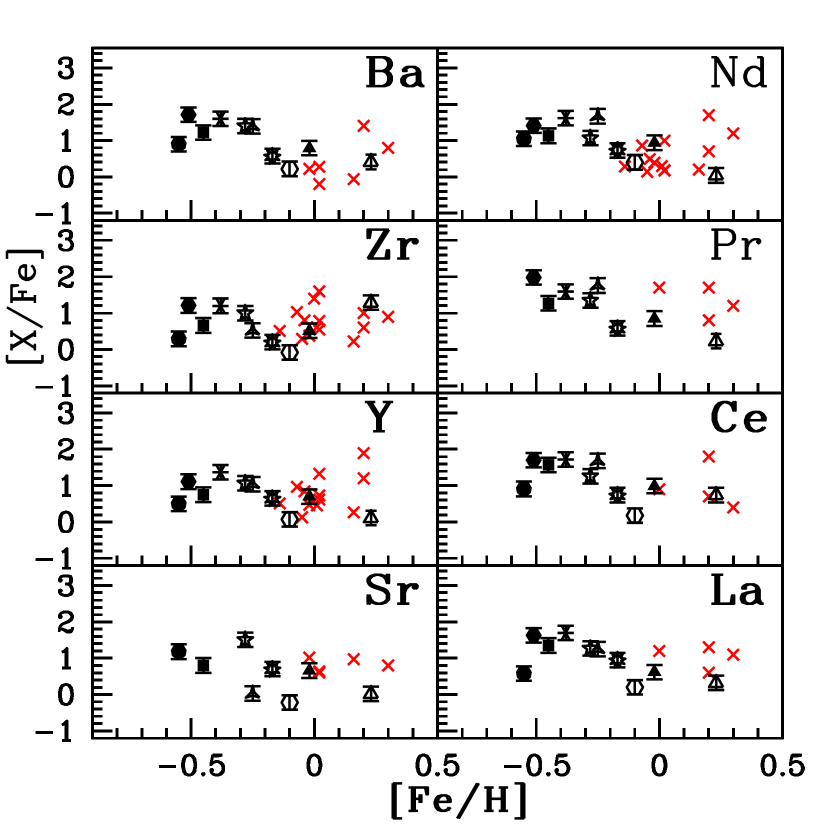
The observed abundance ratios for eight neutron-capture elements are compared with their counterparts in the low-mass AGB stars from literaure, that are found to be associated with 13C(, n)16O neutron source (Figure 11). As discussed in de Castro et al. (2016) the scatter observed in the ratios may be a consequence of different dilution factors during the mass transfer, as well as the orbital parameters, metallicity and initial mass.
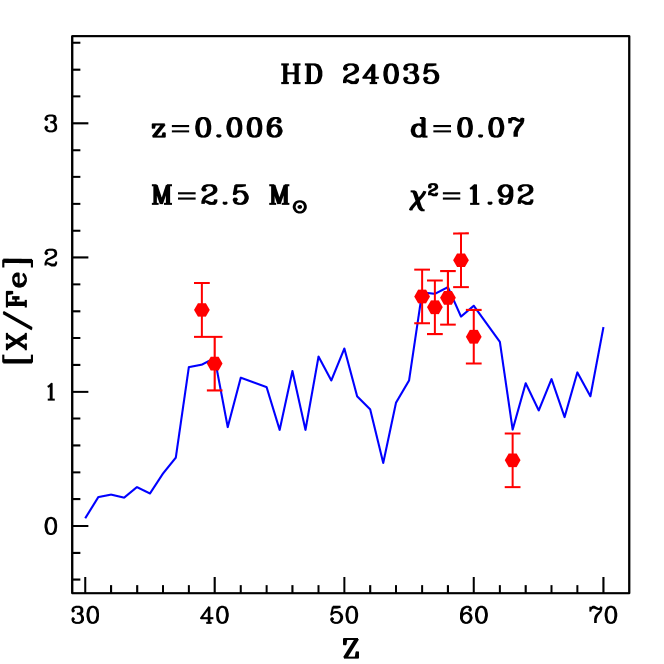
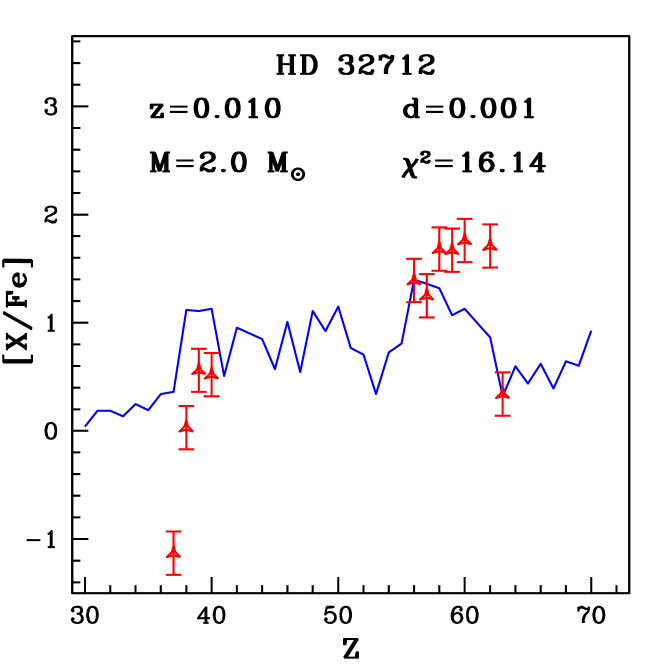
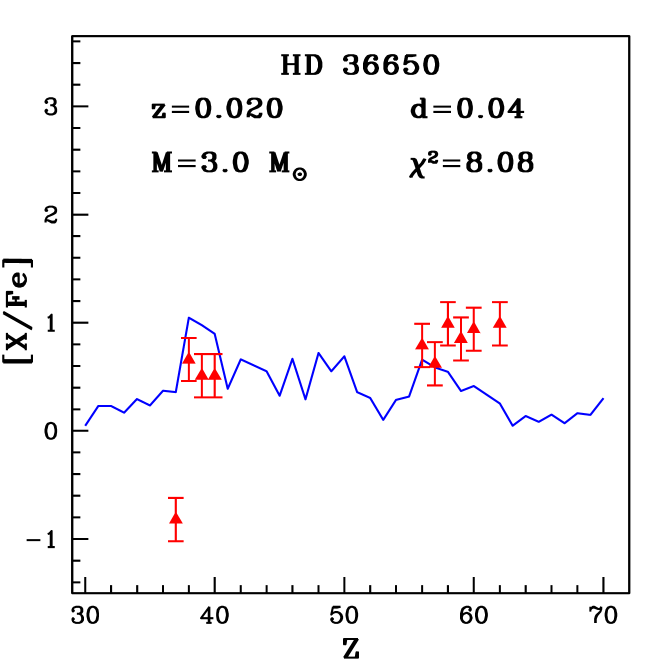
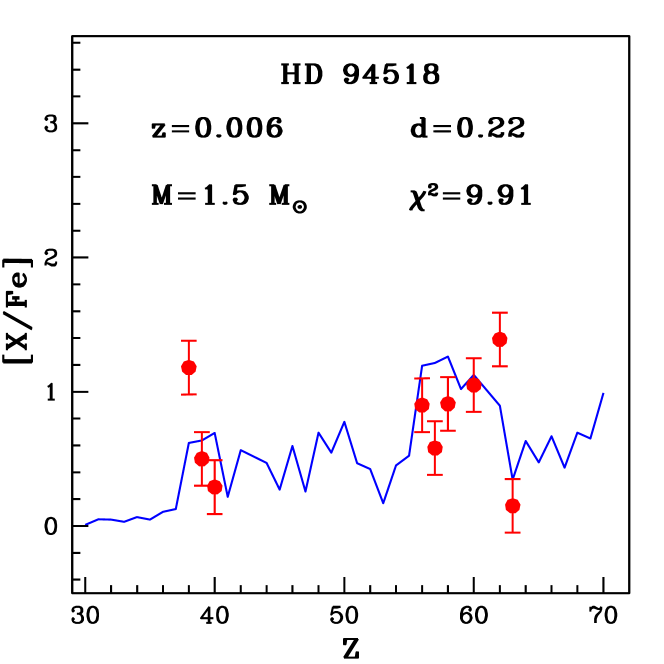
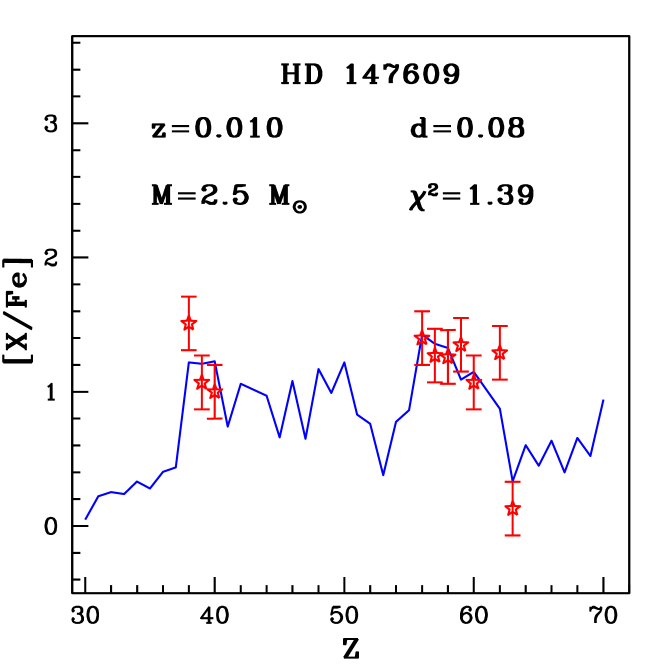
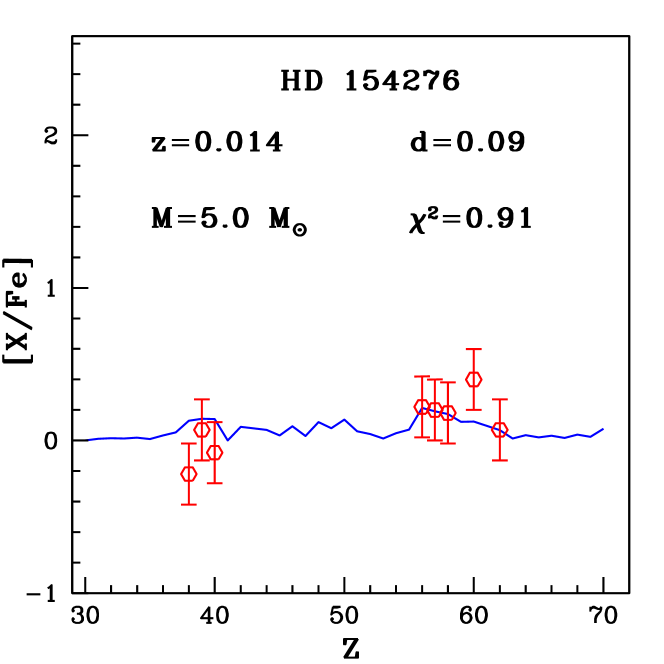
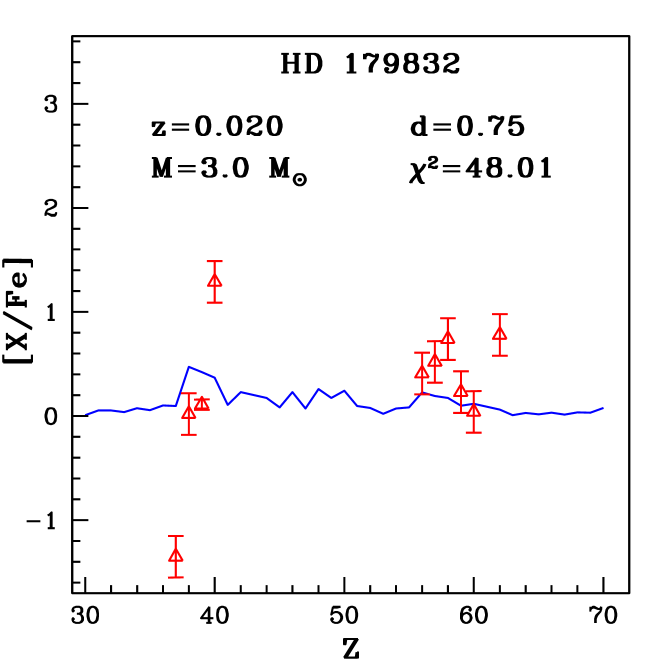
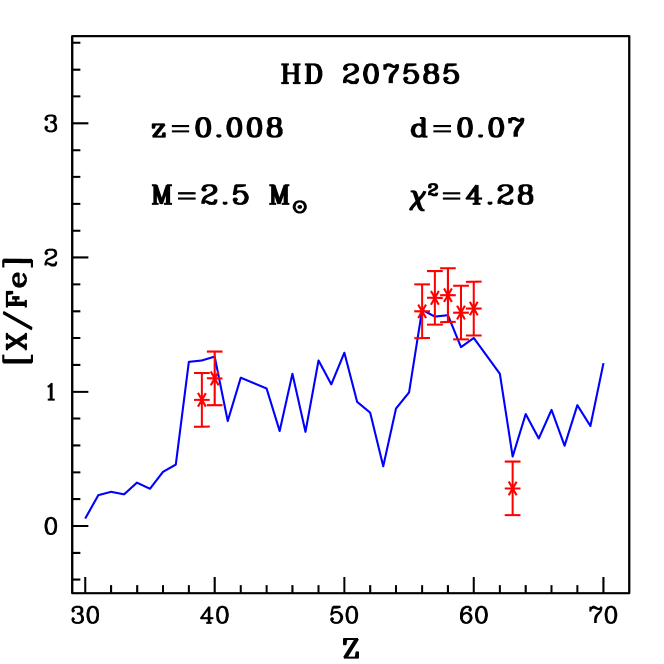
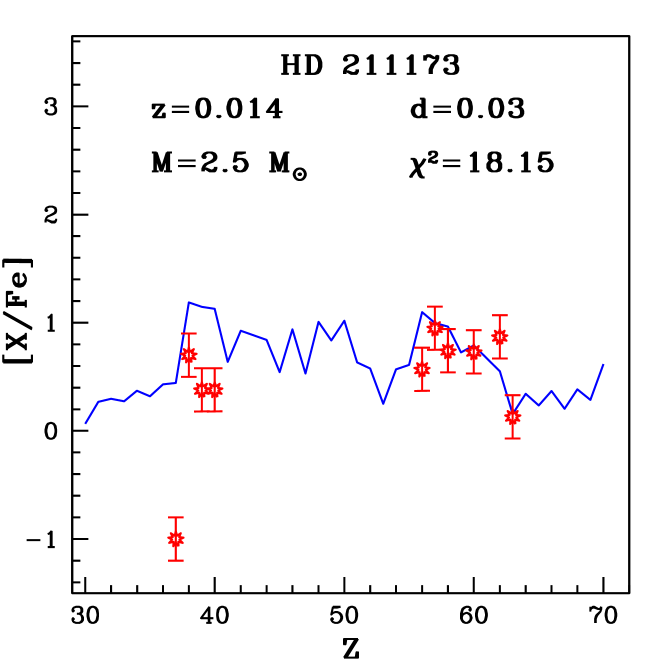
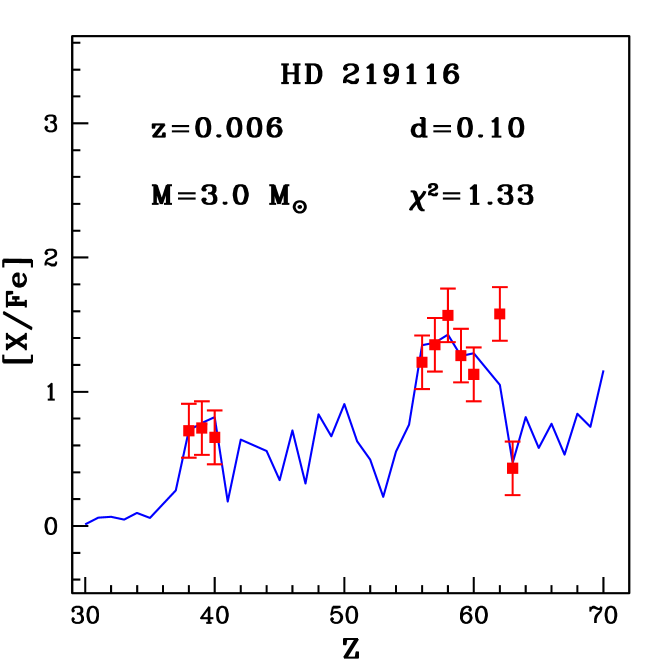
We have performed a parametric analysis in order to find the dilution experienced by the s-rich material after the mass transfer. The dilution factor, d, is defined as M/M = 10d, where M is the mass of the envelope of the observed star after the mass transfer, M is the mass transferred from the AGB. The dilution factor is derived by comparing the observed abundance with the predicted abundance from FRUITY model for the heavy elements (Rb, Sr, Y, Zr, Ba, La, Ce, Pr, Nd, Sm and Eu). The solar values has been taken as the initial composition. The observed elemental abundances are fitted with the parametric model function (Husti et al. 2009). The best fits masses and corresponding dilution factors along with the values are given in Table 9. The goodness of fit of the parametric model function is determined by the uncertainty in the observed abundance. The best fits obtained are shown in Figures 12 - 15. All the Ba stars are found to have low-mass AGB companions with M 3 M⊙. Among our stars, HD 147609 is found to have a companion of 3 M⊙ by Husti et al. (2019), whereas our estimate is 2.5 M⊙.
| Star name/ | HD 24035 | HD 32712 | HD 36650 | HD 94518 | HD 147609 | HD 154276 | HD 179832 | HD 207585 | HD 211173 | HD 219116 | |
|---|---|---|---|---|---|---|---|---|---|---|---|
| mass (M/M⊙) | |||||||||||
| 1.5 | d | - | - | - | 0.22 | - | 0.71 | 0.21 | - | - | 0.04 |
| - | - | - | 9.91 | - | 1.46 | 51.39 | - | - | 1.40 | ||
| 2.0 | d | - | 0.001 | - | 0.52 | - | 1.18 | 0.65 | - | - | 0.36 |
| - | 16.14 | - | 10.14 | - | 1.43 | 48.04 | - | - | 1.55 | ||
| 2.5 | d | 0.07 | 0.08 | 0.10 | 0.62 | 0.08 | 1.31 | 0.82 | 0.07 | 0.03 | 0.46 |
| 1.92 | 17.64 | 8.15 | 10.31 | 1.39 | 1.60 | 48.06 | 4.28 | 18.15 | 1.66 | ||
| 3.0 | d | - | - | 0.04 | 0.27 | - | 1.20 | 0.75 | - | - | 0.10 |
| - | - | 8.08 | 9.92 | - | 1.52 | 48.01 | - | - | 1.33 | ||
| 4.0 | d | - | - | - | - | 0.58 | - | - | - | - | |
| - | - | - | - | 1.01 | - | - | - | - | |||
| 5.0 | d | - | - | - | - | 0.09 | - | - | - | - | |
| - | - | - | - | 0.91 | - | - | - | - |
6.7 Discussion on individual stars
HD 24035, HD 219116, HD 32712, HD 36650, HD 207585
and HD 211173:
These objects are listed in the CH star catalogue of
Bartkevicius (1996) as well as in the barium star catalogue
of Lü (1991). While Smith et al. (1993) classified HD 219116 as
a CH subgiant, MacConnell et al. (1972) and Mennessier et al. (1997)
suggested these objects to be giant barium stars.
Based on our temperature and luminosity estimates, their locations
in the H-R diagram correspond to the giant phase of evolution, except
for HD 207585 which is found to be a strong Ba sub-giant.
Earlier studies on these objects include Masseron et al. (2010) and
de Castro et al. (2016) on abundance analysis. We have estimated
the abundances of all the important s-process elements and Eu in
these objects except Sr in HD 24035. Based on our abundance annalysis
we find these objects to satisfy the criteria for
s-process enriched stars (Beers & Christlieb 2005) with
[Ba/Fe]1 and [Ba/Eu]0.50 respectively. Following
Yang et al. (2016), they can also be included in strong
Ba giant category while HD 211173 is a mild Ba giant.
They show the characteristics of Ba stars
with estimated C/O 0.95, 0.51. 0.56, 0.24 and 0.59 for
HD 219116, HD 32712, HD 36650, HD 207585 and HD 211173 respectively.
HD 24035 shows the largest enhancement of Ba among our
program stars with [Ba/Fe]1.71
and largest mean s-process abundance with [s/Fe]1.55.
A comparison with FRUITY models shows that the former AGB
companions of HD 24035, HD 32712, HD 36650, HD 219116, HD 207585
and HD 211173 are low mass objects with masses 2.5 M⊙,
2.0 M⊙, 3.0 M⊙, 3.0 M⊙, 2.5 M⊙,
and 2.5 M⊙ respectively.
From kinematic analysis we find these objects to belong
to the thin disk population with probability 0.97.
The estimated spatial velocities 85 km/s, also satisfies
the criterion of Chen et al. (2004) for stars to be thin
disk objects. From radial velocity monitoring, HD 24035
and HD 207585 are confirmed to be binaries with orbital periods
of 377.820.35 days (Udry et al. 1998a) and 6722 days
(Escorza et al. 2019) respectively.
HD 94518:
This object belongs to the CH star catalogue of Bartkevicius (1996).
Our abundance analysis places this object in the strong Ba star
category with C/O 0.06.
The abundance pattern observed in this star resembles with
that of a 1.5 M⊙ AGB star.
The position of this stars in H-R diagram shows this object to be a
subgiant star. Kinematic analysis shows this object to belong to
thick disk population with a probability 0.95.
HD 147609:
This star is listed in CH star catalogue of Bartkevicius (1996).
This star is a strong Ba dwarf with C/O 0.27.
Comparison of the observed abundance in HD 147609 with the
FRUITY model shows close resemblance with that seen in
2.5 M⊙ AGB star.
Kinematic analysis has shown that this object belongs to thin disk
population with characteristic spatial velocity of thin disk objects.
The radial velocity monitoring study by Escorza et al. (2019)
has confirmed this object to be a binary with an orbital period of
11461.5 days.
HD 154276:
This star is listed in CH star catalogue of Bartkevicius (1996).
Our analysis have shown that this star is a dwarf.
Our analysis based on mean s-process abundance, [s/Fe], revealed
that this object can not be considered as a Ba star.
HD 179832:
This object belongs to the CH star catalogue of Bartkevicius (1996).
We have presented a first time detailed abundance analysis for
this object. Our analyses have shown that this object is a mild Ba giant.
The abundance trend observed in this star suggest that the former
companion AGB star’s mass to be 3 M⊙ .
From kinematic analysis, HD 179832 is found to be a thin disk object
with probability of 0.99. The spatial velocity is estimated to be
11.97 km s-1, as expected for thin disk stars (Chen at al. 2004).
| Star name | [Fe I/H] | [Fe II/H] | [Fe/H] | [Rb I/Fe] | [Sr/Fe] | [Y I/Fe] | [Y II/Fe] | [Zr I/Fe] | Ref |
|---|---|---|---|---|---|---|---|---|---|
| HD 24035 | 0.51 | 0.50 | 0.51 | - | - | 1.61 | - | 1.21 | 1 |
| 0.23 | 0.28 | 0.26 | - | - | 1.35 | - | 1.20 | 2 | |
| - | - | 0.14 | - | - | - | - | - | 3 | |
| HD 32712 | 0.25 | 0.25 | 0.25 | 1.13 | 0.03 | 0.56 | 1.04 | 0.52 | 1 |
| 0.24 | 0.25 | 0.25 | - | - | 0.74 | - | 0.56 | 2 | |
| HD 36650 | 0.02 | 0.02 | 0.02 | 0.82 | 0.66 | 0.51 | 0.70 | 0.51 | 1 |
| 0.28 | 0.28 | 0.28 | - | - | 0.55 | - | 0.46 | 2 | |
| HD 94518 | 0.55 | 0.55 | 0.55 | - | 1.18 | - | 0.50 | - | 1 |
| 0.49 | 0.50 | 0.50 | - | 0.55 | - | - | - | 4 | |
| HD 147609 | 0.28 | 0.28 | 0.28 | - | 1.51 | - | 1.07 | - | 1 |
| 0.45 | - | 1.32 | - | 1.57 | 0.89 | 5 | |||
| - | - | - | - | - | 0.96 | - | 0.80 | 6 | |
| HD 154276 | 0.09 | 0.10 | 0.10 | - | 0.22 | - | 0.07 | - | 1 |
| - | - | 0.29 | - | - | 0.07 | - | - | 4 | |
| HD 179832 | +0.23 | +0.23 | +0.22 | 1.35 | 0.02 | - | 0.11 | 1.29 | 1 |
| HD 207585 | 0.38 | 0.38 | 0.38 | - | - | 0.94 | 1.37 | 1.10 | 1 |
| - | - | 0.50 | - | - | - | - | - | 3 | |
| - | - | 0.57 | - | - | 1.29 | - | 1.50 | 7 | |
| HD 211173 | 0.17 | 0.17 | 0.17 | 1.00 | 0.70 | 0.38 | 0.65 | 0.38 | 1 |
| - | - | 0.12 | - | - | - | - | - | 3 | |
| HD 219116 | 0.45 | 0.44 | 0.45 | - | 0.71 | 0.73 | 0.75 | 0.66 | 1 |
| 0.61 | 0.62 | 0.62 | - | - | 0.59 | - | 0.65 | 2 | |
| - | - | 0.34 | - | - | - | - | - | 3 | |
| - | - | 0.30 | - | - | - | - | - | 8 | |
| Star name | [Zr II/Fe] | [Ba II/Fe] | [La II/Fe] | [Ce II/Fe] | [Pr II/Fe] | [Nd II/Fe] | [Sm II/Fe] | [Eu II/Fe] | Ref |
| HD 24035 | 1.89 | 1.71 | 1.63 | 1.70 | 1.98 | 1.41 | 2.03 | 0.19 | 1 |
| - | - | 2.70 | 1.58 | - | 1.58 | - | - | 2 | |
| - | 1.07 | 1.01 | 1.63 | - | - | - | 0.32 | 3 | |
| HD 32712 | 0.82 | 1.39 | 1.25 | 1.68 | 1.67 | 1.76 | 1.71 | 0.04 | 1 |
| - | - | 1.53 | 1.16 | - | 1.19 | - | - | 2 | |
| HD 36650 | - | 0.79 | 0.62 | 0.99 | 0.85 | 0.94 | 0.99 | 0.21 | 1 |
| - | - | 0.83 | 0.68 | - | 0.57 | - | - | 2 | |
| HD 94518 | 0.29 | 0.90 | 0.58 | 0.91 | - | 1.05 | 1.39 | 0.17 | 1 |
| - | 0.77 | - | - | - | - | - | - | 4 | |
| HD 147609 | 1.00 | 1.40 | 1.27 | 1.26 | 1.35 | 1.07 | 1.29 | 0.13 | 1 |
| 1.56 | 1.57 | 1.63 | 1.64 | 1.22 | 1.32 | 1.09 | 0.74 | 5 | |
| - | - | - | - | - | 0.98 | - | - | 6 | |
| HD 154276 | 0.08 | 0.22 | 0.20 | 0.18 | - | 0.40 | 0.07 | - | 1 |
| - | 0.03 | - | - | - | - | - | - | 4 | |
| HD 179832 | 1.44 | 0.41 | 0.52 | 0.74 | 0.23 | 0.04 | 0.78 | 0.00 | 1 |
| HD 207585 | 1.20 | 1.60 | 1.70 | 1.72 | 1.59 | 1.62 | 2.04 | 0.02 | 1 |
| - | 1.23 | 1.37 | 1.41 | - | - | - | 0.58 | 3 | |
| - | - | 1.60 | 0.84 | 0.61 | 0.93 | 1.05 | - | 7 | |
| HD 211173 | 0.39 | 0.57 | 0.95 | 0.74 | 1.59 | 0.73 | 0.87 | 0.17 | 1 |
| - | 0.35 | 0.29 | 0.73 | - | - | - | 0.15 | 3 | |
| HD 219116 | - | 1.22 | 1.35 | 1.57 | 1.27 | 1.13 | 1.58 | 0.13 | 1 |
| - | - | 1.21 | 1.07 | - | - | - | - | 2 | |
| - | 0.77 | 0.56 | 0.80 | - | - | - | 0.17 | 3 | |
| - | 0.90 | - | - | - | 1.43 | - | - | 8 |
References: 1. Our work, 2. de Castro (2016), 3. Masseron et al. (2010),
4. Bensby et al. (2014), 5. Allen & Barbuy (2006a), 6. North et al. (1994a),
7. Luck & Bond (1991), 8. Smith et al. (1993)
7 CONCLUSIONS
Results from high resolution spectroscopic analysis of ten objects are presented. All the objects are listed in the CH star catalog of Bartkevicius (1996). Six of them are also listed in the barium star catalog of Lü (1991). Except for one object HD 154276, all other objects are shown to be bonafied barium stars from our analysis. Although it satisfies the criteria of Yang et al. (2016) to be a mild barium star, our detailed abundance analysis shows this object to be a normal metal-poor star. An analysis based on the mean s-process abundance clearly shows that this particular star lies among the stars rejected as barium stars by de Castro et al. (2016).
Some of the objects analysed here, although common to the sample analysed by different authors, abundances of important heavy elements such as Rb, and C, N, O are not found in literature. New results for these elements are presented in this work.
We have presented first time abundance results for HD 179832 and shown it to be a mild barium giant. Kinematic analysis have shown it to be a thin disk object. A parametric model based analysis have shown the object’s former companion AGB star’s mass to be about 3M⊙.
The sample of stars analysed here covers a metallicity range from 0.55 to +0.23, and a kinematic analysis has shown that all of them belong to the Galactic disk, as expected for barium stars.
The estimated mass of the barium stars are consistent with that observed for other barium stars (Allen & Barbuy 2006a, Liang et al. 2003, Antipova et al. 2004, de Castro et al. 2016). The abundance estimates are consistent with the operation of 13C(, n)16O source in the former low-mass AGB companion.
We did not find any enhancement of Mg in our sample, that discards the source of neutron as the 22Ne(, n)25Mg reaction. An enhancement of Mg abundances when compared with their counterparts in disk stars and normal giants would have indicated the operation of 22Ne(, n)25Mg.
The detection of Rb I line at 7800.259 Å in the spectra of HD 32712, HD 36650, HD 179832 and HD 211173 allowed us to determine [Rb/Zr] ratio. This ratio gives an indication of the neutron source at the s-process site and in turn provides clues to the mass of the star. We have obtained negative values for this ratio in all the four stars. The negative values obtained for these stars indicate the operation of 13C(, n)16O reaction. As this reaction occurs in the low-mass AGB stars, we confirm that the former companions of these stars are low-mass AGB stars with M 3 M⊙.
Distribution of abundance patterns and [hs/ls] ratios also indicate low-mass companions for the objects for which [Rb/Zr] could not be estimated. A comparison of observed abundances with the predictions from FRUITY models, and with those that are observed in low-mass AGB stars from literature, confirms low-mass for the former companion AGB stars.
8 ACKNOWLEDGMENT
We thank the staff at IAO and at the remote control station at CREST, Hosakotte for assisting during the observations. Funding from the DST SERB project No. EMR/2016/005283 is gratefully acknowledged. This work made use of the SIMBAD astronomical database, operated at CDS, Strasbourg, France, and the NASA ADS, USA. This work has made use of data from the European Space Agency (ESA) mission Gaia (https://www.cosmos.esa.int/gaia), processed by the Gaia Data Processing and Analysis Consortium (DPAC, https://www.cosmos.esa.int/web/gaia/dpac/consortium). T.M. acknowledges support provided by the Spanish Ministry of Economy and Competitiveness (MINECO) under grant AYA- 2017-88254-P. Based on data collected using HESP, UVES and FEROS. The authors would like to thank the referee for useful suggestions that had improved the readability of the paper.
| Wavelength(Å) | El | (eV) | log gf | HD 24035 | HD 32712 | HD 36650 | HD 94518 | HD 147609 | HD 154276 | HD 179832 | HD 207585 | HD 211173 | HD 219116 | Ref |
|---|---|---|---|---|---|---|---|---|---|---|---|---|---|---|
| 4114.445 | Fe I | 2.832 | 1.220 | - | - | - | - | - | - | - | - | - | - | 1 |
| 4132.899 | 2.850 | 1.010 | - | - | - | 88.7(6.94) | - | - | - | 83.4(6.96) | 132.2(7.31) | - | 1 | |
| 4153.900 | 3.400 | 0.320 | 129.9(6.79) | - | - | - | - | - | - | 90.8(6.90) | - | - | 1 | |
| 4154.499 | 2.830 | 0.690 | - | - | - | - | - | - | - | - | - | - | 2 | |
| 4184.891 | 2.832 | 0.860 | - | - | - | - | - | - | - | - | - | - | 1 |
The numbers in the paranthesis in columns 5-14 give the derived
abundances from the respective line.
References: 1. Führ et al. (1988) 2. Kurucz (1988)
Note: This table is available in its entirety in online only.
A portion is shown here for guidance regarding its form and content.
| Wavelength(Å) | El | (eV) | log gf | HD 24035 | HD 32712 | HD 36650 | HD 94518 | HD 147609 | HD 154276 | HD 179832 | HD 207585 | HD 211173 | HD 219116 | Ref |
|---|---|---|---|---|---|---|---|---|---|---|---|---|---|---|
| 5682.633 | Na I | 2.102 | 126.7(6.29) | 133.5(6.31) | 126.0(6.44) | 63.5(5.86) | 66.2(6.13) | 83.5(6.23) | 132.2(6.55) | 79.0(6.17) | 121.5(6.43) | 104.5(6.13) | 1 | |
| 5688.205 | 2.105 | 0.450 | 137.1(6.21) | 151.3(6.31) | 130.1(6.26) | 85.2(5.94) | 98.2(6.39) | - | 145.1(6.50) | 98.0(6.22) | 136.2(6.41) | 126.8(6.24) | 1 | |
| 6154.226 | 2.102 | 1.560 | 49.4(5.91) | 66.9(6.04) | 67.7(6.30) | 20.5(5.90) | - | 27.4(6.13) | - | 22.2(6.00) | 60.1(6.21) | 37.9(5.92) | 1 | |
| 6160.747 | 2.104 | 1.260 | 88.3(6.20) | 92.7(6.16) | 87.5(6.31) | 29.2(5.81) | - | 47.9(6.22) | - | 38.0(6.03) | 74.8(6.15) | 57.2(5.93) | 1 | |
| 4571.096 | Mg I | 0.000 | 5.691 | - | - | - | - | - | 108.9(7.88) | - | - | - | - | 2 |
| 4702.991 | 4.346 | 0.666 | - | 179.6(7.10) | - | 179.6(7.27) | 156.2(7.56) | - | - | 149.0(7.16) | - | 180.0(7.48) | 3 | |
| 4730.029 | 4.346 | 2.523 | - | - | 85.1(7.71) | 45.5(7.46) | 32.3(7.48) | 60.2(7.80) | 87.1(7.81) | - | 76.8(7.60) | - | 3 |
The numbers in the paranthesis in columns 5-14 give the derived abundances from the respective line.
References: 1. Kurucz et al. (1975), 2. Laughlin et al. (1974), 3. Lincke et al. (1971)
Note: This table is available in its entirety in online only.
A portion is shown here for guidance regarding its form and content.
| Star name | [Fe/H] | [ls/Fe] | [hs/Fe] | [s/Fe] | [hs/ls] | [Rb/Sr] | [Rb/Zr] | C/O |
|---|---|---|---|---|---|---|---|---|
| HD 24035 | 0.51 | 1.41 | 1.61 | 1.55 | 0.20 | – | – | – |
| HD 32712 | 0.25 | 0.37 | 1.52 | 1.03 | 1.15 | 1.06 | 1.65 | 0.51 |
| HD 36650 | 0.02 | 0.56 | 0.84 | 0.72 | 0.28 | 1.48 | 1.33 | 0.56 |
| HD 94518 | 0.55 | 0.67 | 0.86 | 0.77 | 0.19 | – | – | 0.06 |
| HD 147609 | 0.28 | 1.19 | 1.25 | 1.23 | 0.06 | – | – | 0.27 |
| HD 154276 | 0.10 | 0.08 | 0.25 | 0.11 | 0.33 | – | – | – |
| HD 179832 | +0.23 | 0.47 | 0.66 | 0.45 | 0.19 | 1.37 | 2.64 | – |
| HD 207585 | 0.38 | 1.02 | 1.66 | 1.45 | 0.64 | – | – | 0.24 |
| HD 211173 | 0.17 | 0.49 | 0.75 | 0.64 | 0.26 | 1.70 | 1.38 | 0.59 |
| HD 219116 | 0.45 | 0.70 | 1.32 | 1.05 | 0.62 | – | – | 0.95 |
References
- [1] Abbondanno U., Aerts G., Alvarez-Velarde F., Álvarez-Pol H., Andriamonje S. et al., 2004, Phys. Rev. Lett., 93, 1103
- [2] Abia C., Wallerstein G., 1998, MNRAS, 293, 89
- [3] Abia C., Busso M., Gallino R., Domínguez I., Straniero O. & Isern J., 2001, ApJ, 559, 1117
- [4] Afsar M., Sneden C., For B -Q., 2012, AJ, 144, 20
- [5] Alonso A., Arribas S., Martinez-Roger C., 1994, A&ASS, 107, 365
- [6] Alonso A., Arribas S., Martinez-Roger C., 1995, A&A, 297, 197
- [7] Alonso A., Arribas S., Martinez-Roger C., 1996, A&A, 313,873
- [8] Alonso A., Arribas S., Martinez-Roger C., 1999, A&AS, 140, 261
- [9] Alonso A., Arribas S., Martinez-Roger C., 2001, A&A, 376, 1039
- [10] Allen D.M., Barbuy B., 2006a, A&A, 454, 895
- [11] Amarsi A. M., Asplund M., Collet R. & Leenaarts, J., 2016, MNRAS, 455, 3735
- [12] Antipova L.I., Boyarchuk A.A., Pakhomov Yu. V. & Panchuk V.E., 2004, ARep, 48, 597
- [13] Asplund M., Grevesse N., Sauval A.J., 2009, Ann. Rev. Astron. Astrophy., 47, 481
- [14] Axer M., Fuhrmann K., Gehren T., 1994, A&A, 291, 895
- [15] Barbuy B., Jorissen A., Rossi S. C. F. & Arnould M., 1992, A&A, 262, 216
- [16] Bartkevicious A., 1996, Baltic Astron, 5, 217
- [17] Baschek B., Scholz M. & Sedlmayr E., 1977, A&A, 55, 375
- [18] Battistini C. & Bensby T., 2015, A&A, 577, 9
- [19] Beer H., 1991, ApJ, 375, 823
- [20] Beers T.C., Christlieb N., 2005, ARA&A, 43, 531
- [21] Beer H. & Macklin R. L., 1989, ApJ, 339, 962
- [22] Bensby T., Feltzing S., Lundstrom I., 2004, A&A, 415, 155
- [23] Bensby T., Feltzing S., Oey M.S., 2014, A&A, 562, 71
- [24] Bidelman W.P., Keenan P.C., 1951, ApJ, 114, 473
- [25] Boyarchuk A.A., Antipova L.I., Boyarchuk M.E. & Savanov I.S., 2001, ARep, 45, 301
- [26] Brooke J. S. A., Bernath P. F., Schmidt T. W. & Bacskay G. B., 2013, JQSRT, 124, 11
- [27] Busso M., Gallino R., Wasserburg G. J., 1999, ARA&A, 37, 239
- [28] Busso M., Gallino R., Lambert D. L., Travaglio C., Smith V. V., 2001, ApJ, 557, 802
- [29] Cenarro A.J., Peletier R.F., Sanchez-Blazquez P., selam S.O., Toloba E., Cardiel N., Falcon - Barroso J., Gorgas J., Jimenez-Vicente & Vazdekis A., 2007, MNRAS, 374, 664
- [30] Chen B., Vergely J.L., Valette B., Carraro G., 1998, A&A, 336, 137
- [31] Chen Y.Q., Nissen P.E., Zhao G., 2004, A&A, 425, 697
- [32] Clayton D. D., 1988, MNRAS, 234, 1
- [33] Cristallo S., Straniero O., Gallino R., Piersanti L., Domínguez I., Lederer M. T., 2009, ApJ, 696, 797
- [34] Cristallo S., Piersanti L., Straniero O., Gallino R., Domínguez I., Abia C., di rico G., Quintini M., Bisterzo S., 2011, ApJS, 197, 17
- [35] Cristallo S., Straniero O., Piersanti L. & Gobrecht D., 2015b, ApJS, 219, 40
- [36] Cseh B., Lugaro M., D’Orazi V., de Castro D. B., Pereira C.B., Karakas A. I. et al., 2018, A&A, 620, A146
- [37] Cutri R.M., Skrutskie M.F., Van Dyk S., Beichman C A., Carpenter J.M, 2003, yCat.2246.0
- [38] de Castro D.B., Pereira C.B., Roig F., Jilinski E., Drake N.A., Chavero C., Sales Silva J.V., 2016, MNRAS, 459, 4299
- [39] Denissenkov P.A. & Ivanov V.V., 1987, SvAL, 13, 214
- [40] Doherty C. L., Gil-Pons P., Lau H. H. B., Lattanzio J. C & Siess L., 2014a, MNRAS, 437, 195
- [41] Dray L. M., tout C. A., Karakas A. I., Lattanzio J. C., 2003, MNRAS, 338, 973
- [42] Edvardsson B., Andersen J., Gustafsson B., Lambert D.L., Nissen P. E., Tomkin J., 1993, A&A, 275, 101
- [43] El Eid M.F. & Champagne A.E., 1995, ApJ, 451, 298
- [44] Eriksson K. & Toft S. C., 1979, A&A, 71, 178
- [45] Escorza A., Karinkuzhi D., Jorissen A., Siess L., Van Winckel H. et al., 2019, A&A, 626, A128
- [46] Führ J.R., Martin G.A., Wiese W.L., 1988, J. Phys. Chem. Ref. Data 17, Suppl. 4
- [47] Gallino R., Arlandini C., Busso M., Lugaro M., Travaglio C., Straniero O., Chieffi A., Limongi M., 1998, ApJ, 497, 388
- [48] García-Herández D. A., García-Lario P., Plez B., D’Antona F., Manchado A., Trigo-Rodríguez M., 2006, Science, 314, 1751
- [49] García-Herández D. A., García-Lario P., Plez B., Manchado A., D’Antona F., Lub J. & Habing H., 2007, A&A, 462, 711
- [50] García-Herández D. A., Manchado A., Lambert D. L., Plez B., García-Lario P., D’Antona F., Lugaro M., Karakas A. I. & van Raai M. A., 2009, ApJ, 705, L31
- [51] Girardi L., Bressan A., Bertelli G., Chiosi C., 2000, A&AS 141, 371
- [52] Goriely S., Mowlavi N., 2000, A&A, 362, 599
- [53] Görres J., Arlandini C., Giesen U., Heil M., Käppeler F., Leiste H., Stech E., Wiescher M., 2000, Phys. Rev. C, 62, 5801
- [54] Goswami A., Aoki W., Beers T. C., Christlieb N., Norris J. E., Ryan S. G., Tsangarides S., 2006, MNRAS, 372, 343
- [55] Goswami A., Aoki W., Karinkuzhi D., 2016, MNRAS, 455, 402
- [56] Harris M. J., Lambert D. L. & Smith V. V., 1985, ApJ, 292, 620
- [57] Heil M., Käppeler F., Uberseder E., Gallino R., bisterzo S., Pignatari M., 2008a, Phys. Rev. C, 78, 5802
- [58] Heil, M., Winckler N., Dababneh S., Käppeler F., Wisshak K., Bisterzo S., Gallino R., Davis A. M., Rauscher T., 2008b, ApJ, 673, 434
- [59] Henry R. B. C., Edmunds M. G., Köppen J., 2000, ApJ, 541, 660
- [60] Herwig F., 2005, ARA&A, 43, 435
- [61] Husti L., Gallino R., Bisterzo S., Straniero O. & Cristallo S., 2009, PASA, 26, 176
- [62] Iben Jr. I., 1975, ApJ, 196, 525
- [63] Jaeger M., Kunz R., Mayer A., Hammer J. W., Staudt G., Kratz K. L., Pfeiffer B., 2001, Phys. Rev. Lett., 87, 2501
- [64] Johnson H.R., Milkey R.W., Ramsey L.W., 1974, ApJ, 187, 147
- [65] Jonsell K., Barklem P. S., Gustafsson B., Christlieb N., Hill V., Beers T. C., Holmberg J., 2006, A&A, 451, 651
- [66] Karakas A. I., Lattanzio J. C., 2014, PASA, 31, 30
- [67] Karakas A.I., García-Hernández D. A. & Lugaro M., 2012, ApJ, 751, 8
- [68] Karinkuzhi D., Van Eck S., Jorissen A., Goriely S., Siess L., Merle T., Escorza A., Van der Swaelmen M., Boffin H. M. J., Masseron T., Shetye S. & Plez B., 2018, A&A, 618, A32
- [69] Keenan P.C., 1942, ApJ, 96, 101
- [70] Kiselman D., 1993, A&A, 275, 269
- [71] Kurucz R.L., 1988, Trans. IAU, XXB, M. McNally, ed., Dordrecht: Kluwer, 168-172
- [72] Kurucz R.L., Peytremann E., 1975, SAO Special Report 362
- [73] Lambert D. L. & Luck R. E., 1976, Obs., 96, 100L
- [74] Lambert D. L., Smith V. V., Busso M., Gallino R. & Straniero O., 1995, ApJ, 450, 302
- [75] Langer N., Heger A., Wellstein S. & Herwig F., 1999, A&A, 346, L37
- [76] Laughlin C., Victor G.A., 1974, ApJ 192, 551
- [77] Liang Y.C., Zhao G., Chen Y.Q. & Qiu H.M. & Zhang B., 2003, A&A, 397, 257
- [78] Lincke R., Ziegenbein G., 1971, Z. Phyzik, 241, 369.
- [79] Lü P.K., 1991, AJ, 101, 2229
- [80] Lucatello S., Tsangarides S., Beers T. C., Carretta E., Gratton R. G., Ryan S. G., 2005, ApJ, 652, 825
- [81] Luck R.E. & Bond H.E., 1991, ApJS, 77, 515
- [82] Luck R. E. & Heiter U., 2007, AJ, 133, 2464
- [83] Luck R. E. & Lambert D. L., 1985, ApJ, 298, 782
- [84] Lugaro M. & Chieffi A., 2011, in Lecture Notes in Physics, ed. R. Diehl, D. H. Hartmann & N. Prantzos (Berlin: Springer Verlag), 812, 83
- [85] MacConnell D.J., Frye R.L., Upgren A.R., 1972, AJ, 77, 384
- [86] Masseron T., Johnson J.A., Plez B., Van Eck S., Goriely S., Jorissen A., 2010, A&A, 509, 93
- [87] McClure R.D., 1983, ApJ, 208, 264
- [88] McClure R.D., 1984, ApJ, 280, 31
- [89] McClure R.D., Woodsworth W., 1990, ApJ, 352, 709
- [90] McClure R. D., Fletcher J. M., Nemec J., 1980, ApJ, 238, L35
- [91] McWilliiam A., 1998, AJ, 115, 1640
- [92] Mennessier M.O., Luri X., Figueras F., Gomez A.E., Grenier S. et al., 1997, A&A, 326, 722
- [93] Merle T., Jorissen A., Van Eck S., Masseron T. & Van Winckel H., 2016, A&A, 586, A151
- [94] Mishenina T.V., Bienaymé O., Gorbaneva T.I., Charbonnel C., 2006, A&A, 456, 1109
- [95] Mowlavi N., 1999, A&A,344, 617
- [96] North P., Berthet S., Lanz T., 1994a, A&A, 281, 775
- [97] Patronis N., Dababneh S., Assimakopoulos P. A., Gallino R., Heil M., Käppeler F., Karamanis D., Koehler P. E., Mengoni A., Plag R., 2004, Phys. Rev. Lett., 69, 5803
- [98] Piersanti L., Cristallo S. & Straniero O., 2013, ApJ, 774, 98
- [99] Pilachowski C.A., 1977, A&A, 54, 465
- [100] Plez B., Smith V. V. & Lambert D. L., 1993, ApJ, 418, 812
- [101] Prochaska J.X., McWilliam A., 2000, ApJ, 537, 57
- [102] Prochaska J. X., Naumov S. O., Carney B. W., McWilliam A., Wolfe A. M., 2000, AJ, 120, 2513
- [103] Purandardas M., Goswami A., Goswami P. P., Shejeelammal J., Masseron T., 2019, MNRAS, 486, 3266
- [104] Ramirez I., feltzing S. & Oey M. S., 2013, ApJ, 764, 78
- [105] Ram R. S., Brooke James S. A., Bernath P. F., Sneden C., Lucatello S., 2014, ApJS, 211, 5
- [106] Reddy B.E., Tomkin J., Lambert D.L. & Allende Prieto C., 2003, MNRAS, 340, 304
- [107] Reddy B.E., Lambert D.L., Priesto C.A., 2006, MNRAS, 367, 1329
- [108] Rojas M., Drake N. A., Pereira C. B. & Kholtygin A. F., 2013, Astrophysics, 56, 57
- [109] Smiljanic R., Barbuy B., de Medeiros J. R., Maeder A., 2006, RMxAC, 26, 45
- [110] Smiljanic R., Porto de Mello G. F., da Silva L., 2007, A&A, 468, 679
- [111] Smith V. V., 1984, A&A, 132, 326
- [112] Smith V. V., Lambert D. L., 1985, ApJ, 294, 326
- [113] Smith V. V. & Lambert D. L., 1986a, ApJ, 303, 226
- [114] Smith V. V., Lambert D. L., 1986b, ApJ, 311, 843
- [115] Smith V. V., Lambert D. L., 1990, ApJS, 72, 387
- [116] Smith V. V., Coleman H. & Lambert D. L., 1993, ApJ, 417, 287
- [117] Sneden C., 1973, PhD thesis, Univ. Texas
- [118] Sneden C., Pilachowski C. A. & Lambert D. L., 1981, ApJ, 247, 1052
- [119] Sneden C., Lucatello S., Ram R. S., Brooke J. S. A. & Bernath P. F., 2014, ApJS, 214, 26
- [120] Stancliffe R.J., Glebbeek E., Izzard R.G., Pols O.R., 2007, A&A, 464, 57
- [121] Straniero O., Gallino R., Busso M., Chiefei A., Raiteri C. M., Limongi M., Salaris M., 1995, ApJ, 440, L85
- [122] Straniero O., Gallino R. & Cristallo S., 2006, Nucl. Phys. A, 777, 311
- [123] Thévenin F. & Idiart T. P., 1999, ApJ, 521, 753
- [124] Tomkin J. & Lambert D. L., 1979, ApJ, 227, 209
- [125] Tomkin J. & Lambert D. L., 1983, ApJ, 273, 722
- [126] Udry S., Jorissen A., Mayor M., Van Eck S., 1998a, A&AS, 131, 25
- [127] Udry S., Mayor M., Van Eck S., Jorissen A., Prévot L., Grenier S., Lindgren H., 1998b, A&AS, 131, 43
- [128] van Raai M. A., Lugaro M., Karakas A. I., García-Hernández D. A. & Yong D., 2012, A&A, 540, A44
- [129] Vanture A.D., 1992, AJ, 104, 1977
- [130] Wallerstein G., 1997, RvMP, 69,995
- [131] Woosley S. E. & Weaver T. A., 1995, ApJS, 101, 181
- [132] Worely C.C., Hill V. J., Sobeck J., Carretta E., 2013, A&A, 553, A47
- [133] Yang G.C., Liang Y.C., Spite M., Chen Y.Q., Zhao G. et al., 2016, RAA, 16, 1
Appendix


| Star name | ULSR | VLSR | WLSR | Vspa | pthin | pthick | phalo | Population |
|---|---|---|---|---|---|---|---|---|
| (kms-1) | (kms-1) | (kms-1) | (kms-1) | |||||
| HD 24035 | 11.180.52 | 27.320.38 | 16.350.58 | 33.740.15 | 0.99 | 0.01 | 0.00 | Thin disk |
| HD 32712 | 76.780.66 | 11.170.16 | 17.130.17 | 79.460.65 | 0.97 | 0.03 | 0.00 | Thin disk |
| HD 36650 | 21.440.13 | 18.640.17 | 10.090.13 | 30.150.06 | 0.99 | 0.01 | 0.00 | Thin disk |
| HD 94518 | 46.240.11 | 119.850.43 | 62.490.44 | 142.850.52 | 0.00 | 0.95 | 0.05 | Thick disk |
| HD 147609 | 19.450.87 | 15.640.90 | 4.111.03 | 25.300.06 | 0.99 | 0.01 | 0.00 | Thin disk |
| HD 154276 | 1.750.96 | 116.160.76 | 22.480.76 | 118.330.58 | 0.07 | 0.92 | 0.01 | Thick disk |
| HD 179832 | 9.210.15 | 5.800.32 | 4.980.21 | 11.970.41 | 0.99 | 0.01 | 0.00 | Thin disk |
| HD 207585 | 27.100.32 | 41.912.68 | 44.051.04 | 66.571.13 | 0.72 | 0.28 | 0.00 | Thin disk |
| HD 211173 | 48.530.88 | 27.710.42 | 4.790.54 | 56.090.51 | 0.99 | 0.01 | 0.00 | Thin disk |
| HD 219116 | 46.221.31 | 17.180.49 | 25.180.59 | 55.370.98 | 0.97 | 0.03 | 0.00 | Thin disk |