Present address: ]JILA, Boulder, CO 80309, USA
Improved limits for violations of local position invariance from atomic clock comparisons
Abstract
We compare two optical clocks based on the 2SD electric quadrupole (E2) and the 2SF electric octupole (E3) transition of 171Yb+ and measure the frequency ratio , improving upon previous measurements by an order of magnitude. Using two caesium fountain clocks, we find Hz, the most accurate determination of an optical transition frequency to date. Repeated measurements of both quantities over several years are analyzed for potential violations of local position invariance. We improve by factors of about 20 and 2 the limits for fractional temporal variations of the fine structure constant to and of the proton-to-electron mass ratio to . Using the annual variation of the Sun’s gravitational potential at Earth , we improve limits for a potential coupling of both constants to gravity, and .
Searches for violations of Einstein’s equivalence principle, such as tests of local Lorentz invariance (LLI) and local position invariance (LPI), have become one of the leading applications of low-energy high-precision experiments with laser-cooled atoms or ions [1]. As part of the Einstein equivalence principle, LPI states that the result of any non-gravitational experiment is independent of the position in space and time [2]. While theories beyond the standard model predict temporal variations of fundamental constants [3] and astronomical observations indicate a spatial variation of the fine structure constant [4], no experimental observation of any violation of LPI in a laboratory setting has been reported so far [1]. Promising test cases in tabletop experiments are comparisons of atomic clocks based on transitions that show a different dependence of their frequency on the value of fundamental constants [5, 6, 7, 8, 9]. Here, a potential variation would become observable as a change in the frequency ratio of the clocks, that nowadays reach fractional frequency uncertainties of one part in and below [10, 11, 12, 13]. While a small frequency uncertainty of the clock is a prerequisite to reveal undetected indications of physics beyond the standard model, it is of similar importance to have a large sensitivity of the measured quantity, i.e. the frequency ratio of the clocks used in the search, to the potentially varying constant. Particularly large magnification of relative shifts of is expected from reference transitions in highly-charged ions [14] and even larger for the low-energy nuclear transition in 229Th [15, 16]. The so far most stringent experimental limit on a temporal drift of is based on the frequency ratio of Al+ and Hg+ single-ion optical clocks, repeatedly measured over a period of one year in 2006-2007 [5].
In this Letter, we report a more stringent test of LPI and investigate variations of fundamental constants using comparisons between optical atomic clocks based on ytterbium ions and microwave caesium fountain clocks over a period of more than 4 years. The optical clocks employ the 2SD electric quadrupole (E2) or the 2SF electric octupole (E3) transition of a single trapped 171Yb+ ion. For the E2 transition, the natural lifetime of the excited state of about 50 ms limits the interrogation time and we typically use a single 40 ms Rabi pulse. The excited state lifetime of several years on the E3 transition [17] enables us to take full advantage of the available laser coherence time. With means of an optical frequency comb, we transfer the excellent frequency instability of a laser stabilized to a single-crystal cryogenic silicon cavity [18] to the probe laser systems and realize coherent interrogation times of up to 500 ms.
As already indicated by the different natural lifetimes, the electronic structures of the excited states of the E2 and E3 transition differ significantly. They are characterized by a single electron for the 2D3/2 state and a single hole in the otherwise filled shell for the 2F7/2 state. The proximity of the shell to the nucleus of this heavy ion makes it plausible that the E3 transition energy possesses large relativistic contributions, making this transition frequency the most sensitive to changes of among the presently operational optical clocks [19]. Furthermore, the opportunity to compare two different transition frequencies provided by the same ion reduces the complexity of the experimental apparatus.
The two independent clock systems used for our investigation have recently been evaluated to below fractional uncertainty on the E3 transition. In a comparison over a period of six months, they showed an agreement within their combined uncertainty and provided a stringent test of LLI [12]. Here we operate one clock system on the E3 and the other on the E2 transition to measure the frequency ratio and to perform tests of LPI.
We employ rotationally symmetric radio frequency Paul traps to confine single 171Yb+ ions, laser-cooled on the 2SP1/2 transition at 370 nm to the Doppler temperature limit at below 1 mK. Population trapping due to spontaneous decay, background gas collisions or successful excitation of the clock transitions is prevented by state repumping with 935 nm and 760 nm laser light. A large magnetic field of about 0.5 mT prevents coherent population trapping during the cooling period [20], while a well-controlled magnetic field of a few T during interrogation of the clock transition defines the orientation of the quantization axis [21]. Averaging over three mutually orthogonal orientations of the small magnetic field, tensorial shifts are measured and suppressed on the E2 transition [22]. For the E3 transition, the corresponding shift along a given orientation is inferred from the measured E2 shift and the known relative sensitivity of both transitions [21]. Frequency shifts due to residual ac magnetic fields from the radio frequency trap field as reported in [23] have been investigated and an upper bound is given in the uncertainty budget shown in table 1. There, the frequency shifts and corresponding uncertainties evaluated for the E2 transition are summarized, yielding a total uncertainty of . The leading uncertainty contribution caused by the frequency shift induced by thermal radiation has been substantially reduced using an investigation of the differential polarizability performed at the National Physical Laboratory [24], resulting in the significant improvement of the total uncertainty compared to our previously published value of [25].
Since most operational parameters have been chosen equally over the measurement period, the reproducibility of frequency shifts reported in table 1 is expected to be significantly better than the corresponding systematic uncertainty. Furthermore, uncertainties in atomic parameters, such as the differential polarizability, do not contribute to the reproducibility directly. For the E3 transition, frequency shifts have been evaluated to below total uncertainty [12] and contribute negligibly to the uncertainty of the comparison of the two clocks.
| Effect | |||
|---|---|---|---|
| Blackbody radiation | -495 | 27 | 3 |
| Quadrupole | 0 | 14 | 14 |
| Second-order Zeeman (rf) | 0 | 10 | 1 |
| Second-order Zeeman (dc) | 463 | 6 | 6 |
| Second-order Stark | -2.0 | 2 | 2 |
| Second-order Doppler | -1.0 | 1 | 1 |
| Servo | 0 | 1 | 1 |
| Total | -35 | 33 | 16 |
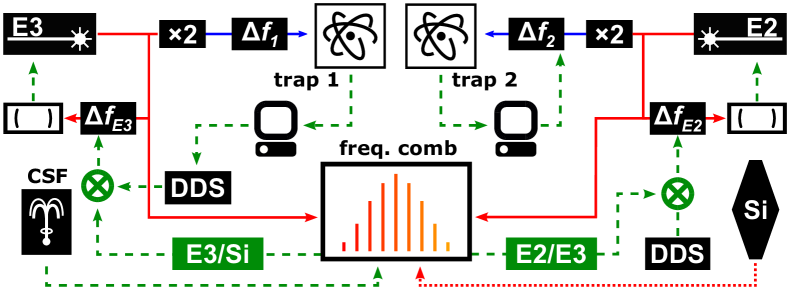
The ratio of the two reference transitions is measured by means of an optical frequency comb generator as shown in Fig. 1. To improve the short-term frequency instability of the E3 probe laser system, it is stabilized using the transfer oscillator concept [26] to a laser system referencing the cryogenic silicon cavity Si-2 [18]. Using the discriminator signal obtained by spectroscopy of the E3 transition, the ratio of the E3 clock laser frequency and that of the laser stabilized to the Si-2 cavity is adjusted using a digital second-order integrating servo system. Small frequency offsets required to compensate for the ac Stark shift of the probe laser in the interrogation sequence and to generate the discriminator signal are applied to an acousto-optic modulator (AOM) in front of the ion trap setup [27]. In this way, the probe laser light sent to the frequency comb is, up to a constant frequency offset and the correction for systematic frequency shifts, at the clock output frequency which approximates the unperturbed transition frequency. In contrast to the E3 spectroscopy, the E2 probe laser frequency at the frequency comb is stabilized with fixed ratio to that of the E3 probe laser. Based on spectroscopy of the E2 transition, the frequency of the AOM in front of the ion is corrected using a digital integrating servo system. The applied correction is recorded and permits calculation of
| (1) | |||||
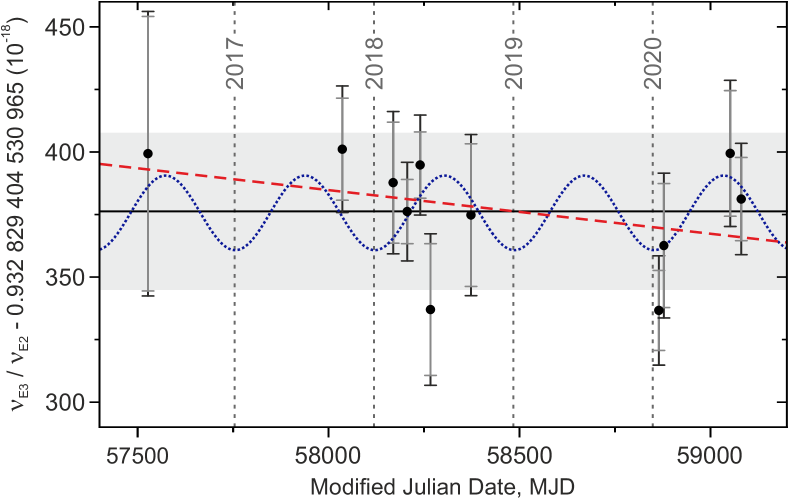
The results of 11 measurements of performed over a period of days are shown in Fig. 2. Taking into account only the statistical uncertainty of each measurement yields a reduced chi-square value of . Including the fractional reproducibility of the E2 transition of yields . The weighted average of the complete data set gives . The total fractional uncertainty of is dominated by the systematic uncertainty of the E2 transition . The statistical contribution and the systematic uncertainty of the E3 transition are negligible. This result differs by standard uncertainties from a previous measurement and improves the uncertainty by one order of magnitude [6].
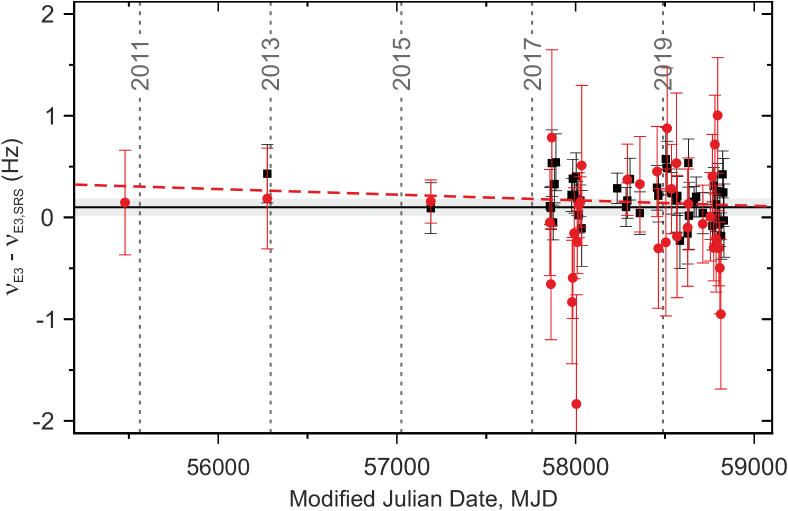
Besides the measurement of the optical frequency ratio, the E3 transition frequency is measured with the microwave caesium fountain clocks CSF1 and CSF2 of our laboratory [28]. To increase the total measurement time, interruptions shorter than one day in the operation of the optical clock are bridged by using a hydrogen maser as a flywheel oscillator [29, 30]. Numerical simulations of the typically observed frequency instability of the H-maser allow us to evaluate the corresponding uncertainty contribution. Figure 3 shows this data together with results previously acquired using the same clocks: The measurements centered at Modified Julian Date (MJD) 55479 and MJD 56275 have been published [31, 7] and the values at MJD 57190 were obtained during a European clock comparison campaign [32].
The frequency of the E3 transition is determined as the weighted average of the contribution of each caesium fountain clock. The weights of each data point correspond to the inverse squared-sum of the systematic uncertainty and the statistical uncertainty that includes a contribution from the extrapolation using the H-maser. From data recorded between MJD 57854 and MJD 58830, we find an averaged value Hz obtained from individual results with CSF1 and CSF2 of Hz and Hz with and hours of measurement. The CSF1 data yields and the CSF2 data . The total fractional uncertainty of is dominated by the systematic uncertainties of and of CSF1 and CSF2 [28, 34]. The result is in excellent agreement with previous measurements and reduces the uncertainty in the frequency by more than a factor of 3 [7, 35]. To our knowledge is the third optical transition for which the absolute frequency is reported with a fractional uncertainty below [36, 34, 37] and our result represents the most accurate measurement of an optical transition frequency to date. With the frequency ratio determined above, the measurement of yields Hz.
The measurements presented above provide a stringent test of LPI for the specific pairs of compared atomic transition frequencies. Based on a general parametrization [19], a possible variation of any atomic transition frequency can be related to variations of three constants: the fine structure constant , the proton-to-electron mass ratio and the ratio between the average quark mass and the quantum chromodynamic scale , according to
| (2) |
where , and describe the sensitivity of the transition frequency to the constants. A sensitivity of results from the nuclear magneton for all magnetic hyperfine splittings, while varies for hyperfine transitions of different atomic species. Both, hyperfine and optical electronic transitions, obtain a sensitivity for variations of from relativistic contributions to the transition energies. The factors and can be determined with numerical many-body calculations [19, 38].
The ratio of the two 171Yb+ transition frequencies is sensitive to variations of only and an explicit sensitivity has been calculated [19]. The data presented in Fig. 2 show a fractional temporal drift of the frequency ratio and allows us to infer a potential temporal variation , compatible with zero. This constitutes an improvement over the previous limits by more than one order of magnitude [5, 6, 7]. This finding is summarized in Table 2 together with limits obtained below.
| this work | previous | this work | previous | |
| -6.8(7.5) | -9.7(7.7) | |||
| 1.0(1.1) | -16(23) [5] | 1.4(1.1) | -5.3(10) [39] | |
| -31(34) | 20(410) [7] | -4(44) | ||
| -8(36) | [36] | 7(45) | 35(59) [34] | |
In comparisons of two hyperfine transition frequencies of different atoms the sensitivity to is common-mode and a dependence only on and remains. From measurements over 14 years with microwave fountain clocks with 133Cs and 87Rb atoms, and the previous stringent constraint on [5], a potential temporal variation in has been restricted to in Ref. [8]. Comparisons between frequencies of electronic transitions and hyperfine transitions, such as absolute frequency measurements of optical transitions using caesium clocks, provide a non-zero sensitivity on , and . For the measurements of with caesium fountain clocks shown in Fig. 3, we find a relative temporal drift . Using the restrictions on from the measurements and on from Ref [8], we find . This improves the uncertainty in the limits obtained in Refs [36, 34] by about a factor 2.
In addition to the search for a steady temporal drift, we can use the data presented above to search for a coupling of the fundamental constants and to gravity in an analysis of gravitational red-shift [2]. The variation of the Sun’s gravitational potential on Earth due to the ellipticity of the Earth orbit can be approximated by with , the speed of light, the time of the perihelion 2018 and the anomalistic year. Similarly to the search for a temporal variation, we start with data of the optical frequency ratio and investigate for a potential coupling to gravity by non-linear least square fitting of to the data shown in Fig. 2 with and as free parameters. We find a relative amplitude . Because of the large sensitivity , the result limits a potential coupling of to gravity to and improves previous limits from Ref. [39] by one order of magnitude.
We combine this result with the obtained oscillation amplitude found in a comparison between caesium clocks and H-masers [9] which yields . For the data shown in Fig. 3, we find when searching for an oscillation induced by the annual variation of the gravitational potential. In combination with the dependence on and given above, we find slightly improving the limit obtained in [34].
The presented results on LPI violating parameters, summarized in Table 2, are all consistent with zero to within less than 1.3 standard deviations and support the validity of this fundamental assumption of general relativity in the solar system in the present epoch. The large potential for improved searches promised by the small fractional uncertainty of the E3 clock and its high sensitivity to changes of can be readily explored in comparisons with other high performance clocks. This also opens up new possibilities in searches for ultralight scalar dark matter [40, 41].
We thank Thomas Legero, Erik Benkler and Uwe Sterr for providing the ultrastable laser reference Si-2 and Tara Cubel Liebisch for a critical reading of the manuscript. This project has received funding from the EMPIR programme co-financed by the Participating States and from the European Union’s Horizon 2020 research and innovation programme. It has been supported by the EMPIR projects 17FUN07 ”Coulomb Crystals for Clocks” and 18SIB05 ”Robust Optical Clocks for International Timescales”. Furthermore this work has been supported by the Max-Planck-RIKEN-PTB-Center for Time, Constants and Fundamental Symmetries, and by the Deutsche Forschungsgemeinschaft (DFG, German Research Foundation) under CRC 1227 DQ-mat within project B02. C. Sanner thanks the Alexander von Humboldt Foundation for support.
References
- Safronova et al. [2018] M. S. Safronova, D. Budker, D. DeMille, D. F. Jackson Kimball, A. Derevianko, and C. W. Clark, Rev. Mod. Phys. 90, 025008 (2018).
- Will [2014] C. M. Will, Living Rev. Relativity 9, 3 (2014), [Online Article]: cited 2014-07-01, updated in 2014.
- Martins [2017] C. J. A. P. Martins, Reports on Progress in Physics 80, 126902 (2017).
- Wilczynska et al. [2020] M. R. Wilczynska, J. K. Webb, M. Bainbridge, J. D. Barrow, S. E. I. Bosman, R. F. Carswell, M. P. Dabrowski, V. Dumont, C.-C. Lee, A. C. Leite, K. Leszczyńska, J. Liske, K. Marosek, C. J. A. P. Martins, D. Milaković, P. Molaro, and L. Pasquini, Science Advances 6, 10.1126/sciadv.aay9672 (2020).
- Rosenband et al. [2008] T. Rosenband, D. B. Hume, P. O. Schmidt, C. W. Chou, A. Brusch, L. Lorini, W. H. Oskay, R. E. Drullinger, T. M. Fortier, J. E. Stalnaker, S. A. Diddams, W. C. Swann, N. R. Newbury, W. M. Itano, D. J. Wineland, and J. C. Bergquist, Science 319, 1808 (2008).
- Godun et al. [2014] R. M. Godun, P. B. R. Nisbet-Jones, J. M. Jones, S. A. King, L. A. M. Johnson, H. S. Margolis, K. Szymaniec, S. N. Lea, K. Bongs, and P. Gill, Phys. Rev. Lett. 113, 210801 (2014).
- Huntemann et al. [2014] N. Huntemann, B. Lipphardt, C. Tamm, V. Gerginov, S. Weyers, and E. Peik, Phys. Rev. Lett. 113, 210802 (2014).
- Guéna et al. [2012] J. Guéna, M. Abgrall, D. Rovera, P. Rosenbusch, M. E. Tobar, P. Laurent, A. Clairon, and S. Bize, Phys. Rev. Lett. 109, 080801 (2012).
- Ashby et al. [2018] N. Ashby, T. E. Parker, and B. R. Patla, Nature Physics 14, 822 (2018).
- McGrew et al. [2018] W. F. McGrew, X. Zhang, R. J. Fasano, S. A. Schäffer, K. Beloy, D. Nicolodi, R. C. Brown, N. Hinkley, G. Milan, M. Schioppo, T. H. Yoon, and A. D. Ludlow, Nature 564, 87 (2018).
- Bothwell et al. [2019] T. Bothwell, D. Kedar, E. Oelker, J. M. Robinson, S. L. Bromley, W. L. Tew, J. Ye, and C. J. Kennedy, Metrologia 56, 065004 (2019).
- Sanner et al. [2019] C. Sanner, N. Huntemann, R. Lange, C. Tamm, E. Peik, M. S. Safronova, and S. G. Porsev, Nature 567, 204 (2019).
- Brewer et al. [2019] S. M. Brewer, J.-S. Chen, A. M. Hankin, E. R. Clements, C. W. Chou, D. J. Wineland, D. B. Hume, and D. R. Leibrandt, Phys. Rev. Lett. 123, 033201 (2019).
- Kozlov et al. [2018] M. G. Kozlov, M. S. Safronova, J. R. Crespo López-Urrutia, and P. O. Schmidt, Rev. Mod. Phys. 90, 045005 (2018).
- Flambaum [2006] V. V. Flambaum, Phys. Rev. Lett. 97, 092502 (2006).
- Thielking et al. [2018] J. Thielking, M. V. Okhapkin, P. Głowacki, D. M. Meier, L. von der Wense, B. Seiferle, C. E. Düllmann, P. G. Thirolf, and E. Peik, Nature 556, 321 (2018).
- Roberts et al. [2000] M. Roberts, P. Taylor, G. P. Barwood, W. R. C. Rowley, and P. Gill, Phys. Rev. A 62, 020501(R) (2000).
- Matei et al. [2017] D. G. Matei, T. Legero, S. Häfner, C. Grebing, R. Weyrich, W. Zhang, L. Sonderhouse, J. M. Robinson, J. Ye, F. Riehle, and U. Sterr, Phys. Rev. Lett. 118, 263202 (2017).
- Flambaum and Dzuba [2009] V. V. Flambaum and V. A. Dzuba, Can. J. Phys. 87, 25 (2009).
- Ejtemaee et al. [2010] S. Ejtemaee, R. Thomas, and P. C. Haljan, Phys. Rev. A 82, 063419 (2010).
- Lange et al. [2020] R. Lange, N. Huntemann, C. Sanner, H. Shao, B. Lipphardt, C. Tamm, and E. Peik, Phys. Rev. Lett. 125, 143201 (2020).
- Itano [2000] W. M. Itano, J. Res. Natl. Inst. Stand. Technol. 105, 829 (2000), also see erratum: J. Res. NIST 11, 255 (2006).
- Gan et al. [2018] H. C. J. Gan, G. Maslennikov, K.-W. Tseng, T. R. Tan, R. Kaewuam, K. J. Arnold, D. Matsukevich, and M. D. Barrett, Phys. Rev. A 98, 032514 (2018).
- Baynham et al. [2018a] C. F. A. Baynham, E. A. Curtis, R. M. Godun, J. M. Jones, P. B. R. Nisbet-Jones, P. E. G. Baird, K. Bongs, P. Gill, T. Fordell, T. Hieta, T. Lindvall, M. T. Spidell, and J. H. Lehman, Measurement of differential polarizabilities at a mid-infrared wavelength in 171Yb+, arXiv:1801.10134 [physics.atom-ph] (2018a).
- Tamm et al. [2014] C. Tamm, N. Huntemann, B. Lipphardt, V. Gerginov, N. Nemitz, M. Kazda, S. Weyers, and E. Peik, Phys. Rev. A 89, 023820 (2014).
- Stenger et al. [2002] J. Stenger, H. Schnatz, C. Tamm, and H. R. Telle, Phys. Rev. Lett. 88, 073601 (2002).
- Huntemann et al. [2016] N. Huntemann, C. Sanner, B. Lipphardt, C. Tamm, and E. Peik, Phys. Rev. Lett. 116, 063001 (2016).
- Weyers et al. [2018] S. Weyers, V. Gerginov, M. Kazda, J. Rahm, B. Lipphardt, G. Dobrev, and K. Gibble, Metrologia 55, 789 (2018).
- Leute et al. [2016] J. Leute, N. Huntemann, B. Lipphardt, C. Tamm, P. B. R. Nisbet-Jones, S. A. King, R. M. Godun, J. M. Jones, H. S. Margolis, P. B. Whibberley, A. Wallin, M. Merimaa, P. Gill, and E. Peik, IEEE Trans. Ultrason. Ferroelectr. Freq. Control 63, 981 (2016).
- Grebing et al. [2016] C. Grebing, A. Al-Masoudi, S. Dörscher, S. Häfner, V. Gerginov, S. Weyers, B. Lipphardt, F. Riehle, U. Sterr, and C. Lisdat, Optica 3, 563 (2016).
- Huntemann et al. [2012] N. Huntemann, M. Okhapkin, B. Lipphardt, S. Weyers, C. Tamm, and E. Peik, Phys. Rev. Lett. 108, 090801 (2012).
- Riedel et al. [2020] F. Riedel, A. Al-Masoudi, E. Benkler, S. Dörscher, V. Gerginov, C. Grebing, S. Häfner, N. Huntemann, B. Lipphardt, C. Lisdat, E. Peik, D. Piester, C. Sanner, C. Tamm, S. Weyers, H. Denker, L. Timmen, C. Voigt, D. Calonico, G. Cerretto, G. A. Costanzo, F. Levi, I. Sesia, J. Achkar, J. Guéna, M. Abgrall, G. D. Rovera, B. Chupin, C. Shi, S. Bilicki, E. Bookjans, J. Lodewyck, R. Le Targat, P. Delva, S. Bize, F. N. Baynes, C. Baynham, W. Bowden, P. Gill, R. M. Godun, I. R. Hill, R. Hobson, J. M. Jones, S. A. King, P. Nisbet-Jones, A. Rolland, S. L. Shemar, P. B. Whibberley, and H. S. Margolis, Metrologia 57, 045005 (2020).
- Riehle et al. [2018] F. Riehle, P. Gill, F. Arias, and L. Robertsson, Metrologia 55, 188 (2018).
- Schwarz et al. [2020] R. Schwarz, S. Dörscher, A. Al-Masoudi, E. Benkler, T. Legero, U. Sterr, S. Weyers, J. Rahm, B. Lipphardt, and C. Lisdat, Phys. Rev. Research 2, 033242 (2020).
- Baynham et al. [2018b] C. F. A. Baynham, R. M. Godun, J. M. Jones, S. A. King, P. B. R. Nisbet-Jones, F. Baynes, A. Rolland, P. E. G. Baird, K. Bongs, P. Gill, and H. S. Margolis, J. Mod. Optics 65, 585 (2018b).
- McGrew et al. [2019] W. F. McGrew, X. Zhang, H. Leopardi, R. J. Fasano, D. Nicolodi, K. Beloy, J. Yao, J. A. Sherman, S. A. Schäffer, J. Savory, R. C. Brown, S. Römisch, C. W. Oates, T. E. Parker, T. M. Fortier, and A. D. Ludlow, Optica 6, 448 (2019).
- Nemitz et al. [2020] N. Nemitz, T. Gotoh, F. Nakagawa, H. Ito, Y. Hanado, T. Ido, and H. Hachisu, Metrologia 10.1088/1681-7575/abc232 (2020).
- Dinh et al. [2009] T. H. Dinh, A. Dunning, V. A. Dzuba, and V. V. Flambaum, Phys. Rev. A 79, 054102 (2009).
- Dzuba and Flambaum [2017] V. A. Dzuba and V. V. Flambaum, Phys. Rev. D 95, 015019 (2017).
- Arvanitaki et al. [2015] A. Arvanitaki, J. Huang, and K. Van Tilburg, Phys. Rev. D 91, 015015 (2015).
- Roberts et al. [2020] B. M. Roberts, P. Delva, A. Al-Masoudi, A. Amy-Klein, C. Bærentsen, C. F. A. Baynham, E. Benkler, S. Bilicki, W. Bowden, E. Cantin, E. A. Curtis, S. Dörscher, F. Frank, P. Gill, R. M. Godun, G. Grosche, A. Hees, I. R. Hill, R. Hobson, N. Huntemann, J. Kronjäger, S. Koke, A. Kuhl, R. Lange, T. Legero, B. Lipphardt, C. Lisdat, J. Lodewyck, O. Lopez, H. S. Margolis, H. Álvarez-Martínez, F. Meynadier, F. Ozimek, E. Peik, P.-E. Pottie, N. Quintin, R. Schwarz, C. Sanner, M. Schioppo, A. Silva, U. Sterr, C. Tamm, R. LeTargat, P. Tuckey, G. Vallet, T. Waterholter, D. Xu, and P. Wolf, New J. Phys. 22, 093010 (2020).