Response of a Li-glass/multi-anode photomultiplier detector to collimated thermal-neutron beams111The data set doi:10.5281/zenodo.4095210 is available for download from https://zenodo.org/record/4095210.
Abstract
The response of a position-sensitive Li-glass scintillator detector being developed for thermal-neutron detection with 6 mm position resolution has been investigated using collimated beams of thermal neutrons. The detector was moved perpendicularly through the neutron beams in 0.5 to 1.0 mm horizontal and vertical steps. Scintillation was detected in an 8 8 pixel multi-anode photomultiplier tube on an event-by-event basis. In general, several pixels registered large signals at each neutron-beam location. The number of pixels registering signal above a set threshold was investigated, with the maximization of the single-hit efficiency over the largest possible area of the detector as the primary goal. At a threshold of 50% of the mean of the full-deposition peak, 80% of the events were registered in a single pixel, resulting in an effective position resolution of 5 mm in X and Y. Lower thresholds generally resulted in events demonstrating higher pixel multiplicities, but these events could also be localized with 5 mm position resolution.
keywords:
SoNDe thermal-neutron detector, GS20 scintillator, Li-glass, H12700A multi-anode photomultiplier, position-dependent response, neutrons, European Spallation Source1 Introduction
The scientific program to be performed at the European Spallation Source (ESS) [1, 3, 4, 2] requires position-sensitive, 3He-free [8, 7, 6, 5], thermal-neutron detectors with high counting-rate capability. Small-angle neutron-scattering experiments requiring two-dimensional position sensitivity [9, 15, 16, 17, 10, 18, 12, 11, 14, 13] will be performed with Solid-state Neutron Detectors (SoNDe) [19, 20, 21, 23]. The SoNDe concept employs an array of detector modules to instrument large areas with a reconstruction accuracy of 6 mm on the position of the detected neutron. A SoNDe “module" consists of a thin, thermal-neutron sensitive, Li-glass scintillator sheet (GS20) attached to a 64-pixel multi-anode photomultiplier tube (MAPMT). Signals resulting from the scintillation light are processed using custom electronics [23]. In the envisioned operation mode at ESS, known as “Time of flight" mode (TOF), these electronics timestamp all pixels having signals above threshold if any single pixel amplitude exceeds threshold. Events involving the firing of a single pixel (multiplicity 1 events) are thus straightforward to interpret. At the boundaries between pixels and in the corners, scintillation light sufficient to trigger several pixels (multiplicity 1 events) is often registered. The behavior of clusters of bordering pixels in these regions is thus of interest. LEDs and laser light have been used extensively to study the detailed responses of several different MAPMTs [24, 25, 26, 27, 28, 29, 30, 31, 32, 33]. Previously, scans of a 1 mm collimated beam of 4 MeV -particles from an 241Am source [34] and diameter beams of 2.5 MeV protons and deuterons [35] have been used to study the position-dependent response of a SoNDe detector prototype in regions well-removed from the edges of the detector acceptance. Thermal neutrons have also been used to perform first tests both on similar detectors [36] and on SoNDe modules [23]. The thermal-neutron interaction with the 6Li of the Li-glass has a -value of 4.78 MeV and results in an -particle (2.05 MeV) and a triton (2.73 MeV). In this work, a SoNDe module has been systematically scanned through beams of thermal 333 The 2.0 and neutron beams employed in this work had energies lying at the upper end of the cold-neutron energy window and are thus “not quite but nearly” thermal. neutrons. The goals were to:
-
1.
complement the existing -particle, proton, and deuteron studies of the position-sensitive behavior of the detector, for events triggering multiple pixels to establish the response at the pixel boundaries and the corners where four pixels meet
-
2.
provide thermal-neutron data with 1 mm precision on the position sensitivity of the detector for events triggering only one pixel, as a single-pixel mode-of-operation is anticipated as the ESS default
-
3.
map the response of the detector as a function of both threshold and beam position for events which only trigger one pixel
-
4.
determine the detector threshold that maximizes the number of single-pixel events
-
5.
study regions within the detector where the position-reconstruction accuracy for an event better than 6 mm may be obtained for 1 events
-
6.
provide a thermal-neutron dataset at the edge of the detector, for adjacent pixels with the highest gain contrast, to aid our understanding of the SoNDe module at its periphery
-
7.
implement a SoNDe module into a prototype of the ESS data-acquisition architecture.
2 Apparatus
2.1 Neutron beams
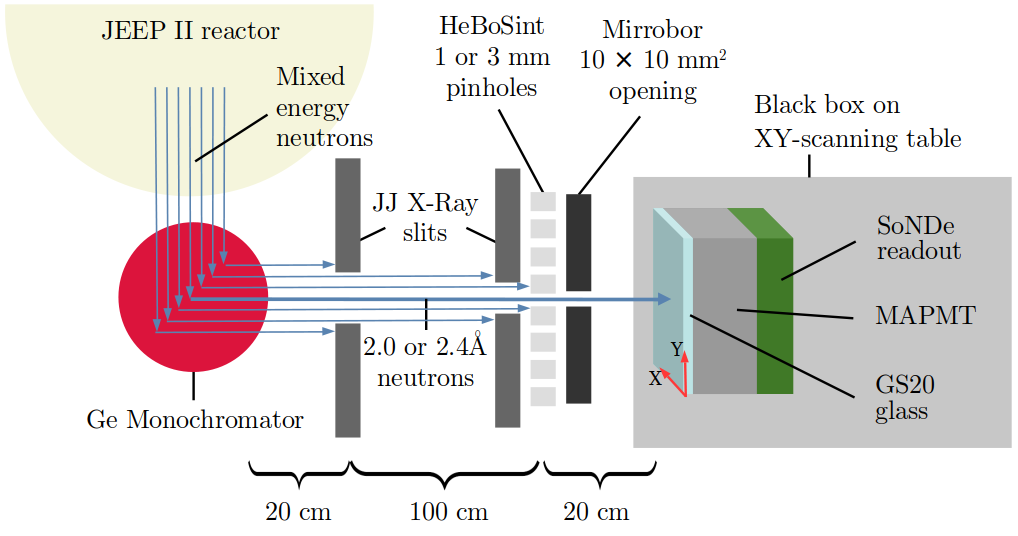
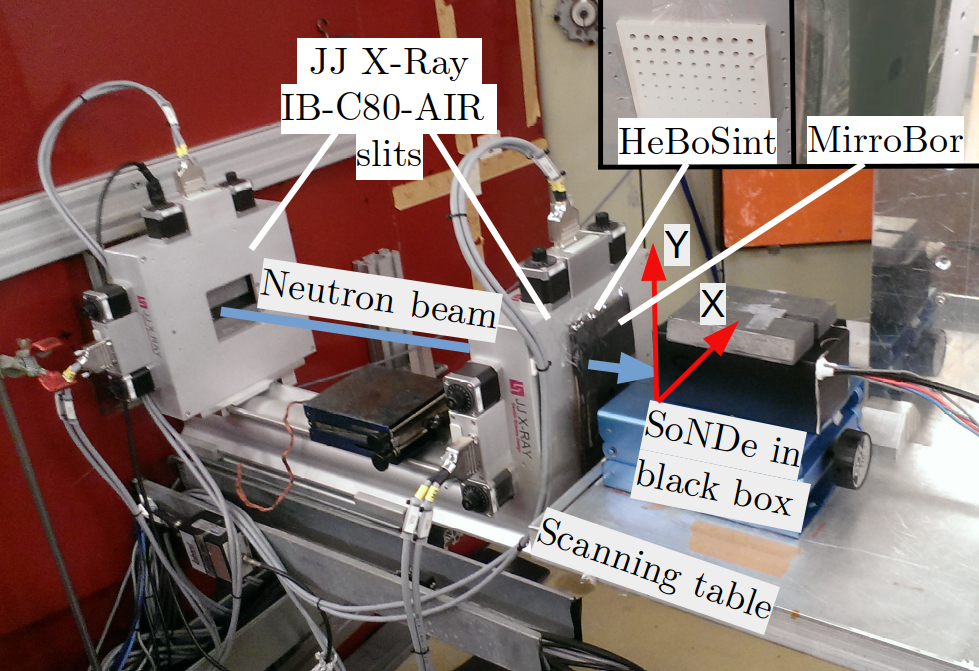
The measurements were performed at the R2D2 beamline at the JEEP II reactor [37, 38] at the Institute for Energy Technology (IFE) [39] in Norway. The setup is illustrated in Fig. 1. The nominal central-beam flux was 105/s/cm2 with a 0.6∘ divergence. Thermal-neutron beams (, 18 meV and , 13 meV) were defined using a composite Ge wafer monochromator [38]. The resulting thermal-neutron beams drifted 20 cm to the first of a pair of JJ X-Ray IB-C80-AIR slits [40] which employed borated-aluminum blades to control the beam flux. The slit spacing was 100 cm, with the downstream slit located 20 cm upstream of the detector. A 5 mm thick HeBoSint mask [41] with pinholes was used to further collimate the beam to either 1 mm or 3 mm in diameter. A stack of three 2 mm thick Mirrobor sheets [42] with a 100 mm2 square aperture acted as a final barrier to any neutrons surviving the upstream collimation. The resulting beam was incident upon a black box containing the SoNDe module under investigation.
2.2 SoNDe module
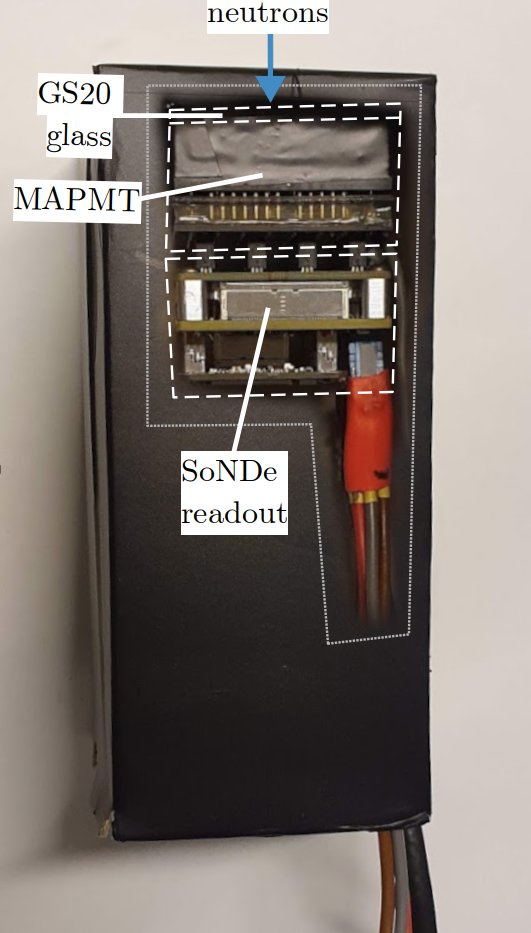
A SoNDe module (Fig. 2) described in the following sections consists of three basic components:
-
1.
a 1 mm thick Li-glass scintillator sheet
-
2.
a H12700A MAPMT
-
3.
purpose-built SoNDe readout electronics.

2.2.1 Li-glass scintillator
The scintillator employed was a cerium-activated lithium-silicate glass known as GS20 [43, 44, 45, 46]. Provided by Scintacor [47], it was developed for the detection of thermal neutrons. The 50 mm 50 mm 1 mm sheet with polished faces and rough-cut 1 mm edges was dry-fitted to the MAPMT window and held in place with tape along the edges. The dry-fit approach was chosen to avoid the degradation of any optical-coupling medium. A piece of standard white copy paper (136 g/cm2) placed over the upstream face of the GS20 diffusely reflected scintillation light back towards the MAPMT, increasing the amount of scintillation light reaching the MAPMT by 40%. The (assumed uniform) density of 6Li in GS20 is 1.58 atoms/cm3. The cross section for the n (25 meV) + 6Li 3H (2.73 MeV) + (2.05 MeV) capture reaction is 940 b, which yields a detection efficiency of 75% for the 1 mm sheet. The average ranges of the 3H and -particle in the GS20 are and , respectively [48]. The 4.78 MeV capture reaction results in a 6600 scintillation photon full-deposition peak [23] (roughly equivalent to 20-30% of anthracene) peaked at 390 nm [49]. Scintillation-light transport from the GS20 (refractive index 1.55 at 395 nm) across a air gap (refractive index 1) due to the concavity of the MAPMT borosilicate-glass window and then into the MAPMT window (refractive index 1.53) is generally inefficient.
2.2.2 Multi-anode photomultiplier tube
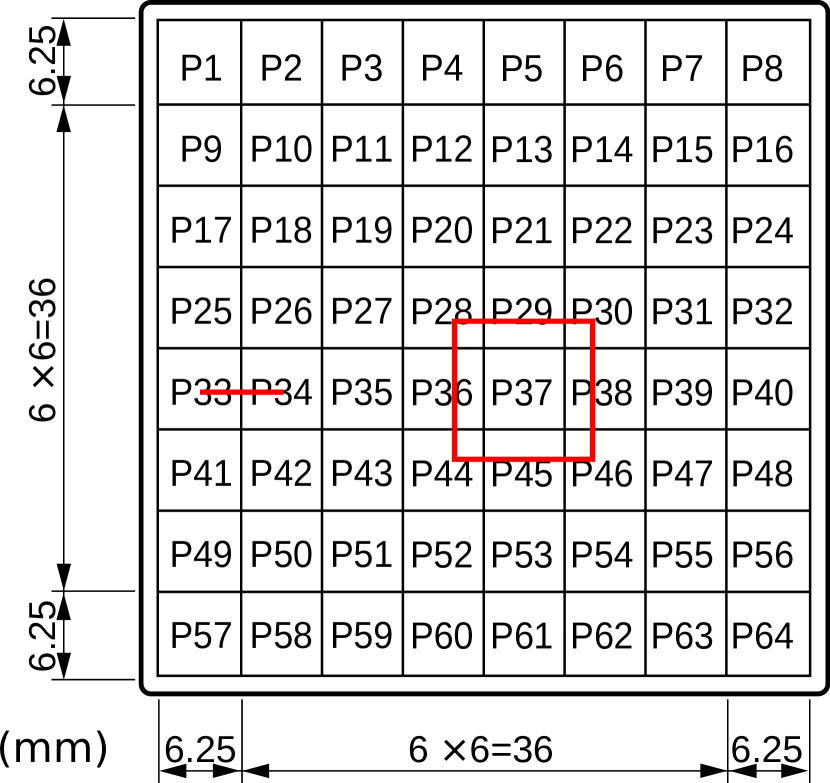
An 8 8 pixel (6 mm 6 mm per pixel) 10 stage Hamamatsu type H12700A MAPMT with a borosilicate glass window was employed. The sensitive bialkali photocathode area is 48.5 mm 48.5 mm, while the outer dimensions are 52 mm 52 mm, resulting in 87% of the surface being active. The peak quantum efficiency of the photocathode is 33% at 380 nm, nicely overlapping the 390 nm (peak) scintillation-light distribution produced by GS20. For the MAPMT used here, at a cathode-to-anode voltage of 1000 V, the Hamamatsu data sheet specified a gain of 2.09 106, a dark current of 2.67 nA, a (worst-case) factor 1.7 gain difference between pixels, and 2 % electronic crosstalk between pixels. Calvi et al. [31] report that electronic crosstalk is actually dependent upon both the pixel and the position within this pixel and that it fluctuates differently near horizontal and vertical edges (see below). The operating voltage was -900 V. Corrections for pixel-to-pixel gain variations were performed offline using a gain map measured with the 3 mm, neutron beam used to irradiate each pixel center consecutively, as described in [35].
2.2.3 Readout electronics
A compact readout module designed for the H12700A MAPMT by IDEAS [51] was employed for data acquisition. The 113 g module is 50 mm 50 mm 55 mm (deep). It consists of two boards: front-end and controller [23]. The front-end board uses four 16-channel IDE3465 ASICs [22] to digitize the MAPMT signals with a precision of 14 bits. The controller board accomodates an FPGA and a MiniIO port for ethernet communication. The electronics can operate in two modes: the TOF mode previously discussed and “All-channel Spectroscopy" (ACS) that was used here. In ACS mode, when any pixel-amplitude threshold was exceeded, the digitized signal amplitudes from all 64 pixels were read out. The ACS rate limitation is 10 kHz, which corresponds to 4 MHz/m2. A hardware threshold of 500 ADC channels was employed, which corresponds to 5% of the mean channel of the 4.78 MeV full-energy deposition peak measured by a single pixel for irradiation at its center. Higher thresholds were applied offline. Control, visualization, and data logging were provided by the ESS Event Formation Unit (EFU) [52, 53, 54] and the ESS Daquiri visualization tool [55] both running on a Centos 7 PC. The SoNDe module and the EFU were connected via switched 1 Gbit/s Ethernet. The SoNDe module is configured with TCP/IP and transmits readout data over UDP/IP to the EFU [56] in a manner similar to that anticipated for operation at ESS. The EFU, designed for use by ESS instruments, employs an acquisition that also closely resembles the anticipated operation mode for ESS.
2.3 GEANT4 simulation
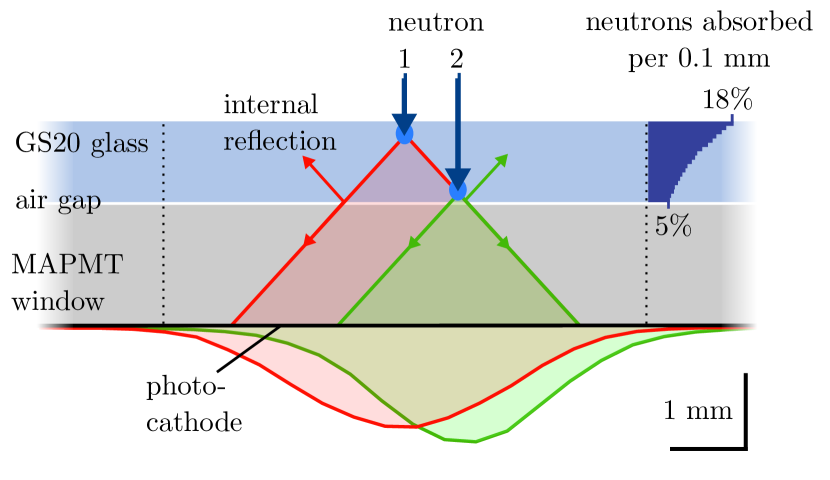
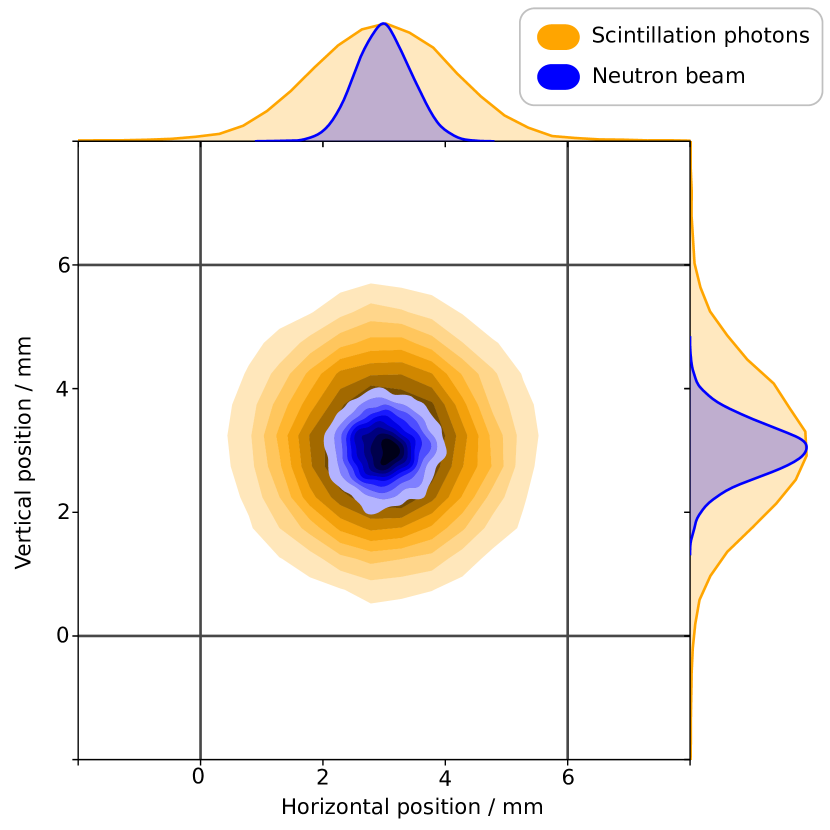
A detailed computer model of a SoNDe module is nearing completion [57]. This C++ model employs the GEANT4 Monte Carlo toolkit [58] version 4.10.6 [59]. It includes the GS20 sheet together with the glass window and photocathode of the MAPMT. Optical-coupling media may be placed between the GS20 and the MAPMT window. The model simulates the interactions of ionizing radiation in the GS20 to the level of the emission of scintillation light and includes the transport of the scintillation photons to the MAPMT cathode. It also includes a model for electronic crosstalk. Electronic crosstalk results from voltage divider biasing, stray capacitances leading to AC coupling between pixel anodes, and charge sharing across neighboring dynode chains, all known to affect the performance of the H12700 MAPMT. It results in signal from the illuminated pixel leaking into neighboring pixels. Defined for each neighboring pixel as the ratio of the induced signal to the signal registered in the illuminated pixel, it has been reported to be up to 3% in vertically adjacent pixels and up to 7% in horizontally adjacent pixels [31]. The probability of signal leakage has been shown to be lowest at a pixel center and highest at pixel edges. Based on these measurements, electronic crosstalk was modelled on an individual scintillation-photon basis with the crosstalk probability increasing linearly as the pixel edge was approached. For uniform pixel illumination, the crosstalk model was configured so that once all scintillation photons were detected, adjacent pixels each registered 5% of the signal detected in the illuminated pixel. Figure 3 presents some results from the GEANT4 simulation of the scintillation light. In Fig. 3(a), 2D projections of scintillation-light cones resulting from individual neutrons interacting at the upstream and downstream faces of the GS20 sheet are shown, together with the resulting simulated distributions of scintillation light arriving at the photocathode of the MAPMT. The projections represent the opening angle defined by total internal reflection, and have been drawn to guide the eye. The scintillation photons from the absorption of a single upstream neutron have a normal distribution with 3.5 mm FWHM at the photocathode, and can completely illuminate an entire pixel, even reaching into the adjacent pixels. The absorption of a single downstream neutron results in a 3 mm FWHM normal distribution of scintillation photons at the photocathode. In the first 0.1 mm of the GS20 sheet, 18% of the incoming neutrons are absorbed by the 6Li in the scintillator. This process continues exponentially so that 5% of the incident neutrons are absorbed in the last 0.1 mm of the 1 mm thick GS20. There is a 22% chance of a neutron passing through the GS20 without interacting. In Fig. 3(b), the relationship between the 1 mm FWHM extended neutron beam incident upon the middle of a pixel and the 3.5 mm FWHM distribution of scintillation photons at the photocathode of a pixel is shown. The 3 mm FWHM neutron-beam scintillation-light footprint covers essentially the entire MAPMT pixel. The paper shown in Fig. 2(a) diffusely scatters the scintillation light back towards the photocathode, resulting in a 40% increase in the detected yield, and increasing the width of the light cone by 2%.
3 Measurement
Collimated thermal-neutron beams were used to irradiate the SoNDe module at well-defined positions. After passing through the hole in the Mirrobor sheet, neutrons entered the black box which was positioned on an XY coordinate scanner instrumented with two translation stages (M-IMS600 and M-IMS300) and a motor controller (ESP301), all from MKS Newport Corporation [60]. The SoNDe module was located inside the black box and positioned so that its face was parallel to the upstream side of the black box, and both were perpendicular to the neutron beam. The beam struck the upstream face of the GS20 sheet after passing through a thin layer of tape and and white paper. The SoNDe module was stepped through the neutron beams with a stepsize of 0.5-1 mm in the X and Y directions. The anode signals from each of the MAPMT pixels were processed using the dedicated SoNDe electronics. Negative polarity analog pulse heights for each event with at least one pixel producing a signal above the 500 ADC channel threshold were recorded. Data were recorded for 15 s (10000 events) at each point on a scan, followed by a motor translation, so that a complete scan of 2 2 pixels with 0.5 mm spacing took several hours. Analysis of the data was performed using Python-based [61] pandas [62] and SciPy [63] tools.
4 Results
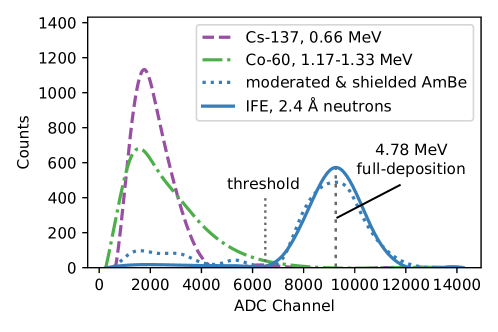
Figure 4 shows results from irradiations of the detector with uncollimated 60Co (Eγ 1.17, 1.33 MeV) and 137Cs (Eγ 662 keV) -ray sources, a moderated and heavily -ray shielded (but uncollimated) Am/Be neutron source, and the 3 mm, neutron beam directed at the center of P37. Note that none of the source irradiations occurred in situ, but instead were performed subsequently with the same experimental equipment and setup parameters at the Source-Testing Facility at the University of Lund in Sweden [64]. For each irradiation, events corresponding to the largest signal in P37 were selected. The 4.78 MeV full-deposition peak resulting from neutron capture on 6Li (6600 scintillation photons) is located at about ADC channel 9090 (0.53 keV/channel). The distribution from 1 MeV -rays, which are typical backgrounds at accelerator facilities such as ESS, slightly overlap the neutron peak. A discriminator threshold of 72% of the mean of the full-deposition peak (ADC channel 6500) discriminates against 93% of the detected 1 MeV -rays while retaining the neutron peak.
As previous work [24, 25, 26, 27, 28, 29, 32, 34, 35] has clearly demonstrated that MAPMT pixel-gain maps depend strongly upon the method of illumination, all of the results presented below have been pedestal subtracted and gain corrected with pixel-gain maps produced from 3 mm, neutron-beam irradiations of the pixel centers. Figure 5 shows data and GEANT4 simulations for a horizontal scan of the SoNDe module through the 1 mm FWHM, neutron beam. The module was moved from position A (center, edge pixel P33) to position G (center, P34) in 0.5 mm steps. For 13 scan positions, neutron pulse-height spectra and GEANT4-simulated scintillation-light yields are shown for P33 (Figs. 5(a), 5(c)) and P34 (Figs. 5(b), 5(d)). The simulations include the nominal 5% electronic crosstalk contribution previously discussed (see also the discussion associated with Fig. 6 below). The location of the neutron beam determines the amount of scintillation light collected by a single pixel. The single-pixel signal amplitude is largest when the neutron beam strikes the pixel center, smaller when the neutron beam strikes the pixel edge, and smallest when the neutron beam strikes the pixel corner. Scintillation produced when the beam strikes the border between two pixels is equally shared, which results in equal signal amplitudes after pedestal and gain correction. The excellent agreement between the data and the simulation indicates that both the scintillation-light sharing and the resulting pixel response are well-understood.
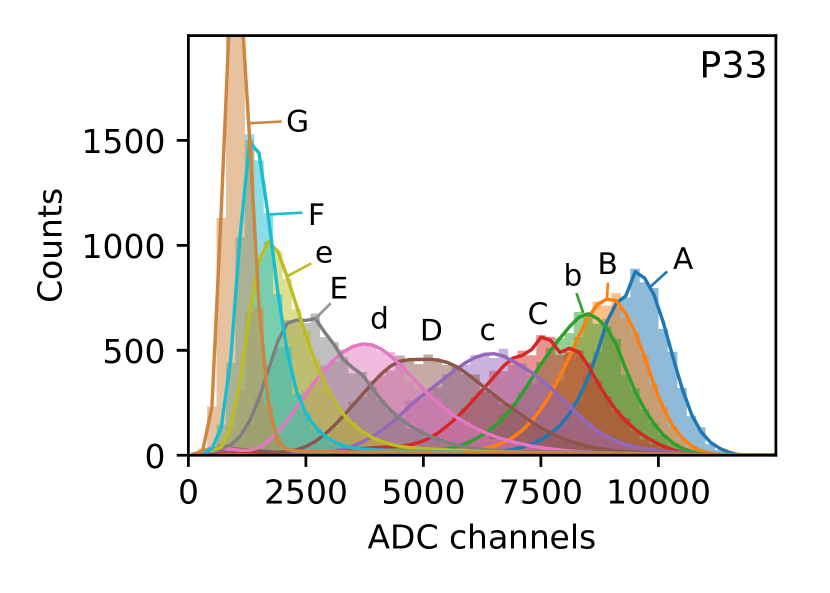
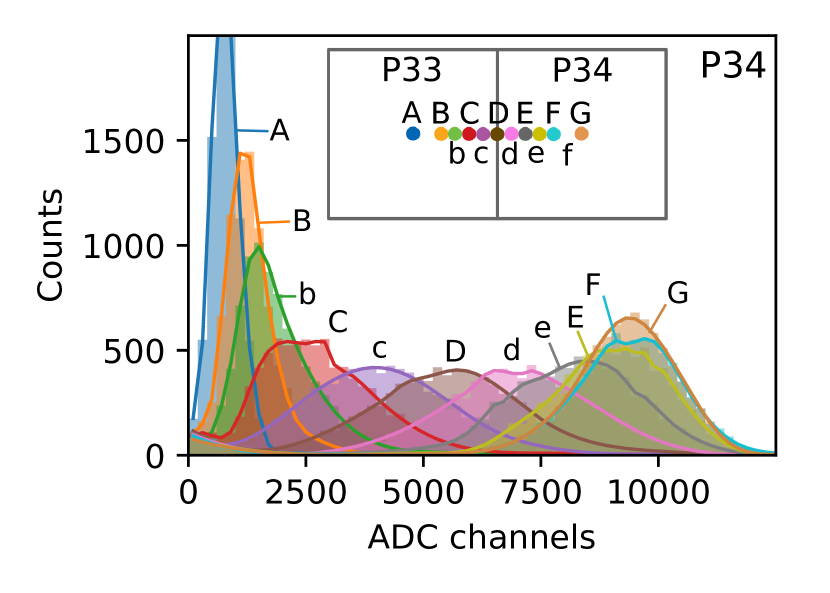
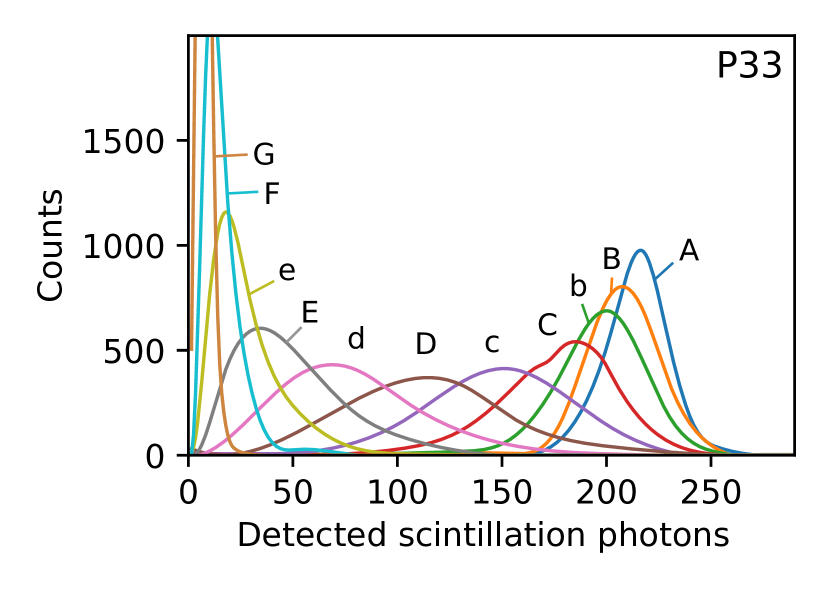
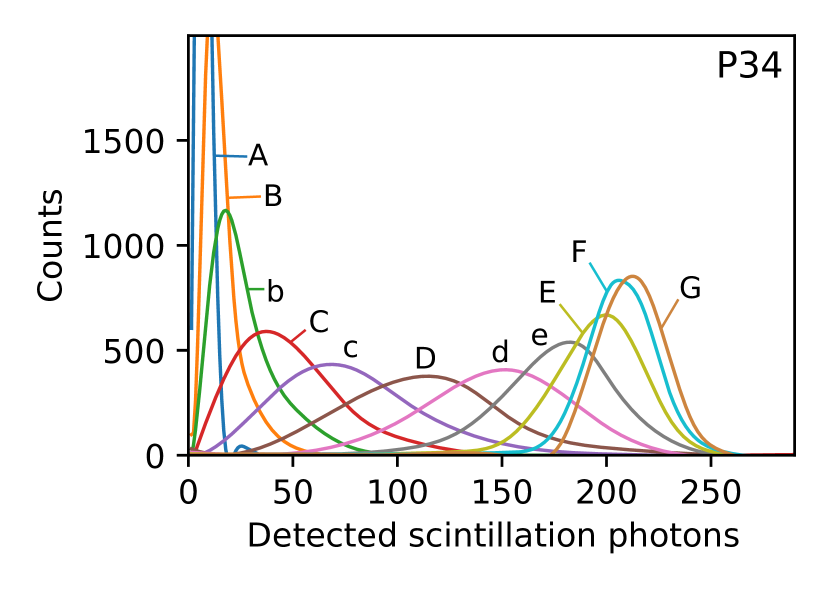
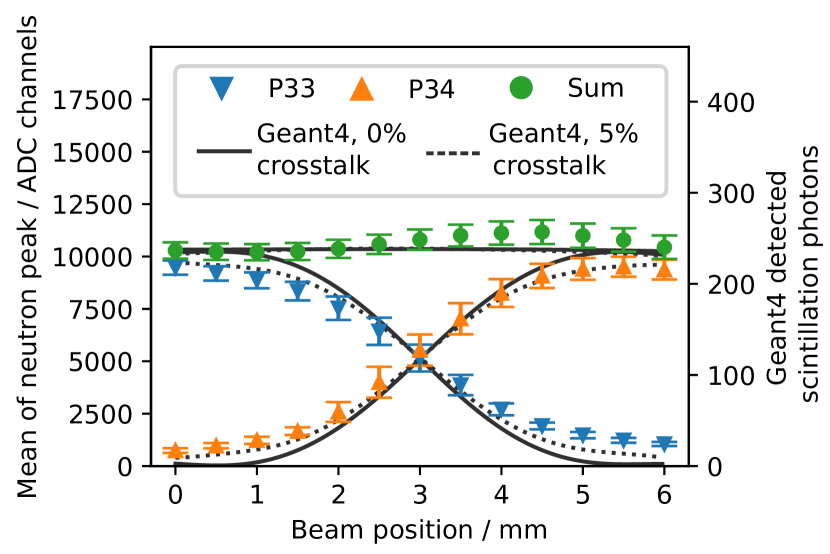
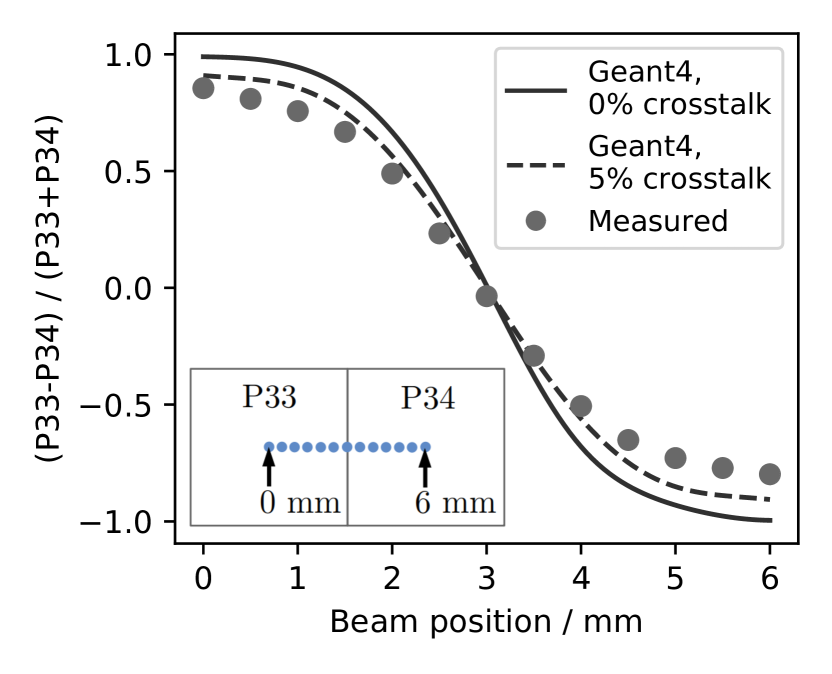
Figure 6 illustrates scintillation-light sharing by edge pixel P33 and adjacent P34 as the SoNDe module was translated horizontally through the 1 mm FWHM, neutron beam. Figure 6(a) shows the means of the pulse-height distributions (from Fig. 5) obtained for each beam position. The scan shows that signal leakage to adjacent pixels is 7-12% when the neutron beam strikes the center of either pixel. This represents a larger spread of scintillation signal into the adjacent pixel than was the case for previous investigations of relatively central pixels with charged-particle beams [34, 35] and may be related to the diffusely reflecting white paper placed at the front face of the GS20 sheet. -particle scan results for (non-edge) P36, P37, P44, and P45 [34] demonstrated summed gain-corrected charge distributions that were flat across the pixels and boundary regions. Proton- and deuteron-scan results for (non-edge) P37 and P38 [35] demonstrated summed gain-corrected charge distributions that were slightly convex and centered at the pixel edge. This was because the pixels together collected slightly more of the scintillation light produced from an event at the boundary between them than they collected from an event at the center of either pixel, with the missing light collected by the surrounding pixels. Here, the measured distributions may indicate a light-collection enhancement when P34 is irradiated. Simulations including the nominal 5% level of electronic crosstalk underestimate the amount of signal leaking into the adjacent pixel. Crosstalk measurements [31] suggest that 5% is already an overestimate. Figure 6(b) shows the light-sharing ratio between P33 and P34 defined as (P33P34)/(P33+P34). For the nominal 5% level of electronic crosstalk, the simulation results in too much signal in the irradiated pixel relative to the adjacent pixel. Agreement at the border between pixels is very good. Very recent simulations [57] indicate that the matt white reflector (paper) upstream of the scintillator and the glass surface finish will likely contribute to the redistribution of scintillation light in a fashion similar to electronic crosstalk. Unfolding these effects will require a detailed study with a laser.
The pixel-hit multiplicity ( 1, 2, etc.) for events as a function of the beam-spot position has previously been studied with scans of 1 mm FWHM beams of -particles [34] and diameter beams of protons and deuterons [35]. A hit occurred if a pixel amplitude exceeded a threshold which was varied offline. Here, the 1 mm FWHM neutron beam was employed in a complementary study. Neutron-beam irradiations with a stepsize of 1 mm in X and Y were performed resulting in a 13 13 matrix of data. Figure 7 displays 2D position dependence of tions obtained near P37 for software thresholds of 1360 (Fig. 7(a)) and 4545 (Fig. 7(b)) ADC channels, which correspond to 15% and 50% of the mean of the P37 pixel-centered full-deposition neutron peak (4.78 MeV, 0.52 keV/channel), respectively. For the 1360 ADC channel threshold, 2% of events are lost, and 1 events (22%) lie within 1 mm of the pixel center. The 2, 3, and 4 data are all localized to 5 mm, within the 6 mm position-resolution constraint for SoNDe operation at ESS. A threshold of 4545 ADC channels results in 18% event loss, maximizes both the number of 1 events (78%) and the area of the detector where 1 events may be detected. Figure 7(c) shows event multiplicity as a function of applied threshold for 14. The curves all have well-defined maxima so that the multiplicity for a dataset can be selected by enforcing the appropriate threshold. For example, for a dataset of 78% 1, 4% 2, and a negligible number of 3, 4 events, a threshold of 4545 ADC channels must be applied. A result of operating the SoNDe module with this relatively high threshold is that 18% of events have 0 and are thus lost.
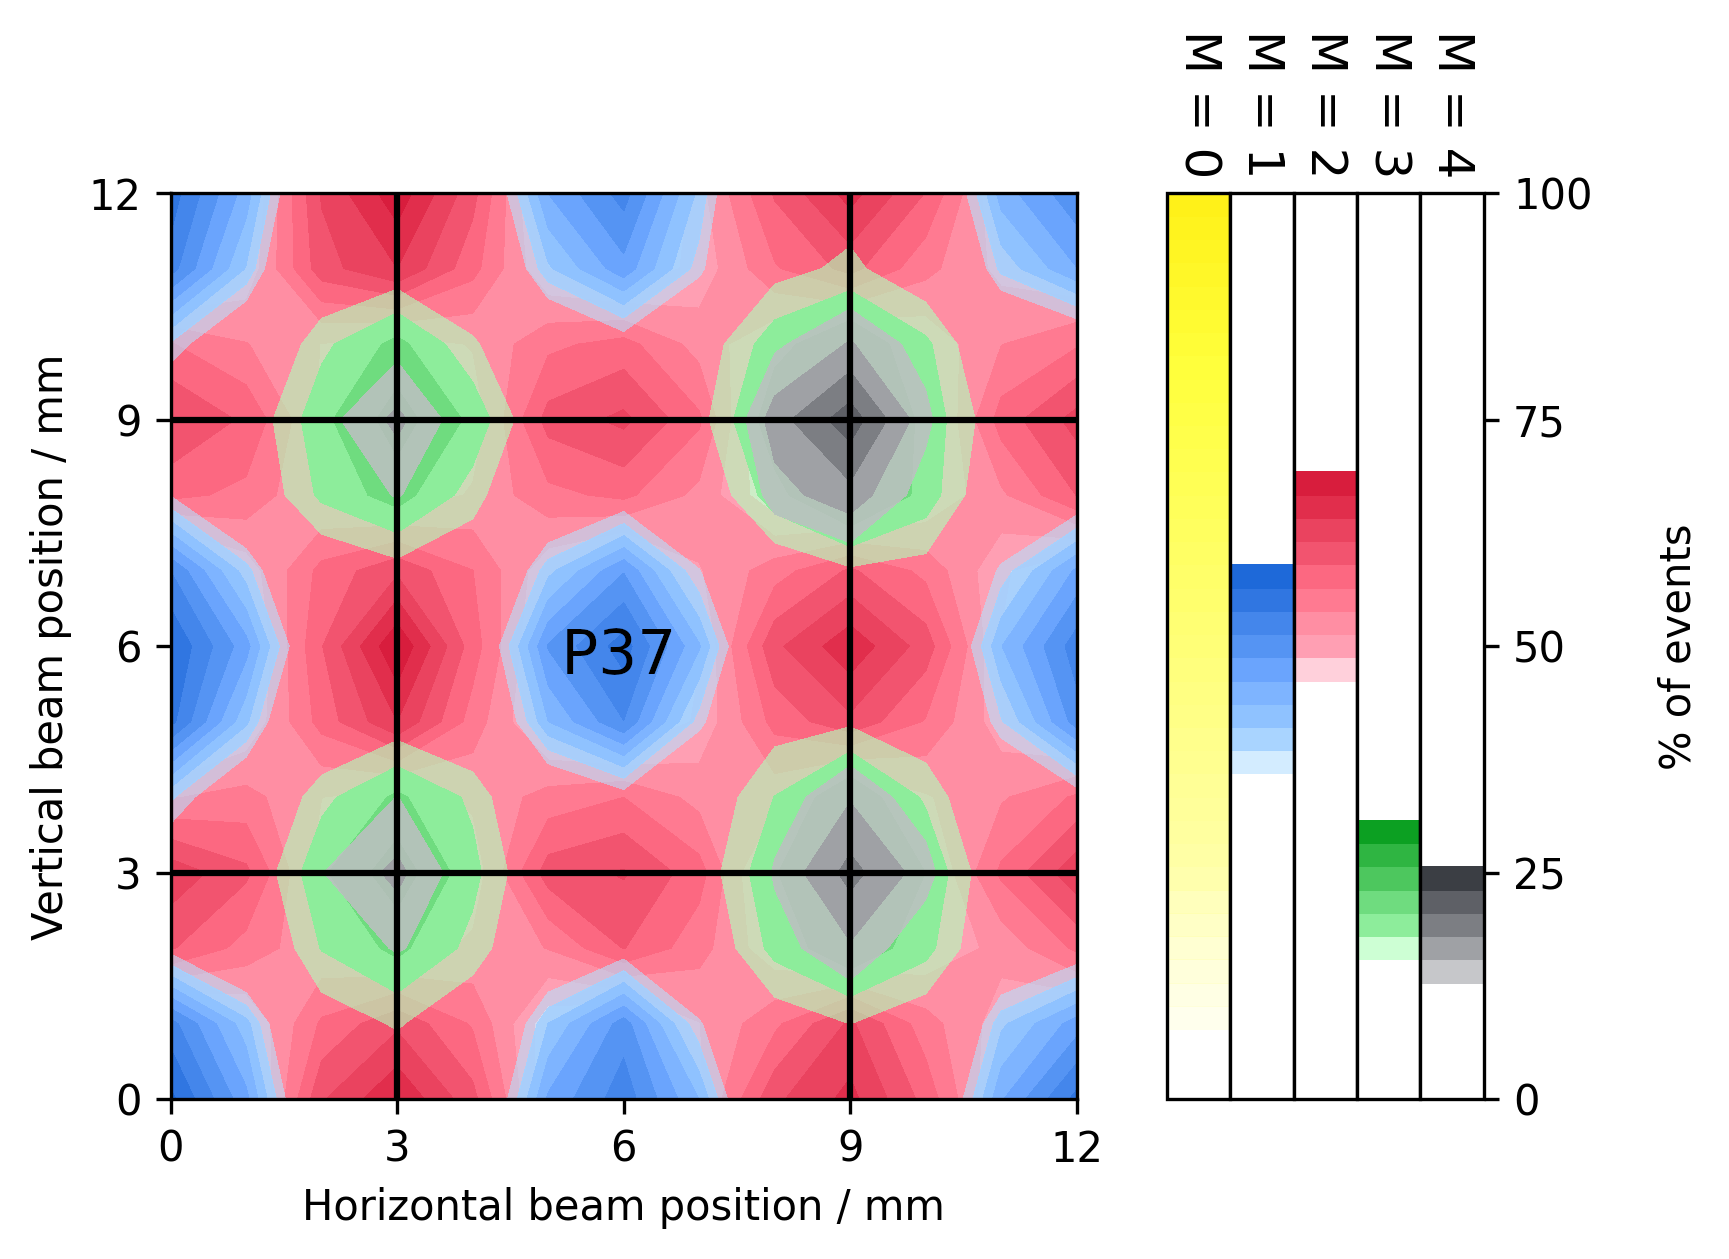
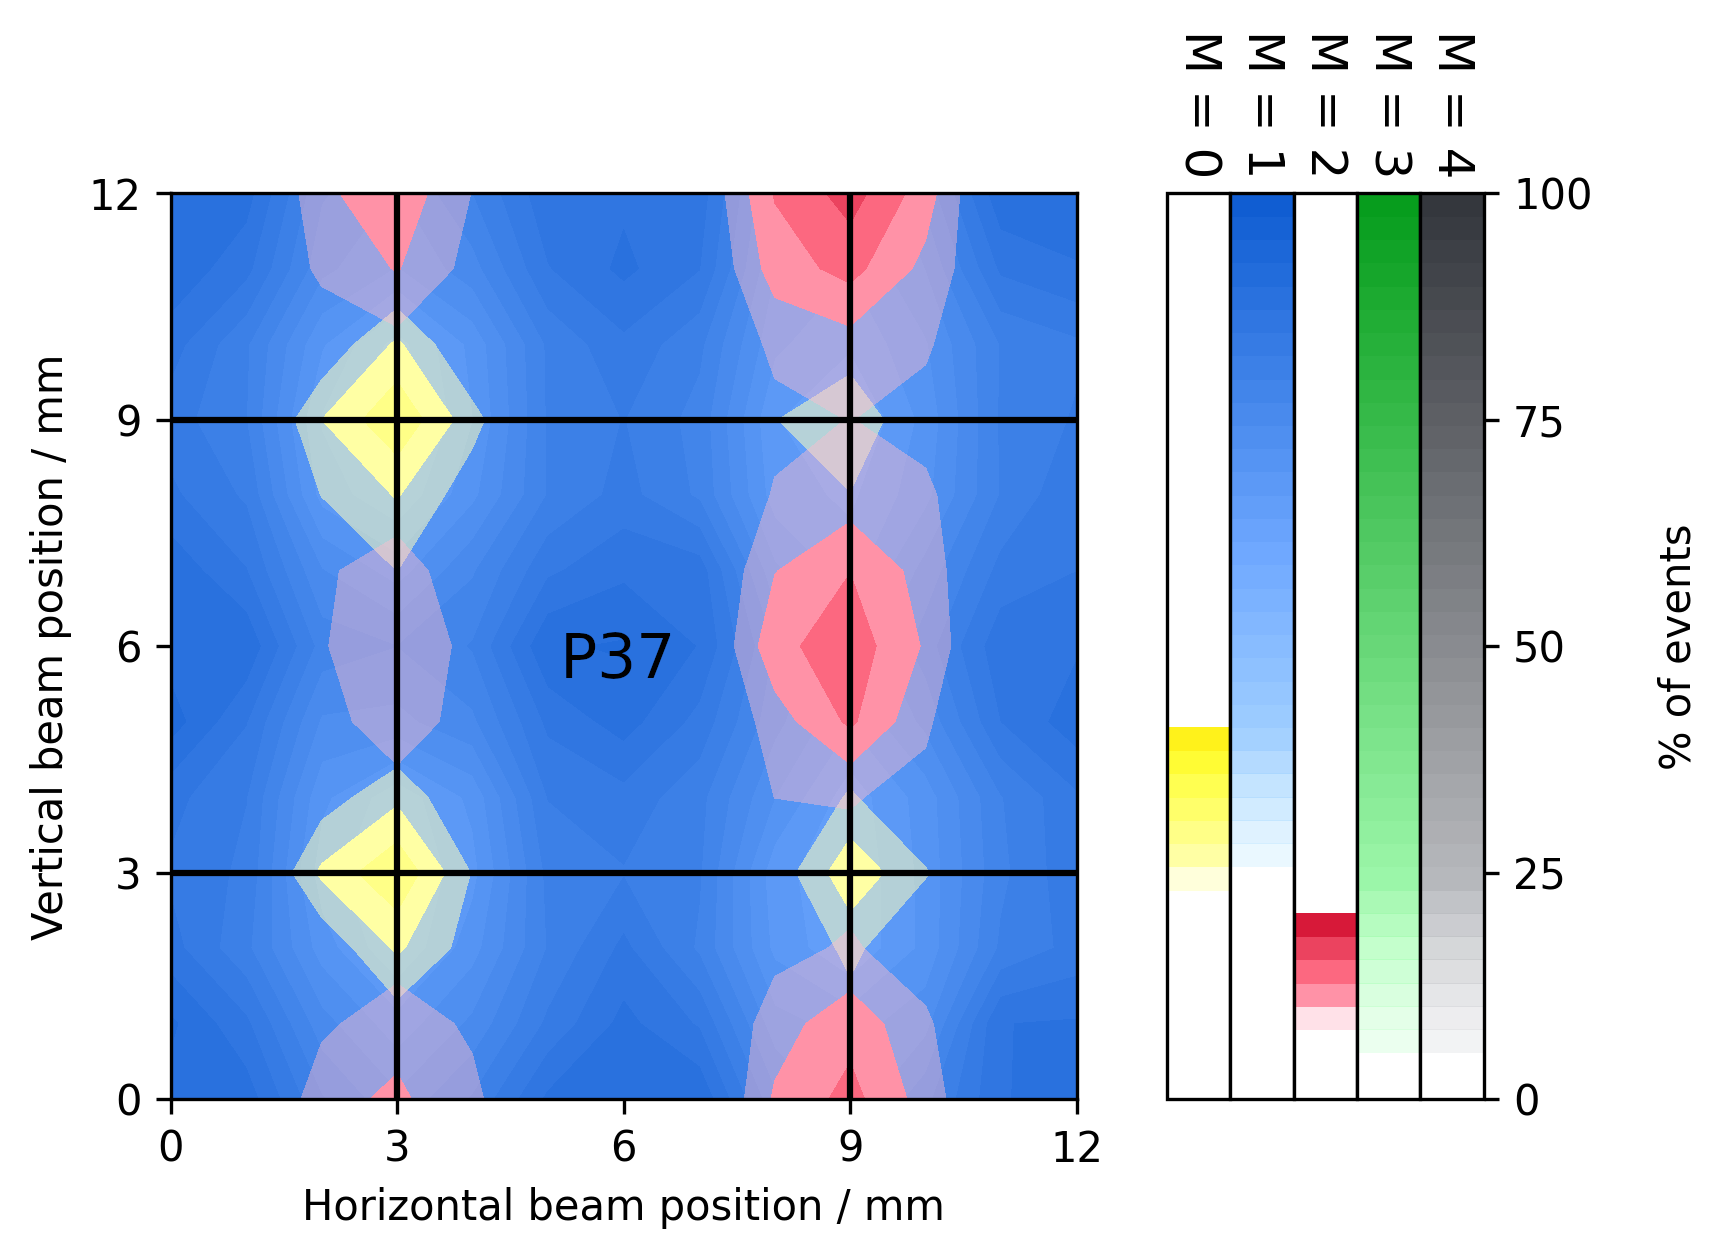
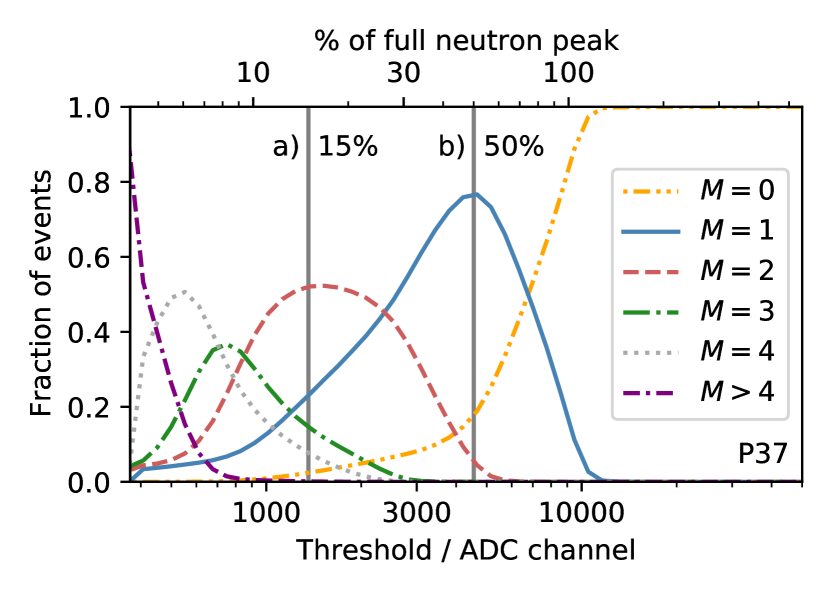
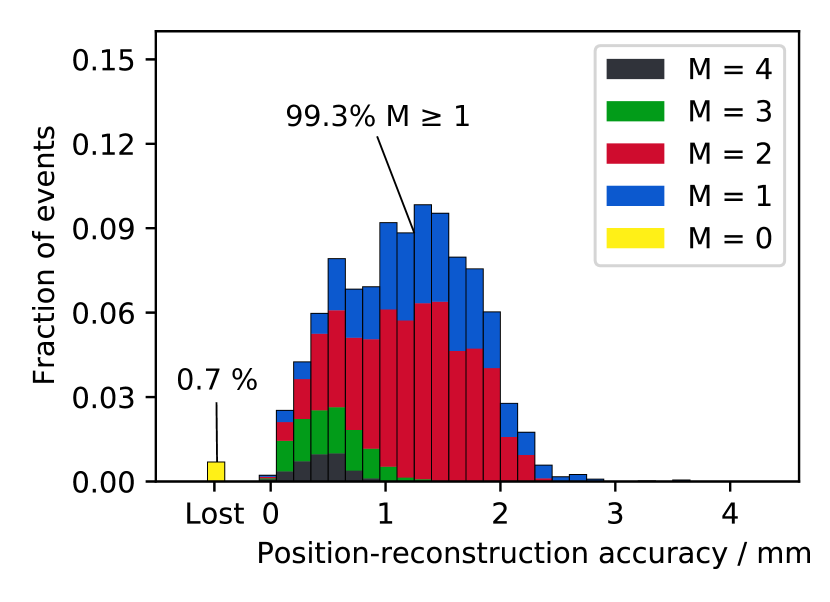
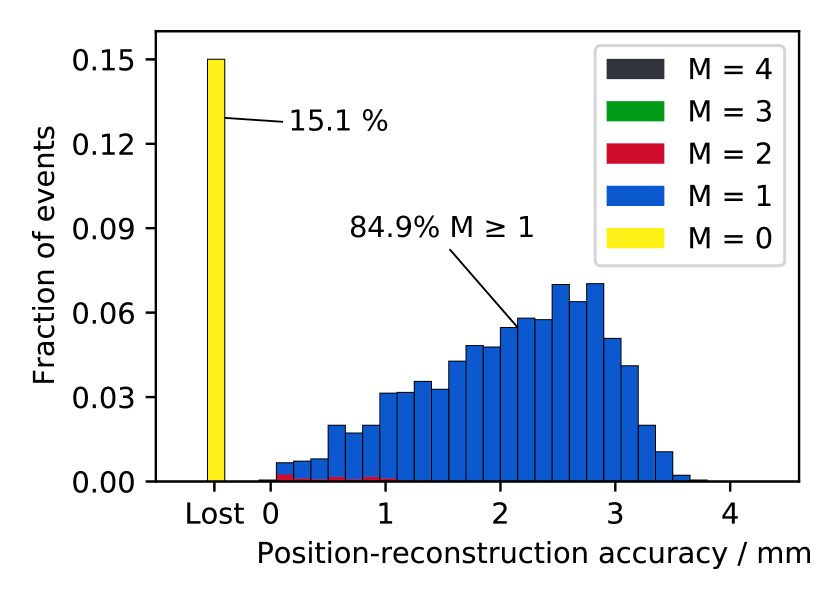
Figure 8 shows the GEANT4-simulated position-reconstruction accuracy as a function of pixel-hit multiplicity for a 15% threshold corresponding to 33 scintillation photons (Fig. 8(a)) and a 50% threshold corresponding to 100 scintillation photons (Fig. 8(b)). The accuracy is defined as the distance between the reconstructed and simulated capture vertex. The area in the vicinty of P37 was uniformly illuminated with neutrons. For each event, the reconstructed hit position was given by the average of the locations of the pixel centers of all pixels registering a signal above threshold. This method results in 1 events being “assigned" a position in the center of the pixel above threshold, while events are positioned at the edge between the two pixels above threshold. events are positioned within the triangle defined by the pixel centers, offset 1 mm in both X and Y from the common corner, and events are positioned at the common corner. For the 33 scintillation-photon threshold, 1% of events are lost. Event positions for multiplicities 1 (31%) and 2 (56%) events are reconstructed to better than 3 mm, while 3 (9%) and 4 (4%) events are reconstructed to better than 1 mm. For the 100 scintillation-photon threshold, 15% of events are lost. 1 (84%) events are reconstructed to better than 4 mm, and 2 (1%) events are reconstructed to better than 1 mm. While agreement between the simulation and the data is presently not perfect, it is very encouraging, and development continues.
5 Summary and Discussion
Collimated beams of 13 meV and 18 meV neutrons from the IFE reactor (Fig. 1) have been used to investigate the position-dependent response of a pixelated neutron detector known as a SoNDe module (Fig. 2). A SoNDe module consists of a 1 mm thick sheet of GS20 scintillating glass coupled to a 64 pixel H12700A MAPMT with dedicated readout electronics. The software layer of the data acquisition (EFU) was a prototype under development for ESS. The amplitudes of the pixel signals were investigated for different irradiation positions by scanning the module through the beam in steps of 0.5-1 mm using a motor-driven XY table. A GEANT4 model of the SoNDe module greatly aided in the interpretation of the data (Fig. 3). The amount of scintillation light detected by the MAPMT was increased by 40% by placing a sheet of diffusely reflecting white paper at the front face of the GS20. -rays and neutrons could generally be discriminated with a simple threshold cut (Fig. 4). The amplitudes of the gain-corrected signals were highly dependent on where the neutron beam struck the detector (Fig. 5). When directed towards a central-pixel region, 5% of the signal was detected in an adjacent pixel. However, within 1 mm of the boundary, 30% of the signal was registered in the adjacent pixel. At the boundary, the signal was evenly split between pixels. Overall agreement between the data and GEANT4 simulations was good when a 5% level of interpixel electronic crosstalk was considered. The signal in a pixel adjacent to an edge pixel when the edge pixel was irradiated was underestimated (Fig. 6). For different beam positions, the effect of raising the pixel threshold on the hit multiplicity was studied (Fig. 7). When the threshold was set at 50% of the mean of the neutron full-deposition peak, % of the data had 1, 4% were 2, and 18% were undetected. Increasing the threshold to higher values resulted in 1 event loss and a reduction of the sensitive area of the detector. Decreasing the threshold to 15% of the mean of the neutron full-deposition peak resulted in 2% event loss, 22% 1 data, and 66% 1 data. The GEANT4 simulation was employed to investigate the position-reconstruction accuracy (Fig. 8) of the measured multiplicity regions shown in Fig. 7. For the threshold set at 50% of the mean of the neutron full-deposition peak, the majority of the events registered with 1 could be reconstructed to better than 3.5 mm. The majority of the events registered with 2 could be reconstructed to better than 1 mm. For the threshold set at 15% of the mean of the neutron full-deposition peak, the majority of the 1 and 2 events could be recontructed to better than 2.5 mm, and the majority of the 3 and 4 events could be reconstructed to better than 1 mm. Thus, all the IFE data could be reconstructed with an accuracy better than the 6 mm position resolution required for the operation of SoNDe at ESS.
Acknowledgements
Support for this project was provided by the European Union via the Horizon 2020 Solid-State Neutron Detector Project (Proposal ID 654124) and the BrightnESS Project (Proposal ID 676548). Support was also provided by the UK Science and Technology Facilities Council (Grant No. ST/P004458/1) and the UK Engineering and Physical Sciences Research Council Centre for Doctoral Training in Intelligent Sensing and Measurement (Grant No. EP/L016753/1). The authors thank the staff of IFE for providing the beams of neutrons.
References
- [1] M. Lindroos et al., Nucl. Instrum. Meth. in Phys. Res. B. 269 (2011) 3258. doi:10.1088/1402-4896/aa9bff.
- [2] The European Spallation Source (ESS). Lund, Sweden: European Spallation Source ERIC [accessed 2020, Sep 19]. https://europeanspallationsource.se/
- [3] S. Peggs et al., ESS Technical Design Report (2013). ISBN 978-91-980173-2-8. https://europeanspallationsource.se/sites/default/files/downloads/2017/09/TDR_online_ver_all.pdf
- [4] R. Garoby et al., Phys. Scripta 93 (2018) 014001. doi:10.1016/j.nimb.2011.04.012.
- [5] O. Kirstein et al., PoS Proc. Sci. (Vertex2014) 029 (2014), arXiv:1411.6194 [physics.ins-det].
- [6] K. Zeitelhack, Neutron News, vol. 23, no. 4, pp. 10–13, (2012). doi:10.1080/10448632.2012.725325.
- [7] D.A. Shea, D. Morgan, Technical Report R41419, Congressional Research Service, (2010).
- [8] R.T. Kouzes, PNNL-18388 Pacific Northwest National Laboratory, Richland, WA, (2009). doi:10.2172/956899.
- [9] M. Heiderich et al., Nucl. Instr. and Meth. in Phys. Res. A 305 (1991) 423. doi:10.1016/0168-9002(91)90562-5.
- [10] G. Kemmerling et al., IEEE Trans. Nucl. Sci. 48 (2001) 1114. doi:10.1109/23.958733.
- [11] G. Kemmerling et al., IEEE Nucl. Sci. Symp. Conf. Rec 03CH37515 (2003) 722. doi:10.1109/NSSMIC.2003.1351801.
- [12] G. Kemmerling et al., IEEE Trans. Nucl. Sci. 51 (2004) 1098. doi:10.1109/TNS.2004.829576.
- [13] A.V. Feoktystov et al., J. Appl. Crystallogr. 48 (2015) 61. doi:10.1107/S1600576714025977.
- [14] S. Jaksch et al., Nucl. Instr. and Meth. in Phys. Res. A 762 (2014) 22. doi:10.1016/j.nima.2014.04.024.
- [15] R. Engels et al., IEEE Transactions on Nuclear Science, vol. 44, no. 3, June (1997) doi: 10.1109/23.603701.
- [16] R. Engels et al., IEEE Transactions on Nuclear Science, vol. 45, no. 3, June (1998) doi: 10.1109/NSSMIC.1997.672706.
- [17] R. Engels et al., IEEE Transactions on Nuclear Science, vol. 46, no. 4, Aug (1999) doi: 10.1109/23.790694.
- [18] R. Engels et al., IEEE Transactions on Nuclear Science, vol. 49, no. 3, June (2002) doi:10.1109/TNS.2002.1039590.
- [19] Scintillation detector with a high count rate, Patent no. PCT/EP2015/074 200, 2015.
- [20] Solid-State Neutron Detector – A new Neutron Detector for High-Flux Applications. EU Publications Office [accessed 2020, Aug 19]. https://cordis.europa.eu/project/id/654124
- [21] S. Jaksch et al., arXiv:1707.08679 [physics.ins-det].
- [22] D. Meier et al., doi:10.1109/NSSMIC.2013.6829764.
- [23] S. Jaksch et al., Proc. Int. Conf. Neutron Optics (NOP2017), JPS Conf. Proc. 22 (2018) 011019. doi:10.7566/JPSCP.22.011019.
- [24] S. Korpar et al., Nucl. Instr. and Meth. in Phys. Res. A 442 (2000) 316. doi:10.1016/S0168-9002(99)01242-5.
- [25] K. Rielage et al., Nucl. Instr. and Meth. in Phys. Res. A 463 (2001) 149. doi:10.1016/S0168-9002(01)00448-X.
- [26] T. Matsumoto et al., Nucl. Instr. and Meth. in Phys. Res. A 521 (2004) 367. doi:10.1016/j.nima.2003.11.384.
- [27] K. Lang et al., Nucl. Instr. and Meth. in Phys. Res. A 545 (2005) 852. doi:10.1016/j.nima.2005.02.041.
- [28] P. Abbon et al., Nucl. Instr. and Meth. in Phys. Res. A 595 (2008) 177. doi:10.1016/j.nima.2008.07.074.
- [29] R.A. Montgomery et al., Nucl. Instr. and Meth. in Phys. Res. A 695 (2012) 326, doi:10.1016/j.nima.2011.11.026.
- [30] R.A. Montgomery, Nucl. Instr. and Meth. in Phys. Res. A 732 (2013) 732, doi:10.1016/j.nima.2013.08.012.
- [31] M. Calvi et al., J. Instrum. 10, (2015) P09021. doi:10.1088/1748-0221/10/09/p09021.
- [32] R.A. Montgomery et al., Nucl. Instr. and Meth. in Phys. Res. A 790 (2015) 28. doi:10.1016/j.nima.2015.03.068.
- [33] X. Wang et al., Chinese Phys. C 40 (2016) 086003. doi:10.1088/1674-1137/40/8/086003.
- [34] E. Rofors et al., Nucl. Instr. and Meth. in Phys. Res. A 929 (2019) 90. doi:10.1016/j.nima.2019.03.014.
- [35] E. Rofors et al., Nucl. Instr. and Meth. in Phys. Res. A 982 (2020) 164604. doi:10.1016/j.nima.2020.164604
- [36] F. Zai-Wei et al., Chinese Phys. C 36 (2012) 1095. doi:10.1088/1674-1137/36/11/010.
- [37] Jeep II Reactor at Kjeller, Norway. [accessed 2020, Sep 19] https://ife.no/en/laboratory/jeep-ii-reactor-at-kjeller-norway/
- [38] B.C. Hauback et al., J. Neutron Research 8 (2000) 215. doi:10.1080/10238160008200055.
- [39] Institute for Energy Technology (IFE). Kjeller, Norway. [accessed 2020, Sep 20]. http://ife.no/en/
- [40] JJ X-ray Danish Science Design. JJ X-ray IB-C80-Air slits. [accessed 2020, Sep 19] https://www.jjxray.dk/p/ib-c80-air/
- [41] Henze Boron Nitride Products. HeBoSint sintered Boron Nitride Components. [accessed 2020, Sep 19] https://www.henze-bnp.com/en/hebosint-boron-nitride-components.php
- [42] Mirrotron Ltd. Radiation Shielding. [accessed 2020, Sep 19] https://mirrotron.com/en/products/radiation-shielding
- [43] F.W.K. Firk et al., Nucl. Instr. and Meth. 13 (1961) 313. doi:10.1016/0029-554X(61)90221-X.
- [44] A.R. Spowart Nucl. Instr. and Meth. 135 (1976) 441. doi:10.1016/0029-554X(76)90057-4.
- [45] A.R. Spowart Nucl. Instr. and Meth. 140 (1977) 19. doi:10.1016/0029-554X(77)90059-3.
- [46] E.J. Fairley et al., Nucl. Instr. and Meth. 150 (1978) 159. doi:10.1016/0029-554X(78)90360-9.
- [47] 6-Lithium Enriched Glass Scintillators. Cambridge, England: Scintacor [accessed 2020, Sep 19]. https://scintacor.com/products/6-lithium-glass/
- [48] B. Jamieson et al., Nucl. Instr. and Meth. in Phys. Res. A 790 (2015) 6. doi:10.1016/j.nima.2015.04.022.
- [49] C.W.E. Van Eijk et al., Nucl. Instr. and Meth. in Phys. Res. A 529 (2004) 260. doi:10.1016/j.nima.2004.04.163.
- [50] Flat panel type multianode PMT assembly H12700 series / H14220 series. Iwata City Japan: Hamamatsu Photonics K.K. [accessed 2020, Aug 19]. https://www.hamamatsu.com/resources/pdf/etd/H12700_H14220_TPMH1379E.pdf
- [51] Integrated Detector Electronics AS. Oslo, Norway [accessed 2020, Sep 19]. https://ideas.no/
- [52] A.H.C. Mukai et al., J. Instrum. 13 T10001 (2018). doi:10.1088/1748-0221/13/10/T10001.
- [53] M.J. Christensen et al., J. Instrum. 13 T11002 (2018). doi:10.1088/1748-0221/13/11/T11002.
- [54] M.J. Christensen et al., BrightnESS Deliverable Report 5.6, Software neutron event data processing (2018). doi:10.17199/brightness.d5.6.
- [55] M. Shetty, A. Mukai, J. Nilsson. v.0.0.1 available at Zenodo. doi:10.5281/zenodo.1298512.
- [56] M.J. Christensen and T. Richter, doi:10.1088/1748-0221/15/09/T09005
- [57] L. Boyd et al., arXiv:2010.15695 [physics.ins-det], submitted to Nucl. Instr. and Meth. in Phys. Res. A. in 2020.
- [58] S. Agostinelli et al., Nucl. Instr. and Meth. in Phys. Res. A. 506, (2003) 250. doi:10.1016/S0168-9002(03)01368-8.
- [59] J. Allison et al., IEEE Trans. Nucl. Sci. 53, (2006) 270. doi:10.1109/TNS.2006.869826.
- [60] MKS Newport Corporation. Photonics Technologies. [accessed 2020, Sep 19]. https://www.newport.com/
- [61] G. van Rossum and F.L. Drake (editors), Python Reference Manual, PythonLabs (2001). Available at https://www.python.org/
- [62] The Pandas Development Team [accessed 2020, Aug. 19]. Pandas 1.1.0 available at https://pandas.pydata.org/. doi:10.5281/zenodo.3964380.
- [63] W. McKinney, Proceedings of the 9th Python in Science Conference, 445 (2010) 56. doi:10.25080/Majora-92bf1922-00a.
- [64] F. Messi et al., IAEA Technical Meeting on Modern Neutron Detection (F1-TM-55243), arXiv:1711.10286 [physics.ins-det].