Associations of dwarf galaxies in a CDM Universe
Abstract
Associations of dwarf galaxies are loose systems composed exclusively of dwarf galaxies. These systems were identified in the Local Volume for the first time more than thirty years ago. We study these systems in the cosmological framework of the Cold Dark Matter (CDM) model. We consider the Small MultiDark Planck simulation and populate its dark matter haloes by applying the semi-analytic model of galaxy formation SAG. We identify galaxy systems using a friends of friends algorithm with a linking length equal to , to reproduce the size of dwarf galaxy associations detected in the Local Volume. Our samples of dwarf systems are built up removing those systems that have one (or more) galaxies with stellar mass larger than a maximum threshold . We analyse three different samples defined by and . On average, our systems have typical sizes of , velocity dispersion of and estimated total mass of . Such large typical sizes suggest that individual members of a given dwarf association reside in different dark matter haloes and are generally not substructures of any other halo. Indeed, in more than 90 per cent of our dwarf systems their individual members inhabit different dark matter haloes, while only in the remaining 10 per cent members do reside in the same halo. Our results indicate that the CDM model can naturally reproduce the existence and properties of dwarf galaxies associations without much difficulty.
keywords:
galaxies: dwarf – galaxies: groups: general – galaxies: kinematics and dynamics1 Introduction
In the last two decades, the development of large galaxy surveys such as 2dF (Colless et al., 2001), HIPASS (Barnes et al., 2001), 6dF (Jones et al., 2004), ALFALFA (Giovanelli et al., 2005), SDSS (Abazajian et al., 2009), among others, has helped clarify our understanding of the large-scale structure of the Universe. However, the most relevant constraint of these surveys is that they do not include numerous dwarf galaxies because of their low luminosity and surface brightness. In order to deal with this problem, many projects are now focused on the study of the nearby Universe within a radius of 10 Mpc, often termed the Local Volume (LV). The study of the LV allows an accurate estimation of the line–of–sight velocities and individual distances for many systems, most of them, dwarf galaxies, and enables us to investigate the properties of this galaxy population and the interactions between its members.
In the literature, we find numerous studies on the frequency of interactions between massive galaxies, both from observational and theoretical points of view. On the contrary, there are not so many studies on the frequency of interactions between dwarf galaxies and their role in the evolution of low–mass galaxies. Although low–mass dwarf galaxies, with , are the most abundant class of galaxies at all redshifts (Binggeli et al., 1988; Karachentsev et al., 2013), there are neither so many observational studies about the associations of dwarf galaxies, nor works that compare their observed properties with theoretical predictions in a systematic way.
We can mention the identification of dwarf galaxy associations presented by Tully (1988) as one of the first studies of dwarf galaxies interactions. In their work, they define two kinds of structures, called “groups” and “associations”, according to luminosity density thresholds that characterize the connection between galaxies. These thresholds are defined as the ratio between the luminosity of the brighter component of a galaxy pair selected by a hierarchical method, and the third power of the distance between these two galaxies (see Tully 1988 for a exhaustive depiction of the method). They set and as the density thresholds to define a group and an association, respectively. Note that the latter is one order of magnitude lower than the former. They also distinguish between two kinds of associations: type 1 and type 2. Associations of type 1 include extended regions in the vicinity of groups, and could combine individual galaxies or groups. On the other hand, associations of type 2 include only faint galaxies whose luminosities are not enough to reach the threshold to be defined as a group. It is this latter kind of associations that interest us in the present project.
Almost twenty years later, Tully et al. (2006) used the accurate estimator of the tip of the red giant branch distance achieved by the Hubble Telescope Advanced Camera for Surveys, to confirm five associations of dwarf galaxies previously identified, and to discover two more associations with similar properties. They presented a detailed analysis of each association of dwarf galaxies and a description of their main dynamical properties. The theoretical study of this kind of systems in the CDM model is the main goal of our work.
There are several studies about the interaction between dwarf galaxies, mainly between pairs of them. Karachentsev & Makarov (2008) presented a catalog of galaxy pairs in the near vicinity. They focused on the large portion of binary systems compound by faint late–type dwarf galaxies. They proposed that these binary systems formed by gas–rich dwarf galaxies may be at the stage prior to its merger. In Makarov & Uklein (2012), they reported a list of groups consisting of dwarf galaxies only. Most of these systems reside in low-density regions and evolve unaffected by massive galaxies. They compare the size, luminosity and the velocity dispersion of those groups with associations of dwarfs galaxies presented by Tully et al. (2006). They conclude that groups of dwarf galaxies have similar luminosity and velocity dispersion as associations of dwarf galaxies, but the latter ones are undoubtedly larger than the groups. Besides, their groups possess higher mass–to–luminosity ratios than the associations, which suggests that their systems have a larger amount of dark matter.
| Number of systems | Number density | Maximum number of | Total number of galaxies | |
|---|---|---|---|---|
| () | [] | members per system | in systems | |
| () | () | |||
| 12.9 | 1508530 | 0.025 | 16380 | 15866313 |
| 9.5 | 850856 | 0.014 | 42 | 3351797 |
| 9.0 | 606320 | 0.010 | 29 | 2256240 |
| 8.5 | 366713 | 0.006 | 19 | 1293617 |
In recent years, more studies have been presented about the interaction of dwarf galaxies. For instance, Sales et al. (2013) use observational data (Sloan Digital Sky Survey/Data Release 7, SDSS/DR7) to analyse the correlation between the abundance of satellite galaxies and the mass of the main galaxy. They consider central galaxies in a wide range of stellar masses, including dwarf galaxies. They confirm that the amount of satellites galaxies grows as the satellite–to–primary stellar mass ratio increases when considering bright galaxies as centrals. Otherwise, for the case of dwarf primaries, the amount of satellite galaxies does not depend on the mass of the primary. They compare their results with mock catalogues, and conclude that they are consistent with galaxy formation models in a CDM Universe. Later, Stierwalt et al. (2017) presented seven spectroscopically confirmed groups compounded only by dwarf galaxies. Even though each one of these groups has between three and five members, these groups are more compact and brighter than the associations presented by Tully et al. (2006). Besla et al. (2018) also use the SDSS observational data set to analyse isolated dwarf galaxies systems and compare their results with cosmological expectations. They conclude that the majority of their isolated dwarf systems are pairs (triplets are rare), and that more numerous systems are improbable from the cosmological point of view within the parameter range considered. They also argue that their results do not conflict with the groups presented by Stierwalt et al. (2017) because most members of those groups do not satisfy their selection criteria.
The studies mentioned above were focused on the interaction between pairs of dwarf galaxies. Little is known about the associations of dwarf galaxies and their properties. Our main goal is to understand the existence and the properties of these rare objects within the standard CDM cosmological model. The existence of associations or groups of dwarf galaxies is critical to our understanding of structure formation at the low mass end of the stellar mass function - a regime known to constitute the small scale “crisis” of the current paradigm. The abundance of such objects will help us to understand group infall onto larger hosts, and galaxy conformity at the low mass end, as well as to shed light on the missing satellite problem. By quantifying the nature of dwarf associations, it is plausible that the missing satellite problem becomes the “missing dwarf association” problem. Furthermore, given that dwarfs are the most abundant objects (by number) in the Universe, evaluating how much mass is locked up in these associations is important to understand the abundance of dark matter. Moreover, a warm dark matter (WDM) model (Lovell et al., 2014) and the CDM scenario certainly predict different statistics for these objects. So, the abundance of such groups could also be a probe of the nature of dark matter given the free streaming mass cut-off in a WDM model. It is thus important we understand the nature of these objects.
Although very few observational systems composed only by dwarf galaxies are currently known, this analysis is really important in the light of coming surveys, such as Dark Energy Spectroscopic Instrument (DESI, DESI Collaboration et al. 2016) and Legacy Survey of Space and Time (LSST, Ivezić et al. 2019). Their precise measurements will produce the most detailed map of the nearby universe, which will facilitate the discovery and analysis of these very particular systems. Thus, in this project, we study these systems in a theoretical way by combining a cosmological dark matter only simulation with a semi–analytic model (SAM) of galaxy formation. The low mass of the galaxies involved in this study calls for a simulation with good enough mass resolution. To this aim, we use the Small MultiDark Planck simulation (SMDPL) based on the Planck cosmology (Klypin et al., 2016), which is publicly available in the CosmoSim database 111https://www.cosmosim.org. Dark matter haloes in this simulation are populated with galaxies generated by the semi–analytic model sag (acronym for Semi-Analytic Galaxies, Cora et al., 2018). We compare our results with observational results presented by Tully et al. (2006) and by Tully (2015). With such a comparison, we are able to analyse if cosmological simulations based on the CDM paradigm are reliable to trace the hierarchical processes that are expected to influence the evolution of dwarf galaxies.
This paper is organized as follows. We describe the SMDPL simulation and the most relevant characteristics of the sag model in Section 2. In Section 3, we define our systems, describe different samples of galaxy ensembles and analyse their properties. We then compare our results with observational results. In Section 4, we analyse the dark matter haloes hosting galaxy members. Finally, in Section 5, we summarize our results and present our conclusions.
2 Semi–analytical model
2.1 Dark matter simulation
We use the SMDPL dark matter only simulation222doi:10.17876/cosmosim/smdpl/., which belongs to the series of MultiDark simulations with Planck cosmology. This simulation tracks the evolution of particles from redshift to , within a periodic box of side–length of , achieving a mass resolution of per dark matter (DM) particle (see Klypin et al. (2016) for further details). SMDPL cosmological parameters are given by a flat CDM model consistent with Planck measurements: = 0.307115, = 0.048, = 0.692885, = 0.8228, = 0.96 and ), Planck Collaboration et al. (2014).
DM haloes have been identified with the Rockstar halo finder (Behroozi et al., 2013a) considering overdensities with at least = 20 DM particles. Merger trees have been constructed with ConsistentTrees (Behroozi et al., 2013b). The DM haloes can be detected over the background density (referred to as main host haloes) or lie within another DM haloes (subhaloes). The virial mass of each main host halo is defined as the mass enclosed by a sphere of radius , wihin which the mean density is a factor times the critical density of the Universe , i.e.,
| (1) |
The physical properties of subhaloes are estimated considering only the bound particles of the substructures identified by the halo finder.
Our SAM takes the information about the DM (sub)haloes extracted from the cosmological DM simulation and their corresponding merger trees to generate the galaxy catalogue.
2.2 Semi-analytic model of galaxy formation SAG
In this work, we use the latest version of the semi–analytic model SAG described in Cora et al. (2018). It is based on the SAM presented in Springel et al. (2001) and has been further modified and updated to include all main physical processes deemed to be important in galaxy formation. The combination of these processes regulate the circulation of mass and metals between the different baryonic components of the simulated galaxies (hot gas, cold gas, stars), determining their physical properties.
Each new detected halo in the DM simulation hosts a galaxy generated by SAG, so that main host haloes contain central galaxies, while subhaloes are populated by satellite galaxies. When the mass of the DM substructures becomes lower than the resolution limit of the halo finder, their satellites are referred to as orphans. The positions and velocities of an orphan satellite are obtained from the numerical integration of its orbit, consistent with the potential well of the host halo. Following Gan et al. (2010) and Kimm et al. (2011), the orbital evolution is affected by dynamical friction and tidal stripping. The assumed initial conditions are the position, velocity and virial mass of its subhalo the last time it was identified. When the halo-centric distance becomes smaller than per cent of the virial radius of the main host halo, the orphan satellite is considered to be merged with the corresponding central galaxy.
As a result of the hierarchical growth of structure, the virial mass of dark matter haloes changes between consecutive outputs of the simulation. This change determines the increase of the mass of hot gas of central galaxies, which is defined as the baryon fraction of the virial mass of the main host halo at each snapshot of the simulation. Galaxies keep their hot gas halo when they become satellites, but it is gradually removed by the action of tidal stripping and ram pressure stripping. Thus, gas cooling of the hot gas phase takes place in both central and satellite galaxies (Cora et al., 2018), replenishing their cold gas discs that have been formed by the gas inflows. This baryonic component is also affectd by ram pressure stripping (Tecce et al., 2010), when a significant fraction (90 per cent) of the hot halo is removed. Stars form in both quiescent and bursty modes. The former takes place when the mass of the cold gas disc exceeds a critical limit, while the latter is triggered by both mergers and disc instabilities, giving place to the formation of a stellar bulge where the transferred gas is gradually consumed (Gargiulo et al., 2015). Bulge formation is accompanied by the growth of a super–massive black hole, which also increases its mass during gas cooling producing an active galactic nucleus (AGN) with its consequent feedback (Lagos et al., 2008). Both type Ia and II supernovae (SNe) produce energetic feedback. Together with stellar winds, they contaminate all baryonic components with different chemical elements. The processes involved are recycling of mass and metals that had been locked in stars, reheating of cold gas, ejection of the hot gas out of the halo, and reincorporation of this ejected gas (Cora, 2006; Collacchioni et al., 2018); timescales for mass loss and lifetime of SNe progenitors are taken into account.
The different physical processes are regulated by free efficiencies and parameters that have been adjusted by comparing the model results against a given set of observed galaxy properties. The set of best-fitting values for the free parameters of SAG for the SMDPL simulation have been obtained by the Particle Swarm Optimization (PSO, Ruiz et al., 2015), using as observational constraints the same data sets used in previous calibrations of the SAG model: the stellar mass functions at and , the star formation rate distribution function at , the fraction of cold gas as a function of stellar mass and the bulge mass-black hole mass relation (see Knebe et al. (2018) for a complete description of these data sets). It is worth noticing that the values of the free parameters obtained for the SMDPL simulation differ from those obtained for the lower resolution MDPL2 simulation (Klypin et al., 2016), for the same version of the code. This arises because the parameter that regulates the redshift dependence of the SNe feedback was allowed to vary when calibrating the MDPL2 simulation while it was fixed for the SMDPL simulation. This choice was based on the better results obtained for the fraction of quenched galaxies when such a parameter was lowered with respect to the one obtained in the MDPL2 calibration (see Cora et al., 2018, for a detailed discussion).
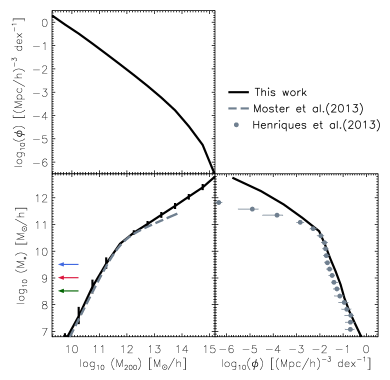
In order to validate the results obtained from applying the semi–analytic model SAG to the SMDPL simulation, we analyze the stellar mass of semi–analytical galaxies, the virial mass of their haloes and the relation between them. The bottom left panel of Figure 1 shows the median stellar–virial mass relation for all semi–analytical galaxies. Present–day halo masses are considered for central galaxies, while infall halo masses for satellites. Vertical error bars correspond to and per cent quartiles. We compare our results with the correlation obtained from the abundance matching technique presented by Moster et al. (2013) (grey dashed line) and find a very good agreement at the low-mass end, which is of particular interest for this work. The bottom right panel of Figure 1 displays the stellar mass function for all semi–analytical galaxies in the volume of the SMDPL simulation (black solid line). Our results are compared with observational data compiled by Henriques et al. (2013) (Li & White, 2009; Baldry et al., 2008) (grey filled circles), and they show a rather good agreement in the low-mass end. The excess of galaxies at the high-mass end has already been noted and discussed by Cora et al. (2018); they do not affect the results of the current work which is focused on a much lower stellar mass range. The top left panel of Figure 1 displays the virial mass function of the (sub)haloes hosting these semi–analytical galaxies (black solid line). Coloured arrows indicate different stellar mass thresholds, , used to define three different samples of dwarf galaxies systems as it is described in sub–section 3.1.
3 Systems of Dwarf Galaxies
3.1 Systems sample
From the galaxy population generated by applying the model SAG to the SMDPL simulation, we extract our sample of semi-analytical galaxies. To restrict our sample to well-resolved objects, we impose a condition to stellar mass, , and virial mass, (equivalent to DM particles). Our sample has a total of semi–analytical galaxies, with stellar masses ranging between and virial masses ranging between .
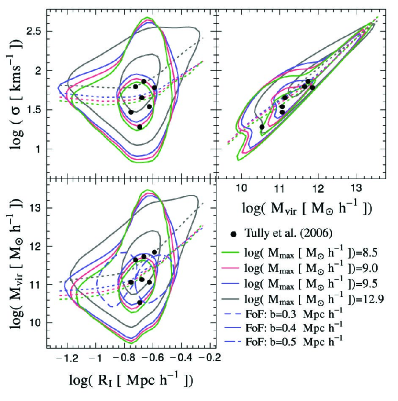
From this sample of semi-analytical galaxies, we identify systems of galaxies, having a minimum of 3 members, using a friends-of-friends (FoF) algorithm (Huchra & Geller, 1982) with a linking length of . This value was calibrated to reproduce the characteristic sizes and the virial masses of the observational sample of associations of dwarf galaxies presented by Tully et al. (2006). To select this value, we vary the linking length parameter between and . Bottom left panel of Figure 3 shows the virial mass as a function of the inertial radius (see next Subsection for the definition of these properties). Inner contour levels enclose 25 per cent of each sample for three different linking lengths: (short dashed blue line), (solid blue line) and (long dashed blue line). Filled circles show the 7 observational associations of dwarf galaxies taken from Tully et al. (2006). The solid line () encloses 5 out of 7 observed associations, while the others, short dashed line () and long dashed line (), only two. So, comparing with the observational results presented by Tully et al. (2006), we found that is the best choice for the analysis of these associations, without the need for a fine tuning. We analyse dwarf galaxies associations at redshift due to the fact that the only associations of this type, detected so far, are at redshift .
In order to build up our sample of FoF objects composed exclusively by dwarf galaxies, we remove those systems that have one (or more) galaxy member more massive than a stellar mass threshold . Although there is no a unique definition for dwarf galaxy, many works adopt a maximum stellar mass value close to (see for example, Fattahi et al. (2013), Stierwalt et al. (2017) and Besla et al. (2018), among others). To explore the sensitivity of our results to this specific stellar mass cut, our analysis was preformed analysing three samples with , and . Table (1) summarizes the main information of our four samples, namely the full sample and the three sub samples where upper mass cuts have been applied to the total FoF stellar mass. Columns show the stellar mass cut used, the number of systems, the number density of systems, the maximum number of members per system and the total number of semi–analytical galaxies belonging to systems.
3.2 Systems properties
By resolving stars at the tip of the red giant branch using the Hubble Space Telescope Advance Camera for Surveys, accurate distances were determined by Tully et al. (2006) to seven associations of dwarf galaxies. Five of these were previously found by Tully (1987) and two more new associations were presented. Although this is one of the oldest observational sets, it is still nowadays the most complete and homogeneous observational sample of data of the associations of dwarf galaxies. Tully (2015) and Kourkchi & Tully (2017) also study these associations but they do not present a complete and updated compilation of all their main dynamical properties. Only the luminosities and virial masses were re-estimated in Tully (2015) for the seven associations. So, we compare the intrinsic properties of the observational associations presented by Tully et al. (2006), and with Tully (2015) when possible, with our systems identified in the CDM model. With this aim, we follow the procedure presented by Tully et al. (2006) to compute the main intrinsic properties of our systems: inertial radius () as an indicator of the size of the system, the velocity dispersion () and the virial mass ().
The inertial radius is defined as
| (2) |
where is the three–dimensional distance of a galaxy from the system centroid, and the sum for each system is performed over all members (). The velocity dispersion is
| (3) |
where is the one–dimensional velocity difference between a galaxy and the system mean. To estimate the virial mass of the system, we use the expression adopted by Tully (2005) and Tully et al. (2006), that is
| (4) |
where the radius is given by , where is the separation between pairs in the system counted only once. It is worth noticing that this equation assumes systems in virial equilibrium, a hypothesis that is probably far from being true for both observational and theoretical associations.
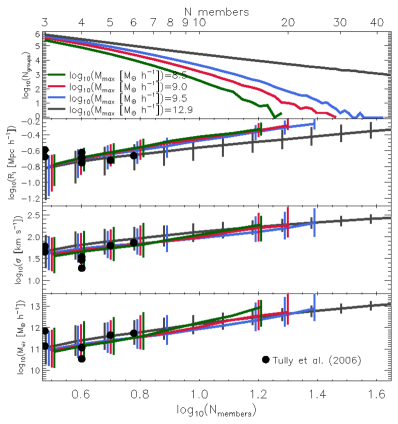
The upper panel of Figure 2 shows the number of systems as a function of the number of members for our three samples of dwarf galaxy systems and the complete sample, colour-coded as indicated in the legend. The number of systems decreases as the number of members increases, as expected. Notice that our systems of dwarf galaxies are largely (more than 75 per cent) dominated by systems made of 3 or 4 members. These power law distributions cover a range of slopes from for the complete sample (grey line) to for the sample (green line). It means that dwarf galaxy associations show a relative deficit of numerous member systems. Second, third and fourth panels show the median values of inertial radius (), velocity dispersion () and virial mass () as a function of the number of members of the system, respectively. Median values are shown only if there are or more objects for a given number of members. Systems with more members are bigger, with higher velocity dispersion and more massive than systems with fewer members. Over plotted on the bottom three panels are the observational data from Tully et al. (2006). Note that, in general, the data are within one of our predicted values.
3.3 Comparison with observational results
Figure 3 compares the scaling relations between inertial radius (), velocity dispersion () and virial mass () of the systems of dwarf galaxies predicted by our model and the observational results presented by Tully et al. (2006). Solid inner (outer) lines show contour levels enclosing () per cent of each sample, for our three samples of dwarf galaxy systems (green, red and blue lines) and the complete sample (grey lines). Dotted lines show median values computed using bins in the horizontal axis of constant width of in logarithm scale. Black filled circles show observational associations of dwarf galaxies presented by Tully et al. (2006). This figure shows that calibrating the linking length to reproduce reasonably well the characteristic size of associations of dwarf galaxies, allows us to find also good agreement in the mass and the velocity dispersion without any extra tuning in our model. In each one of the scale relationships, six of the seven observational associations of dwarf galaxies are within contour levels enclosing per cent of each sample. In spite of the significant scatter, from the median values of each property and the contour levels, we can conclude that in the CDM model we find dwarf galaxy systems which properties are comparable with observable dwarf galaxy associations.
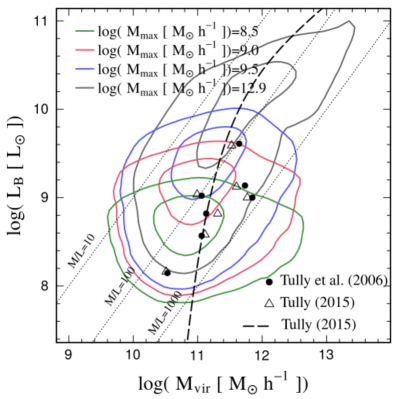
In addition to the dynamical properties, it is important to study the luminosity of these systems. The mass–to–light ratio (M/L) gives information about the true nature of these systems. We analyse the relationship between the B–band luminosity () and the virial mass () of our dwarf galaxy systems. Figure 4 shows the B–band luminosity as a function of virial mass for our three samples of dwarf galaxy systems (green, red and blue lines) and the complete sample (grey lines). Solid inner (outer) lines show contour levels enclosing () per cent of each sample. These results are compared with observations for the seven dwarf galaxy associations taken from Tully et al. (2006) (black filled dots) and Tully (2015) (empty triangles). Tully (2015) analyses the associations of dwarf galaxies presented by Tully et al. (2006), and re-estimates their luminosities and virial masses. Black dotted line shows the empirical fit to the data presented by equation 16 in Tully (2015). Luminosities are affected by intrinsic dust attenuation in both the observations and the model. In the latter, the attenuation is added using the calculation presented by De Lucia et al. (2004), as explained in Cora (2006). We find a reasonable agreement between the luminosity–mass relation of our semi–analytical systems of dwarf galaxies and the observational results. In this case, all the observational associations of dwarf galaxies are within contour levels enclosing per cent of each sample. Furthermore, it seems that the mass–to–light ratio is relatively high if these systems are bound systems. From Figures 3 and 4, we also infer that the highest stellar mass threshold used in our analysis, i.e., , is the one which best matches the observational results.
4 Nature of systems of dwarf galaxies
In the previous section, we infer that both our systems and the associations presented by Tully et al. (2006), present M/L 100, so if the associations are bound then their M/L values are very high. To shed some light on this subject, we analyse the assignment of dwarf galaxy members of systems to dark matter haloes. The main question is whether dwarf galaxies which are members of these kind of systems live in the same dark matter halo or in different dark matter haloes. In that sense the reader will note that Kourkchi & Tully (2017) propose a definition of “associations” for systems that belong to different dark matter haloes, while they define as “groups” those systems who live in the same dark matter halo. They used these definitions to classify different kind of systems, not only those consisting of dwarf galaxies. In this scheme, characteristic sizes of associations correspond to the first turnaround radius, while the characteristic sizes of groups correspond to the second turnaround radius.
Specifically, we identify if the members of each of our systems are located in the same main host dark matter halo or if they are located in different dark matter haloes, using information given by Rockstar halo finder. For this purpose, we define three different sets for each one of our semi–analytical samples according to the following conditions: (i) systems with all their galaxy members belonging to the same halo; (ii) systems with all their galaxy members belonging to different main host dark matter haloes; (iii) a mixed of the two, i.e., systems for which some of the galaxies belong to the same dark matter halo, but others belong to different host haloes. According to the classification of Kourkchi & Tully (2017), the first classification would be considered as “groups”. Hereafter, we will refer to each of these sub–samples as: (i) Groups, (ii) Associations in different–haloes, and (iii) Associations in mixed–haloes.
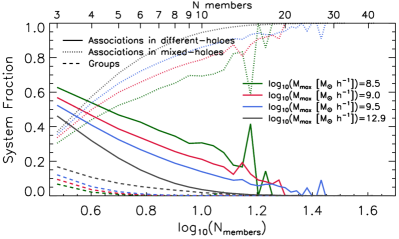
Figure 5 shows the fraction of Associations in different–haloes (solid lines), Associations in mixed–haloes (dotted lines) and Groups (dashed lines), as a function of the number of members per system, for our three samples of dwarf galaxy systems (green, red, blue lines) and the complete sample (grey lines). It is apparent that most of the systems belong to Associations in different–haloes and Associations in mixed–haloes sub–samples, while only about 10 per cent (or less) belong to the Groups sub–sample. Although it is a function which depends on the number of members, on average, about 50 per cent of our systems of dwarf galaxies reside in Associations in different–haloes, about 40 per cent in Associations in mixed–haloes and less than 10 per cent in Groups. As the number of members increases, the fraction of dwarf galaxy systems that belong to Associations in mixed–haloes becomes increasingly important.
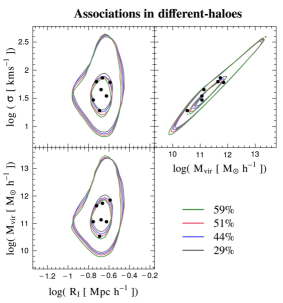
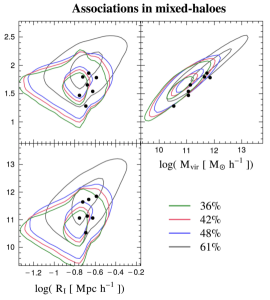
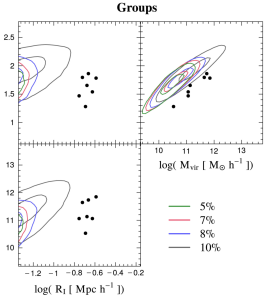
Next, we analyse the differences in the dynamical properties of the systems depending on whether their galaxy members are located in the same host dark matter halo or in different ones. Figure 6 shows the scaling relations presented in Figure 3 but now subdivided into the three samples of dwarf galaxy systems (green, red, blue lines) and the complete sample (grey lines), and split into Associations in different–haloes (left panels), Associations in mixed-haloes (middle panels) and in Groups (right panels). Solid inner (outer) lines show contour levels enclosing () per cent of each sample. Bottom right labels show the percentage of each sample. For comparison, we also plot the observational results for the seven dwarf galaxy associations taken from Tully et al. (2006) (black filled circles), as in Figure 3. As expected, the Associations in different–haloes and Associations in mixed–haloes reproduce much better the characteristic sizes of the observational sample of dwarf galaxies associations. In the Associations in different–haloes case, the seven observational associations of dwarf galaxies are within contour levels enclosing per cent of each sample if the scaling relation includes the inertial radius. In the case of the scaling relation between velocity and mass, the seven observational associations of dwarf galaxies are within contour levels enclosing per cent of each sample. Conversely, Groups are systematically smaller by a factor of , and none of the seven observational associations of dwarf galaxies are within their contour levels for any of the samples.
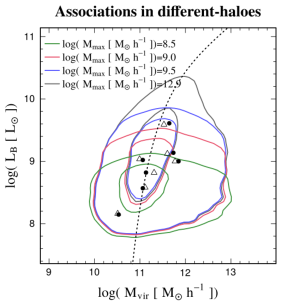
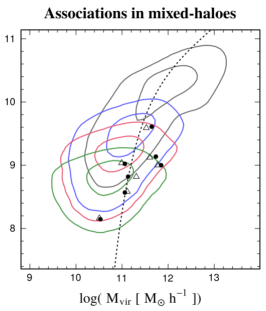
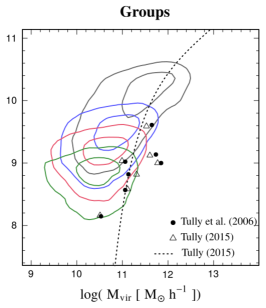
We also analyse the variation of the relation vs. , when we select systems according to the belonging of their galaxy members to the same host halo or to different ones. This is shown in Figure 7 for the three–samples of dwarf galaxy systems (green, red, blue lines) and the complete sample (grey lines). Lines, contour levels and symbols have the same meaning as in Figure 4. As in Figure 6, we split each sample in Associations in different–haloes (left panel), Associations in mixed–haloes (middle panel) and in Groups (right panel). Even though the B–band luminosity of systems in the different sub–samples are quite similar between themselves and in good agreement with the values of observed associations of dwarf galaxies, it is not the case for their virial mass. The dwarf galaxies systems in the Groups sub–sample present virial masses smaller than observed, since smaller size gives place to smaller estimation of their virial mass. Sample size not withstanding, Fig 7 and 8 are a strong demonstration that the systems of dwarf galaxies observed by Tully et al. (2006) and under examination here, are likely to be associations of dwarfs and not groups of dwarfs that share a host halo.
5 Conclusions
We use the high–resolution dark matter only SMDPL simulation (Klypin et al., 2016) coupled to the SAG semi–analytical model (Cora et al., 2018) to study associations of dwarf galaxies in the CDM cosmological context. We identify galaxy systems using a FoF algorithm with a linking length equal to , chosen to reproduce the size of the observational associations of dwarf galaxies presented by Tully et al. (2006). We analyse three different samples using a maximum dwarf mass and and find that the last one agrees slightly better with the observational results than the other two. Our systems of dwarf galaxies have between 3 and 42 galaxy members; as expected from the dark matter halo mass function, there are more systems with fewer members than with many members. More than per cent of our dwarf galaxy systems have 3 or 4 members.
We compare our predictions with the observational dwarf galaxy associations presented by Tully et al. (2006) and find reasonable agreement not only in their sizes but also in their velocity dispersion and virial masses. In agreement with observational results, our systems have typical sizes of , velocity dispersion of and virial mass of . Taking advantage of the information provided by the numerical simulation, we identify if the galaxy members of each one of our systems are located in the same main host halo or if they are located in different dark matter haloes. We find that more than 90 per cent of our dwarf galaxies systems have their galaxy members residing in different dark matter haloes. On the contrary, less than 10 per cent of our dwarf galaxies systems have their galaxy members residing in the same dark matter halo. Moreover, in agreement with observational results, our associations show relative large mass–to–light ratio (100 < M/L < 1000) if we assume that are bound systems. We are able to assert that our model of galaxy formation SAG applied to the high–resolution SMDPL simulation, consistent with a flat cosmological model, is capable to reproduce the existence and properties of dwarf galaxies associations without any extra fine–tuning. We compare our results with the only seven observational associations of dwarf galaxies reported so far, but this analysis is important in the light of coming surveys, such as Dark Energy Spectroscopic Instrument (DESI) and Legacy Survey of Space and Time (LSST). These surveys promise the most detailed map of the nearby universe, from which we will be able to systematically study dwarf galaxies and the different systems that they inhabit.
Acknowledgements
We are very grateful to the referee for the constructive and insightful report which helped to improve our paper substantially. The SMDPL simulation has been performed at LRZ Munich within the project pr87yi. The CosmoSim database (www.cosmosim.org) used in this paper is a service by the Leibniz–Institute for Astrophysics Potsdam (AIP). Our collaboration has been supported by the DFG grant GO 563/24-1. This work has been partially supported by the Consejo de Investigaciones Científicas y Técnicas de la República Argentina (CONICET), the Secretaría de Ciencia y Técnica de la Universidad Nacional de Córdoba (SeCyT), Agencia Nacional de Promoción Científica y Tecnológica (PICT 2016-1975), and Universidad Nacional de La Plata, Argentina. NIL acknowledges financial support of the Project IDEXLYON at the University of Lyon under the Investments for the Future Program (ANR-16-IDEX-0005). NIL also acknowledge support from the joint Sino-German DFG research Project “The Cosmic Web and its impact on galaxy formation and alignment” (DFG-LI 2015/5-1). CVM acknowledges financial support from the Max Planck Society through a Partner Group grant. GY acknowledges financial support by MINECO/FEDER under project grant AYA2015-63810-P and by MICIU/FEDER under project grant PGC2018-094975-C21
Data availability
The data underlying this article will be shared on reasonable request to the corresponding author.
References
- Abazajian et al. (2009) Abazajian K. N., et al., 2009, ApJS, 182, 543
- Baldry et al. (2008) Baldry I. K., Glazebrook K., Driver S. P., 2008, MNRAS, 388, 945
- Barnes et al. (2001) Barnes D. G., et al., 2001, MNRAS, 322, 486
- Behroozi et al. (2013a) Behroozi P. S., Wechsler R. H., Wu H.-Y., 2013a, ApJ, 762, 109
- Behroozi et al. (2013b) Behroozi P. S., Wechsler R. H., Wu H.-Y., Busha M. T., Klypin A. A., Primack J. R., 2013b, ApJ, 763, 18
- Besla et al. (2018) Besla G., et al., 2018, MNRAS, 480, 3376
- Binggeli et al. (1988) Binggeli B., Sandage A., Tammann G. A., 1988, ARA&A, 26, 509
- Collacchioni et al. (2018) Collacchioni F., Cora S. A., Lagos C. D. P., Vega-Martínez C. A., 2018, MNRAS, 481, 954
- Colless et al. (2001) Colless M., et al., 2001, MNRAS, 328, 1039
- Cora (2006) Cora S. A., 2006, MNRAS, 368, 1540
- Cora et al. (2018) Cora S. A., et al., 2018, MNRAS, 479, 2
- DESI Collaboration et al. (2016) DESI Collaboration et al., 2016, arXiv e-prints, p. arXiv:1611.00036
- De Lucia et al. (2004) De Lucia G., Kauffmann G., White S. D. M., 2004, MNRAS, 349, 1101
- Fattahi et al. (2013) Fattahi A., Navarro J. F., Starkenburg E., Barber C. R., McConnachie A. W., 2013, MNRAS, 431, L73
- Gan et al. (2010) Gan J., Kang X., van den Bosch F. C., Hou J., 2010, MNRAS, 408, 2201
- Gargiulo et al. (2015) Gargiulo I. D., et al., 2015, MNRAS, 446, 3820
- Giovanelli et al. (2005) Giovanelli R., et al., 2005, AJ, 130, 2598
- Henriques et al. (2013) Henriques B. M. B., White S. D. M., Thomas P. A., Angulo R. E., Guo Q., Lemson G., Springel V., 2013, MNRAS, 431, 3373
- Huchra & Geller (1982) Huchra J. P., Geller M. J., 1982, ApJ, 257, 423
- Ivezić et al. (2019) Ivezić Ž., et al., 2019, ApJ, 873, 111
- Jones et al. (2004) Jones D. H., et al., 2004, MNRAS, 355, 747
- Karachentsev & Makarov (2008) Karachentsev I. D., Makarov D. I., 2008, Astrophysical Bulletin, 63, 299
- Karachentsev et al. (2013) Karachentsev I. D., Makarov D. I., Kaisina E. I., 2013, AJ, 145, 101
- Kimm et al. (2011) Kimm T., Yi S. K., Khochfar S., 2011, ApJ, 729, 11
- Klypin et al. (2016) Klypin A., Yepes G., Gottlöber S., Prada F., Heß S., 2016, MNRAS, 457, 4340
- Knebe et al. (2018) Knebe A., et al., 2018, MNRAS, 475, 2936
- Kourkchi & Tully (2017) Kourkchi E., Tully R. B., 2017, ApJ, 843, 16
- Lagos et al. (2008) Lagos C. D. P., Cora S. A., Padilla N. D., 2008, MNRAS, 388, 587
- Li & White (2009) Li C., White S. D. M., 2009, MNRAS, 398, 2177
- Lovell et al. (2014) Lovell M. R., Frenk C. S., Eke V. R., Jenkins A., Gao L., Theuns T., 2014, MNRAS, 439, 300
- Makarov & Uklein (2012) Makarov D. I., Uklein R. I., 2012, Astrophysical Bulletin, 67, 135
- Moster et al. (2013) Moster B. P., Naab T., White S. D. M., 2013, MNRAS, 428, 3121
- Planck Collaboration et al. (2014) Planck Collaboration et al., 2014, A&A, 571, A16
- Ruiz et al. (2015) Ruiz A. N., et al., 2015, ApJ, 801, 139
- Sales et al. (2013) Sales L. V., Wang W., White S. D. M., Navarro J. F., 2013, MNRAS, 428, 573
- Springel et al. (2001) Springel V., White S. D. M., Tormen G., Kauffmann G., 2001, MNRAS, 328, 726
- Stierwalt et al. (2017) Stierwalt S., Liss S. E., Johnson K. E., Patton D. R., Privon G. C., Besla G., Kallivayalil N., Putman M., 2017, Nature Astronomy, 1, 0025
- Tecce et al. (2010) Tecce T. E., Cora S. A., Tissera P. B., Abadi M. G., Lagos C. D. P., 2010, MNRAS, 408, 2008
- Tully (1987) Tully R. B., 1987, ApJ, 321, 280
- Tully (1988) Tully R. B., 1988, Science, 242, 310
- Tully (2005) Tully R. B., 2005, ApJ, 618, 214
- Tully (2015) Tully R. B., 2015, AJ, 149, 54
- Tully et al. (2006) Tully R. B., et al., 2006, AJ, 132, 729