Dust evolution in zoom-in cosmological simulations of galaxy formation
Abstract
We present cosmological zoom-in hydro-dynamical simulations for the formation of disc galaxies, implementing dust evolution and dust promoted cooling of hot gas. We couple an improved version of our previous treatment of dust evolution, which adopts the two-size approximation to estimate the grain size distribution, with the MUPPI star formation and feedback sub-resolution model. Our dust evolution model follows carbon and silicate dust separately. To distinguish differences induced by the chaotic behaviour of simulations from those genuinely due to different simulation set-up, we run each model six times, after introducing tiny perturbations in the initial conditions. With this method, we discuss the role of various dust-related physical processes and the effect of a few possible approximations adopted in the literature.
Metal depletion and dust cooling affect the evolution of the system, causing substantial variations in its stellar, gas and dust content. We discuss possible effects on the Spectral Energy Distribution of the significant variations of the size distribution and chemical composition of grains, as predicted by our simulations during the evolution of the galaxy. We compare dust surface density, dust-to-gas ratio and small-to-large grain mass ratio as a function of galaxy radius and gas metallicity predicted by our fiducial run with recent observational estimates for three disc galaxies of different masses. The general agreement is good, in particular taking into account that we have not adjusted our model for this purpose.
keywords:
methods: numerical –- ISM: dust –- galaxies: evolution –- galaxies: formation- – galaxies: ISM – galaxies: general1 Introduction
The interstellar medium (ISM) contains small solid particles, whose size may range from a few Angstrom to a few microns, and incorporate (deplete) a substantial fraction of the ISM metals. We refer to them as (astrophysical) dust. It is widely believed that dust grains consist of two main chemical classes: one carbon-based, and another dubbed “astronomical silicates", whose composition is dominated by four elements, O, Si, Mg and Fe. However, dust is a complex component of the ISM. Unsurprisingly, even its most basic physical properties, such as the chemical composition and the size distribution, depend on the environment, and evolve with time. Constraints on these properties derive mostly from dust reprocessing of the electromagnetic radiation produced by stars and active galactic nuclei, and from depletion studies (e.g. Draine, 2003; Jenkins, 2009, and references therein). However, in general dust reprocessing complicates the interpretation of observations and theoretical predictions.
Dust is an active component of the ISM and its presence substantially affects galaxy evolution. For instance, the chemical species that dust depletes from gas are important ISM coolants while in gaseous form. On the other hand, collision of ions with grains in the hot plasma contribute to its cooling (e.g. Burke & Silk, 1974; Dwek & Werner, 1981; Montier & Giard, 2004; Vogelsberger et al., 2019). Dust grain surfaces catalyze the formation of H2 (for a recent review see Wakelam et al., 2017), a key coolant and the primary constituent of molecular clouds (MCs) where new stars form. Dust enhances by orders of magnitude the capability of interstellar matter (ISM) to receive radiation pressure, thus contributing to its dynamics in general, and in particular to the onset of galactic winds (e.g. Murray et al., 2005). Dust can also ease the loss of angular momentum by gas in forming spheroidal galaxies, as required to fuel their central super-massive black holes (e.g. Granato et al., 2004).
Despite its importance, dust has received for a long while relatively little attention in the context of galaxy formation models, partly due to the very complex and uncertain processes that regulate its life-cycle in the ISM. Until a few years ago, most of the efforts have been in the context of one zone, non-cosmological, chemical evolution models (e,g, Dwek, 1998; Calura et al., 2008; Asano et al., 2013; Feldmann, 2015; Hirashita, 2015). These works paved the way to the recent inclusion of dust-related processes in some semi-analytic work (e.g. Valiante et al., 2011; Popping et al., 2017; Vijayan et al., 2019; Triani et al., 2020) and hydrodynamical simulations (e.g. Bekki, 2013; Valentini & Brighenti, 2015; McKinnon et al., 2016, 2017; Aoyama et al., 2017; Hou et al., 2017; Gjergo et al., 2018; Aoyama et al., 2018; McKinnon et al., 2018; Li et al., 2019; Vogelsberger et al., 2019; Aoyama et al., 2019; Hou et al., 2019; Aoyama et al., 2020; Graziani et al., 2020; Osman et al., 2020). Another possibility is to investigate the problem by means of post-processing computations based on results of simulations not including dust evolution (e.g. Zhukovska et al., 2016; Hirashita & Aoyama, 2019). On the one hand, the latter approach allows the fast exploration of sophisticated dust evolution model. However, it cannot capture the effects of dust on the simulation evolution. Concurrent progress and availability of computing power and simulation codes are making this young field a rapidly evolving one, albeit plagued by strong uncertainties and important, almost unavoidable, simplifications.
The most studied effect of dust in astrophysics is by far radiation reprocessing, which can profoundly modify observational properties of stellar systems. As a general rule, this effect is an increasing function of the star formation activity and, as a consequence, of redshift. For a self-consistent comparison of galaxy formation models with observation, it would be ideal to have from the former ones a prediction of the relevant dust properties. These include not only the dust mass and its spatial distribution, but also the grain size distribution and the chemical composition. Indeed, the optical properties of grains strongly depend on their size and material. Nevertheless, the majority of the published simulations so far do not include a prediction either of the grain size or of its composition, or both.
The first model including a fairly complete treatment of the grain size distribution and its evolution, separately for carbonaceous and silicate dust, was Asano et al. (2013). However, this work was in the framework of one-zone non cosmological models. It predicted that the size distribution of grains should change drastically while galaxies evolve, because the dominant processes regulating it also change over time. The general trend, confirmed by later works, is for an evolution from a distribution initially dominated by large grains (m) to a broad size distribution dominated in number, and to a lesser extent in mass, by the small radius end. Hirashita (2015) pointed out that the main features of the treatment by Asano et al. (2013) can be reproduced with a simple and numerically light approximation. He replaced the continuum size distribution with just two representative grain radii, henceforth referred to as small and large grains, whose limiting radius is at m. The work was still in the context of one zone models, but this two-size approximation was explicitly thought for more numerically demanding galaxy evolution models, in particular for numerical simulations where memory and CPU time consumption are an issue111For other possible numerically effective approaches, so far much less exploited in galaxy formation simulations, see Mattsson (2016) and Sumpter & Van Loo (2020).. Indeed, soon later Aoyama et al. (2017) applied the two-size approximation to an SPH simulation of an idealized isolated galaxy, not including the distinction between the two main chemical species of dust grains. They found encouraging results such as a broad agreement with observed profiles of dust-to-gas and dust-to-metals ratio. In Gjergo et al. (2018) our group implemented the two-size approximation in simulations of galaxy cluster formation, separately for carbon and silicate dust. We pointed out that high-z proto-clusters are expected to have a dust population significantly different from those inferred for the average Milky Way dust, and commonly adopted in dust reprocessing computations. In these initial phases dust is predicted to have much smaller grains and a lower fraction of silicate grains.
The two-size approximation has now been applied in quite a few simulations works. Hou et al. (2017) improved the simulation by Aoyama et al. (2017) by separating dust species into carbonaceous and silicate, with the aim of predicting the extinction curve evolution. The approximation has also been employed in simulations of cosmological boxes by Aoyama et al. (2018) and Hou et al. (2019), finding a broad agreement with the local dust mass functions of galaxies, and predicting that galaxies tend to have the highest dust content at . Interestingly, Aoyama et al. (2020) presented recently a simulation of an isolated disc implementing a full grain size distribution sampled with 32 grid point. They found results in very good agreement with those previously obtained by the same group with the two-size approximation (e.g. Aoyama et al., 2017; Hou et al., 2017; Aoyama et al., 2019), further validating the method.
In this work, we implement, with a few improvements, the two-size approximation in a version of our simulation code which has been already shown to produce galaxies with a realistic disc morphology and chemical properties. The code relies on the star formation and feedback sub resolution model MUPPI (MUlti Phase Particle Integrator, Murante et al., 2010, 2015; Valentini et al., 2017, 2019). Moreover, we added the treatment of hot gas cooling via collisions of energetic electrons with dust grains, following the computations by Dwek & Werner (1981). We devote this paper mostly on assessing the effects of different approximations and assumptions, and to some preliminary comparison with observations, avoiding deliberately any adjustment to the previously selected values of the model parameters.
The plan of the paper is the following. Section 2 is devoted to everything that concerns the numerical setup. In particular, we present in Subsection 2.3 a thorough description of our dust creation and evolution model, and in Subsection 2.4.1 the method we use to cope with the chaotic behaviour of numerical simulation runs. Our results are described in Sections 3 and 4. In the former we study the impact of changing some relevant parameters, assumptions and approximations of different dust properties; while in the latter we present comparisons with recent quantities derived from observations. Finally, Section 5 is dedicated to a brief summary of our work and its prospects.
We adopt a CDM cosmology, with , , , , , and km s-1 Mpc km s-1 Mpc-1.
2 Numerical simulations
The simulations have been performed with the GADGET3 code, a non-public evolution of the GADGET2 (Springel, 2005). Our version of the code adopts the improved SPH (smoothed particle hydrodynamics) formulation by Beck et al. (2016). The unresolved processes of star formation and stellar feedback are treated through the sub-resolution model MUPPI (MUlti Phase Particle Integrator, Murante et al., 2010, 2015; Valentini et al., 2017), briefly described in the next section. Moreover, in this work, we have implemented in MUPPI, with some relevant modifications (see Section 2.3), a treatment of dust formation and evolution similar to that by Gjergo et al. (2018). Thus, we take into account the chemical composition and size distribution of dust grain. For the latter, we use the two-size approximation devised by Hirashita (2015). We have also included the process of hot gas cooling promoted by collisions of ions with dust particles, following Dwek & Werner (1981).
2.1 Initial conditions and gravitational softenings
We perform cosmological hydrodynamical simulations from zoom-in initial conditions (ICs) which produce at an isolated dark matter (DM) halo of mass M⊙. The details on these ICs, identified as AqC, can be found in Springel et al. (2008); Scannapieco et al. (2012). In particular, baryons and high resolution DM particles define a Lagrangian volume that, by z=0, includes a sphere of Mpc radius centred on the main galaxy. The general expectation is that the simulated halo forms a disc galaxy at low redshift, since it does not experience major mergers at late time.
In this paper, we present simulations performed at two different resolutions. Low-resolution (LR, usually dubbed in this work C6) simulations are analyzed to explore the effect of varying parameters and physical assumptions in the treatment of dust evolution. High-resolution (HR or C5) simulations are considered when comparing with observations our fiducial model. In the language of Scannapieco et al. (2012) (the Aquila comparison project), LR-C6 and HR-C5 simulations correspond to level-6 and level-5, respectively. At HR-C5 (LR-C6) the mass resolution for the DM is M⊙ ( M⊙). The masses of gas particles change during the simulation. They can decrease due to star formation, or increase because of gas return by neighbour star particles. Initially, they are M⊙ at HR and M⊙ at LR. As for the computation of the gravitational force, we use a Plummer-equivalent softening length of pc ( pc) for HR (LR) resolution simulations, constant in comoving units at , and constant in physical units at .
2.2 Star formation, Stellar feedback and Chemical enrichment
To describe the processes occurring on unresolved scales, in particular star formation and stellar feedback, we adopt the sub-resolution model MUPPI, in the specific version described by Valentini et al. (2019). In this section, we recall its main features, while we refer the reader to the latter paper, and references therein, for a full account.
MUPPI describes a multi-phase (MP) ISM. An SPH particle is treated as MP if it increases its density above a threshold ( cm-3) and its temperature drops below another threshold ( K). A MP particle consists of a hot and a cold gas phases in pressure equilibrium, plus a "virtual" stellar component. Ordinary differential equations describe mass and energy exchanges between these components. We indicate with and the mass fraction of the gas particles in the two phases. Hot gas condenses into a cold phase (whose assumed temperature is K) due to radiative cooling, while some cold gas evaporates due to the destruction of molecular clouds. The densities of the two phases, used in the dust modelling of this paper, are computed from their filling factor, as described in section 3.1 of Murante et al. (2015). A fraction of the cold gas mass is in the molecular phase, from which a virtual stellar component forms, according to a given efficiency. We rely on the phenomenological prescription by Blitz & Rosolowsky (2006) to estimate . This is an (almost) linear relation between the ratio of molecular and neutral hydrogen surface densities and the midplane pressure of galaxy discs, and is implemented in our code to compute the molecular fraction from hydrodynamical pressure; it can be seen as a convenient bypass to the complex process of molecular cloud formation, that produces a good order-of-magnitude estimate of the molecular fraction, at least at solar metallicities. Over time, MP gas particles generate new stellar particles, using the virtual stellar mass accumulated previously as a consequence of its star formation rate (SFR). The latter process uses a stochastic algorithm (Springel & Hernquist, 2003).
Besides radiative cooling, including here also that promoted by dust (Section 2.3.6), the energy budget of the hot phase is affected by a pure hydrodynamical term, accounting for shocks and heating or cooling due to gravitational compression or expansion of the gas, and by thermal stellar feedback. The latter includes both the contribution of supernovae explosions within the stellar component of the particle itself, as well as that coming from neighbouring particles.
A gas particle stays MP for a maximum allowed time given by the dynamical time of its cold phase, provided that the density keeps above the threshold. When exiting from the MP state, the particle has a probability (a parameter set to 3%) to be kicked and to becomes a wind particle for a given time interval. In this case, it is decoupled from the hydrodynamic forces due to the surrounding medium, but it can receive kinetic feedback energy from other particles. This is used to increase their velocity along their own least resistance path, defined by the opposite direction of the gas density gradient. This sub-resolution model leads to the formation of disc galaxies with morphological, kinematic and chemical properties in reasonable agreement with observations (Valentini et al., 2019, and references therein).
Star formation and evolution also produce a chemical feedback. Chemical evolution and enrichment processes follow Tornatore et al. (2007). Star particles act as simple stellar populations (SSPs). The production of heavy elements include the contributions from Asymptotic Giant Branch (AGB) stellar winds, Type Ia Supernovae (SNIa) and Type II Supernovae (SNII). We follow the production and evolution of 15 chemical elements: H, He, C, N, O, Ne, Na, Mg, Al, Si, S, Ar, Ca, Fe and Ni (see Valentini et al., 2019, for the adopted stellar ejecta), and radiative gas cooling takes into account their contribution. As we will see in the next section, the starting point of our treatment of dust evolution consists in assuming that a certain fraction of some of these elements, produced by the three stellar channels, are given back to medium in form of dust grains rather than in gaseous form.
The elements produced and ejected by stars, both in gaseous and dust form (see next section for the latter) are distributed to the surrounding gas particles by using the SPH kernel. This spreading is not meant to constitute a specific physical treatment of their diffusion, but to avoid a noisy estimation of metal-dependent cooling rates. Therefore heavy elements and dust can be spatially distributed after that only via dynamical processes involving the enriched gas particles.
2.3 Dust formation and evolution
The dust evolution model used here is similar to that we presented in Gjergo et al. (2018), with a few improvements detailed in the rest of this Section. In that paper the scope was to study the evolution of dust in galaxy clusters, and the star formation and stellar feedback model was a simpler one, namely an updated version of that proposed by Springel & Hernquist (2003). Our dust treatment builds on the proposal by Hirashita (2015), who demonstrated that it is possible to follow reasonably well the evolution of the size distribution of grains and to estimate the effectiveness of size-dependent processes just considering two representative sizes, which we refer in the following as large and small grains. The boundary between them was set by Hirashita (2015) at m. This two-size approximation is clearly advantageous in terms of computational cost, compared to more detailed treatments (e.g. McKinnon et al., 2018; Aoyama et al., 2020). Interestingly, the latter paper, based on a full treatment of the size distribution and its evolution, confirmed the results obtained previously by means of the two-size approximation. In the present application, the overhead of computing time arising from the inclusion of dust evolution is limited to less than 15 per cent.
We exploit our advanced treatment of chemical evolution (Section 2.2), which follow individually several elements, to trace two chemically distinct dust grain populations, namely carbonaceous and "astronomical silicate" grains, the latter composed by O, Si, Mg and Fe. Therefore, we adopt the standard view (e.g. Draine, 2003; Jenkins, 2009, and references therein) that dust is dominated by these two chemical species. More specifically, we represent astronomical silicates with the element partition of Olivine MgFeSiO4 (Draine, 2003).222More properly, the term olivine in mineralogy indicates a composition in which Fe and Mg atoms are mutually interchangeable, which can be expressed as MgXFe2-XSiO4. The two extreme cases are forsterite Mg2SiO4 and fayalite Fe2SiO4. Here we follow the common practise in dust astrophysics of considering as representative the intermediate case in which . Actually, most radiative transfer calculations in astrophysical dusty environment adopt optical properties of dust grains calculated by assuming this chemical composition. However, our treatment can be trivially adapted to different dust composition models, provided that the relevant elements are followed by the chemical evolution. In conclusion, we predict the evolution of four classes of dust grains: large and small C grains, and large and small silicate grains.
For the sake of clearness, we briefly anticipate here, before digging into the details, the improvements that we have implemented for the present work compared to Gjergo et al. (2018): (i) we replaced the step-like transition between shattering and coagulation, occurring when density increases, with a more gentle and realistic one (Section 2.3.2). Shattering or coagulation are two possible opposite results of grain-grain collision, and we found that a smoother transition is required to get small over large grain ratios compatible with observations (Section 3.7); (ii) we modified the treatment of accretion of gas onto seed silicate dust grains with respect to the same desired abundance ratios of the various elements in the grains (Section 2.3.3) assumed at stellar production of dust (Section 2.3.1). Indeed, while in the cluster simulations presented by Gjergo et al. (2018) accretion was not important enough to strongly modify these ratios, because cluster galaxies tend to lose their gas relatively soon their gas, the same is not true for disc galaxies (Section 3.6), and a more careful treatment is required; (iii) to estimate the fraction of multiphase SPH gas particle in molecular clouds, where the processes of accretion and coagulation can occur efficiently (Section 2.3.3), we adopted for consistency the same prescription used by the star formation and feedback model MUPPI (Section 2.2); (iv) we introduced the process of gas cooling promoted by ions-grains collision (Section 2.3.6);
A treatment of dust evolution including its size distribution, rather than simply the total dust mass, turns out to be more reliable, because some processes are size dependent. Moreover, since the optical properties of grains strongly depend on their dimension, it is also beneficial for post-processing computations involving radiative transfer, such as those presented in Hou et al. (2017), Gjergo et al. (2018) and in Section 3.2.
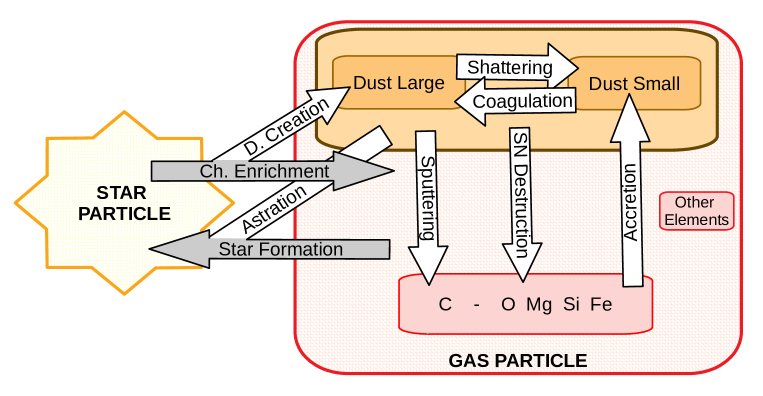
The main processes affecting the dust content of galaxies can be summarized as follows. The life cycle of grains begins with dust production in the ejecta of stars, including AGB star winds as well as SNII and possibly SNIa explosions, although recent observational and theoretical work cast doubts on a significant contribution from SNIa (see Sections 2.3.1 and 3.5). In any case, it can be assumed that dust production affects directly only large grains (e.g. Nozawa et al., 2007; Bianchi & Schneider, 2007).
Once in the ISM, grains undergo several physical processes influencing their size and chemical composition. Gas metal atoms can stick on their surface. (Dwek, 1998; Hirashita, 1999). Being this accretion a surface process, it is more important for small grains, because of their larger total surface per unit mass. In the two size approximation framework, its direct effect is to increase the mass of small grains, while both the mass increase of large grains as well as the evolution of small grains to large ones can be safely neglected (Hirashita, 2015). However, an increased abundance of small grains causes a more effective production of big ones. Indeed, grain-grain collisions can either result in grain coagulation or shattering, depending on the collision velocity. The former process dominates in dense ISM where velocities are low, and it acts as a sink mechanism for small grains and a source mechanism for large ones. Accretion on small grains in combination with their coagulation into larger ones increases the mass budget of the latter ones. In this sense, accretion affects indirectly large grains mass as well. Shattering dominates in the diffuse ISM, acting as a source of small grains and a sink of large ones.
Sputtering is the grain erosion due to collisions with energetic ions. It is another surface process, more effective on small grains. The eroded atoms are given back to the gas phase. It occurs both when grains are swept by SNae shocks, and when they are subject to violent ion collisions in the hot diffuse gas. On top of SNae dust destruction, caused both by kinetic and thermal relative motions, we include the latter thermal sputtering, which is important only when grains are surrounded by hot gas K. Hirashita (2015) and Aoyama et al. (2017) did not consider this form of sputtering, because they were interested only in galactic ISM. However, our results show that it can be relevant also when modelling the evolution of dust in disc galaxies (Section 3). We refer to this process simply as sputtering, while we call the former one SNae destruction.
When gas is turned into stars, its dust content is subtracted from the ISM, a process usually dubbed astration. We found that it is not negligible compared to other dust destruction mechanisms (Section 3.8), contrariwise to recent claims (McKinnon et al., 2018). A visual summary of how the various processes act on gas and stellar particles in the simulation is presented in Fig. 1.
This processes are implemented in our simulations by mean of sub-resolution prescriptions. A fraction of some of the metals ejected by star particles into the ISM is assumed to be given in form of grains rather than gas. This fraction depends on the specific metal, is computed as described in Section 2.3.1 and is greater than zero only for metals entering into the grain composition. To track these metals locked in grains, the gas particle numerical structure includes two extra vectors, which store the amount of each element that is in large and in small dust grains individually, rather than in gas. The total fraction of each "gas" particle in grains never surpasses a few per cent, and we still refer to them simply as SPH particles. Therefore in our code it is assumed a perfect coupling between gas and dust. At the relatively coarse resolution of galaxy formation simulations, and for the typical conditions of galactic ISM this assumption is well justified (e.g. Draine & Salpeter, 1979; Murray et al., 2005; McKinnon et al., 2018). In particular, McKinnon et al. (2018) presented a careful numerical framework including a state-of-the-art treatment of dust evolution and its size distribution. So far, this model has been tested only on a very idealized isolated disc galaxy simulation, with cooling and star formation but without any feedback. At variance with most numerical works on dust evolution in galaxies (including our own), dust is not assumed by construction to be perfectly dynamically coupled to gas. However, their galaxy simulations show that the drag force between the two components turns out to be strong enough to grant their effective coupling. Taking into account all the aforementioned processes, the rate of change of the dust mass, for each SPH particle in the two-size populations of small grains and large grains , is:
| (1) |
where is the dust production rate by stars, and each ISM process is described by a corresponding timescales: for shattering, for coagulation, and for SN shock destruction, and for sputtering, and for accretion. The last term, wherein is the SFR, accounts for the dust mass loss due to star formation (astration). These equations are applied separately for each element entering into the dust grains. In the next subsections, we describe how we estimate in the simulations the various contributions.
2.3.1 Dust production by stars
A certain fraction of the elements concurring to dust composition is injected into the ISM by AGB winds, SNIa, and SNII as solid dust particles rather than as gas. Since we consider carbon and silicate dust, and we approximate the latter with olivine MgFeSiO4, these elements are C, Si, O, Mg, and Fe.
For simplicity, we assume that for each of the three stellar dust formation channels, the fraction of each element eligible to condense to dust is independent of stellar mass and metallicity. This approach, is partly similar to that introduced in one-zone models by Dwek (1998), and later adopted by many works (e.g. Calura et al., 2008; Hirashita, 2015; Aoyama et al., 2017). However, we note that the requirement of respecting the partition of MgFeSiO4 for silicates, not considered in the papers mentioned above, introduces a dependence on stellar mass and metallicity of the actual dust condensation efficiencies of O, Mg, Fe and Si. The reason is the dependence of stellar ejecta on the latter two parameters and is detailed in the rest of this Section.
There are several studies on the dependency of dust condensation efficiencies on stellar mass, metallicity and ambient gas density (see e.g. Nozawa et al., 2007; Schneider et al., 2014, and references therein). In principle, it would be straightforward to incorporate these dependencies into our formalism. However, we have verified that our results are little affected by variations of the assumed efficiencies as large as 30%, but for very high redshift . This is because at late times most of the dust mass is produced by accretion of gas onto preexisting seed grains.
AGB. Following Dwek (1998), we assume that the production of carbon or silicate dust is mutually exclusive in AGB winds, depending on the C/O number ratio in the ejecta. This view, supported by observations, relies on the assumption that AGB ejecta are mixed at microscopic scales. As a consequence, the maximum possible amount of CO forms. If C/O, all the oxygen is consumed to produce CO molecules and only the remaining carbon condenses to dust. When C/O, all the carbon ties to CO molecules. The leftover oxygen is then potentially available, but usually not entirely consumed (see below), to condense into silicate grains, together with Mg, Si and Fe.
We indicate with and the O and C masses ejected by the AGB winds of a star particle during a time-step. If , where 0.75 is the ratio between O and C atomic weights, the particle produces carbon grains. Subtracting the C mass used to form CO molecules, we obtain that the corresponding mass of ejected carbon dust is
| (2) |
In this work, we set , the condensation efficiency of carbon grains in AGB winds, to 1, following Dwek (1998) (see also Calura et al., 2008).
By converse, when , silicate grains condenses. Dwek (1998) simply estimated the masses of the metals going into silicates by assuming that for each ejected atom of Si, Mg and Fe, an O atom will go into dust as well, as described by his equation 23. As expected, by implementing this approach in our code we verified that it leads to the production of ’silicate grains’ having a very variable mass ratios between its four elements, and in particular featuring a very large fraction of oxygen. These ratios are substantially different from those typically assumed by radiative transfer computations. Therefore we adopted a different formulation, preserving the elemental mass partition of MgFeSiO_4. Our procedure is based on the idea that the availability of just one element sets the maximum number of "molecules" or groups of the assumed compound that is possible to form. This is the element for which, in the stellar ejecta, the number abundance divided by the number of its atoms entering into the compound is minimun. This driving element has been dubbed key element by Zhukovska et al. (2008), and the concept has been used in later works to describe dust stellar production or accretion in the ISM, or both (e.g. Hirashita & Kuo, 2011; Asano et al., 2013; Gjergo et al., 2018; Hou et al., 2019; Vijayan et al., 2019, see also Section 2.3.3 for the accretion process).
We indicate now with the mass of the generic X element ejected by the AGB winds of a star particle during a time-step. For olivine, X can be Mg, Fe, Si or O. Let be the number of "molecules" of MgFeSiO4 that can be formed during the time-step. This number is set by the element for which the number of atoms ejected divided by the number of its atoms in the compound (1 for Mg, Fe, Si, and 4 for O) is minimum. Then
| (3) |
where is the atomic weight of the X element, and we have introduced an efficiency factor of condensation for silicate grains , set to 1 in our reference model. Therefore, the mass of the X element locked into silicate grains is given by
| (4) |
It is straightforward to adapt the above treatment to chemical compounds different from olivine.
SNae II and Ia. By converse, in the outflows produced by SNae explosions, carbon and silicate dust can condense at the same time, since such outflows are mixed only at macroscopically (e.g. Dwek, 1998, and references therein). Hence:
| (5) | |||||
| (6) | |||||
| (7) |
where stands either for or , and is the mass of the generic element ejected by the explosions from a star particle during a time-step. For SNae we assume a lower dust condensation efficiency of and as in Dwek (1998). These values accounts for incomplete condensation of available elements and for grain destruction by SN shock. We point out that in the last years the role of individual SNIa in dust production has been substantially revised downward, based both on observational and theoretical studies (see discussion in Gioannini et al., 2017, and references therein). This could be easily accounted for by reducing the corresponding condensation efficiencies. However, since we found that even with the adopted values the global contribution of SNIa turns out to be minor in our simulations (see Section 3), we do not perform this modification in the present work.
2.3.2 Shattering
In the diffuse gas, large grains are decoupled from small-scale turbulent motions (Hirashita & Yan, 2009). Therefore they mutual collisions occurs at velocities high enough (, Yan et al. 2004) to cause shattering into small grains. Shattering originates small grains, without affecting the total dust mass. Its timescale is derived from the collision timescale:
| (8) |
where , and are the typical collision velocity, the cross section and number density of colliding particles. Based on the results by Yan et al. (2004), we assume that for gas density lower than , and that at higher densities decreases as , so that for . Above the latter density, the shattering process is completely switched off because we assume instead that low velocity collisions result only in the coagulation of small grains to form large ones, as described in Section 2.3.3. Following Appendix B of Aoyama et al. (2017) this yields:
| (9) |
where is obtained assuming a grain size of m, and a material density of grains 3 g cm-3. is the dust to gas ratio for large grains.
We explicitly note that at variance with previous implementations of the two-size approximation (Gjergo et al., 2018; Aoyama et al., 2017), we do not switch off abruptly shattering when . Besides being somewhat more realistic on physical grounds, we found that this smoother transition to the regime at which small velocities favour the opposite coagulation process (Section 2.3.3) is required here to obtain a sufficient production of small grains333On the other hand, by repeating a couple of the galaxy cluster simulations presented in Gjergo et al. (2018), we checked that the smooth transition introduced here has a negligible effect on them., as discussed in Section 3.7. In our simulations, densities above are not resolved, and most particles at density are MP (Section 2.2). In the latter case, we assume that shattering occurs only in the cold phase, so that we plug into Eq. 9 the density of this component. The fact that we neglect shattering in the hot phase has two justifications. First of all it accounts typically for less than 1% of the particle mass. Moreover, its temperature K is high enough to quickly destroy the small grains (Section 2.3.5).
Finally we note that, in principle, a more gentle decline of the shattering efficiency above the chosen limit would be more aesthetic and physically accurate, but it is unnecessary. Indeed, we checked with a few test runs that the results are almost unaffected by the exact shut-off, as long as it occurs in the range - cm-3. Thus a smoother decline of the efficiency above some density in this range would produce indistinguishable results. The physical reason is that the cold phase is very seldom at densities above cm-3, which approach the molecular cloud regime, where coagulation is at work444In LR simulations and at () the cold phase density typically features a median () cm-3 and 10%-90% percentiles of and ( and ) cm-3 respectively. In HR simulations these figures are about 1.5-2 times larger..
2.3.3 Accretion and Coagulation in dense molecular gas
Accretion of gas metals onto grains as well as grain coagulation are relevant processes only in the densest regions of the cold ISM, cm-3 (e.g. Hirashita & Voshchinnikov, 2014), where hydrogen is mostly in molecular form. These high densities are unresolved in most cosmological simulations, including our own. Therefore, we have to resort to a sub-resolution prescription to estimate the fraction of gas particles mass that is locally in this condition. To do this, we consistently rely on the MUPPI model used here to describe the unresolved processes of star formation and feedback (Sec. 2.2). Therefore, we assume that accretion and coagulation occur only in MP (multi-phase) particles, specifically in the molecular fraction of the cold phase. Indeed, the typical density of the cold phase turns out to depend both on redshift and resolution, but in general it is much lower than the minimum density for the aforementioned processes to be relevant. On the other hand MUPPI uses the Blitz & Rosolowsky (2006) scaling of molecular fraction with pressure to estimate , that is used to compute the SFR (see Section 2.2). Therefore, in the present application we simply set , where is the cold mass fraction of the SPH particle. Gas metal accretion onto preexisting grains is a fundamental ISM process, strongly affecting the dust content of galaxies (see Section 3.5). Being a surface process, in the two-size approximations, it is directly taken into account only for small grains. Nevertheless it influences also the amount of large grains, by enhancing the coagulation of small grains.
From equation 19 of Hirashita & Kuo (2011), the mass increase timescale due to accretion of the generic element on grains of radius is
| (10) |
where is the mass fraction of element in the grain, is the density of the grain material, is the atomic weight of the element, its atom mass, , and are the gas number density, temperature and mean molecular weight respectively, the mass fraction of the element in the gas phase, and is the sticking efficiency. A factor 3 in the denominator accounts for the fact that the timescale given by Hirashita & Kuo (2011) is for the grain radius growth, while here we are considering the mass growth. For spherical grains the mass variations timescale is related to that for radius variations by . The fraction is included because we assume that accretion occurs only in the densest molecular regions of MP particles, as described above.
| ELEMENT | |||||
|---|---|---|---|---|---|
| C | O | Mg | Si | Fe | |
| 1.0 | 0.37 | 0.14 | 0.16 | 0.32 | |
| AX[ yr] | 2.5 | 1.56 | 0.73 | 0.91 | 2.52 |
The previous expression can be rewritten in a convenient numerical form:
| (11) |
where the radius is in units of , the gas density in units of cm-3, its temperature in units of 50 K and the sticking efficiency in units of 0.3, which are the fiducial values adopted in our computations. The normalization factor depends on the elements under consideration, via and . The former fraction is 1 for C, which forms pure carbonaceous grains, while for the silicate forming elements we compute by assuming as usual the intermediate MgFeSiO4 olivine composition. By further adopting a material density of 3.3 and 2.2 g cm-3 for silicate and carbon grains respectively, we get the values of reported in Table 1.
As for silicate grains, we impose the condition that the accretion process maintains the same olivine-like mass fraction of the four elements adopted for stellar dust production (see Section 2.3.1). We achieve this by adopting for all of them the accretion timescale of the element for which is maximum. This "leading" element has been commonly dubbed in previous work as key element (e.g. Zhukovska et al., 2008; Hirashita & Kuo, 2011; Asano et al., 2013; Hou et al., 2019). In our simulations, the key element is identified at each timestep and for each gas particle, based on the instantaneous metal abundance pattern. It usually, but not always, turns out to be Si for silicates, as assumed for instance by Hirashita & Kuo (2011) and Hou et al. (2019).
To illustrate the importance of imposing the latter condition on the dust composition of accreting silicate grains, we also run cases where the accretion process is instead free, i.e. for each element we use its own value of (Eq. 10). In this case we give up to the very concept of key element. The corresponding model is dubbed and its features will be discussed in Sections 3.6.
In the densest ISM regions, low velocity small grain collisions result into coagulation, to form large grains. We adopt for this process the same timescale given by Aoyama et al. (2017), but again taking into account that it occurs only in the fraction of the SPH particle mass:
| (12) |
Here is the dust to gas ratio for small grains and is the velocity dispersion of small grains. We set based on Yan et al. (2004). The normalization is , a value derived assuming a typical size of small grains of m, a material density of 3 g cm-3. For simplicity, the latter figure is somewhat intermediate between that adopted above for silicate and carbon grains. We tested that the small related difference in the timescale for the two types of grains, has no practical consequences here.
2.3.4 SNae destruction
Dust grains are eroded by thermal and non-thermal sputtering occurring in SNae shocks (for a review see McKee, 1989). In this work we refer to destruction by SNae events as SNae destruction, while we reserve the term sputtering to the thermal sputtering occurring in the diffuse hot gas described in next Section. To treat the former process we follow Aoyama et al. (2017). We do not differentiate here the effects of SNII and SNIa, and we indicate their total number over the timestep . However the code is ready to take into account different values of the relevant parameters for the two SN types. The process timescale for the process can be written as
| (13) | |||||
where is the mass of the SPH particle, is the gas mass swept by a SN event (in our simulations ), and is the grain destruction efficiency in the shock. We set as in Aoyama et al. (2017) and Gjergo et al. (2018). The shocked gas mass has been estimated in McKee (1989) as:
| (14) |
where is the energy from a single SN explosion and the shock velocity. We adopt the fiducial value of erg. McKee et al. (1987) give for the formula
| (15) |
However, since our simulations do not resolve the densities of SN blasts and the dependencies are very weak, we simply set km s-1, which implies .
2.3.5 Thermal sputtering
Grains surrounded by plasma at K, are efficiently eroded by collisions with ions. To account for this thermal sputtering we use the radius variation timescale formula given for the Tsai & Mathews (1995), which approximates reasonably well the results of calculations for both C and silicate grains up to K. The efficiency stalls above this temperature (Tielens et al., 1994). From equations (14) and (15) of Tsai & Mathews (1995) we obtain, for the mass variation timescale:
| (16) |
with and . In this equation the number density includes both ions and electrons. By using a mean molecular weight of a fully ionized mixture of 75% H and 25% He, the normalization constant given in that paper would yield . This value includes the relationship between the mass and the radius variations timescales . However our previous simulations presented in Gjergo et al. (2018), as well as the independent simulations of Vogelsberger et al. (2019), both adopting the same sputtering parametrization, suggest that to reproduce the relatively large amounts of dust observationally inferred in galaxy clusters (Planck Collaboration (XLIII) et al., 2016), a significantly longer sputtering timescale is required, by a factor 5 and 10 respectively. Therefore in our fiducial model we adopt a five time larger value of the parameter, . However, we also run for comparison test simulations adopting the ”canonical” normalization quoted above, as well as simulations adopting a ten time larger value (C6_SpuTsai and C6_Spu0.1Tsai respectively in Table 2). In the former case the results with respect to our fiducial value are almost identical, while in the latter case, which correspond to the preferred normalization by (Vogelsberger et al., 2019), the increase of dust survival and its effect are quite noticeable.
We use m and m for the effective radii of large and small grains, respectively. The former value is the average radius for a power law size distribution with index , extended from 0.03 m (the adopted boundary between small and large grains) to m (e.g. Silva et al., 1998).
2.3.6 Dust Cooling
Besides being eroded by ion collisions, dust grains in a hot plasma are heated by collisions, mostly with electrons. Ion collisions turn out to be comparatively negligible since they move much slower at the same energy, implying a much reduced collision rate (Montier & Giard, 2004). The energy absorbed by the grains is then efficiently radiated in the IR region, resulting in a net cooling of the gas.
Our treatment of this process is essentially the same as in Vogelsberger et al. (2019), which is based on the computations by Dwek & Werner (1981). The only substantial difference is that we have two distinct populations of grains, as far as size is concerned. The latter paper provides the following expression for the heating rate in erg s-1 of a single dust grain of radius in a thermal plasma with electron density :
| (17) |
where . The contribution to the gas cooling function, arising from the population of grains with size and featuring a number density can be calculated as
| (18) |
In our code we compute separately the contributions from large and small grains, assuming for them the same radii used to calculate sputtering (Section 2.3.5), namely m and m respectively. For simplicity, when estimating the grain number density , we use for both silicate and carbon grains an intermediate material density of 3 g cm-3.
2.4 The set of simulations
All the simulations of the present work adopt the parameters and assumptions of the model K3s–yA–IaB–kB of Valentini et al. (2019), apart from those related to dust evolution, not included in that work. The adopted IMF is that by Kroupa et al. (1993). The latter simulation is that, among their models, which better agrees with several observational properties of the Milky Way (MW) (see their Table 2), including stellar chemical abundances. Nevertheless, our results should not be considered as a model of the MW, as no attempts to reproduce its accretion history have been made. We are rather interested in simulated galaxies with an extended disc component at , and broadly speaking representative of spiral galaxies in the nearby Universe. Moreover, we stress that since the inclusion of dust processes modifies to some extent the galaxy evolution (as shown in Section 3), the calibration of galaxy formation parameters should be reconsidered. This operation is clearly outside the scope of the present work.
Table 2 lists the simulations discussed in the present work, with a brief remark on the difference of each of them with respect to the fiducial run.
2.4.1 Simulations chaos and variance
A fairly underrated feature of numerical simulations is that, in most conditions, repeated runs of the same model produce results that can differ significantly from each other (e.g. Keller et al., 2019; Genel et al., 2019). This form of butterfly effect is generated by the combination of purely numerical aspects with the physically chaotic nature of the system we aim to simulate. Tiny, apparently negligible, perturbations present in N-body systems at some point of the evolution are amplified to significant differences later on. In simulations, a typical, mostly unavoidable, source of the small perturbations is the reduction operations performed by parallel protocols such as MPI or OpenMP. These operations are not fully deterministic. The chaotic nature of N-body systems becomes even more substantial due to the subgrid models of star formation and feedback, which usually relies on stochastic algorithms, for instance when spawning new stellar particles from gas particles.
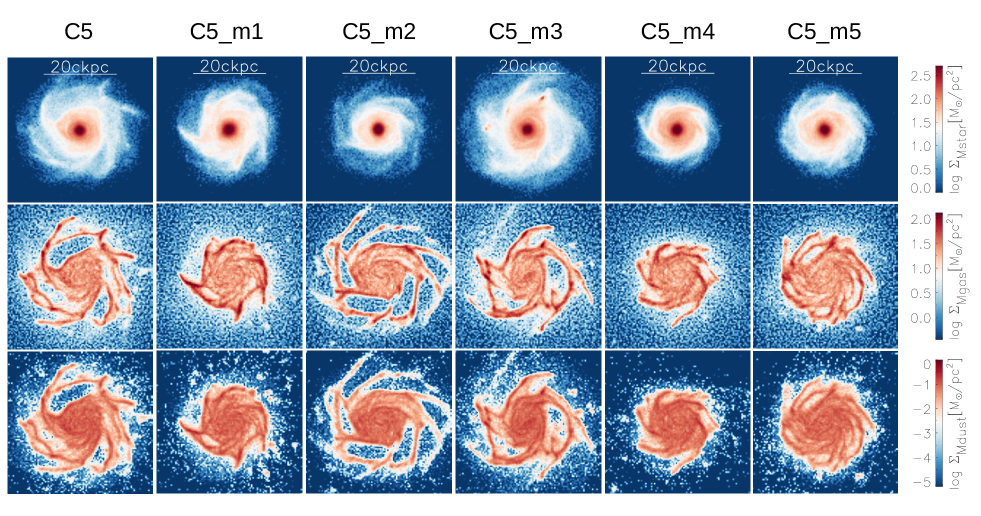
Therefore, when evaluating the effect of different assumptions in simulations, in particular in zoom-in simulations of single objects such as those considered in this work, it would be necessary, albeit usually not performed (but for some very recent work, see e.g. Oh et al., 2020; Davies et al., 2020), to distinguish them from mere manifestations of the butterfly effect described above. To quantify this effect, we adopted the same approach as Keller et al. (2019), namely we repeated each run 6 times, introducing in 5 of them very small perturbations in the initial conditions, close to the machine precision level. These tiny perturbations produce differences in parallel simulations outcomes similar to those produced by changes in the hardware or software setup (Keller et al., 2019). Specifically, we randomly displace the initial position of each particle by an amount drawn from a uniform distribution ranging from to , with set to times the gravitational softening adopted for gas particles. This translates to cpc ( cpc) for C6 (C5) simulations. As a result, the last 3 decimal digits of the double precision particle position, which are stored in cMpc, are randomly modified in the initial conditions. However, we checked that the results turn out to be rather independent of this choice, confirming the claim by Genel et al. (2019). Indeed even runs adopting values of greater by several orders of magnitude show similar differences when compared to the unperturbed run. Moreover, by running some models starting from six additional perturbed initial conditions, that is by doubling the sample, we checked that six repetitions of the run safely cover the spread of possible evolutions. To give some visual feeling of the former variations, we show in Fig. 2 maps of stars, gas and dust mass densities for all the six realizations of the same fiducial model.
Finally, we also verified that the run to run variations obtained by perturbing the initial conditions as described above, are comparable to those we get by running the same unperturbed initial conditions on different hardware.

3 Results: Evolution of global quantities
| Label | Description | Fig |
|---|---|---|
| C6 | Fiducial LR | 4 - 15 |
| C6_noDust | no dust processes | 4 |
| C6_SputTsai | more sputtering | not shown |
| C6_noSput | no sputtering | 5, 6 |
| C6_noDustCool | no dust cooling | 5, 6 |
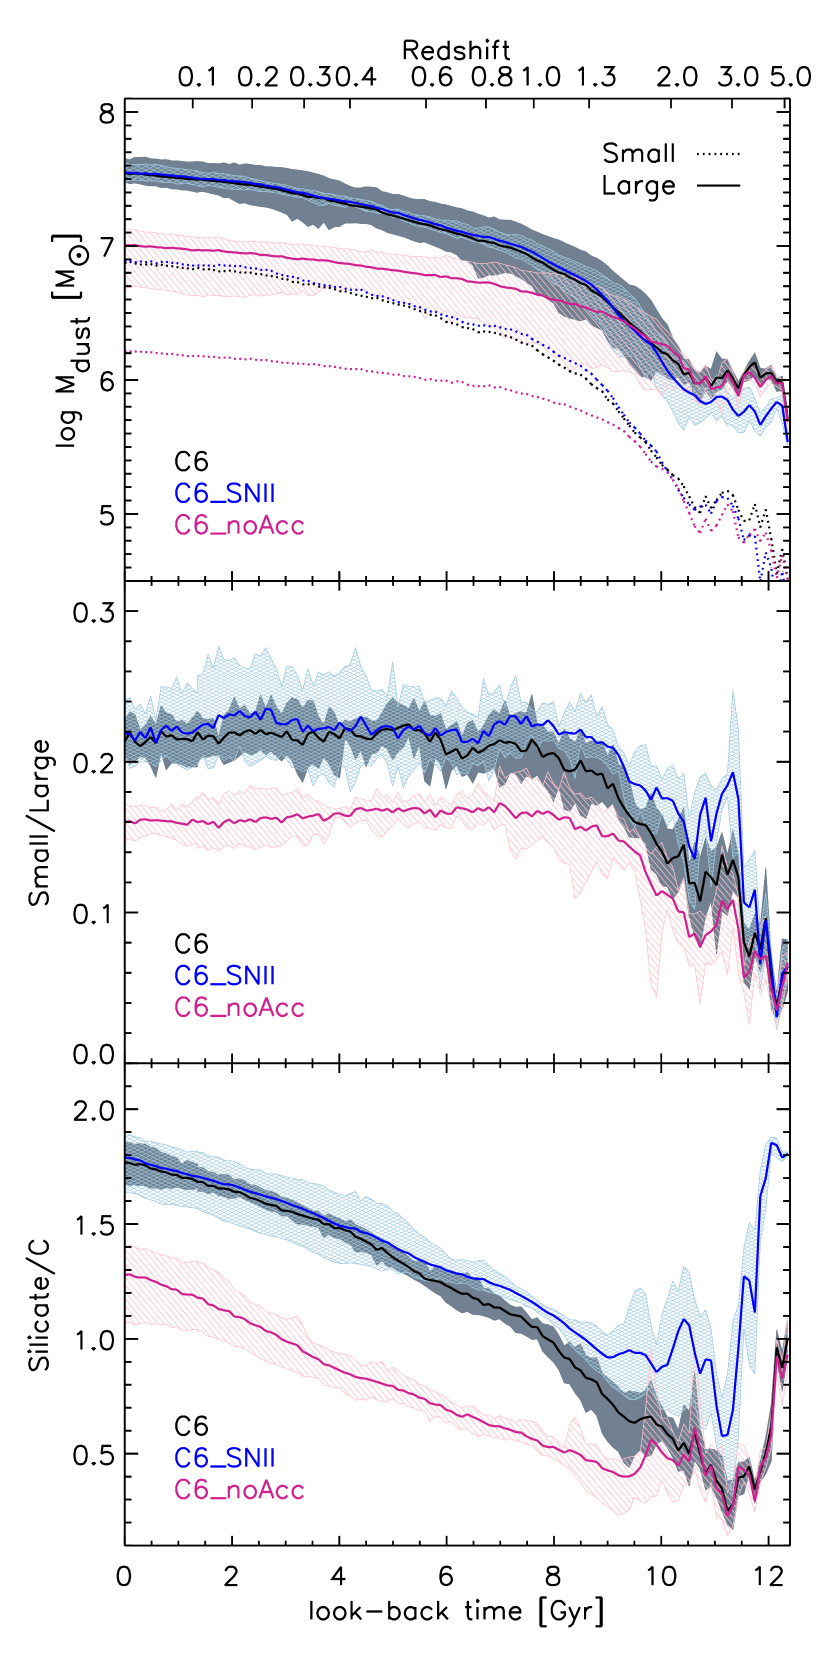
| C6_SNII | only SNae II stars produce dust | 8, 9 |
| C6_noAcc | no accretion | 8, 9 |
| C6_AccFree | unconstrained accretion of Silicate metals | 10 |
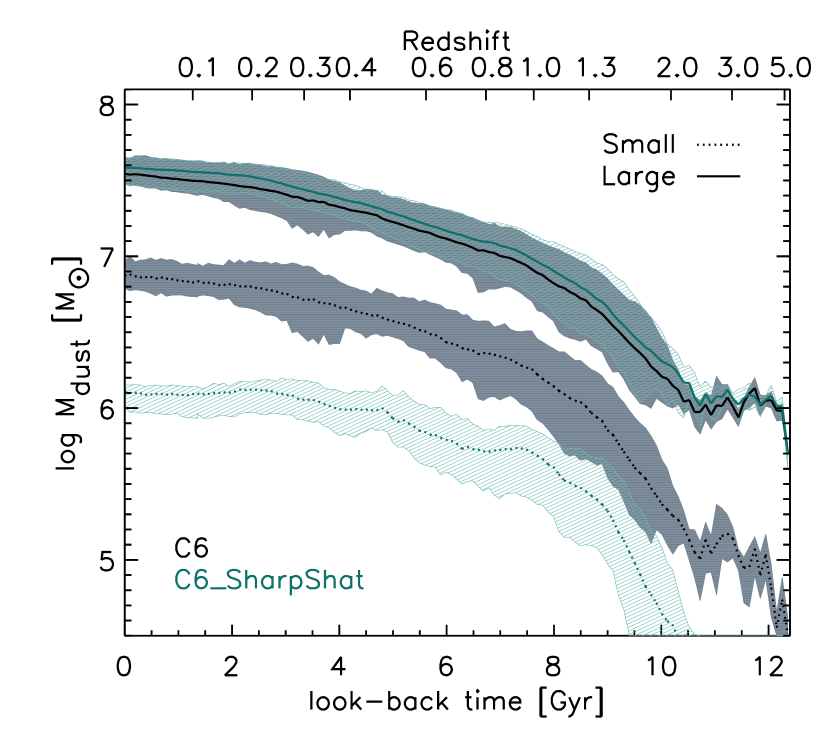
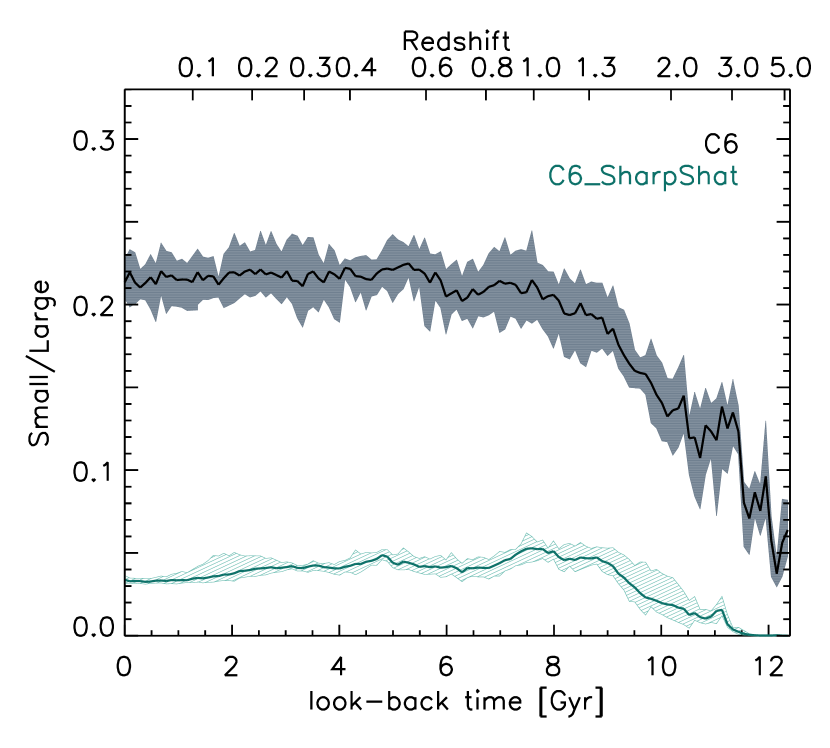
| C6_SharpShat | sharp shattering cut off | 11 |
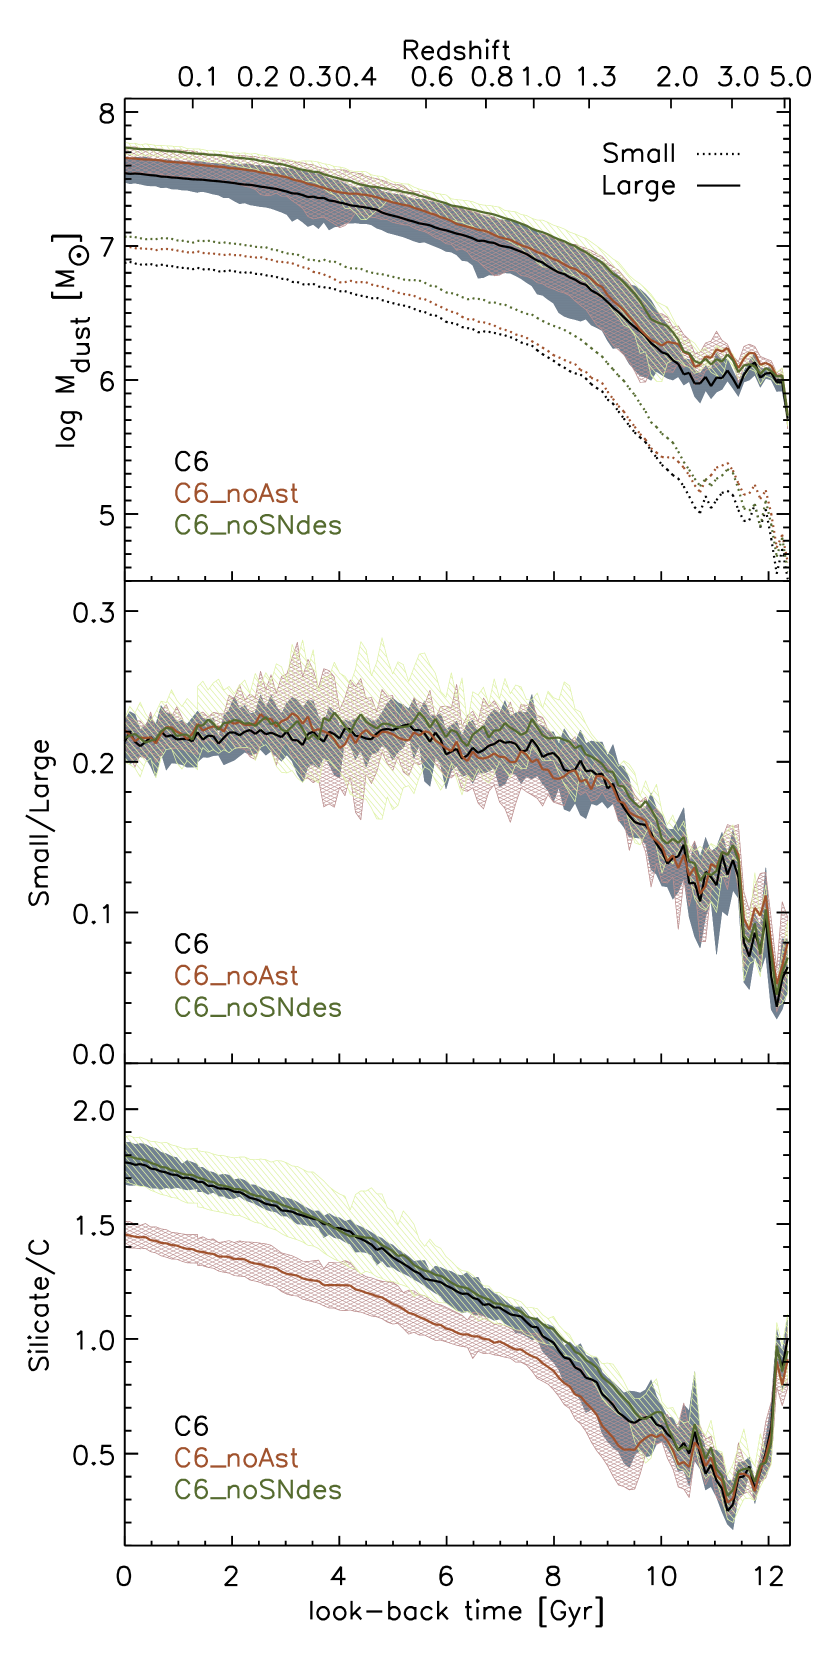
| C6_noAst | no astration | 12 |
| C6_noSNdes | no SNae destruction | 12 |
| C5 | Fiducial HR | 2, 3, 13, 14, 15 |
Unless otherwise specified, all the quantities discussed in this work refer to the central disc galaxy of the simulated box. They are computed considering the particles within 555 is the radius enclosing a sphere whose mean density is 200 times the critical density at the considered redshift. The mass of this sphere is dubbed from the main halo centre and below a maximum height of from the disc plane. is about 250 and 180 kpc at and respectively.
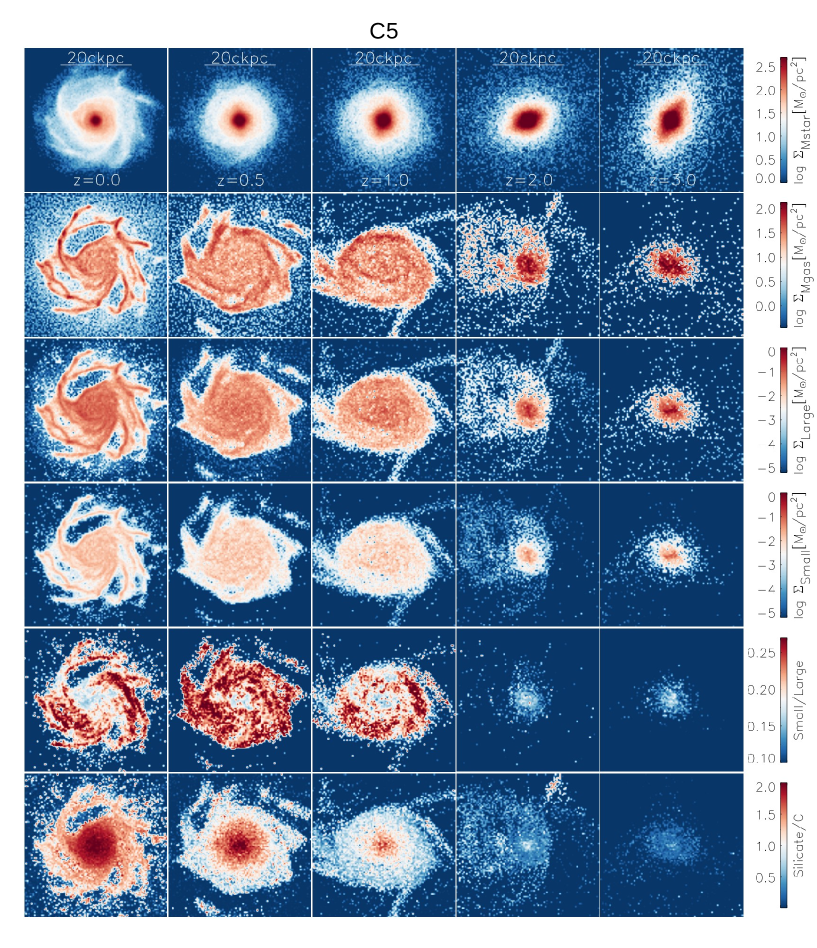
For the fiducial model, we show in Fig. 3 face-on maps for one of the six C5 (HR) simulations at various redshifts, ranging from 0 to 3. From top to bottom, maps correspond to stellar mass density, gas mass density, large and small grain mass density, Small-to-Large dust mass ratio and Silicate-to-C dust mass ratio. The time sequence of the latter two maps shows, among other things, that the small grain population grows significantly later than that of big grains, and that silicates grow later than carbon grains. Along this Section we will discuss and justify in a more quantitative way this evolution of the dust mixture. We warn the reader that the appearance of the maps varies noticeably from one realization to another (see Fig. 2).
In Figs. 4, 5, 6, 8, 9,10, 11 and 12, we show the evolution of various quantities of the simulated galaxy, under different assumptions. In each case, the lines refer to the mean evolution of the six runs we perform for each flavour, while the shaded areas in the same colour cover the whole dispersion for the same set of runs. As discussed in Section 2.4.1, multiple runs are required to cope with the butterfly effect, which could lead to misinterpretations of the impact of changing model assumptions. As a consequence, it would be extremely time consuming, and to some extent unnecessary, to conduct properly such a study at HR, that is evolving the C5 initial condition. In this case we run LR simulations, while the comparison of the fiducial setup with observations (Section 4) is performed also, and preferentially, at HR. To facilitate comparisons, our fiducial model is present in all the figures discussed in this section.
3.1 Fiducial model
In the present subsection, we concentrate on the main features of the fiducial model, while the following subsections are devoted to highlight the effects of changing some parameters or assumptions.
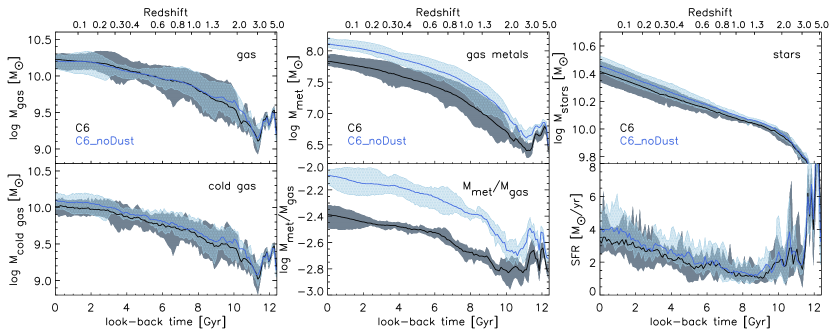
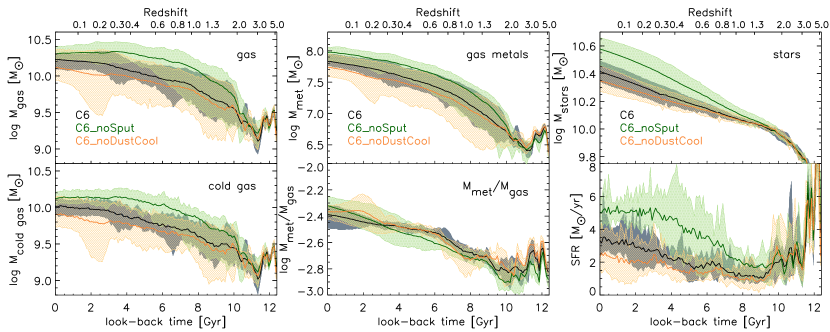
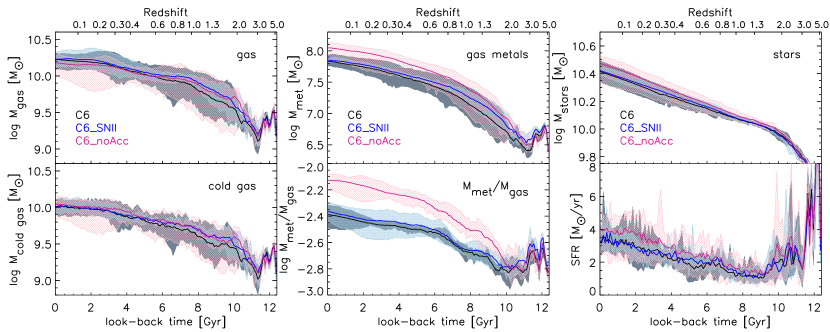
To begin with, Fig. 4 compares the evolution of various baryonic components of the fiducial runs (C6) with those of identical runs, but without dust (C6_noDust). The fiducial runs show on average a somewhat lower star formation activity for a significant portion of their history and, as a consequence, terminate with a less stellar mass. Indeed, the gas metal content666We explicitly note that by ”gas metal” we always refer to the metal content of SPH particles excluding that locked in dust grains. is significantly lower in the run including dust, mostly (but not only, see below) because an important fraction of metals are locked in grains. As a consequence, the associated metal gas cooling is less effective. This effect is only partly counterbalanced by the addition of cooling arising from grain collisions with hot gas particles. Although this latter contribution to cooling is non-negligible (Section 3.4 and Fig. 6), overall in the fiducial run less cold star forming gas is driven to the disk with respect to the run without dust C6_noDust, as can be appreciated from the bottom left panel of Fig. 4. We remark that, given that dust cooling has a very different dependence on temperature than normal metal cooling, we expect that the relative balance between the two opposite contributions (decreased metal cooling by dust depletion and dust promoted gas cooling) depends on the evolutionary history of the galaxy. We will return on the influence of dust cooling on the evolution of our simulated galaxies in Section 3.4. We also point out that the total metal content, including both gas and dust, is somewhat smaller in the fiducial model than in that without dust, ultimately due to the former’s lower stellar content.
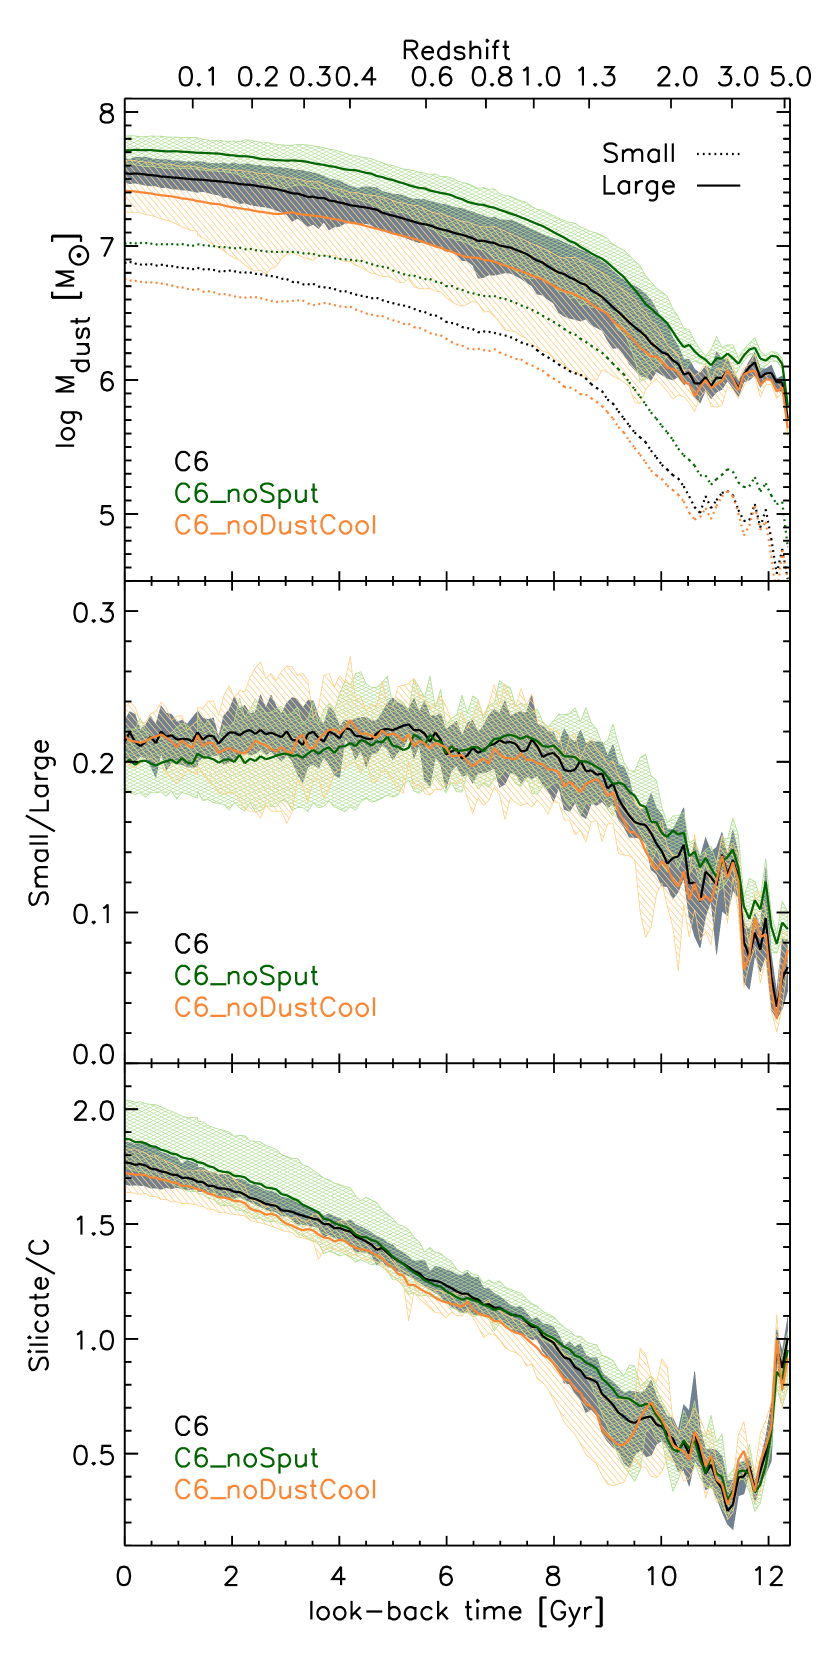
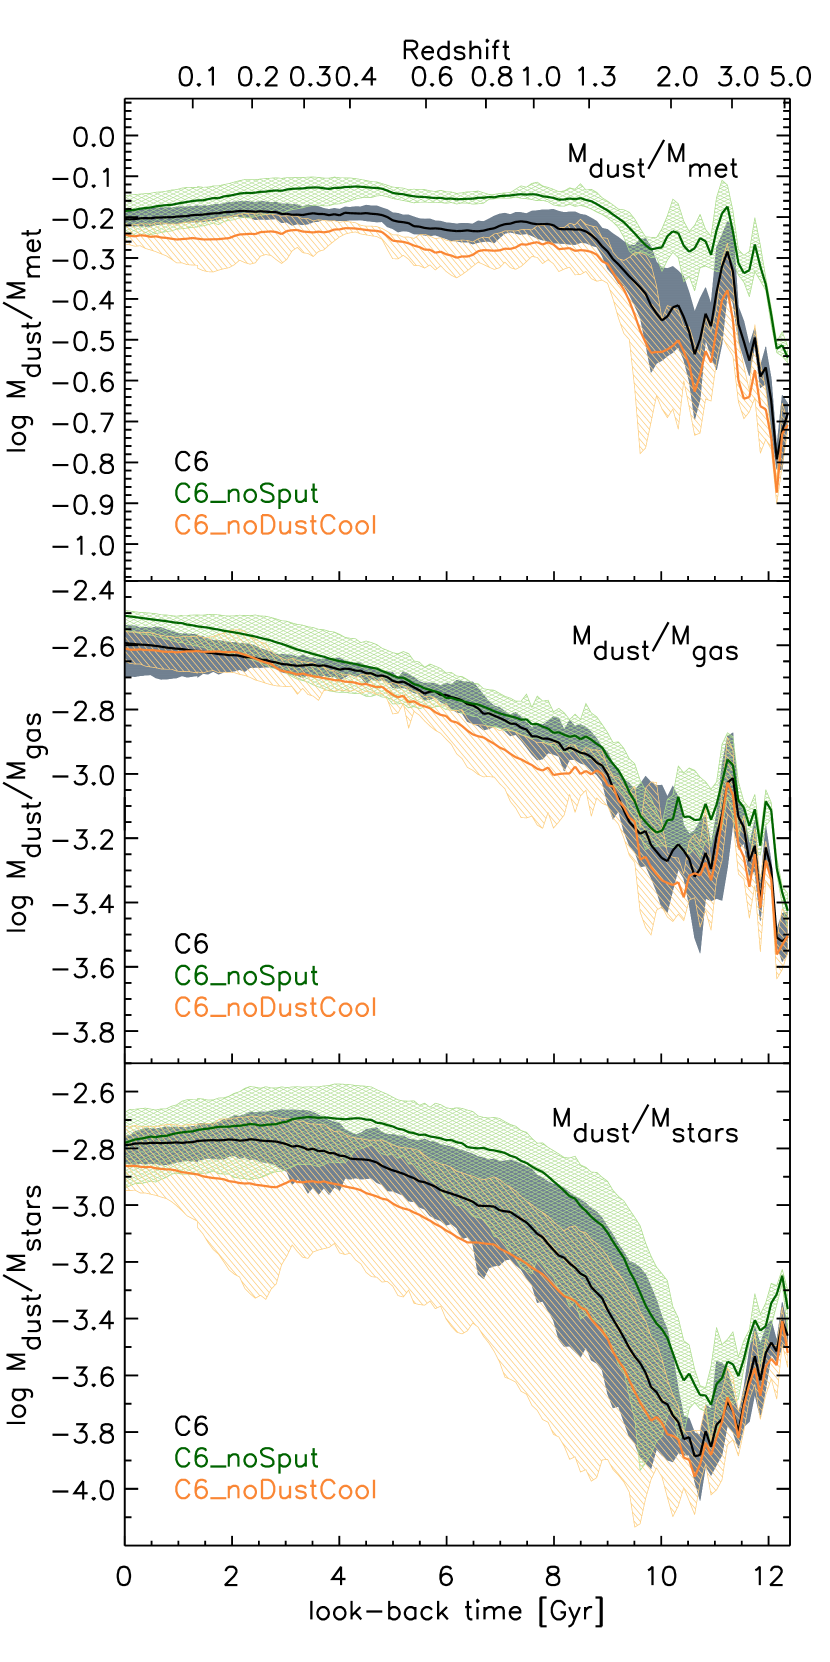
The top left panel of Fig. 5 shows the essentially steady increase of the dust mass in the galaxies. This increase parallels that of the other components of the galaxy (Fig. 6) but is generally faster, mostly due to the presence of evolutionary processes in the ISM, which tend to amplify the direct dust production from stars. In the galactic environment, constructive dust processes dominate over destructive ones. As a result, the dust over gas ratio (middle right panel in Fig. 5), after some oscillations at becomes a constantly increasing function of time, ending higher by a factor at . The dust to metal ratio (top right panel), begins with a rapid increase from the initial values, which is mostly driven by the adopted dust condensation efficiencies.
The evolution of Small/Large and that of the Silicate/Carbon dust mass ratios can be appreciated in the middle left and bottom left panel of Fig. 5 respectively. A quite reassuring result of our simulations is that the final values of these ratios are similar to those usually required by models that explain the observed properties of MW dust, which are commonly adopted in radiative transfer computations777For instance, in model 4 by Weingartner & Draine (2001) the mass ratio of small to large is about 0.21, while the mass ratio of Silicate to Carbon grains is 2.5. These values are similar in the model proposed by Silva et al. (1998) for the MW dust, adopted by default in their GRASIL code. . However, the ratios evolve substantially over cosmic time. At high redshift the relative abundance of large grains is predicted to be higher because a more substantial fraction of the dust is produced by stars. Stars are believed (and assumed in our model) to pollute the ISM with large grains. ISM evolution requires time to modify the dust distribution. At lower redshift, the ratio reaches and maintains a value very similar to the final one. By converse, the relative abundance of Silicate over C grains evolves steadily from values four times smaller than the present at . Silicate grains begin to dominate over carbon grains below . This later assembly of silicates in the galaxy is related to the fact that both for stellar dust production as well as for accretion process, they are limited by the availability of a key element (it could be Mg, Si or Fe but never O), which is significantly less abundant than C. Consequently, during the first few Gyr of the galaxy evolution, the formation of silicates is slower than that of C dust. Indeed, in the run C6AccFree, discussed in Section 3.6 and where this condition is artificially released for the accretion process, "silicates" mass is larger than that of carbon dust from the beginning, thanks to the high and early oxygen production from stars. We remind that oxygen, being produced mostly by SNII, is released into the ISM by stellar generations already a few Myr after their formation, at variance with respect to C and Fe, which are mostly contributed by AGBs and SNIa respectively. Our results differ from those by Dwek (1998) and Calura et al. (2008), who found with their one zone models that silicates dominate from the beginning of the galaxy evolution. This happens mainly because their treatment of accretion, as well as that of stellar production, does not force the grain composition to a specific compound, as our C6_AccFree run does for the former process (see Section 3.6 and Fig. 10).
3.2 On the effects of mixture variations on SEDs at early time
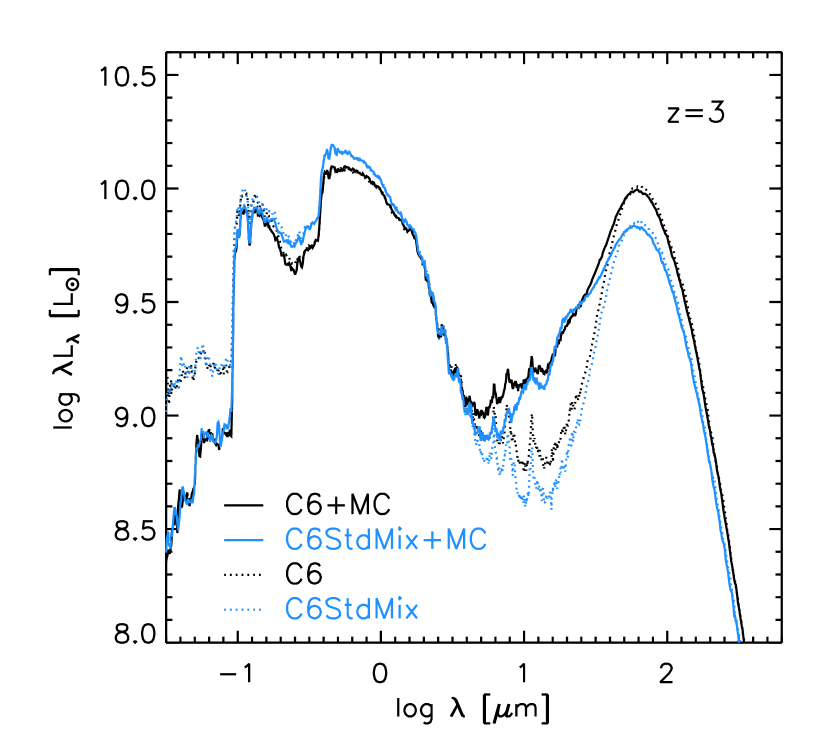
The redshift variations of dust optical properties should be taken into account when interpreting observations by means of dust reprocessing models. Some possible consequences of neglecting them can be appreciated from Fig. 7, where we show synthetic SEDs of the C6 model galaxy at computed with the public radiative transport code SKIRT888http://www.skirt.ugent.be (Camps & Baes, 2020), under different assumptions.
In one case (C6StdMix in the figure) we simply adopted a standard dust mixture, calibrated to match the average extinction and emission properties of the MW999More specifically, the standard mixture is that used so far in most GRASIL (Silva et al., 1998) and all GRASIL3D (Domínguez-Tenreiro et al., 2014) applications, to compute synthetic SED of galaxies predicted by semi-analytic models and galaxy formation simulations respectively. They both allow global variations of the mixture, albeit this feature has been seldom used due to lack of information. However, a spatial dependence on these properties, which is required here, is yet not implemented, that is (see previous Section) characterised by Sil/C and Small/Large ratios close to those predicted by our reference model at . In this case, the only information on dust derived from the simulation is the total dust content of each SPH particle. In another computation (C6 in the figure) we have instead exploited all the information on the local dust abundances for the four categories of grains we follow (graphite and silicate, small and large), by adjusting the mixture at the position of each SPH particle101010 In this case, we passed to SKIRT a superposition of four spatial distribution of dust densities, one for each of our model’s grain types. The adopted size distributions are those by Silva et al. (1998), but having 0.03 m as the limit between large and small grains. The local normalizations of the four size distributions are calculated according to the corresponding grain type density.. Let us first of all consider the SEDs obtained using only the resolved density fields information provided by the simulations, i.e. without any further attempt to model the sub-resolution geometry (see below). These are the blue and black dotted lines for the two above assumptions on the dust mixture respectively. The differences between the two cases are rather important, particularly around the far IR peak and in the mid IR regime, where the use of the standard mixture under-predicts the specific luminosity by up to . Adopting the mixture predicted by the simulation, the optical and UV stellar flux turns out to be about more absorbed, and the IR power increases correspondingly. Also, the optical and UV spectral slopes are affected.
However, none of these two SEDs can be a fair representation of the real situation, because, as it has been discussed many times in literature, stars in galaxies are affected by age dependent dust reprocessing (e.g. Silva et al., 1998; Charlot & Fall, 2000; Granato et al., 2000; Panuzzo et al., 2007; Jonsson et al., 2010; Domínguez-Tenreiro et al., 2014; Camps et al., 2016; Goz et al., 2017). Indeed, stars younger than a few Myr are still embedded or very close to their parent molecular clouds, and therefore the radiation they emit suffers much more dust reprocessing than that coming from older stars. In general, cosmological simulations of galaxy formation cannot resolve the molecular clouds (MCs) structure, and as a consequence they cannot provide to dust reprocessing codes the full spatial information required to predict the model SED realistically. To show the possible implications of the age-dependent dust reprocessing we have also computed two more cases, one for each of the two dust compositions (blue and black solid lines respectively), emulating to some extent the same method used in GRASIL and GRASIL3D to treat MCs and the associated age dependent reprocessing, with typical values for the relevant parameters adopted in their applications. Thus we have assumed that stellar particles younger than 3 Myr are in the centre of idealized spherical MCs. The additional assumption is that 5% of the galactic gas is organized in molecular clouds of mass and radius 15 pc. The two latter parameters are degenerate in the sense that different values yield the same result provided that in unchanged (see Silva et al., 1998). For simplicity, in this exploratory test we assumed for all the MCs in the galaxy the same averaged dust to gas ratio and dust composition, rather than adopting local values. The MCs turn out to be optically thick to most of the radiation emitted by young stars embedded inside them, both when we use the dust composition reproducing the average MW properties, as well as when we adopt the average dust mixture predicted by the simulated galaxy. The SED of the MC system and that produced by stars older than 3 Myr, embedded in the general resolved ISM, have been computed with SKIRT. Again the result (solid lines in the figure) highlights the substantial differences of the predicted IR SEDs with the two assumptions on the dust properties. Nevertheless, the differences introduced by the sub-resolution modelling of dust reprocessing of MCs are by far more important.
We plan to explore in detail the observational consequences of the dust properties evolution in the near future.
3.3 Sputtering
The effect of the inclusion of sputtering on the various global properties can be assessed by means of Figs. 5 and 6.
From the top left panel of Fig. 5 we notice that on average in our runs ignoring sputtering (C6_nospu, green) the galaxy always contains about 50% more dust than in the fiducial runs (C6, black). The same is true when comparing to the run adopting the canonical sputtering efficiency by Tsai & Mathews (1995) (C6_SputTsai), which we do not show in the figure, for a better readability, because it features only very minor differences from C6. On the other hand, the middle and bottom left panels of Fig. 5 show that the ratios of small over large grains, as well as that of silicate over carbon grains, are instead little affected by sputtering.
As it will be discussed also in the next Section 3.4, we point out that the higher dust mass predicted by models with lower sputtering is not just the trivial and direct consequence of its reduced efficiency under the same gas conditions (density and temperature). If that were the case, models with less sputtering would have less gas metals, whilst the opposite is true. This is due to the closely related process of hot dust cooling, which becomes more important when dust survives longer in a hot gas, increasing the gas flow toward the galaxy and in particular the availability of cool star forming gas. As a consequence also the metal and dust production from stars is enhanced. Moreover, in a more metal enriched ISM, dust accretes more. In conclusion, favoured dust survival produces further back-reaction effects that indirectly promote the presence of even more dust.
3.4 Cooling due to Dust
In this subsection we compare our fiducial model () with a model where dust cooling has been shut off (). The related figures are again Figs. 5 and 6. The latter run is characterized by a lower dust and metal content, SFR and final stellar mass. Dust cooling promotes the presence of more dust via the combination of three effects: (i) it decreases the temperature of hot gas and thus dust destruction by sputtering; the resulting larger amount of dust in hot gas tend to increase even more cooling; however this "loop" is progressively braked and stopped by the steep temperature decrease of both dust cooling and sputtering efficiency (Eqs. 18 and 16); (ii) it favours star formation (right top panel of the same figure) and therefore dust production by stars as well as (iii) metal pollution of the ISM, which increases dust growth by accretion. The inclusion of dust cooling is significant enough to enhance by the SFR in the last Gyr. The increased SFR translates into proportionally higher pollution of the ISM with metals and dust produced by the stars. As always, the SFR related increase of dust mass in the ISM wins against the slighter dust reduction due to the corresponding enhanced SNae rate and dust astration.
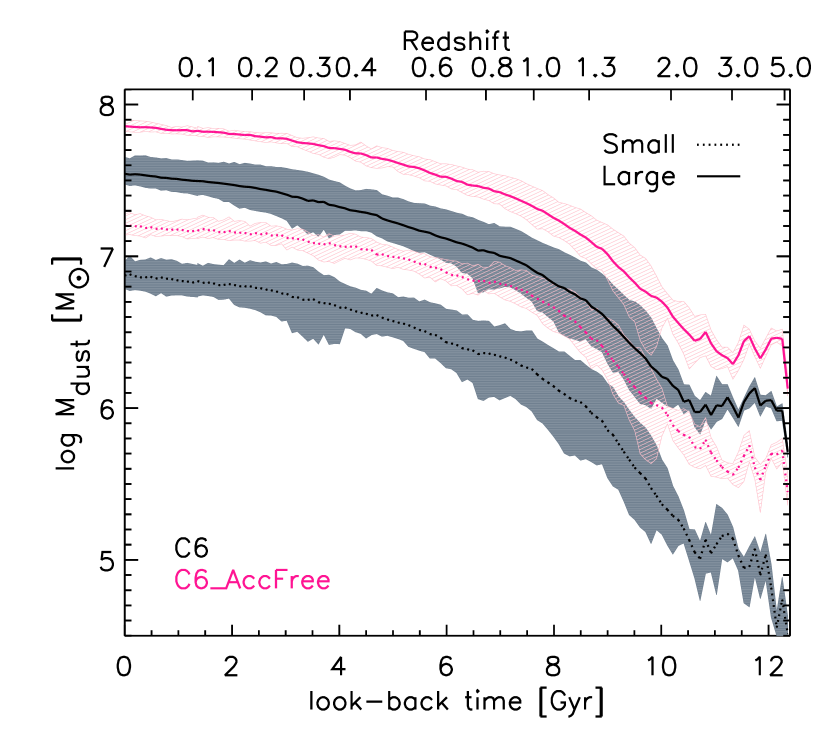
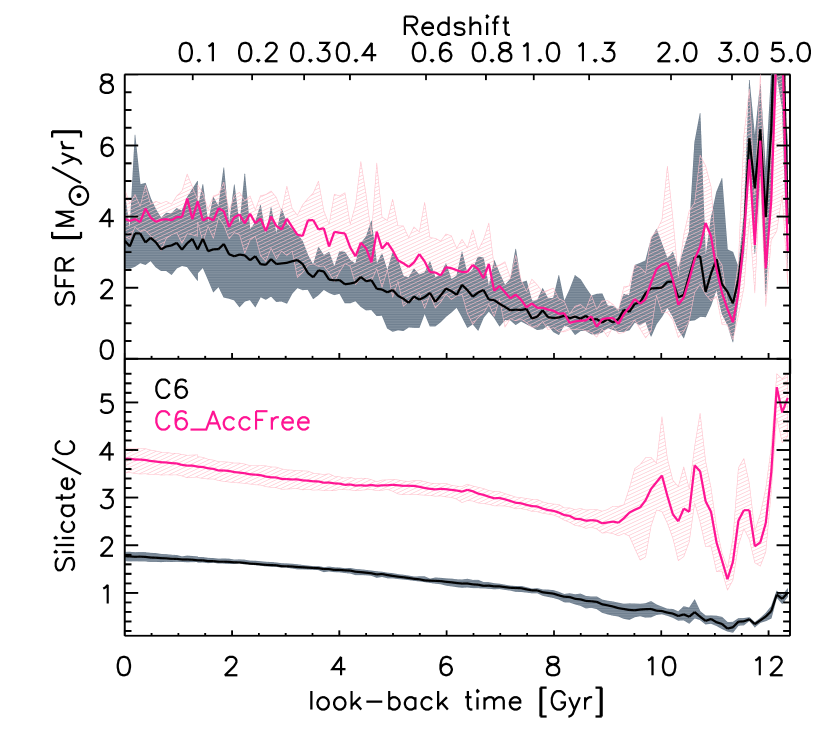
It is also worth to point out in this context the side effect of another, quite unrealistic, way of increasing the dust content, namely allowing an accretion of gas metals onto silicate dust grains not constrained by any specific proportions of Mg, Fe, Si and O. In other words, without the use of a key element, as described in Section 2.3.3. As it can be appreciated by inspecting Figure 10, the runs C6_AccFree feature on average a dust content higher by a factor than the fiducial one C6, again partly due to positive back-reaction, resulting into a significantly more active SF history. These runs will be further discussed in Section 3.6.
These findings along with those presented in Subsection 3.3, show that the two closely related processes of thermal sputtering and cooling due to dust, although often neglected in different kinds of galaxy formation computations, have a significant effect.
3.5 Dust Production by SNII only
Some previous simulations incorporating dust production, included for simplicity only the contribution of SNII (e.g. Aoyama et al., 2017; Hou et al., 2017). According to our result (compare model with the fiducial run in Figs. 8 and 9), this approximation is good enough at to predict the total dust mass. At higher redshift, it leads to an underestimate of the dust mass by up to a factor two, while the Silicate/C dust mass ratio turns out to be substantially different down to a somewhat lower redshift . In particular, the importance of AGBs in affecting the dust content at early times implies that at the fiducial simulation features a silicate over carbon dust ratio smaller by a factor , with respect to the simulation incorporating only SNII dust production. Indeed, AGB stars are essential producers of C in chemical evolution models.
The approximation of neglecting other dust production channels than SNII becomes more and more accurate at lower and lower redshift because the contribution of accretion to the total dust content increases with time, becoming dominant at . This is shown in the same Fig, 8, where we included the results of the runs in which accretion has been switched off (C6_noAcc).
3.6 Free Accretion of Metals
The run dubbed is characterized by unconstrained accretion of metals over dust particles (Section 2.3.3). In this case the accretion efficiency of each of the four elements entering into the assumed silicate composition is not regulated to maintain the same proportion as in the compound MgFeSiO4, but just by its own gas abundance. Although in the runs grains are still originally produced by stars respecting the latter composition, these runs soon feature an unrealistic and almost complete depletion () of the four elements, a too large Silicate/C dust mass ratio (Fig. 10, see footnote 7), and, as expected, a nonphysical "silicate" grain composition. Indeed, we found that during most of the evolution the number of Oxygen atoms locked up into "silicate" grains is three to four time larger than that of olivine family (MgXFe(2-X)SiO4). The effect of this approximation on the dust content and star formation have been discussed in Section 3.4.
3.7 Sharp Shattering
Depending on the relative velocity, grain-grain collisions can cause shattering (2.3.2), producing smaller grains, or coagulation (2.3.3), which yields larger ones. The typical grain velocity is in turn a function of the gas density, being significantly higher in less dense environments. Previous implementations of the two-size approximation in simulations (e.g. Aoyama et al., 2017), including that of our group for galaxy clusters (Gjergo et al., 2018), modelled for simplicity the transition between the two regimes by switching off shattering for , and turning on coagulation when . In this work, as explained in Section 2.3.2, we use instead a more gentle, and possibly somewhat more realistic, transition. As we anticipated in that section, in the context of the MUPPI sub-resolution star formation and feedback model adopted here, it turned out unfeasible to get a reasonably high abundance of small grains maintaining the sharp shattering threshold previously adopted.
Fig. 11 illustrates the importance of a smooth transition. While the dust mass in large grains (solid lines in the left panel) is insensitive to the sharp density cut-off of shattering, the mass in small grains (dotted lines) results much lower for the model than for the fiducial one, being the difference more evident at lower redshifts. As already remarked, with the present implementation we obtain low redshift values of similar to those inferred from dust reprocessing models (e.g. Silva et al., 1998; Weingartner & Draine, 2001; Relaño et al., 2020), while runs predict in the last few Gyrs unsatisfactory values .
Before adopting the smooth transition, we performed several test runs changing the efficiency of the three processes that, in principle, may affect the relative abundance of small and large grains, namely accretion, shattering and coagulation. However, the mass ratio turns out to be little affected, remaining well below 0.1 even by increasing (decreasing) the shattering (coagulation) efficiency by a factor three, or by increasing the accretion efficiency by a factor 10. Globally speaking, coagulation dominates over shattering in the galaxy, thus most of the mass acquired by small grains by accretion is transferred to large ones. However shattering never occurs at the same time as accretion and coagulation in a particle. Only by allowing large grain to shatter into small ones under less restrictive conditions, as a result of the smooth, and physically motivated, shattering cut-off, we obtained a satisfactory relative amount of small grains.
3.8 Astration versus SNae destruction
McKinnon et al. (2018) suggested that the ISM dust loss due to the formation of stars, that is the so-called astration, can be neglected in a full dust evolution model because other dust destruction mechanisms, in particular SNae destruction (Section 2.3.4), would largely dominate it. This simplification could be useful for numerical schemes like that adopted by these authors, where gas is represented by cells while specific simulation particles represent dust. By converse, with our SPH code, the implementation of the process is straightforward. To assess the absolute and relative importance of these two dust destruction mechanisms, we have run test cases switching off dust astration, meaning that SPH particles retain their full dust content when spawning new stars111111In our simulations, a gas particle can generate up to four star particles before total consumption (for details see Valentini et al., 2019). In the C6_noAst runs, the dust mass remains in the former particle for the first three generations. If this SPH particle needs to generate the fourth gas particle, it becomes a stellar particle, and its dust content is distributed to neighbouring gas particles., as well as switching off dust SNae destruction. As can be seen in Fig. 12, this test indicates that astration and SNae destruction are actually both important in our simulations, and at a comparable level. Neglecting astration or SNae destruction yields % more dust mass at . In the former case the overproduction is somewhat lower, but also the final silicate over carbon dust ratio is reduced by about 30%. We do not show the star formation histories of these two runs, because they turn out to be very similar to that of the fiducial runs. Thus the difference in dust content are dominated in both cases by the exclusion of the two dust destruction processes, with a minor role of the different stellar production of metals and dust. The difference in Silicate/C between C6_noSNdes and C6_noAst, is related to the fact that when dust grains are destroyed by SNae explosion, their metals are immediately available to be reincorporated in grains by accretion, while the same is not true when grains are astrated.
The different conclusion by McKinnon et al. (2018) can be ascribed to their more top-heavy IMF, to their smaller lower mass limit for SNII explosion ( instead of ), and to other minor differences in the parameter values adopted on their analytic estimate. Indeed, by using our values in the analytical estimate of their appendix C, the SNae destruction rate decreases by a factor , becoming comparable to, and somewhat smaller than, the astration destruction rate. In conclusion, none of the two processes can be neglected as a general rule, and their relative importance depends on assumptions concerning the stellar populations.
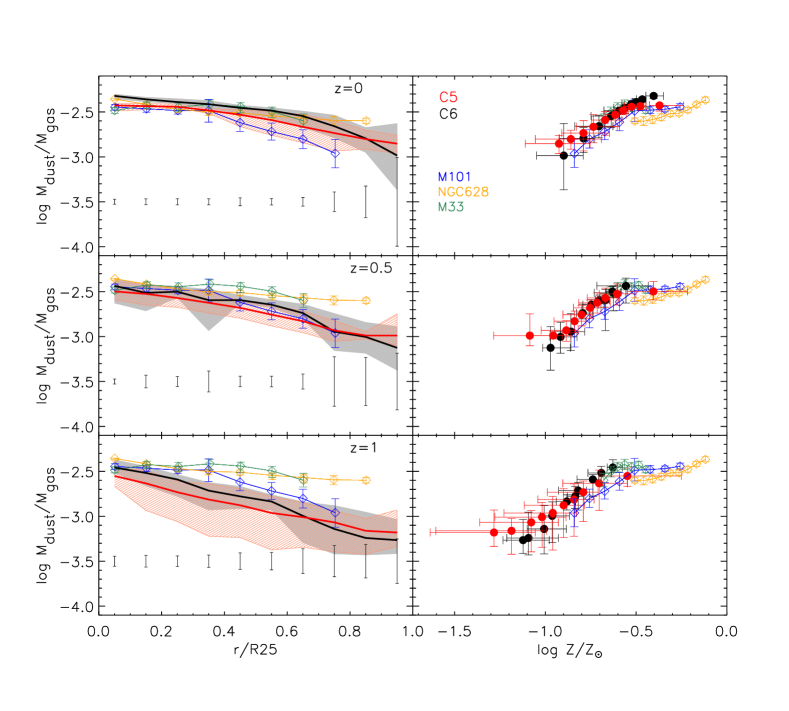
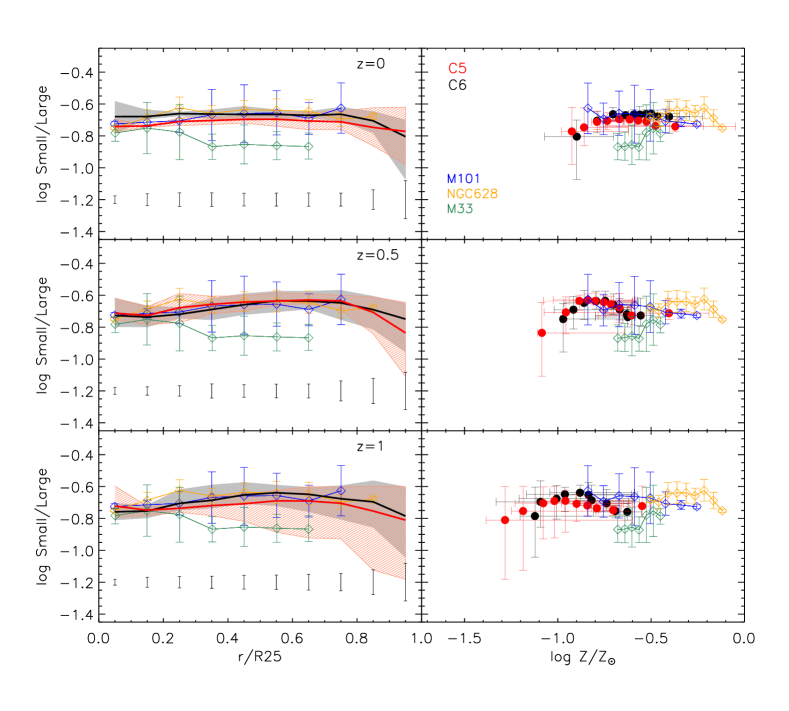
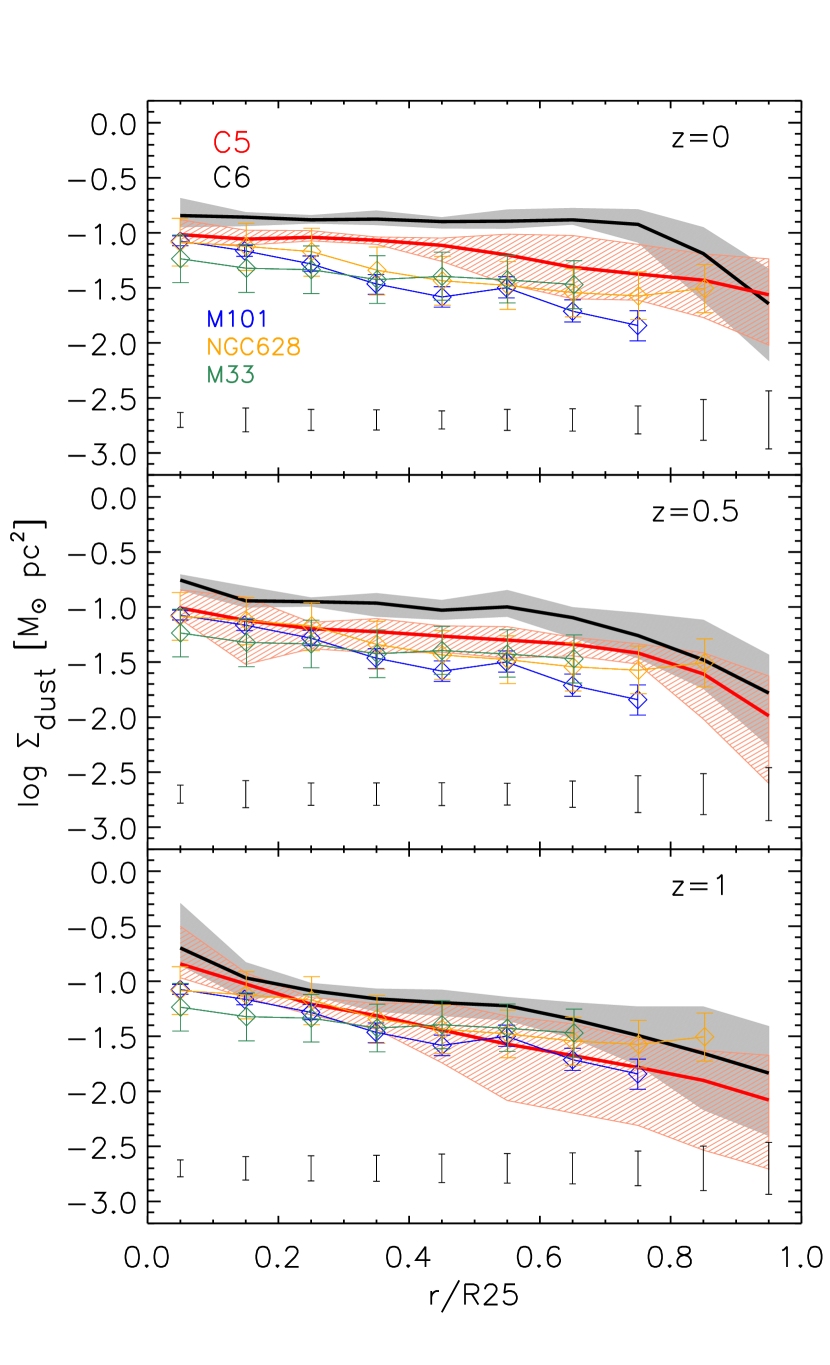
4 Results: Comparison with Observations
In the previous sections, we have seen that our fiducial low resolution run C6 produces properties of dust content in broad keeping with what is known for local disc galaxies. We devote this section to a preliminary comparison with recent information derived from resolved observations of three nearby disc galaxies by Relaño et al. (2020), to get a feeling on the generic reasonableness of our results. Interestingly these observations have been already compared, in that paper, to the simulation of an isolated disk galaxy by Aoyama et al. (2017), which includes a somewhat simpler treatment of dust processes based on the two-size approximation.
A few points should be taken into account in evaluating our data comparison. First, we evolve just one initial condition, selected mainly because it has been used often in literature, typically under the belief that it should produce as a final result an object not too dissimilar from the MW. Moreover, we made the choice of not adjusting the star formation and feedback parameters (the MUPPI model) with respect to the "best" ones selected in a previous work of our group (Valentini et al., 2019). In principle, some tuning would be required to compensate the effects of the dust related processes included now, such as the depletion of gas metals which affects the metal cooling, and the dust promoted cooling of hot gas. Finally, for the parameters related to dust modelling, we generally accepted the values suggested by previous studies of the various processes.
A related issues is numerical convergence. Scannapieco et al. (2012), compared the outcome of evolving C5 and C6 initial conditions with 13 different simulations codes, finding that numerical convergence was not good for any of them, with differences in galactic global quantities sometimes exceeding 100%. This holds true partly for our code, which implies that it is conceivable that at even higher resolution than C5 (HR) the results would change by a non-negligible amount. On the other hand, it is now widely recognized that it is in general unrealistic to pretend strict numerical convergence of simulations involving complex sub-resolution modelling, for observables that depend strongly on it (see discussion in Schaye et al., 2015). This leads to the concept of weak convergence, consisting in "convergence" provided some re-calibration of the sub-resolution model parameters is performed when resolution is changed. This task is clearly outside the scope of the present work. In this section, our reference model is C5 of Table 2, which is that adopting fiducial parameters, but applied to the higher resolution initial conditions C5. Nevertheless, to give an idea of the level of stability of the results against resolution change, without parameter re-calibration, we plot also the result for the C6-LR fiducial simulations.
In a next paper, we plan to perform a more complete comparison of our modelling with available observational constraints, evolving also different initial conditions, and to adjust the parameters to get the best possible agreement.
Relaño et al. (2020) fitted, on a pixel-by-pixel basis, near to far-IR maps of three spiral galaxies of different masses, M101, NGC628, and M33, to derive dust mass maps over the discs of these galaxies. The fit assumed optically thin dust emission, which could be inappropriate in the mid-IR regime where the emission can be substantially contributed by dense molecular clouds (e.g. Silva et al., 1998). They used the classical dust model by Desert et al. (1990), which consists of three grain populations: polycyclic aromatic hydrocarbons (PAHs), very small grains (VSGs) and big silicate grains (BGs). By identifying the first two components with the small grains and the third one with large grains of the two-size approximation, they also produced mass maps separately for small and large dust. We warn the reader that this identification should be regarded with some caution, since in the Desert et al. (1990) model the transition between VSGs and BGs occurs at 0.15 m, while that between small and large grains in the two-size approximation is at 0.03 m. Moreover, the former model adopts optical properties of graphite for VSG, while small grains in our work include also a contribution from silicates. Nevertheless, Relaño et al. (2020) compared their results with the non-cosmological SPH simulation by Aoyama et al. (2017), which implements the two-size approximation for dust evolution. Despite the aforementioned caveats, we think it is interesting to repeat the same exercise here for our model.
Figs. 13 and 14 compare the radial profile and the metallicity dependence of the dust over gas mass ratio (also named D/G), and small over large dust mass ratio Small/Large predicted by our simulations at redshift 0, 0.5 and 1, with that derived from observation of the three spiral galaxies by Relaño et al. (2020). Of course in principle the data should be compared with the model at , but we report them in the three panels mostly as a reference.
We mimicked as close as possible the procedure used by Relaño et al. (2020) to compute these profiles. We projected the simulated galaxies in a 2D grid on the disc plane, and compute the amount of gas, small grains and large grains in each pixel. This allows us to compute the G/D and Small/Large mass ratios on a pixel-by-pixel basis121212The size of our pixels are 890 pc and 500 pc for C6 and C5 respectively. The latter value is used for C5 (HR) because it is very close to the data resolution for M101 and NGC 628 (509 and 490 pc respectively), and still somewhat larger than the gravitational softening ( 445 pc). The former value used in C6 (LR) is its gravitational softening, not dramatically larger than the data resolution for these two galaxies. By converse, M33, because of its proximity, has a much better physical resolution in the data (56 pc), which is far beyond our reach.. We then build the radial profile for each simulated galaxy by computing 1/mean(G/D) and mean(Small/Large) among all pixels that fall in rings of 0.1 R25131313R25 is the radius at which the B band surface brightness falls to 25 mag arcsec-2. We estimate R25 by means of the stellar disc scale length, , using R254 (Elmegreen, 1998). In turn, is obtained by fitting an exponential function (where is the central surface density) to the stellar surface density profile of each simulated galaxy. width. The solid black and red lines in the left panels of Figs. 13 and 14 correspond to the mean profile among the 6 different realizations of C6 and C5 respectively, while the shaded areas, as always, cover the full dispersion of the corresponding 6 runs. Note however that the bars presented at the bottom of this and the various logarithmic plots represent instead the dispersion found by Relaño et al. (2020) for the pixels in each ring of distance, which they estimated as the root mean square of the quantities multiplied by the derivative of the logarithm (Relaño, private communication). We computed in the same way these dispersions for the simulations, which turn out to be quite comparable to those obtained for the data. For sake of clarity we show in the plot the mean of these dispersions computed among the six realizations of C6. Those for C5 are very similar.
The gas metallicity dependence of D/G and Small/Large mass ratios shown in the right panels of Figs. 13 and 14 are instead constructed as follows, again reproducing as much as possible the procedure used for the data. We first compute the gas (excluding dust) metallicity (Z) in each 2D pixel, namely the ratio between total gas metal per pixel and total gas mass per pixel. Then with these values we build the Z gradient for each galaxy, associating to each radial ring the mean Z of all pixels that fall within the ring141414The model gas metallicity we show considers all the gas particles in the pixels without any weight. However, since observed metallicities are obtained by means of spectroscopic observations if HII regions, we also checked that the differences introduced by considering only the multi-phase star-forming particles or weighting the ring mean by the SFR in each pixel are negligible.. At this point we have, for each radial bin, a mean value of D/G, Small/Large (in mass) and Z, which are the quantities plotted in the right hand panels of Figs. 13 and 14. Horizontal and vertical error bars in these figures cover the full dispersion of the 6 different D/G, Small/Large and Z values we obtain per radial bin.
The general agreement of the model relationships at with those inferred from observations, albeit with substantial modelling, is remarkable, both for the gradients as well as for the normalization. The agreement is better when considering the higher resolution runs C5, but the differences between C6 and C5 are moderate. As for the surface density profiles, shown in Fig. 15, they seem to be slightly overproduced particularly in the external regions by up to dex, due to a shallower gradient than the "observed" one. Our possible overproduction of dust can be likely related to the shallow increase of the SFR at in the simulated galaxy. Indeed the agreement with the surface density data is very good for the model at , where the disk structure of the model galaxy is already well developed, but before the later rise of the SF activity. This latter feature of our simulation is to some extent undesirable, with respect to the common wisdom on the star formation history of disk galaxies. It was already present in most recent MUPPI runs starting from the same initial condition but not including dust evolution (see Figure 3 in Valentini et al., 2019).
Overall our simulation compare better than that by Aoyama et al. (2017) with the observational determinations by Relaño et al. (2020). Indeed, that simulation show (a) a dust surface density profile sharply rising toward the centre (see Fig. 2 in Relaño et al., 2020); (b) to a lesser extent, also their profile of dust to gas result steeper than the observed ones (Fig. 3 in Relaño et al., 2020); (c) the dust to gas ratio as a function of metallicity is under-predicted, particularly at low (Fig. 3 in Relaño et al., 2020); (d) finally, the Small/Large grain ratio is over-predicted and shows a clear radial increase, while that inferred from observations is flat (Fig. 3 in Relaño et al., 2020). Our simulated galaxy is not affected by any of these serious problems. This could be in some sense surprising because the dust modelling by Aoyama et al. (2017) is relatively similar. However there are a few general differences that could contribute to their less satisfactory results: (i) they simulate an isolated galaxy rather than a cosmological initial condition; in particular, as remarked by Relaño et al. (2020), their initial condition produce a galaxy with a more prominent bulge than the observed ones; (ii) they do not include dust cooling nor sputtering; (iii) their treatment of chemical evolution is much less detailed, in that it includes only the SNII channel both for metal as well for dust production, adopting instant recycling approximation. Moreover it follows only the total metallicity, and not the contribution of several elements. Thus, they cannot differentiate carbon from silicate dust and they are forced to a simplified treatment of metal accretion.
5 Summary and prospects
In the context of galaxy formation simulations, we coupled a treatment of ISM dust evolution with the sub-resolution star formation and feedback model MUPPI (Murante et al., 2010, 2015; Valentini et al., 2017, 2019). The dust model includes predictions for the grain size distribution, obtained by adopting the two-size approximation (Hirashita, 2015), and their chemical composition. Thus it allows, in principle, to perform more reliable post processing computations of dust reprocessing, as briefly discussed in the Section 3.2. We have also added to the computation of gas cooling the contribution arising from collisions of plasma particles with grains, following Dwek & Werner (1981). The present paper was mostly devoted to present and discuss a suite of simulations conceived to study the role of various dust processes. Within the present framework, the galaxy dust content is dominated by direct stellar production only at relatively early times, . In contrast, at late time ISM dust processes are more important. Accretion of gas metals onto preexisting seed grains, promoted by the collisional shattering of large grains into smaller ones, becomes the primary source of dust mass. This sequence produces a significant depletion of the gas metals entering the dust composition (C, O, Mg, Fe and Si in our computations). The relatively stable equilibrium between shattering and coagulation, which occurs under different physical conditions, sets the ratio between small and large grains to values in good keeping with observational constraints.
It is remarkable that although our simulations include only a few of the possible consequences of the presence of dust in the ISM, namely dust promoted hot gas cooling and gas metal depletion, they already demonstrate the relevance of dust processes in affecting galaxy evolution. In particular, sputtering and dust cooling are all but negligible in determining the dust content of the disc galaxies, and also their star formation history. The higher dust mass predicted by models with lower sputtering efficiency is not only directly driven by the slower destruction of grains in hot plasma, but also, if not mainly, by the higher star formation resulting from a faster dust promoted cooling, occurring when more grains are present in the hot ISM.
To asses the general reasonableness of our fiducial model we compared it with spatially resolved observations of three disc galaxies. Despite the fact that we have not adjusted in any way our fiducial model, simply adopting previously selected parameter values, we found it to be in nice agreement with resolved estimates of the dust content and of the small over large grains ratios of three nearby disc galaxies (Relaño et al., 2020)
As a natural continuation of the present work, we plan to apply the modelling described here to a cosmological volume. A preliminary step will be a careful calibration of the various parameters, by means of an extensive comparison with available data. Clearly, even the parameters and assumptions pertinent to the star formation and feedback scheme MUPPI, which here we inherited from previous studies (moslty Valentini et al., 2019), need some reconsideration, since the introduction of dust processes affects the system evolution.
Simulating a cosmological box will allow to investigate in statistical sense the evolution of scaling relations involving dust in galaxies, to study how the evolution of dust properties may affect the spectral energy distribution of galaxies, as well as the properties of dust in the intergalactic medium. While these issues has been already considered by other groups, at least to some extent, (McKinnon et al., 2018; Aoyama et al., 2018; Hou et al., 2019, in the first case without dust size distribution), the results in this field depend substantially on the adopted prescriptions for the unresolved physical processes, and it is therefore necessary to investigate their robustness against different treatments.
We also plan to take advantage of the information on the dust content, as provided by our modelling, to improve the self-consistency of other aspects of the simulations. Examples include the abundance of molecular hydrogen which enters into the MUPPI star formation and feedback model, or the role of dust in influencing the gas dynamics of galactic winds by radiation pressure.
Acknowledgements
We are grateful to the referee James Trayford for carefully reading our manuscript and for providing constructive comments which substantially helped to improve the paper. We warmly thank Mónica Relaño for helping us in comparing our model with the results of her group, and Peter Camps for advice in using the radiative transfer code SKIRT. This project has received funding from the Consejo Nacional de Investigaciones Científicas y Técnicas de la República Argentina (CONICET) and from the European Union’s Horizon 2020 Research and Innovation Programme under the Marie Sklodowska-Curie grant agreement No 734374. Simulations have been carried out at the computing centre of INAF (Italia). We acknowledge the computing centre of INAF-Osservatorio Astronomico di Trieste, under the coordination of the CHIPP project (Bertocco et al., 2019; Taffoni et al., 2020), for the availability of computing resources and support. MV is supported by the Excellence Cluster ORIGINS, which is funded by the Deutsche Forschungsgemeinschaft (DFG, German Research Foundation) under Germany’s Excellence Strategy - EXC-2094 - 390783311. SB acknowledges financial support from Progetti di Rilevante Interesse Nazionale (PRIN) funded by the Minisitero della Istruzione, della Università e della Ricerca (MIUR) 2015W7KAWC, the Istituto Nazionale di Fisica Nucleare (INFN) InDark grant. LS acknowledges the support from grant PRINMIUR 2017 - 20173ML3WW_001.
Data Availability
The data used for this article will be shared on reasonable request to the corresponding author.
References
- Aoyama et al. (2017) Aoyama S., Hou K.-C., Shimizu I., Hirashita H., Todoroki K., Choi J.-H., Nagamine K., 2017, MNRAS, 466, 105
- Aoyama et al. (2018) Aoyama S., Hou K.-C., Hirashita H., Nagamine K., Shimizu I., 2018, MNRAS, 478, 4905
- Aoyama et al. (2019) Aoyama S., et al., 2019, MNRAS, 484, 1852
- Aoyama et al. (2020) Aoyama S., Hirashita H., Nagamine K., 2020, MNRAS, 491, 3844
- Asano et al. (2013) Asano R. S., Takeuchi T. T., Hirashita H., Nozawa T., 2013, MNRAS, 432, 637
- Beck et al. (2016) Beck A. M., et al., 2016, MNRAS, 455, 2110
- Bekki (2013) Bekki K., 2013, MNRAS, 432, 2298
- Bertocco et al. (2019) Bertocco S., et al., 2019, arXiv e-prints, p. arXiv:1912.05340
- Bianchi & Schneider (2007) Bianchi S., Schneider R., 2007, MNRAS, 378, 973
- Blitz & Rosolowsky (2006) Blitz L., Rosolowsky E., 2006, ApJ, 650, 933
- Burke & Silk (1974) Burke J. R., Silk J., 1974, ApJ, 190, 1
- Calura et al. (2008) Calura F., Pipino A., Matteucci F., 2008, A&A, 479, 669
- Camps & Baes (2020) Camps P., Baes M., 2020, Astronomy and Computing, 31, 100381
- Camps et al. (2016) Camps P., Trayford J. W., Baes M., Theuns T., Schaller M., Schaye J., 2016, MNRAS, 462, 1057
- Charlot & Fall (2000) Charlot S., Fall S. M., 2000, ApJ, 539, 718
- Davies et al. (2020) Davies J. J., Crain R. A., Pontzen A., 2020, arXiv e-prints, p. arXiv:2006.13221
- Desert et al. (1990) Desert F. X., Boulanger F., Puget J. L., 1990, A&A, 500, 313
- Domínguez-Tenreiro et al. (2014) Domínguez-Tenreiro R., Obreja A., Granato G. L., Schurer A., Alpresa P., Silva L., Brook C. B., Serna A., 2014, MNRAS, 439, 3868
- Draine (2003) Draine B. T., 2003, ARA&A, 41, 241
- Draine & Salpeter (1979) Draine B. T., Salpeter E. E., 1979, ApJ, 231, 438
- Dwek (1998) Dwek E., 1998, ApJ, 501, 643
- Dwek & Werner (1981) Dwek E., Werner M. W., 1981, ApJ, 248, 138
- Elmegreen (1998) Elmegreen D. M., 1998, Galaxies and galactic structure
- Feldmann (2015) Feldmann R., 2015, MNRAS, 449, 3274
- Genel et al. (2019) Genel S., et al., 2019, ApJ, 871, 21
- Gioannini et al. (2017) Gioannini L., Matteucci F., Vladilo G., Calura F., 2017, MNRAS, 464, 985
- Gjergo et al. (2018) Gjergo E., Granato G. L., Murante G., Ragone-Figueroa C., Tornatore L., Borgani S., 2018, MNRAS, 479, 2588
- Goz et al. (2017) Goz D., Monaco P., Granato G. L., Murante G., Domínguez-Tenreiro R., Obreja A., Annunziatella M., Tescari E., 2017, MNRAS, 469, 3775
- Granato et al. (2000) Granato G. L., Lacey C. G., Silva L., Bressan A., Baugh C. M., Cole S., Frenk C. S., 2000, ApJ, 542, 710
- Granato et al. (2004) Granato G. L., De Zotti G., Silva L., Bressan A., Danese L., 2004, ApJ, 600, 580
- Graziani et al. (2020) Graziani L., Schneider R., Ginolfi M., Hunt L. K., Maio U., Glatzle M., Ciardi B., 2020, MNRAS, 494, 1071
- Hirashita (1999) Hirashita H., 1999, ApJ, 510, L99
- Hirashita (2015) Hirashita H., 2015, MNRAS, 447, 2937
- Hirashita & Aoyama (2019) Hirashita H., Aoyama S., 2019, MNRAS, 482, 2555
- Hirashita & Kuo (2011) Hirashita H., Kuo T.-M., 2011, MNRAS, 416, 1340
- Hirashita & Voshchinnikov (2014) Hirashita H., Voshchinnikov N. V., 2014, MNRAS, 437, 1636
- Hirashita & Yan (2009) Hirashita H., Yan H., 2009, MNRAS, 394, 1061
- Hou et al. (2017) Hou K.-C., Hirashita H., Nagamine K., Aoyama S., Shimizu I., 2017, MNRAS, 469, 870
- Hou et al. (2019) Hou K.-C., Aoyama S., Hirashita H., Nagamine K., Shimizu I., 2019, MNRAS, 485, 1727
- Jenkins (2009) Jenkins E. B., 2009, ApJ, 700, 1299
- Jonsson et al. (2010) Jonsson P., Groves B. A., Cox T. J., 2010, MNRAS, 403, 17
- Keller et al. (2019) Keller B. W., Wadsley J. W., Wang L., Kruijssen J. M. D., 2019, MNRAS, 482, 2244
- Kroupa et al. (1993) Kroupa P., Tout C. A., Gilmore G., 1993, MNRAS, 262, 545
- Li et al. (2019) Li Q., Narayanan D., Davé R., 2019, MNRAS, 490, 1425
- Mattsson (2016) Mattsson L., 2016, Planet. Space Sci., 133, 107
- McKee (1989) McKee C., 1989, in Allamandola L. J., Tielens A. G. G. M., eds, IAU Symposium Vol. 135, Interstellar Dust. p. 431
- McKee et al. (1987) McKee C. F., Hollenbach D. J., Seab G. C., Tielens A. G. G. M., 1987, ApJ, 318, 674
- McKinnon et al. (2016) McKinnon R., Torrey P., Vogelsberger M., 2016, MNRAS, 457, 3775
- McKinnon et al. (2017) McKinnon R., Torrey P., Vogelsberger M., Hayward C. C., Marinacci F., 2017, MNRAS, 468, 1505
- McKinnon et al. (2018) McKinnon R., Vogelsberger M., Torrey P., Marinacci F., Kannan R., 2018, MNRAS, 478, 2851
- Montier & Giard (2004) Montier L. A., Giard M., 2004, A&A, 417, 401
- Murante et al. (2010) Murante G., Monaco P., Giovalli M., Borgani S., Diaferio A., 2010, MNRAS, 405, 1491
- Murante et al. (2015) Murante G., Monaco P., Borgani S., Tornatore L., Dolag K., Goz D., 2015, MNRAS, 447, 178
- Murray et al. (2005) Murray N., Quataert E., Thompson T. A., 2005, ApJ, 618, 569
- Nozawa et al. (2007) Nozawa T., Kozasa T., Habe A., Dwek E., Umeda H., Tominaga N., Maeda K., Nomoto K., 2007, ApJ, 666, 955
- Oh et al. (2020) Oh B. K., Smith B. D., Peacock J. A., Khochfar S., 2020, MNRAS, 497, 5203
- Osman et al. (2020) Osman O., Bekki K., Cortese L., 2020, arXiv e-prints, p. arXiv:2009.08051
- Panuzzo et al. (2007) Panuzzo P., Granato G. L., Buat V., Inoue A. K., Silva L., Iglesias-Páramo J., Bressan A., 2007, MNRAS, 375, 640
- Planck Collaboration (XLIII) et al. (2016) Planck Collaboration (XLIII) et al., 2016, A&A, 596, A104
- Popping et al. (2017) Popping G., Somerville R. S., Galametz M., 2017, MNRAS, 471, 3152
- Relaño et al. (2020) Relaño M., Lisenfeld U., Hou K. C., De Looze I., Vílchez J. M., Kennicutt R. C., 2020, A&A, 636, A18
- Scannapieco et al. (2012) Scannapieco C., et al., 2012, MNRAS, 423, 1726
- Schaye et al. (2015) Schaye J., et al., 2015, MNRAS, 446, 521
- Schneider et al. (2014) Schneider R., Valiante R., Ventura P., dell’Agli F., Di Criscienzo M., Hirashita H., Kemper F., 2014, MNRAS, 442, 1440
- Silva et al. (1998) Silva L., Granato G. L., Bressan A., Danese L., 1998, ApJ, 509, 103
- Springel (2005) Springel V., 2005, MNRAS, 364, 1105
- Springel & Hernquist (2003) Springel V., Hernquist L., 2003, MNRAS, 339, 289
- Springel et al. (2008) Springel V., et al., 2008, MNRAS, 391, 1685
- Sumpter & Van Loo (2020) Sumpter R., Van Loo S., 2020, MNRAS, 494, 2147
- Taffoni et al. (2020) Taffoni G., Becciani U., Garilli B., Maggio G., Pasian F., Umana G., Smareglia R., Vitello F., 2020, arXiv e-prints, p. arXiv:2002.01283
- Tielens et al. (1994) Tielens A. G. G. M., McKee C. F., Seab C. G., Hollenbach D. J., 1994, ApJ, 431, 321
- Tornatore et al. (2007) Tornatore L., Borgani S., Dolag K., Matteucci F., 2007, MNRAS, 382, 1050
- Triani et al. (2020) Triani D. P., Sinha M., Croton D. J., Pacifici C., Dwek E., 2020, MNRAS, 493, 2490
- Tsai & Mathews (1995) Tsai J. C., Mathews W. G., 1995, ApJ, 448, 84
- Valentini & Brighenti (2015) Valentini M., Brighenti F., 2015, MNRAS, 448, 1979
- Valentini et al. (2017) Valentini M., Murante G., Borgani S., Monaco P., Bressan A., Beck A. M., 2017, MNRAS, 470, 3167
- Valentini et al. (2019) Valentini M., Borgani S., Bressan A., Murante G., Tornatore L., Monaco P., 2019, MNRAS, 485, 1384
- Valiante et al. (2011) Valiante R., Schneider R., Salvadori S., Bianchi S., 2011, MNRAS, 416, 1916
- Vijayan et al. (2019) Vijayan A. P., Clay S. J., Thomas P. A., Yates R. M., Wilkins S. M., Henriques B. M., 2019, MNRAS, 489, 4072
- Vogelsberger et al. (2019) Vogelsberger M., McKinnon R., O’Neil S., Marinacci F., Torrey P., Kannan R., 2019, MNRAS, 487, 4870
- Wakelam et al. (2017) Wakelam V., et al., 2017, Molecular Astrophysics, 9, 1
- Weingartner & Draine (2001) Weingartner J. C., Draine B. T., 2001, ApJ, 548, 296
- Yan et al. (2004) Yan H., Lazarian A., Draine B. T., 2004, ApJ, 616, 895
- Zhukovska et al. (2008) Zhukovska S., Gail H.-P., Trieloff M., 2008, A&A, 479, 453
- Zhukovska et al. (2016) Zhukovska S., Dobbs C., Jenkins E. B., Klessen R. S., 2016, ApJ, 831, 147