Thermoelectricity of Tin Selenide Monolayers Across a Structural Phase Transition
Abstract
SnSe monolayers experience a temperature induced two-dimensional Pnm2 P4/nmm structural transformation precipitated by the softening of vibrational modes. The standard theoretical treatment of thermoelectricity—which relies on a zero temperature phonon dispersion and on a zero temperature electronic structure—is incapable of describing thermoelectric phenomena induced by structural transformations. Relying on structural data obtained from ab initio molecular dynamics calculations that is utilized in a non-standard way to inform of electronic and vibrational transport coefficients, the present work establishes a general route to understand thermoelectricity across phase transitions. Similar to recent experimental observations pointing to an overestimated thermoelectric figure of merit past the transition temperature, our work indicates a smaller when compared to its value predicted by the standard paradigm. Its decrease is related to the dramatic changes in the electrical conductivity and lattice thermal conductivity as the structural transformation ensues. Though exemplified on a SnSe monolayer, the method does not have any built-in assumptions concerning dimensionality, and thus applicable to arbitrary thermoelectric materials in one, two, and three dimensions.
today
I Introduction
According to the U.S. National Academies, energy supply is one of the greatest challenges of the century, and energy diversification is needed.[1] Thermoelectric materials are candidates for such diversification. Nevertheless and despite its longevity, thermoelectricity theory has clear mandates for improvement. For instance, Mingo and coworkers indicate in their Perspective Review of ab initio phonon thermal transport that higher order phonon scattering is desirable within thermoelectric frameworks, and that such scattering could in principle be obtained from ab initio molecular dynamics.[2] Furthermore, another recent review on thermoelectricity by Snyder and coworkers clearly states that: “our models and current understanding break down as conditions deviate from an idealized, static system, for example, at temperatures above absolute zero,” and that “finding ways to move beyond our current reliance on the ground state electronic and phonon band structures … will be key to future progress in this area”[3] (emphasis ours). This work fills that void by establishing a formalism whereby finite-temperature electronic and vibrational behavior inform thermoelectric properties. The methodology introduced in the present work was inspired by and directly responds to vocal needs recently expressed from leaders within the thermoelectric community. Given that this new methodology has immediate consequences for the design of thermoelectric materials, it is of interest to the broader materials community.
As a critical example underlying the importance of the present results, bulk SnSe has been argued to display an extremely large thermoelectric figure of merit at high temperature near to its Pnma Cmcm structural transformation,[4, 5, 6] and multiple theoretical works based on the preponderant ab initio methodologies[7, 8, 9] have supported and even provided the rationale for these experimental claims (see e.g., [10, 11, 12] among multiple others). Nevertheless, the existence of such a high has been put in doubt in recent detailed experimental work.[13, 14] In a nutshell, the issue at hand is a serious underestimation of the lattice thermal conductivity at the onset of the structural transition in previous (experimental and theoretical) work.
Grown on a graphitic substrate, single layers of SnSe have just been experimentally realized.[15] And while bulk SnSe undergoes a phase transition at temperatures as high as 900 K,[16] these SnSe monolayers on graphite display a lower critical temperature, closer to 400 K.[15] Due to the high expense of performing ab initio molecular dynamics of SnSe on graphite on samples of experimentally-relevant sizes, most theoretical work on these monolayers is carried out on freestanding samples. SnSe monolayers (as a prototypical example of isostructural group-IV monochalcogenide monolayers) are intriguing materials on their own:[17] They are structurally-stable binary semiconductors with an intrinsic in-plane electric dipole moment[18, 19] in their ground-state Pnm21 structural configuration.[20, 21] Additional studies concerning electronic valleys,[21, 22, 23] optical properties,[24, 25, 26] and even thermoelectric properties[27, 28] have been reported, all in reference to ground state atomistic structures with a Pnm21 group symmetry.
An incipient study by Wang and coworkers [20] of the thermoelectric properties of freestanding SnSe monolayers contains the following standard elements from ab initio thermoelectricity theory: they found electronic transport coefficients by solving for the semiclassical Boltzmann equation within the relaxation time approximation, as implemented in the BoltzTraP program.[7, 8] Lattice thermal conductivity and phonon lifetimes were obtained using Mingo and coworkers’ ShengBTE code.[9] Their calculation of vibrational properties included up to third-order interatomic force constants.Furthermore, and consistent with standard methods,[2, 3] the unit cell considered for the calculation of electronic and vibrational transport coefficients possessed a Pm21n symmetry (or Pnm21 with our choice of principal axes), and it is determined at zero temperature. These calculations were carried out with the PBE exchange-correlation functional.[29] They acknowledge the following points concerning the structural transition of SnSe: (a) bulk SnSe undergoes a phase transition at around 750-800 K ( is actually higher[16]); (b) the single-layered SnSe sheet may also experience a phase transition upon heating; (c) “the phase transition is beyond the scope of our work;” and (d) thermoelectric properties are determined at the (“medium-high”) 300-700 K range.[20] Two crucial questions left unanswered in their work are the magnitude of the critical temperature in a SnSe monolayer, and the effect of the structural transition on thermoelectric properties. Clearly, answering these questions has consequences for the theoretical treatment of arbitrary thermoelectric materials undergoing a phase transition.
After the work by Wang et al.,[20] we have developed a detailed understanding of the structural transition undergone by SnSe monolayers.[30, 31, 32, 33, 34, 17] These are its main points: (a) Distances among second and third nearest neighbors turn equal () for temperatures above ( and were reported, but was not). (b) The critical temperature depends on the ensemble being utilized (NVT—in which the volume remains fixed—versus NPT—in which pressure remains fixed): is larger when using the NVT ensemble. Additionally, the phases above are Pnmm when using the NVT ensemble, and P4/nmm when the NPT ensemple is employed.[34] (c) also depends on the exchange-correlation functional employed.[33, 34]
Taking the choices from Wang and coworkers (an NVT ensemble and the PBE exchange-correlation functional), a SnSe monolayer transitions from the low-temperature Pnm21 phase onto a Pnmm phase at K,[34] which lies right at the lower end in the temperature range they considered.[20] Since they did not determine , no mention of the Pnmm phase can be found in their work. This fact shows that their thermoelectric coefficients at all temperatures were obtained using standard methods, which require the unit cell to be the zero-temperature one with a Pnm21 symmetry, as they themselves state. In short, their study stayed short of linking finite temperature atomistic and electronic structure to thermoelectric properties.
Further, structural transformations are driven by the softening optical phonon modes,[34] which can be hardly accounted for with the standard perturbative approach. This fact is acknowledged by the creators of state-of-the-art tools for the ab initio treatment of thermoelectricity themselves.[2]. Any approach to vibrational properties that is not perturbative—like the one to be laid out here—is not standard and is sought after within thermoelectricity theory.[2]
The thermoelectric figure of merit is defined as:[7, 3]
| (1) |
where is the electrical conductivity, is the Seebeck coefficient, is the temperature, is the electronic contribution to the thermal conductivity, and is the lattice thermal conductivity. We calculate the thermoelectric figure of merit across the 2D structural phase transition, something not yet done by theoretical calculations which had previously utilized the zero temperature structure in a temperature range which could not capture the transformation. The factors entering into are calculated with reference to structural data at finite temperature, representing a crucial departure from the common reliance on ground state electronic and phonon band structures. With this new formalism, one observes a sudden increase in the electronic conductivity and in the electronic and lattice contributions to the thermal conductivity, happening at temperatures driving the structural transformation.[32, 34] The theoretical examination of the lattice thermal conductivity accounts for phonon anharmonicity non-perturbatively throughout the structural transformation. decreases substantially near the onset of the structural transformation, suggesting that the standard methods for calculating thermoelectric properties have and will overestimate when they ignore structural transformations in systems with significant anharmonicity. These theoretical results are in agreement with recent experimental results questioning record high values of on materials undergoing structural phase transitions.[13, 14] Though exemplified on a 2D ferroelectric, the process applies to any material undergoing solid-to-solid structural transformations and may be applied to 1D and 3D materials as well.
II Results and discussion
II.1 Thermally-driven structural transformation of a SnSe monolayer
We use finite temperature structural data obtained from molecular dynamics calculations to determine all of the factors contributing to . These structural transformations have been studied by means of ab initio molecular dynamics calculations within the isobaric-isothermal (NPT) ensemble,[32, 34] and the data in this study was obtained on a 1616 SnSe monolayer supercell containing 1024 atoms with a 1.5 fs time resolution for about 28,000 fs, and for more than ten temperatures (in contrast to previous molecular dynamics calculations using 64 atoms, and running for 10,000 fs at five different temperatures[20]; see Methods).
As previously indicated,[32, 34] the magnitude of depends on structural constraints. Imposing a constant volume is inconsistent with previous results on these transformations,[19] which support a transformation with a change in area.[32] The NPT ensemble is, on the other hand, consistent with a transition with a change in area and has been chosen in this study for that reason. Furthermore, the dependency of thermoelectric coefficients on the exchange-correlation functional has been acknowledged,[2] and the lone pairs on SnSe monolayers call for a treatment of the electronic structure beyond PBE; a detailed discussion has been given elsewhere.[33] The vdW-DF-cx van der Waals exchange-correlation functional is employed here for that reason.[35, 36]
Figure 1(a) displays the average lattice parameters and of a freestanding SnSe monolayer as a function of temperature. A fit of critical exponents yields K.[32] At temperatures equal or above , the SnSe monolayer turns paraelectric, which implies that the unit cell develops two mirror planes and a four-fold symmetry consistent with a P4/nmm phase above . As indicated before, 400 K in experiments of SnSe monolayers on a graphitic substrate.[15] The higher observed in experiment is attributed to the interaction of the SnSe monolayer with its supporting substrate. In any event, Figure1(a), experiment, and the fact that the standard thermoelectric theory relies on zero-temperature structural data all demonstrate that an incorrect atomistic symmetry (Pnm21) has been previously employed to determine the thermoelectric properties of a SnSe monolayer within the reported 300-700 K temperature range.[20, 27, 28] The improper use of the zero-temperature atomistic structure should lead to striking discrepancies with experiment. The signature of the structural transition is the confluence of the in-plane lattice parameters at a critical temperature K that is determined from a critical exponent fit.[32] The appropriate and consistent use of finite-temperature information to determine the full thermoelectric properties is delineated next. No such comprehensive and novel development exists within the literature.
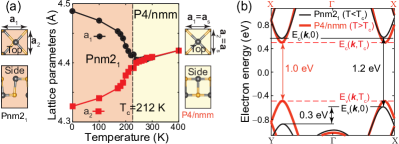
II.2 Thermal evolution of the electronic structure
As seen in Figure 1(b), structural changes modify the electronic structure. The band structure shown in black corresponds to the Pnm21 atomistic structure at zero temperature; i.e., to the electronic structure employed at all temperatures (300 to 700 K) in works that rely on the standard formalism.[20, 27, 28] Those works use a band structure that no longer corresponds with the atomistic structure above 212 K on a freestanding SnSe monolayer,[32] or above 400 K for a SnSe monolayer on a graphitic substrate.[15] The electronic band structure shown in red in Figure 1(b) corresponds to the average atomistic structure of the freestanding SnSe monolayer above 212 K. There, the two hole valleys turn degenerate due to the enhanced tetragonal symmetry of the P4/nmm symmetry group. The continuous structural transformation results in a continuous change in the electronic band structure, which in Figure 1(b), smoothly evolves with temperature from the one shown in black at K into the one shown in red at temperatures larger than . In what follows, the electronic band structure is labeled , where is the band index ( for valence and for conduction band, respectively), in order to emphasize its direct dependence in temperature through the use of the average unit cell in our molecular dynamics calculations at finite temperature. It is important to note that we abandon the rigid band approximation by using the proper temperature dependent electronic structure rather than relying on the zero temperature band structure at this stage.
II.3 Electronic contributors to the thermoelectric figure of merit
Knowing the effect of temperature on lattice parameters and on the electronic structure , one can calculate the electrical conductivity tensor:[3]
| (2) |
where and represent cartesian coordinates, is the electron charge, and is the reduced Planck constant. is the temperature dependent volume of the unit cell, is the electron relaxation time, is the band group velocity, and is the Fermi-Dirac distribution at chemical potential . The temperature dependence of in the standard ab initio approach to thermoelectricity only enters through and . Here, on the other hand, electron group velocities and the unit cell area are made temperature-dependent by the use of finite-temperature structural data. Although the electron relaxation time may also be temperature dependent, a temperature-independent magnitude of is assigned (comparable to for a 1 eV band width with the Planck constant) in accordance within previous estimates.[20, 37, 10, 38, 28] Equation 2 takes a sum over all bands, but the derivative of the Fermi-Dirac distribution selects contributions from bands having energies near the chemical potential . Every Equation shown here takes appropriate care of dimensionality implicitly, and this general approach can be applied unchanged to arbitrary materials undergoing phase transitions, hence its importance.
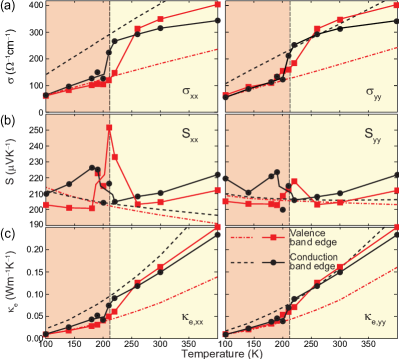
Figure 2(a) showcases in dashed (dashed-dotted) lines the electron (hole) conductivity with set exactly at the conduction (valence) band edge using a zero-temperature volume and zero-temperature electronic structure to compare the prediction from this new method with the standard paradigm. As may be expected, the temperature dependent method, shown by solid lines and red squares (black circles) for set at the valence (conduction) band edge, tracks closely with the standard paradigm before the structural transformation. But there is a marked increase in the electrical conductivity at as the valence and conduction bands align with the increased symmetry above , and it reflects the enhanced symmetry for temperatures above . For , the standard paradigm predicts greater electron conductivity as compared to hole conductivity, but the temperature dependent formalism indicates the opposite trend for K.
The next term in the numerator of Equation 1 is the Seebeck coefficient which is obtained by dividing the following expression
| (3) |
by Equation 2. , as depicted in Figure 2(b), was computed with set at either the valence or conduction band edges. As was the case for , is asymmetric in the usual formalism above (after the system has actually acquired four-fold symmetry), failing to acknowledge the structural phase transition. also exhibits a peak at for and a subdued peak for . When contrasted with the temperature evolution of , the Seebeck coefficient is otherwise roughly constant over the temperature range investigated, and the finite temperature estimates at over 200 µV K-1 are comparable to those obtained within the standard paradigm.
The denominator in Equation 1 contains the electrical and lattice contributions to the thermal conductivity, and , respectively. The electronic contribution to the thermal conductivity has two terms,
| (4) |
with the first contribution being
| (5) |
and the second term expressible from Equations 2 and 3. (Figure 2(c)) displays a trend similar to the one observed for the electrical conductivity in Figure 2(a). The most dramatic discrepancy between the present method and the previous one occurs for the valence band, given that there is a 0.3 eV shift to bring the hole pockets to the same energy beyond which is completely ignored by the usual rigid band approximation. In addition, the transport coefficients turn symmetric past . The enhanced symmetry seen in all subplots of Figure 2 past is a signature that could be employed experimentally to determine whether this finite temperature approach to thermoelectricity surpasses the current state-of-the-art. The theoretical treatment that most closely resembles ours calls for a discontinuous jump of at , and does not contain a prescription for across the structural transition.[12] As indicated next, calculating the lattice thermal conductivity requires additional methods to collect the phonon frequencies and lifetimes from the molecular dynamics data.
II.4 Vibrational spectrum at finite temperature
In materials at the onset of a structural transformation such as bulk SnSe,[39, 40] SnTe monolayers,[19] and others, “anharmonicity drives the crystal past the zero-temperature structure onto a new crystalline phase for which the zero-temperature electronic and zero-temperature phonon dispersions may no longer carry meaning.”[41] Yet the present theory paradigm of thermoelectricity assumes that anharmonicity can be accounted for perturbatively, and it ignores structural transformations altogether.[3, 42, 7, 8, 9] Said more explicitly, “vibrational properties are typically calculated for the ground-state K structures, and materials that undergo phase transitions around or below room temperature present particular challenges.[2]” Furthermore, Mingo and coworkers indicate that “extreme materials display strong anharmonicity, and … the inclusion of quartic and higher order anharmonicities and renormalization of harmonic phonons will perhaps be replaced by large-scale first principles molecular dynamics simulations:[2]” this is, precisely, the road taken in this work.
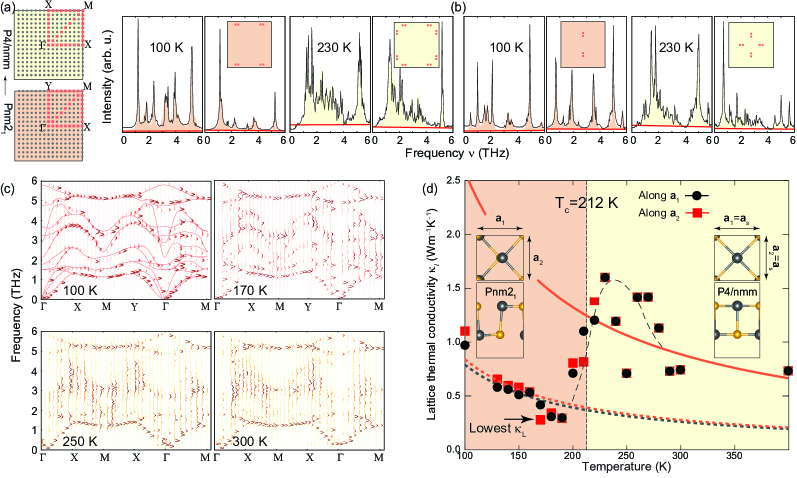
Figure 3(a) displays the first Brillouin zone and the point sampling achieved with a 1616 supercell without interpolation. The use of this point mesh makes inclusion of Born charges unnecessary for the phonon dispersions shown here.[43]. The high-temperature phase is fourfold-symmetric,[34] making the and points equivalent. A power spectrum at each point is obtained through a process involving two Fourier transforms and a time autocorrelation.[44] To begin with, a Fourier transform of molecular dynamics velocity data into reciprocal space is performed for each of the four atoms belonging to the unit cell. These Fourier transformed velocities are subsequently time autocorrelated, and a final Fourier transform into the frequency domain provides the resonant natural frequencies demonstrated at two nearby points at K and 230 K in Figure 3(b).
The finite temperature phonon dispersions of a SnSe monolayer at the points along the red path in Figure 3(a) are shown in Figure 3(c). As seen by superimposing zero-temperature phonons drawn by red solid lines in Figure 3(c), the power spectra data describes the vibrational frequencies, and it includes information on phonon-phonon interactions through broadening of the natural frequencies. This non-perturbative process fully incorporates anharmonicity in the phonon frequencies and phonon lifetimes, in contrast to the standard approach[9]—used in Ref. [20] and multiple others—whereby phonon scattering rates are determined up to third- or fourth-order in a perturbation series and added according to Matthiessen’s rule. The simplex method was used to fit central frequencies and the full width at half-max for all peaks at each point (the height indicating the relative intensity of a given natural vibrational mode at finite temperature is an additional fitting parameter) to Lorentzian functions
| (6) |
Additionally, a “baseline” background shown in red on Figure 3(b) was fitted to a straight line to better define phonon frequency broadening. The 12 Lorentzians with largest amplitude having frequencies and linewidth provide the vibrational spectrum at each point and temperature. Phonon lifetimes are directly obtained from as: . The average value of was 2.6 ps across the 100 to 400 K temperature range studied here. As a result, we observe a softening of vibrational modes along the path at frequencies between 2 and 4 THz for [34] in Figures 3(b) and 3(c). Given that the P4/nmm symmetry group is tetragonal, and in accordance with Figure 3(a), the point turns into for above in Figure 3(c).
Importantly, and unlike the results obtained within the standard approach to thermoelectricity,[9] the phonon spectrum in Figure 3(c) does reflect the effects of the structural transformation[32, 34, 33, 19] showcased earlier on in Figure 1, thus unleashing a new approach for thermoelectricity that takes finite-temperature electronic and vibrational information into heart. The novel use of finite-temperature information will modify the predictions of thermoelectric behavior[20] as obtained within the standard framework.[7, 8, 9]
II.5 Anomalous lattice thermal conductivity
The electronic contribution to the thermal conductivity seen in Figure 2(c) was only as large as 0.25 W m-1 K-1 at 400 K. Obtaining the lattice thermal conductivity requires extracting the phonon group velocity (with ) from the finite-temperature phonon data discussed in previous subsection. (with ) is calculated by finite-differences for each band at two consecutive points and for a given : . This way, the lattice thermal conductivity displayed in Figure 3(d) is given by:
| (7) |
with the phonon lifetime and the phonon heat capacity for the -th mode,
| (8) |
The reader should note that even though is obtained within the harmonic approximation, the velocities and frequencies are obtained from molecular dynamics and are thus “renormalized” in the sense that they include anharmonic contributions by construction.
The peak shown in Figure 3(d) near the transition temperature is reminiscent of the anomalous lattice thermal conductivity experimentally observed in SmBaMn2O6 single crystals across their structural transition,[45] and it constitutes one of the main results of the present theoretical work. In the ferroelectric phase below K, decreases with a behavior. The lattice thermal conductivity is comparable with close to , at which point exhibits a sudden increase across the transition and an enhanced for compared to the usual method. Due to the enhanced symmetry above , we present the average lattice thermal conductivity for K. Above , the fits to the data along both directions are not statistically different. A study of Cu2Se, Cu2S, Ag2S, and Ag2Se indicated a substantially reduced lattice thermal conductivity just before the onset of their temperature dependent phase transition. [13] In agreement with Ref. [14], our results actually show a larger past than the usual method, which ignores the transition altogether.
Optical phonons have been found to contribute to substantially;[46, 47, 48] in other monochalcogenide systems the contribution owing to the optical modes can be greater than 20% of the total ,[49] and it can be as high as 30% in bulk SnSe.[50] Even just on the basis of Equation 7, the unmitigated increase in the phonon velocities, lifetimes, and softened frequencies dominates the lattice thermal conductivity despite a saturating heat capacity . An enhanced has been attributed to higher velocity softened phonon modes both in silica [51] and in double-perovskite SmBaMn2O6 single crystals.[45]
II.6 The thermoelectric figure of merit
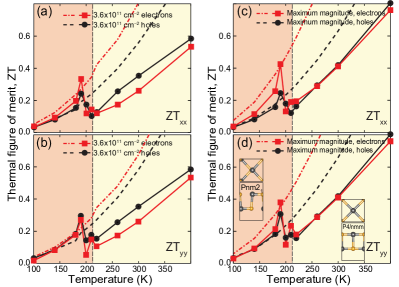
Having collected , , , and in previous subsections, the thermoelectric figure of merit as written in Equation 1 is determined along the and directions in Figure 4. Subplots (a) and (b) display for a fixed electron or hole density along the and directions, respectively, while subplots (c) and (d) display along the and directions for electron and hole densities such that the chemical potential maximizes at each temperature.
Regardless of type of doping (electron, dashed-dotted lines or hole, dashed lines) or the amount of doping, for all within the standard approach to thermoelectricity. This result is due to the use of the zero-temperature rectangular ground state atomistic structure regardless of temperature. Using the finite temperature data constructed from Figure 1 to Figure 3, the thermoelectric figure of merit is slightly smaller than predictions within the zero-temperature electronic and vibrational dispersion canon just described for temperatures up to 180 K; grows in essentially the same manner and in agreement with the predictions of the standard paradigm. then displays a significant, symmetric drop beyond 190 K and for temperatures above , which is quite different from the ultra-high magnitudes of reported in previous works[20, 27, 28] that do not take the structural transformation into account. The apparent spike in near the transition temperature is similar to the behavior of brought on by phonon critical scattering in iodine-doped or alloyed bulk Cu2Se.[52, 53, 54] Though illustrated with a SnSe monolayer, the methods described here apply to any material. Their generality and relative ease of implementation make this a viable theoretical framework to understand how thermoelectric properties evolve at the onset of structural transitions.
III Conclusion
We investigated the thermoelectric behavior of a prototypical SnSe monolayer across its two-dimensional ferroelectric-to-paraelectric phase transition. We incorporated finite-temperature molecular dynamics data to inform both the electronic lattice thermal behavior. As a result, dropped below values predicted using the standard approach to thermoelectricity past the critical temperature . The thermoelectric behavior we have examined and the methodology we have employed are extensible to arbitrary materials undergoing solid-to-solid phase transitions. As explicitly requested by the community, the present work thus solves a pressing problem within the theory of thermoelectric materials and it provides a viable route to understand their properties when undergoing structural phase transitions.
IV Methods
Ab initio molecular dynamics calculations on SnSe monolayers employing the SIESTA code [55] with vdW-DF-cx van der Waals corrections[35, 36] were carried out on supercells (originally built on a single Pnm21 phase with no domain walls). These calculations employed localized numerical atomic orbitals [56] and norm-conserving Troullier-Martins pseudopotentials [57] tuned in-house [58], and ran with the isothermal-isobaric (NPT) ensemble for temperatures between 0 and 400 K. The out-of-plane direction of the unit cell had a length of 22 Å to ensure no interaction between periodic copies of the monolayer. For comparison purposes, the ShengBTE code [9] was also employed to calculate the lattice thermal conductivity; the interatomic forces were calculated using the same settings employed in SIESTA on a supercell with up to third neighbors for the third-order force constants. We used a k-point mesh and a scalebroad parameter of 1.0.
The other factors for the thermoelectric transport coefficients are electrical. We take the average structure from each temperature in the MD calculation and use SIESTA to calculate the HSX file (for the Hamiltonian and overlap matrices). We use these to calculate the density of states (DOS) and necessary derivatives from a dense point mesh of 100 points along each reciprocal lattice vector. The transport coefficient equations are given from Boltzmann transport theory.[7, 8, 9]
Acknowledgements The authors were funded by an Early Career Grant from the U.S. DOE (DE-SC0016139). Calculations were performed on Cori at NERSC, a U.S. DOE Office of Science User Facility (DE-AC02-05CH11231) and at the University of Arkansas’ Trestles and Pinnacle supercomputers, funded by the NSF, the Arkansas Economic Development Commission, and the Office of the Vice Provost for Research and Innovation.
References
- of Sciences et al. [2010] N. A. of Sciences, N. A. of Engineering, and N. R. Council, Electricity from Renewable Resources: Status, Prospects, and Impediments (The National Academies Press, Washington, DC, 2010).
- Lindsay et al. [2019] L. Lindsay, A. Katre, A. Cepellotti, and N. Mingo, Perspective on ab initio phonon thermal transport, J. Appl. Phys. 126, 050902 (2019).
- Zevalkink et al. [2018] A. Zevalkink, D. M. Smiadak, J. L. Blackburn, A. J. Ferguson, M. L. Chabinyc, O. Delaire, J. Wang, K. Kovnir, J. Martin, L. T. Schelhas, T. D. Sparks, S. D. Kang, M. T. Dylla, G. J. Snyder, B. R. Ortiz, and E. S. Toberer, A Practical Field Guide to Thermoelectrics: Fundamentals, Synthesis, and Characterization, Appl. Phys. Rev. 5, 021303 (2018).
- Zhao et al. [2014] L.-D. Zhao, S.-H. Lo, Y. Zhang, H. Sun, G. Tan, C. Uher, C. Wolverton, V. P. Dravid, and M. G. Kanatzidis, Ultralow thermal conductivity and high thermoelectric figure of merit in SnSe crystals, Nature 508, 373 (2014).
- Wei et al. [2019] P.-C. Wei, S. Bhattacharya, Y.-F. Liu, F. Liu, J. He, Y.-H. Tung, C.-C. Yang, C.-R. Hsing, D.-L. Nguyen, C.-M. Wei, M.-Y. Chou, Y.-C. Lai, T.-L. Hung, S.-Y. Guan, C.-S. Chang, H.-J. Wu, C.-H. Lee, W.-H. Li, R. P. Hermann, Y.-Y. Chen, and A. M. Rao, Thermoelectric figure-of-merit of fully dense single-crystalline snse, ACS Omega 4, 5442 (2019).
- Chang et al. [2018a] C. Chang, M. Wu, D. He, Y. Pei, C.-F. Wu, X. Wu, H. Yu, F. Zhu, K. Wang, Y. Chen, L. Huang, J.-F. Li, J. He, and L.-D. Zhao, 3d charge and 2d phonon transports leading to high out-of-plane zt in n-type snse crystals, Science 360, 778 (2018a).
- Madsen and Singh [2006] G. K. Madsen and D. J. Singh, BoltzTraP. A code for calculating band-structure dependent quantities, Comput. Phys. Commun. 175, 67 (2006).
- Madsen et al. [2018] G. K. Madsen, J. Carrete, and M. J. Verstraete, BoltzTraP2, a program for interpolating band structures and calculating semi-classical transport coefficients, Comput. Phys. Commun. 231, 140 (2018).
- Li et al. [2014] W. Li, J. Carrete, N. A. Katcho, and N. Mingo, ShengBTE: A solver of the Boltzmann transport equation for phonons, Comput. Phys. Commun. 185, 1747 (2014).
- Ding et al. [2015] G. Ding, G. Gao, and K. Yao, High-efficient thermoelectric materials: The case of orthorhombic IV-VI compounds, Sci. Rep. 5, 9567 (2015).
- Guo et al. [2015] R. Guo, X. Wang, Y. Kuang, and B. Huang, First-principles study of anisotropic thermoelectric transport properties of iv-vi semiconductor compounds snse and sns, Phys. Rev. B 92, 115202 (2015).
- Yu et al. [2016] H. Yu, S. Dai, and Y. Chen, Enhanced power factor via the control of structural phase transition in snse, Sci. Rep. 6, 26193 (2016).
- Chen et al. [2019a] H. Chen, Z. Yue, D. Ren, H. Zeng, T. Wei, K. Zhao, R. Yang, P. Qiu, L. Chen, and X. Shi, Thermal Conductivity during Phase Transitions, Adv. Mater. 31, 1806518 (2019a).
- Agne et al. [2019] M. T. Agne, P. W. Voorhees, and G. J. Snyder, Phase Transformation Contributions to Heat Capacity and Impact on Thermal Diffusivity, Thermal Conductivity, and Thermoelectric Performance, Adv. Mater. 31, 1902980 (2019).
- Chang et al. [2020] K. Chang, F. Küster, B. J. Miller, J.-R. Ji, J.-L. Zhang, P. Sessi, S. Barraza-Lopez, and S. S. P. Parkin, Microscopic manipulation of ferroelectric domains in snse monolayers at room temperature, Nano Lett. 20, 6590 (2020).
- Chattopadhyay et al. [1986] T. Chattopadhyay, J. Pannetier, and H. Von Schnering, Neutron Diffraction Study of the Structural Phase Transition in SnS and SnSe, J. Phys. Chem. Solids 47, 879 (1986).
- [17] S. Barraza-Lopez, B. M. Fregoso, J. W. Villanova, S. S. P. Parkin, and K. Chang, Colloquium: Physical behavior of group-IV monochalcogenide monolayers, arXiv:2009.04341 (accepted for publication at Reviews of Modern Physics) .
- Fei et al. [2015] R. Fei, W. Li, J. Li, and L. Yang, Giant Piezoelectricity of Monolayer Group IV Monochalcogenides: SnSe, SnS, GeSe, and GeS, Appl. Phys. Lett. 107, 173104 (2015).
- Chang et al. [2016] K. Chang, J. Liu, H. Lin, N. Wang, K. Zhao, A. Zhang, F. Jin, Y. Zhong, X. Hu, W. Duan, Q. Zhang, L. Fu, Q.-K. Xue, X. Chen, and S.-H. Ji, Discovery of robust in-plane ferroelectricity in atomic-thick snte, Science 353, 274 (2016).
- Wang et al. [2015] F. Q. Wang, S. Zhang, J. Yu, and Q. Wang, Thermoelectric properties of single-layered SnSe sheet, Nanoscale 7, 15962 (2015).
- Rodin et al. [2016] A. S. Rodin, L. C. Gomes, A. Carvalho, and A. H. Castro Neto, Valley Physics in Tin (II) Sulfide, Phys. Rev. B 93, 045431 (2016).
- Slawinska et al. [2018] J. Slawinska, F. T. Cerasoli, H. Wang, S. Postorino, A. Supka, S. Curtarolo, M. Fornari, and M. B. Nardelli, Giant Spin Hall Effect in Two-Dimensional Monochalcogenides, 2D Mater. 6, 025012 (2018).
- Chang et al. [2019] K. Chang, B. J. Miller, H. Yang, H. Lin, S. S. P. Parkin, S. Barraza-Lopez, Q.-K. Xue, X. Chen, and S.-H. Ji, Standing Waves Induced by Valley-Mismatched Domains in Ferroelectric SnTe Monolayers, Phys. Rev. Lett. 122, 206402 (2019).
- Rangel et al. [2017] T. Rangel, B. M. Fregoso, B. S. Mendoza, T. Morimoto, J. E. Moore, and J. B. Neaton, Large Bulk Photovoltaic Effect and Spontaneous Polarization of Single-Layer Monochalcogenides, Phys. Rev. Lett. 119, 067402 (2017).
- Panday and Fregoso [2017] S. R. Panday and B. M. Fregoso, Strong Second Harmonic Generation in Two-Dimensional Ferroelectric IV-Monochalcogenides, J. Phys.: Condens. Matter 29, 43LT01 (2017).
- Wang and Qian [2019] H. Wang and X. Qian, Ferroicity-driven nonlinear photocurrent switching in time-reversal invariant ferroic materials, Sci. Adv. 5, eaav9743 (2019).
- Sun et al. [2019] Y. Sun, Z. Shuai, and D. Wang, Reducing Lattice Thermal Conductivity of the Thermoelectric SnSe Monolayer: Role of Phonon–Electron Coupling, J. Phys. Chem. C 123, 12001 (2019).
- Ding et al. [2019] G. Ding, Y. Hu, D. Li, and X. Wang, A comparative study of thermoelectric properties between bulk and monolayer SnSe, Results Phys. 15, 102631 (2019).
- Perdew et al. [1996] J. P. Perdew, K. Burke, and M. Ernzerhof, Generalized Gradient Approximation Made Simple, Phys. Rev. Lett. 77, 3865 (1996).
- Mehboudi et al. [2016a] M. Mehboudi, A. M. Dorio, W. Zhu, A. van der Zande, H. O. H. Churchill, A. A. Pacheco-Sanjuan, E. O. Harriss, P. Kumar, and S. Barraza-Lopez, Two-Dimensional Disorder in Black Phosphorus and Monochalcogenide Monolayers, Nano Lett. 16, 1704 (2016a).
- Mehboudi et al. [2016b] M. Mehboudi, B. M. Fregoso, Y. Yang, W. Zhu, A. van der Zande, J. Ferrer, L. Bellaiche, P. Kumar, and S. Barraza-Lopez, Structural Phase Transition and Material Properties of Few-Layer Monochalcogenides, Phys. Rev. Lett. 117, 246802 (2016b).
- Barraza-Lopez et al. [2018] S. Barraza-Lopez, T. P. Kaloni, S. P. Poudel, and P. Kumar, Tuning the Ferroelectric-to-Paraelectric Transition Temperature and Dipole Orientation of Group-IV Monochalcogenide Monolayers, Phys. Rev. B 97, 024110 (2018).
- Poudel et al. [2019] S. P. Poudel, J. W. Villanova, and S. Barraza-Lopez, Group-IV monochalcogenide monolayers: Two-dimensional ferroelectrics with weak intralayer bonds and a phosphorenelike monolayer dissociation energy, Phys. Rev. Materials 3, 124004 (2019).
- Villanova et al. [2020] J. W. Villanova, P. Kumar, and S. Barraza-Lopez, Theory of finite-temperature two-dimensional structural transformations in group-iv monochalcogenide monolayers, Phys. Rev. B 101, 184101 (2020).
- Román-Pérez and Soler [2009] G. Román-Pérez and J. M. Soler, Efficient Implementation of a van der Waals Density Functional: Application to Double-Wall Carbon Nanotubes, Phys. Rev. Lett. 103, 096102 (2009).
- Berland and Hyldgaard [2014] K. Berland and P. Hyldgaard, Exchange functional that tests the robustness of the plasmon description of the van der waals density functional, Phys. Rev. B 89, 035412 (2014).
- Hu et al. [2017] Z.-Y. Hu, K.-Y. Li, Y. Lu, Y. Huang, and X.-H. Shao, High thermoelectric performances of monolayer SnSe allotropes, Nanoscale 9, 16093 (2017).
- González-Romero et al. [2017] R. L. González-Romero, A. Antonelli, and J. J. Meléndez, Insights into the thermoelectric properties of SnSe from ab initio calculations, Phys. Chem. Chem. Phys. 19, 12804 (2017).
- Li et al. [2015] C. W. Li, J. Hong, A. F. May, D. Bansal, S. Chi, T. Hong, G. Ehlers, and O. Delaire, Orbitally driven giant phonon anharmonicity in SnSe, Nat. Phys. 11, 1063 (2015).
- Chang et al. [2018b] C. Chang, G. Tan, J. He, M. G. Kanatzidis, and L.-D. Zhao, The Thermoelectric Properties of SnSe Continue to Surprise: Extraordinary Electron and Phonon Transport, Chem. Mater. 30, 7355 (2018b).
- Heremans [2015] J. Heremans, The anharmonicity blacksmith, Nature Phys. 11, 990 (2015).
- McGaughey et al. [2019] A. J. H. McGaughey, A. Jain, H.-Y. Kim, and B. Fu, Phonon properties and thermal conductivity from first principles, lattice dynamics, and the Boltzmann transport equation, J. Appl. Phys. 125, 011101 (2019).
- Pick et al. [1970] R. M. Pick, M. H. Cohen, and R. M. Martin, Microscopic theory of force constants in the adiabatic approximation, Phys. Rev. B 1, 910 (1970).
- Koukaras et al. [2015] E. N. Koukaras, G. Kalosakas, C. Galiotis, and K. Papagelis, Phonon Properties of Graphene Derived From Molecular Dynamics Simulations, Sci. Rep. 5, 12923 (2015).
- Chen et al. [2019b] L. Chen, Z. Xiang, C. Tinsman, Q. Huang, K. G. Reynolds, H. Zhou, and L. Li, Anomalous thermal conductivity across the structural transition in SmBaMn2O6 single crystals, Appl. Phys. Lett. 114, 251904 (2019b).
- Shiga et al. [2012] T. Shiga, J. Shiomi, J. Ma, O. Delaire, T. Radzynski, A. Lusakowski, K. Esfarjani, and G. Chen, Microscopic mechanism of low thermal conductivity in lead telluride, Phys. Rev. B 85, 155203 (2012).
- Beechem et al. [2010] T. Beechem, J. C. Duda, P. E. Hopkins, and P. M. Norris, Contribution of optical phonons to thermal boundary conductance, Appl. Phys. Lett. 97, 061907 (2010).
- Tian et al. [2011] Z. Tian, K. Esfarjani, J. Shiomi, A. S. Henry, and G. Chen, On the importance of optical phonons to thermal conductivity in nanostructures, Appl. Phys. Lett. 99, 053122 (2011).
- Shulumba et al. [2017] N. Shulumba, O. Hellman, and A. J. Minnich, Intrinsic localized mode and low thermal conductivity of PbSe, Phys. Rev. B 95, 014302 (2017).
- Qin et al. [2016] G. Qin, Z. Qin, W.-Z. Fang, L.-C. Zhang, S.-Y. Yue, Q.-B. Yan, M. Hu, and G. Su, Diverse anisotropy of phonon transport in two-dimensional group IV–VI compounds: A comparative study, Nanoscale 8, 11306 (2016).
- Aramberri et al. [2017] H. Aramberri, R. Rurali, and J. Íñiguez, Thermal conductivity changes across a structural phase transition: The case of high-pressure silica, Phys. Rev. B 96, 195201 (2017).
- Liu et al. [2013] H. Liu, X. Yuan, P. Lu, X. Shi, F. Xu, Y. He, Y. Tang, S. Bai, W. Zhang, L. Chen, Y. Lin, L. Shi, H. Lin, X. Gao, X. Zhang, H. Chi, and C. Uher, Ultrahigh Thermoelectric Performance by Electron and Phonon Critical Scattering in Cu2Se1-xIx, Adv. Mater. 25, 6607 (2013).
- Byeon et al. [2019] D. Byeon, R. Sobota, K. Delime-Codrin, S. Choi, K. Hirata, M. Adachi, M. Kiyama, T. Matsuura, Y. Yamamoto, M. Matsunami, and T. Takeuchi, Discovery of colossal Seebeck effect in metallic Cu2Se, Nature Commun. 10, 72 (2019).
- Vasilevskiy et al. [2018] D. Vasilevskiy, M. K. Keshavarz, J.-M. Simard, R. A. Masut, S. Turenne, and G. J. Snyder, Assessing the Thermal Conductivity of Cu2-xSe AlloysUndergoing a Phase Transition via the SimultaneousMeasurement of Thermoelectric Parameters by aHarman-Based Setup, J. Electron. Mater. 47, 3314 (2018).
- Soler et al. [2002] J. M. Soler, E. Artacho, J. D. Gale, A. García, J. Junquera, P. Ordejón, and D. Sánchez-Portal, The SIESTA Method for Ab Initio Order-N Materials Simulation, J. Phys.: Condens. Matter 14, 2745 (2002).
- Junquera et al. [2001] J. Junquera, O. Paz, D. Sánchez-Portal, and E. Artacho, Numerical Atomic Orbitals for Linear-Scaling Calculations, Phys. Rev. B 64, 235111 (2001).
- Troullier and Martins [1991] N. Troullier and J. L. Martins, Efficient Pseudopotentials for Plane-Wave Calculations, Phys. Rev. B 43, 1993 (1991).
- Rivero et al. [2015] P. Rivero, V. García-Suárez, D. Pereñiguez, K. Utt, Y. Yang, L. Bellaiche, K. Park, J. Ferrer, and S. Barraza-Lopez, Systematic Pseudopotentials from Reference Eigenvalue Sets for DFT Calculations, Comp. Mat. Sci. 98, 372 (2015).