Cooling of Accretion Disc Coronae by Type I X-ray Bursts
Abstract
Although accretion disc coronae appear to be common in many accreting systems, their fundamental properties remain insufficiently understood. Recent work suggests that Type I X-ray bursts from accreting neutron stars provide an opportunity to probe the characteristics of coronae. Several studies have observed hard X-ray shortages from the accretion disk during an X-ray burst implying strong coronal cooling by burst photons. Here, we use the plasma emission code eqpair to study the impact of X-ray bursts on coronae, and how the coronal and burst properties affect the coronal electron temperatures and emitted spectra. Assuming a constant accretion rate during the burst, our simulations show that soft photons can cool coronal electrons by a factor of and cause a reduction of emission in the – keV band to of the pre-burst emission. This hard X-ray drop is intensified when the coronal optical depth and aspect ratio is increased. In contrast, depending on the properties of the burst and corona, the emission in the – keV band can either increase, by a factor of , or decrease, down to of the pre-burst emission. An increasing accretion rate during the X-ray burst reduces the coronal cooling effects and the electron temperature drop can be mitigated by . These results indicate that changes of the hard X-ray flux during an X-ray burst probe the geometrical properties of the corona.
keywords:
accretion, accretion discs – radiation mechanisms: thermal – stars: neutron – X-rays: binaries – X-rays: bursts1 Introduction
Hard X-ray emission is regularly detected from accreting compact objects (i.e., neutron stars and black holes), and is thought to originate in a corona, a region of hot electrons located close to the accretion flow where soft photons from the disc are Compton up-scattered to X-ray energies (e.g., Thorne & Price, 1975; Galeev et al., 1979; White & Holt, 1982; Zdziarski & Gierliński, 2004; Ibragimov et al., 2005; Revnivtsev et al., 2008; Wang et al., 2019). Despite their near ubiquity, the connection between accretion disc properties (e.g., accretion rate) and the characteristics of the corona (e.g., size and optical depth) is not well understood. For example, several models and observations indicate that when the accretion rate is low the corona takes up the region between the central object and a truncated thin disc (e.g., Gierliński & Done 2002; Mayer & Pringle 2007; for a review see Done et al. 2007). However, direct observational tests of the geometry of the corona remain elusive.
While both neutron stars and black holes are accreting compact objects, the observational properties of their corona appear to be significantly different. For example, for a given optical depth, the measured electron temperatures of coronae in accreting neutron stars are lower than what is measured for black holes systems, leading to steeper X-ray spectra (Burke et al., 2017). Radiation emitted from the neutron star surface and the disc boundary layer provide additional sources of soft photons that can interact and cool the corona.
An accreting neutron star (NS) can also release a large number of soft photons through a Type I X-ray burst, which occurs after the star has accreted sufficient hydrogen and helium from a companion star that has filled its Roche lobe (e.g., Lewin et al., 1993; Cumming, 2003). The accreted matter accumulates onto the neutron star, where the pressure and temperature rise, leading eventually to unstable nuclear burning of the accreted layer. The burning front quickly envelopes the star, heating the stellar surface which is then detectable as an X-ray burst (generally well described by a blackbody; e.g., Swank et al. 1977; Degenaar et al. 2016) that lasts, for many bursts, at most a few 10s of seconds (for a recent review see Galloway & Keek 2017). The intense, transient burst of soft X-ray photons will then interact with the surrounding accretion disk and corona, leading to a host of potentially interesting effects (e.g., Ballantyne & Strohmayer, 2004; Ballantyne & Everett, 2005; Degenaar et al., 2018).
The impact of the burst on the corona is particularly important as it could change the ‘persistent spectrum’ emitted by the disc and corona during the burst. Historically, analysis of X-ray burst spectra commonly assumed the persistent spectrum to be unchanged from its pre-burst properties, and therefore could be safely subtracted from the burst spectrum in order to measure burst properties (e.g., Sztajno et al., 1986; Galloway et al., 2008; Ji et al., 2013). Critically, these techniques have been used to infer the neutron star radius, which would constrain the equation-of-state of nuclear matter (e.g., Lewin et al., 1993; Özel et al., 2009; Suleimanov et al., 2011). However, the assumption that the persistent spectrum is constant throughout the burst has come into question. Worpel et al. (2013) introduced a normalization factor for the persistent spectrum and found that it exceeded unity in a statistical analysis of many RXTE burst spectra, suggesting a persistent emission enhancement (also shown by Worpel et al., 2015). The enhancement could be caused by an increase in the accretion rate during the burst due to the loss of angular momentum from Poynting-Robertson drag (Walker & Meszaros, 1989; Walker, 1992). This effect has been confirmed by recent numerical simulations investigating the impact of a burst on a thin accretion disk (Fragile et al., 2020).
In addition to the change in the normalization of the persistent emission, recent observations have found evidence for a hard X-ray shortage during X-ray bursts. The earliest example was discovered by Maccarone & Coppi (2003) who found that the 30-60 keV emission dropped by a factor of 2 during a burst from Aql X-1. Stacking of bursts have led to several measurements with large significance, most recently by Sánchez-Fernández et al. (2020) who detected an 80 emission shortage in the 35-70 keV band after stacking several bursts from GS 1826–238. As these changes occur at much higher energies than found in the burst spectrum, they appear to be evidence of changes in the corona due to the burst, likely from Compton cooling due to the large influx of soft burst photons (e.g., Maccarone & Coppi, 2003; Ji et al., 2014a, b; Degenaar et al., 2018; Chen et al., 2018; Fragile et al., 2018; Sánchez-Fernández et al., 2020). It appears that a close investigation of the hard X-ray flux properties during a burst may therefore provide an unique probe of the corona.
Hence, this paper explores how an X-ray burst impacts the emission from an accretion disc corona. We examine the role of both coronal and burst properties in the coronal cooling process, and also investigate the effects of an enhanced accretion rate during the burst. The calculations are described in Section 2 with the results presented in Section 3. Section 4 contains a comparison of our results to observations and discusses other effects not explicitly considered in the current calculations. Finally, Section 5 summarizes the principle conclusions and key results of this work.
2 Calculations
To assess the impact of the X-ray burst photons on the corona, we will consider an idealized neutron star system emitting an isotropic X-ray burst. The neutron star is surrounded by a azimuthally symmetric corona which connects onto a truncated thin accretion disc. This scenario was initially presented and described by Degenaar et al. (2018) (see their Section 5.2.3), and we build upon their treatment as described below. Since we are focused on the impact of the burst on the corona, we will ignore the influence of reprocessing of the burst in the thin disk (the impact of reflection is considered in Sect. 4.2).
Following Degenaar et al. (2018), the total luminosity available to the system is defined as
| (1) |
with being the mass of the neutron star, the mass accretion rate and the neutron star radius. The factor introduced in Eq. 1 is our first expansion of the calculations by Degenaar et al. (2018). quantifies any enhanced mass accretion rate that may be initiated by the X-ray burst interacting with its surroundings (e.g., Worpel et al., 2015; Fragile et al., 2018). For simplicity, we assume is a linear function of the burst luminosity, ,
| (2) |
where is the unmodified luminosity (i.e., ). The chosen slope of ensures that the enhancement of the accretion rate is at most a factor of for the maximum considered burst luminosity (), consistent with the changes in the normalization of the persistent spectrum measured in recent X-ray bursts (; Degenaar et al. 2016; Keek et al. 2018). Section 3 shows the effect of this increase in mass accretion rate on the changes in the coronal emission by comparing the results to models computed with .
The accretion energy is distributed through the neutron star system, with half of the energy released as the luminosity of the disc and corona , and the remainder emitted by the neutron star , which includes the emission of accreted matter arriving at the neutron star surface as well as at its boundary layer (e.g., Burke et al., 2017). If is the fraction of the accretion energy transported to the corona, the disc luminosity is defined as
| (3) |
In addition, a fraction of the energy is advected through the corona to the neutron star instead of being dissipated within the corona. Therefore, the energy dissipation rate in the corona is
| (4) |
Lastly, the accretion energy that survives to the neutron star is finally released as
| (5) |
Note that all three of these luminosities are also proportional to .
The energy released in the corona, , is used to heat electrons which then Compton up-scatters the soft photons emitted by the disc and NS to produce the cutoff power-law spectrum observed as the persistent emission (e.g., Chen et al., 2012; Kajava et al., 2017). The efficiency of the interaction between the corona and the seed photons emitted by the disc and NS will depend on the size and geometry of the corona, as only a certain fraction ( and , respectively) of the disc and NS emission will enter the corona. Therefore, we define the soft luminosity entering the corona prior to any X-ray burst as
| (6) |
An X-ray burst with luminosity also radiates from the NS surface, so during a burst the soft photon luminosity that enters the corona increases to
| (7) |
where, following Degenaar et al. (2018), we assume the burst and the NS emission are isotropic point sources as viewed from the corona. From above, we see that the impact of the soft photons on the corona depends on , , and . We find that, in the truncated disc scenario investigated here, only and have a significant impact on the spectrum produced by the corona during an X-ray burst. However, the impact of changes in are similar to the ones caused by . Therefore, following Degenaar et al. (2018), we set , , and . The parameter is related to the opening angle of the corona with respect to the NS and thus depends on the aspect ratio , defined by the coronal height and radius so that :
| (8) |
A larger means that a larger fraction of the burst photons will interact with the corona. Finally, the optical depth of the corona will also be important in determining the strength of the interaction between the burst and the corona, as a larger will lead to more frequent scatterings for a given . We therefore consider both and as control variables for our simulations.
We assume the burst, disc and NS all radiate as blackbodies. In contrast to Degenaar et al. (2018), we treat the blackbody temperature of the X-ray burst () separately from the temperatures of the disc and NS (which are assumed to be equal). The initial temperature of the burst, , is a free parameter of the model and corresponds to with (Eq. 5). With this definition, the blackbody luminosity rises to during the burst, and the blackbody temperature of the burst increases as
| (9) |
We utilize the hybrid plasma emission code eqpair (Coppi, 1999) to calculate the equilibrium electron temperature of the corona and its emitted spectrum for a wide range of burst and coronal properties. The input parameters for eqpair, and , are calculated using the equations described above. The seed photon temperature is set to (Eq. 9). With this setup we run a grid of models with (in 100 logarithmically spaced steps) and keV (in 33 linearly spaced steps). This temperature range yields reasonable maximum , but we note that higher temperature discs are observed in some hard-state NS X-ray binaries (Burke et al., 2017). A model with is also computed as part of the grid. Every grid is calculated for three different coronal aspect ratios ( and ), each with two different optical depths ( and ). All calculations were run once where the accretion rate was unchanged during the X-ray burst (i.e., ), and once when the accretion power increased during the burst (Eq. 2). Finally, in accordance with our choice to focus on the burst-corona interaction, the reflection strength is set to zero in eqpair, and we restrict our analysis to an entirely thermal corona111The addition of a small non-thermal electron population in the corona has only a small quantitative effect on the results present below. However, the non-thermal population does allow the production of a faint annihilation line in the spectrum (Maciolek-Niedzwiecki et al., 1995). We defer an investigation on the relationship of the burst to the emitted line to future work..
3 Results
3.1 Fixed Accretion Luminosity
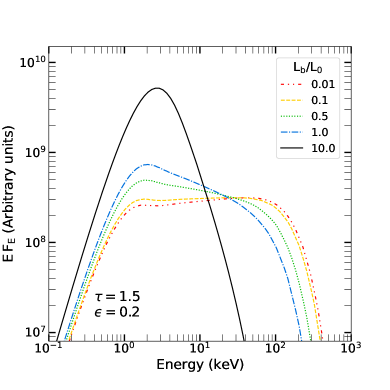
We begin by considering the impact of an X-ray burst on the corona for the case of a constant accretion luminosity (i.e., ). The left panel of Figure 1 shows the effect of an X-ray burst with luminosity = 0.01 (red, double-dotted dashed line), 0.1 (yellow dashed line), 0.5 (green dotted line), 1 (blue dot-dashed line), and 10 (black solid line) on the spectra emitted by the corona. For these examples, the initial burst temperature is keV, and the corona has an optical depth and aspect ratio . A larger increases the soft photon luminosity (Eq. 7), but the energy dissipated in the corona remains the same in each calculation (Eq. 4). The increasing means more soft burst photons illuminate the corona, cooling it down via inverse Comptonization which softens the spectrum and decreases the high-energy cutoff. These changes in the spectrum are most noticeable when (see also Degenaar et al. 2018). At the burst dominates the spectrum and it becomes overwhelmingly thermal.
The equilibrium temperature of the corona depends on both the initial burst temperature as well as its luminosity. The right panel of Fig. 1 shows contours of the equilibrium coronal electron temperature when is varied from to 20 and from 0.1 keV to 0.9 keV. As seen in the right-hand axis of the panel, this range of yields a maximum of keV for keV and keV for keV (Eq. 9). The optical depth and aspect ratio of the corona are the same as in the left panel. The plot shows that when the burst luminosity is small (i.e., ) the X-ray burst has a minor effect on the corona with its temperature largely determined by the seed photon temperature, , as higher energy photons are less efficient in cooling the corona. However, when the X-ray burst begins to become a large fraction of the total soft luminosity (at ), the coronal temperature becomes largely independent from . Indeed, the contours of coronal temperature become nearly vertical in the figure and cooling by a factor of is possible. Hence, X-ray bursts from hot NS surfaces cause the greatest change in the coronal electron temperature during the burst.
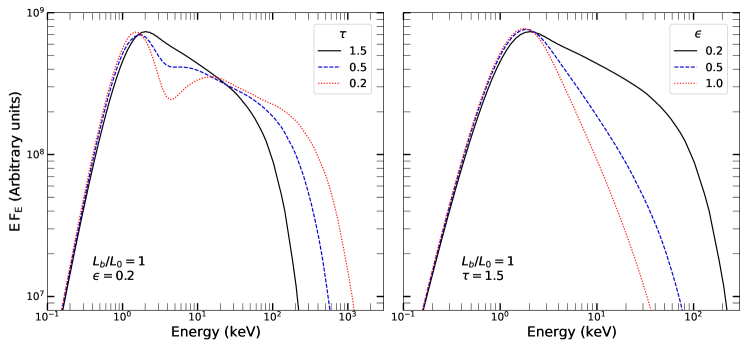
The observed hard X-ray flux will depend not only on the burst luminosity, but also on the coronal optical depth and the aspect ratio . The left panel of Figure 2 illustrates the effect of the coronal optical depth on the emitted burst-cooled spectrum when . In these examples, the initial X-ray burst temperature is set to keV and the aspect ratio of the corona is , while (black solid line), (blue dashed line) and (dotted red line). A larger increases the likelihood of interactions between the coronal electrons and soft photons which cool the corona and soften the emitted spectrum. The model is shown here to illustrate the case of an extremely optically-thin corona, although such a scenario may be uncommon in real NS systems. The blackbody shape of the X-ray burst is visible in the spectrum, but is largely invisible when and scatterings are more frequent. Crucially, the softer spectrum produced by the cooler corona with strongly impacts the observed hard X-ray flux. A similar pattern is observed in the right panel of Fig. 2, which illustrates the impact of the coronal aspect ratio, , on the emitted spectrum. As sets the amount of burst photons intercepting the corona (Eq. 8), this parameter will also affect the temperature of the corona during a burst. The examples shown in the plot are calculated with and (solid black line), (dashed blue line) and (dotted red line). If the corona provides a large target as seen from the NS, i.e. a large , the corona can be efficiently cooled, producing a large hard X-ray shortage in the spectrum. By comparing these two panels of Fig. 2, it is apparent that the spectrum emitted by the corona will depend more sensitively on than . Therefore, measurements of the hard X-ray flux deficit during an X-ray burst could constrain the aspect ratio of the accretion disc corona.
To quantify the effects of coronal cooling and the link to and , we compute the following flux ratios in the – keV and – keV band directly from the spectra calculated by eqpair:
| (10) |
and
| (11) |
The fluxes and are measured during the burst while and are the pre-burst fluxes. The – keV band is commonly used in NuSTAR analysis (e.g., Harrison et al., 2016), and, as seen below, covers an interesting range of energies that is sensitive to both X-ray burst and coronal emission. In contrast, the – keV band focuses on the impact of the burst on the corona, and can be investigated by the IBIS/ISGRI instrument on INTEGRAL (e.g., Bird et al., 2004).
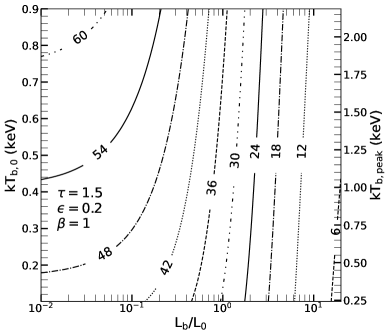
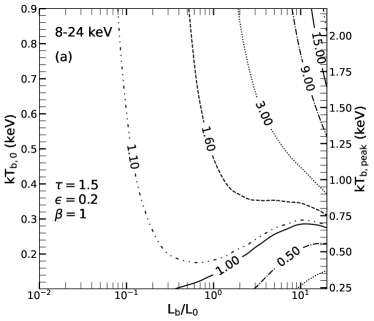
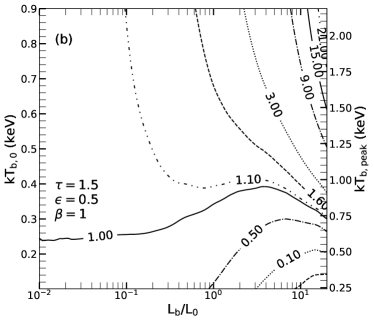
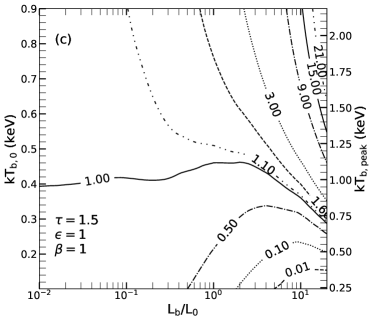
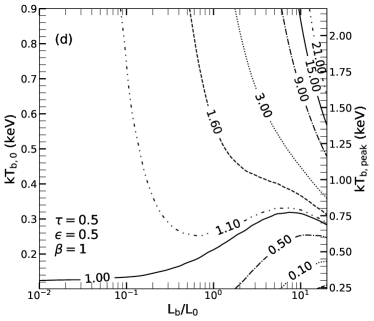
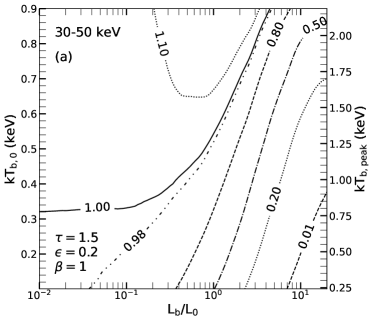
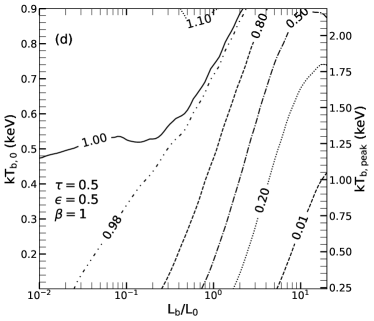
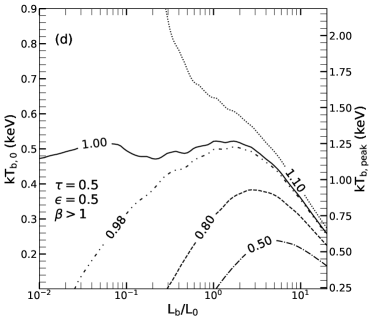
Figure 3 plots contours of as a function of the burst luminosity and initial burst temperature . Panels a, b and c show the effect of an increasing coronal aspect ratio, with , and , respectively. In those three panels the coronal optical depth is held at , while panel d shows the results for a lower coronal optical depth of ( in this case). The solid line in each panel indicates , which distinguishes the regions with increasing from those with decreasing . Interestingly, the flux in this energy band may increase during the burst up to a factor of , particularly when the corona subtends only a small angle as seen from the NS (i.e., panel (a)) and when the burst has a larger initial temperature. Note that the corona will still cool in these cases (e.g., Fig. 1), but the softening of the spectrum is more than offset by the burst spectrum entering into the energy band. In this situation, the shape of the contours are most sensitive to the coronal parameters when . However, if is low enough (less than approximately keV) then a flux deficit will occur in this band; however, the magnitude of the drop and the luminosity at which it occurs will depend on the aspect ratio of the corona. In this case, as the observed spectrum will not be strongly influenced by the burst spectrum entering the – keV band, is more sensitive to the value of even if . Finally, a lower optical depth corona also reduces the region of parameter space in which , although the effect is weaker than changes in the aspect ratio.
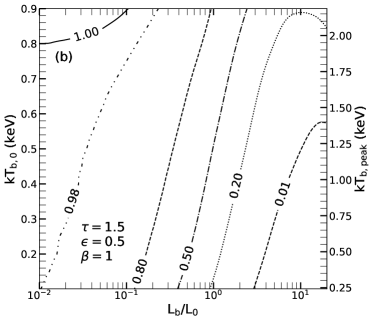
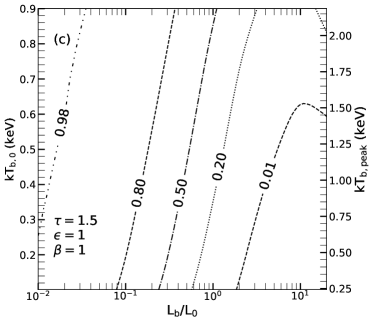
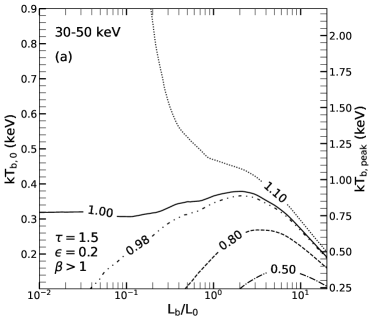
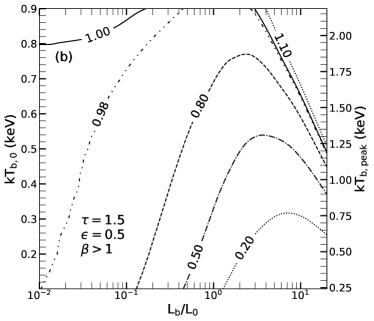
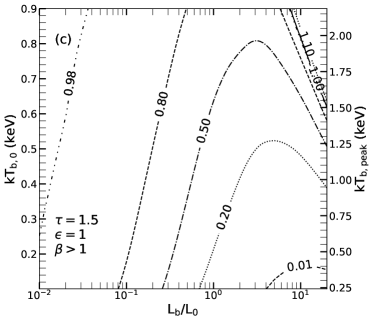
While the X-ray burst can either increase or decrease the emission in the – keV band, coronal cooling almost always leads to a decrease in (Eq. 11) for all (Figure 4). However, if the burst interacts only weakly with the corona, either through a low or a small , can increase by a few percent for keV and because the small rise in soft emission still outweighs the decrease in hard X-ray flux. The competition between these two effects causes to change very slowly in this region of parameter space with the flux ratio changing only in the 2nd or 3rd decimal place despite larger changes in and . These slight variations in lead to small wiggles in the contour lines, most notably when in Fig. 4(d). In general, we conclude that observing a small increase in would be a clear indicator of a corona that only weakly interacts with an X-ray burst. In contrast, Fig. 4(b) and (c) show that hard X-ray flux deficits appear for burst luminosities as low as . The amount of change in is linked to the cooling efficiency, which is maximized for low and large values of and . Indeed, when , the – keV flux can fall to less than 1% of its pre-burst value when keV. However, higher temperature bursts have a smaller impact in this energy band and should therefore be more useful for estimating the coronal properties using the flux deficit.
3.2 Impact of an Increasing Accretion Rate During the Burst
As mentioned above, numerical simulations of the interaction between an X-ray burst and an accretion disc indicate that Poynting-Robertson drag may increase the accretion rate onto the NS during the burst (e.g., Fragile et al., 2020). In this section we use Eq. 2 to examine how this increase in accretion power will influence the interaction between the burst and the corona. An important difference in the energy budget between the and cases is the increase in the energy dissipated in the corona, , which increases linearly with (Eq. 4). However, since only (Eq. 5), but not , depends on , the total soft luminosity (Eq. 7) increases with slower than . Hence, the increase in soft photons injected into the corona cannot completely compensate for the increase in due to , and the additional coronal heating partially offsets the Compton cooling driven by the burst photons (Figure 5) so that coronal cooling can be mitigated by . In fact, even for burst luminosities as large as , a power-law is still in the resulting spectrum. The reduced Compton cooling is seen in the equilibrium coronal electron temperatures (compare the right panels of Fig. 1 and Fig. 5), and will have a noticeable impact on the detected hard X-ray flux.
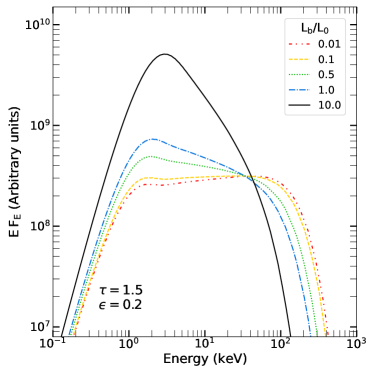
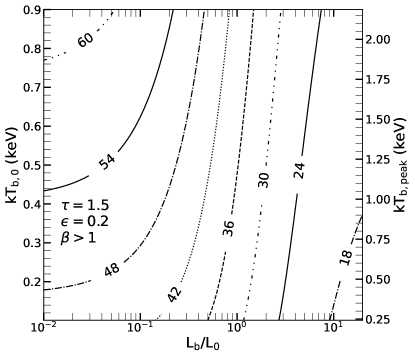
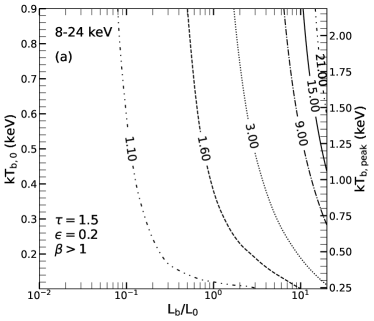
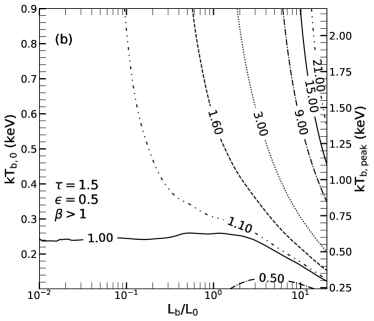
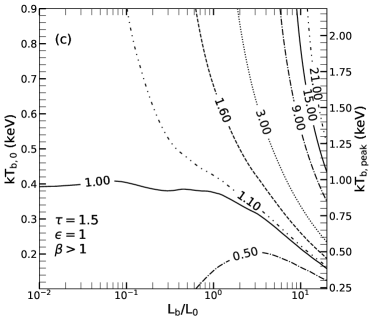
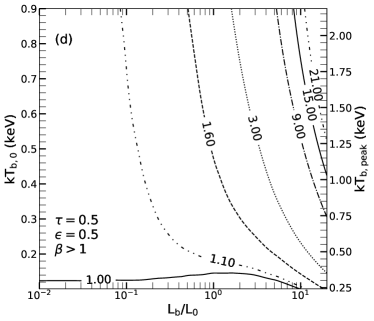
Figure 6 shows the impact of the extra energy dissipated in the corona when in the – keV band flux ratios, (Eq. 10). The contour levels shown here are the same as in Fig. 3 which showed the results for the case. The increases in are largely unchanged from the previous scenario, as these are driven by the shape of the burst spectrum which is not impacted by . However, the region of parameter space where is smaller when and the flux ratios fall to only , several times larger than in the case. In fact, when only a small fraction of the burst interacts with the corona (; panel a), everywhere in the computational domain. Therefore, if the accretion rate does increase during an X-ray burst then only a moderate decrease in the – keV flux might be observed.
The change in cooling efficiency if leads to more drastic differences in the – keV band as shown in Figure 7. The region where significantly increases when the burst interacts weakly with the corona (panels (a) and (d)). Similar to the case (Fig. 4), over a wide range of parameter space in these two panels, leading to wiggles appearing in the contours. In addition, there is a small region (in the upper-right corner of panels (b) and (c)) where even when the corona has a large aspect ratio. This increase of a few percent in the – keV flux is attributed to the increase in (Eq. 4), which generates a non vanishing high-energy electron contribution (e.g., Fig. 5) that produces a spectrum that extends into the – keV band for all burst and coronal properties we tested. The high-energy electron contribution increases with , and, combined with soft photons scattered to higher energies as the burst luminosity increases (Eq. 9), can cause to increase during the burst. Similar to the – keV flux ratio, the drop in is reduced when due to the increase in the coronal dissipation as the burst luminosity increases. However, large hard X-ray flux deficits are still expected in this band unless the burst interacts weakly with the corona.
4 Discussion
The results presented above have shown that an X-ray burst can significantly cool the accretion disc corona which will therefore substantially alter the shape of the hard X-ray spectrum. In addition to the strength and temperature of the burst spectrum, the change in the hard X-ray flux depends on both the optical depth and aspect ratio of the corona. The – keV flux may either increase or decrease during the burst, but the – keV flux will almost always decrease. The hard X-ray deficits can be mitigated if the X-ray burst induces an increase in the local accretion rate. Thus, examining the behavior of the hard X-ray flux during the burst may provide information on the coronal properties of the accreting system.
4.1 Comparison to Observations
As mentioned in Sect. 1, there have been multiple claims of hard X-ray shortages during X-ray bursts discussed in the literature. Here, we compare these observations to the results presented above. Given the idealized nature of the model, only qualitative conclusions can be drawn by comparing to observations. We focus on the calculations in the – keV band, as it more strongly reflects the impact of coronal cooling. However, we would expect a band extending to energies keV to be more impacted by coronal cooling, and a band extending to keV to be impacted less.
Maccarone & Coppi (2003) reported the first hard X-ray shortage during an X-ray burst from Aql X-1, with the flux in the – keV band dropping to of its pre-burst value. Strong Compton cooling of the corona during bursts from Aql X-1 was also inferred by Chen et al. (2013) from stacking multiple RXTE burst light curves. At the point of the burst Maccarone & Coppi (2003) determined with a Comptonization model the coronal optical depth to be . The authors also found that the emission in the – keV band increased by during the burst which may indicate a large burst temperature and luminosity (e.g., Fig. 3). In this case, our results in the – keV band (Figs. 4 and 7) are consistent with a drop of about of factor of , especially if . However, the large optical depth measured by Maccarone & Coppi (2003) suggests a high cooling efficiency, which indicates that an enhanced accretion rate during the burst may have mitigated the drop in the hard X-ray emission (e.g., Fig. 7). Our results seems to imply that at the time of this burst the corona of Aql X-1 had a large aspect ratio, and that the burst enhanced the accretion power dissipated within the corona.
A deficit of in the – keV band was also described by Chen et al. (2012) after stacking multiple RXTE lightcurves of bursts from IGR J17473–2721. The maximum deficit occurred at the peak of the bursts, which may indicate weak interaction with the corona, or an enhanced accretion rate during the bursts. Interestingly, Chen et al. (2012) only find the hard X-ray shortage before the system entered into the high/soft state, and do not find any hard X-ray deficit for bursts after the system transitioned back into the low/hard state (their ’lagging low-hard-state’). This may indicate a change in the coronal structure after the state transition, and implies that careful analysis of future hard X-ray shortages could elucidate the evolution of the corona as systems undergo major changes in their accretion properties.
In another stacking analysis of RXTE lightcurves from GS 1826–238, Ji et al. (2014b) found a similar factor of two drop in the – keV band. Using previous work on the persistent spectrum (e.g., Thompson et al., 2005, 2008; Cocchi et al., 2010), the coronal temperature was estimated to fall from keV to keV assuming a fixed . These low temperatures imply a large , but the drop of only a factor of , on average, during an X-ray burst, suggests an increase in accretion power that can help sustain the coronal temperature (e.g., Fig. 7), in agreement with the conclusion of Ji et al. (2014b).
A dramatic example of coronal cooling was identified by Kajava et al. (2017) who stacked 123 X-ray bursts detected by INTEGRAL from 4U 1728–34. The stacked emission in the – keV band drops to a third of the pre-burst emission, and the coronal temperature is estimated to drop from keV to keV. The mean blackbody temperature of the burst is keV placing it off the top of the panels in Figs. 4 and 7. The strong drop in flux suggests a high cooling efficiency and thus a high optical depth and/or a high aspect ratio, with a minimal increase in accretion rate during the burst. Due to the great amount of cooling Kajava et al. (2017) speculated if the drop in temperature could prompt the corona to collapse, which has since been shown by Fragile et al. (2018). These results may indicate that the inner accretion flow in 4U 1728-34 is dominated by a hot, geometrically thick corona.
Recently, Sánchez-Fernández et al. (2020) stacked INTEGRAL and XMM-Newton burst spectra from GS 1826–238 and found that the average emission in the – keV band dropped by during the bursts while the emission in the – keV band showed an increase. Sánchez-Fernández et al. (2020) do not report an optical depth, but the peak blackbody temperature in the stacked spectra is keV, placing it near the top of Figs. 4 and 7. This is consistent with the bursts being detectable in the – keV band, as seen in our predictions of (e.g., Fig. 3). The large drop in the – keV band implies a high cooling efficiency and that the bursts strongly interacted with the corona (e.g., a large and ), but did not induce a large increase in the accretion rate. This is consistent with the conclusions of Sánchez-Fernández et al. (2020) who find that the total persistent flux changes by only during the burst, although the normalization factor of the persistent emission rises by –. Thus, the average bursts analyzed in this system seem to appear to not have a large impact on the accretion rate.
It is worth emphasizing that it is challenging to infer the magnitude of any change in the accretion rate through spectral analysis. While Sánchez-Fernández et al. (2020) found that the normalization factor for the persistent emission rises by –, other analyses show increases of (e.g., in’t Zand et al., 2013; Worpel et al., 2015; Degenaar et al., 2016; Keek et al., 2018). As Sánchez-Fernández et al. (2020) notes, these larger increases in accretion rate could be due to only using the normalization factor to track the evolution of the persistent spectrum, or because the difference in persistent emission increase is model dependent. In addition, numerical simulations by Fragile et al. (2018) and Fragile et al. (2020) both predict a burst-driven enhanced accretion rate of a factor of a few, and this increase appears to be a natural outcome of the interaction of the burst with its surroundings. However, the simulations are currently unable to predict how this enhanced accretion rate will manifest in the emitted spectrum. Clearly, additional work is needed in determining the observational consequences of a burst-driven increase in the accretion rate.
Finally, our results are also consistent with X-ray burst observations where no hard X-ray shortages were observed during a burst (e.g., in ’t Zand et al., 1999; Chen et al., 2012; Ji et al., 2014a; Degenaar et al., 2016). Figs. 3–7 show that coronal cooling will occur without a hard X-ray emission drop, in particular when the cooling efficiency is low (e.g., low or ), and/or there is a significant increase in the coronal heating during the burst. Thus, X-ray bursts that do not cause a hard X-ray shortage in the persistent spectrum may still be cooling the accretion disc corona. In these cases, broadband spectral modeling of the persistent spectrum during the burst is needed to uncover the coronal parameters.
4.2 The Impact of Reflection from the Accretion Disc
The calculations presented in Sections 2 and 3 are focused on the interaction of the corona and the burst, and omit the effects of the optically thick accretion disc which will re-process (or reflect) radiation from both the corona and the burst. This reflected radiation will be another source of soft photons (e.g., Ballantyne, 2004), and can contribute to coronal cooling if a significant fraction enters the corona. It is therefore worthwhile to consider how the additional soft photons produced by reflection may impact the predicted and . For simplicity we will only consider the case of a constant accretion rate (i.e. ).
We include the impact of reflection by following Degenaar et al. (2018) and define a reprocessed luminosity that is the sum of the soft luminosity that originated from the neutron star and traversed the corona and the coronal luminosity
| (12) |
where is the fraction of the disc that is illuminated, consistent with a scenario of a truncated accretion disc (e.g., Barret et al., 2000; Zdziarski et al., 2003). As originates from the disc, only a fraction illuminates the corona as soft luminosity, and the new pre-burst soft luminosity is
| (13) |
During the burst the soft luminosity is now written as
| (14) |
The blackbody temperature of the burst (Eq. 9) remains unchanged and is used as the seed photon temperature in eqpair. The reflection spectrum is included in the eqpair calculation with an amplitude of (Degenaar et al., 2018).
From the above equations we see that the cooling effect of on the corona will increase with and (Eq. 14), thus we expect a larger flux deficit in the hard X-ray band under these conditions. To quantify the effect of reflection we define the fractional change in the calculated flux ratios as
| (15) |
where is the flux ratio with and without reflection. We calculated over the same and ranges and choices of and as considered in Sect. 3. We find that in the – keV band is greater than in the – keV band since the impact of cooling is more pronounced at higher energies. As anticipated, the greatest fractional change in the – keV band occurs when in geometries where Compton scattering occurs frequently (e.g., ), and when the radiation field is most effective in removing energy from the corona (e.g., keV and ). The magnitude of the change in flux ratio due to reflection is relatively small with in the – keV band and in the – keV band below . These results will change, however, if the disc subtends a larger solid angle as seen from the corona. Indeed, doubling to nearly doubles in both energy bands. A non-truncated accretion disc would be expected to be an important contributor to the corona cooling, although, in this case, which would mitigate the impact of the reflection contribution.
4.3 Potential Implications of Time Dependent Effects
X-ray bursts increase in luminosity rapidly, reaching their peak flux within a few seconds from onset (e.g., Keek et al., 2018), before, in most cases, decaying over the next several 10s of seconds. The eqpair calculations from which we derive our results are time independent, and predict an equilibrium spectrum and electron temperature at each . This is valid because the Thomson time, a measure of the timescale of photon-electron collisions, is (e.g., Padmanabhan, 2000; Rybicki & Lightman, 2008)
| (16) |
much faster than the observed changes in X-ray luminosity. Therefore, it is possible to make use of the results presented in Sect. 3 to consider how changes in the coronal geometry during a burst would impact the emitted persistent spectrum.
For example, Fragile et al. (2018) simulated a corona subject to an X-ray burst, and found that the significant Compton cooling of the corona led to a loss of thermal pressure support, causing the collapse of the corona into a thin disc. Thus, in this scenario, where the burst did not cause enhanced coronal dissipation, would decrease and increase during the burst. If the corona collapsed in this manner we would expect the observed (Eq. 11) to decrease, but the extent of the drop would depend on the competing effects of raising and lowering . As we found that changes in had a larger impact on the predicted spectrum (e.g., Fig. 2) than , it is likely that would fall to a very low value if the corona entirely collapsed during an X-ray burst. The evolution of (Eq. 10) is more challenging to predict, as it is more impacted by the rising soft photon emission from the burst in addition to the drop in hard photon emission from the corona. The coronal electron temperature would initially decline due to flux of soft burst photons, but with the collapse of the corona fewer burst photons would intercept the corona, mitigating the cooling. Thus, depending on the peak temperature of the burst, may show a moderate rise during the burst.
It may be possible that exceptionally powerful X-ray bursts, such as the photospheric radius expansion bursts (e.g., Lewin et al., 1993), or exceptionally long bursts, such as superbursts (e.g., Galloway & Keek, 2017), would disrupt the accretion flow to the point that the accretion rate is reduced during the burst and . In this case, the combined impact of a loss of coronal heating and intense Compton cooling would lead to severe hard X-ray shortages, likely through the – keV band, and the collapse of the corona would be a strong possibility. Further numerical work exploring these scenarios is needed to further understand the effects of these extreme bursts on the accretion disc and corona.
5 Conclusions
Analysis of the spectra of X-ray bursts provides an opportunity to measure fundamental parameters of the heated neutron star, such as its radius and compactness. However, the persistent spectrum produced by the accretion disc and corona will also radiate during the burst and must be accounted for in order to provide an accurate description of the burst. Several analyses of X-ray bursts with hard X-ray instruments have detected a hard X-ray shortage during the burst (e.g., Maccarone & Coppi, 2003; Ji et al., 2014a, b; Sánchez-Fernández et al., 2020), implying that the persistent spectrum is affected by the burst, perhaps by Compton cooling due to the burst photons. This paper presents the results of a series of eqpair calculations that considered how burst-driven Compton cooling will effect the temperature and emitted spectrum of a thermal accretion disc corona. Our simulations show that the X-ray burst cools down the coronal electrons and thereby will naturally lead to a hard X-ray shortage that depends on the observed energy band and the geometrical properties of the corona. Compton cooling will almost always significantly reduce the flux in the – keV band, but the emission in the – keV band can either increase or decrease depending on whether the high-energy tail of the burst emission enters into the band. The magnitude of the flux changes shows a strong dependence on the coronal aspect ratio, and a weaker one on the optical depth across the corona. Therefore, measurements of the hard X-ray flux deficit can constrain coronal properties, independent of the exact geometry of the corona.
The size of the hard X-ray flux deficits predicted by the calculations are broadly consistent with those measured or inferred from observations of X-ray bursts (Sect. 4.1). Therefore, detection of a hard X-ray drop during a X-ray burst is consistent with a coronal geometry that intercepts a significant fraction of burst photons, such as a truncated inner accretion disc. As burst induced coronal cooling always occurs, the lack of an observed hard X-ray deficit during a burst would indicate a more compact coronal geometry that interacts only weakly with burst photons.
Our calculations also considered the situation where the X-ray burst increases the accretion rate during the burst, leading to enhanced coronal dissipation (Sect. 3.2). In this case, the increase in accretion energy into the corona during the burst somewhat offsets the Compton cooling driven by the X-ray burst. As a result, the hard X-ray flux deficits do not fall as low as when the accretion rate was fixed. Careful and sensitive analysis of the hard X-ray emission during X-ray bursts has the potential to provide critical information on the physics of accretion during these violent episodes.
Compton cooling of the corona is generally expected during an X-ray burst and should be accounted for in the analysis of X-ray burst spectra. The cooling effects will change the shape of the spectrum (e.g., Fig. 1), and therefore simply multiplying the persistent spectrum by a factor during the burst does not accurately capture the physical processes occurring within the corona. Both changes in the normalization and spectral shape of the persistent spectrum should be considered when fitting X-ray burst data in order to reduce systematic errors on NS radius estimates (e.g., Sánchez-Fernández et al., 2020).
Time dependent changes to the corona, although not strictly accounted for in the calculations, may also be driven by the X-ray burst. Numerical simulations of a burst interacting with a corona showed that catastrophic Compton cooling could cause the collapse of the corona (Fragile et al., 2018). Even if the corona did not fully collapse, it is possible that the burst will drive changes in and that would impact the predicted hard X-ray flux. While it is possible to estimate the effects of such changes using the equilibrium results presented here (Sect. 4.3), a more thorough investigation of the time dependent effects which makes use of the results of numerical simulations is an important direction for future work.
Data Availability
The data underlying this article will be shared on reasonable request to the corresponding author.
Acknowledgements
The authors acknowledge P.C. Fragile for helpful comments on a draft of the manuscript.
References
- Ballantyne (2004) Ballantyne D. R., 2004, MNRAS, 351, 57
- Ballantyne & Everett (2005) Ballantyne D. R., Everett J. E., 2005, ApJ, 626, 364
- Ballantyne & Strohmayer (2004) Ballantyne D. R., Strohmayer T. E., 2004, ApJ, 602, L105
- Barret et al. (2000) Barret D., Olive J. F., Boirin L., Done C., Skinner G. K., Grindlay J. E., 2000, ApJ, 533, 329
- Bird et al. (2004) Bird A. J., et al., 2004, ApJ, 607, L33
- Burke et al. (2017) Burke M. J., Gilfanov M., Sunyaev R., 2017, MNRAS, 466, 194
- Chen et al. (2012) Chen Y.-P., Zhang S., Zhang S.-N., Li J., Wang J.-M., 2012, ApJ, 752, L34
- Chen et al. (2013) Chen Y.-P., Zhang S., Zhang S.-N., Ji L., Torres D. F., Kretschmar P., Li J., Wang J.-M., 2013, ApJ, 777, L9
- Chen et al. (2018) Chen Y. P., et al., 2018, ApJ, 864, L30
- Cocchi et al. (2010) Cocchi M., Farinelli R., Paizis A., Titarchuk L., 2010, A&A, 509, A2
- Coppi (1999) Coppi P. S., 1999, in Poutanen J., Svensson R., eds, Astronomical Society of the Pacific Conference Series Vol. 161, High Energy Processes in Accreting Black Holes. p. 375 (arXiv:astro-ph/9903158)
- Cumming (2003) Cumming A., 2003, ApJ, 595, 1077
- Degenaar et al. (2016) Degenaar N., Koljonen K. I. I., Chakrabarty D., Kara E., Altamirano D., Miller J. M., Fabian A. C., 2016, MNRAS, 456, 4256
- Degenaar et al. (2018) Degenaar N., et al., 2018, Space Sci. Rev., 214, 15
- Done et al. (2007) Done C., Gierliński M., Kubota A., 2007, A&ARv, 15, 1
- Fragile et al. (2018) Fragile P. C., Ballantyne D. R., Maccarone T. J., Witry J. W. L., 2018, ApJ, 867, L28
- Fragile et al. (2020) Fragile P. C., Ballantyne D. R., Blankenship A., 2020, Nature Astronomy, 4, 541
- Galeev et al. (1979) Galeev A. A., Rosner R., Vaiana G. S., 1979, ApJ, 229, 318
- Galloway & Keek (2017) Galloway D. K., Keek L., 2017, arXiv e-prints, p. arXiv:1712.06227
- Galloway et al. (2008) Galloway D. K., Muno M. P., Hartman J. M., Psaltis D., Chakrabarty D., 2008, ApJS, 179, 360
- Gierliński & Done (2002) Gierliński M., Done C., 2002, MNRAS, 337, 1373
- Harrison et al. (2016) Harrison F. A., et al., 2016, ApJ, 831, 185
- Ibragimov et al. (2005) Ibragimov A., Poutanen J., Gilfanov M., Zdziarski A. A., Shrader C. R., 2005, MNRAS, 362, 1435
- Ji et al. (2013) Ji L., et al., 2013, MNRAS, 432, 2773
- Ji et al. (2014a) Ji L., Zhang S., Chen Y. P., sZhang S. N., Kretschmar P., Wang J. M., Li J., 2014a, A&A, 564, A20
- Ji et al. (2014b) Ji L., Zhang S., Chen Y., Zhang S.-N., Torres D. F., Kretschmar P., Li J., 2014b, ApJ, 782, 40
- Kajava et al. (2017) Kajava J. J. E., Sánchez-Fernández C., Kuulkers E., Poutanen J., 2017, A&A, 599, A89
- Keek et al. (2018) Keek L., et al., 2018, ApJ, 855, L4
- Lewin et al. (1993) Lewin W. H. G., van Paradijs J., Taam R. E., 1993, Space Sci. Rev., 62, 223
- Maccarone & Coppi (2003) Maccarone T. J., Coppi P. S., 2003, A&A, 399, 1151
- Maciolek-Niedzwiecki et al. (1995) Maciolek-Niedzwiecki A., Zdziarski A. A., Coppi P. S., 1995, MNRAS, 276, 273
- Mayer & Pringle (2007) Mayer M., Pringle J. E., 2007, MNRAS, 376, 435
- Özel et al. (2009) Özel F., Güver T., Psaltis D., 2009, ApJ, 693, 1775
- Padmanabhan (2000) Padmanabhan T., 2000, Theoretical Astrophysics: Volume 3, Galaxies and Cosmology. Theoretical Astrophysics, Cambridge University Press, https://books.google.at/books?id=ebmzyAEACAAJ
- Revnivtsev et al. (2008) Revnivtsev M., Lutovinov A., Churazov E., Sazonov S., Gilfanov M., Grebenev S., Sunyaev R., 2008, A&A, 491, 209
- Rybicki & Lightman (2008) Rybicki G., Lightman A., 2008, Radiative Processes in Astrophysics. Physics textbook, Wiley, https://books.google.at/books?id=eswe2StAspsC
- Sánchez-Fernández et al. (2020) Sánchez-Fernández C., Kajava J. J. E., Poutanen J., Kuulkers E., Suleimanov V. F., 2020, A&A, 634, A58
- Suleimanov et al. (2011) Suleimanov V., Poutanen J., Revnivtsev M., Werner K., 2011, ApJ, 742, 122
- Swank et al. (1977) Swank J. H., Becker R. H., Boldt E. A., Holt S. S., Pravdo S. H., Serlemitsos P. J., 1977, ApJ, 212, L73
- Sztajno et al. (1986) Sztajno M., van Paradijs J., Lewin W. H. G., Langmeier A., Trumper J., Pietsch W., 1986, MNRAS, 222, 499
- Thompson et al. (2005) Thompson T. W. J., Rothschild R. E., Tomsick J. A., Marshall H. L., 2005, ApJ, 634, 1261
- Thompson et al. (2008) Thompson T. W. J., Galloway D. K., Rothschild R. E., Homer L., 2008, ApJ, 681, 506
- Thorne & Price (1975) Thorne K. S., Price R. H., 1975, ApJ, 195, L101
- Walker (1992) Walker M. A., 1992, ApJ, 385, 642
- Walker & Meszaros (1989) Walker M. A., Meszaros P., 1989, ApJ, 346, 844
- Wang et al. (2019) Wang C., Yu L.-M., Bian W.-H., Zhao B.-X., 2019, MNRAS, 487, 2463
- White & Holt (1982) White N. E., Holt S. S., 1982, ApJ, 257, 318
- Worpel et al. (2013) Worpel H., Galloway D. K., Price D. J., 2013, ApJ, 772, 94
- Worpel et al. (2015) Worpel H., Galloway D. K., Price D. J., 2015, ApJ, 801, 60
- Zdziarski & Gierliński (2004) Zdziarski A. A., Gierliński M., 2004, Progress of Theoretical Physics Supplement, 155, 99
- Zdziarski et al. (2003) Zdziarski A. A., Lubiński P., Gilfanov M., Revnivtsev M., 2003, MNRAS, 342, 355
- in ’t Zand et al. (1999) in ’t Zand J. J. M., Heise J., Kuulkers E., Bazzano A., Cocchi M., Ubertini P., 1999, A&A, 347, 891
- in’t Zand et al. (2013) in’t Zand J. J. M., et al., 2013, A&A, 553, A83