0 \vgtccategoryResearch \vgtcpapertypeplease specify \authorfooter Chen He and Giulio Jacucci are with the Department of Computer Science, University of Helsinki. E-mail: chen.he@helsinki.fi and giulio.jacucci@helsinki.fi. Luana Micallef was with Human-Centered Computing, Department of Computer Science, University of Copenhagen. Liye He and Tero Aittokallio are with the Institute for Molecular Medicine Finland, University of Helsinki. E-mail: liye.he@helsinki.fi and tero.aittokallio@helsinki.fi. Gopal Peddinti is with the VTT Technical Research Center of Finland Oy. E-mail: gopal.peddinti@vtt.fi. \shortauthortitleHe et al.: Characterizing the Quality of Insight by Interactions: A Case Study
Characterizing the Quality of Insight by Interactions: A Case Study
Abstract
Understanding the quality of insight has become increasingly important with the trend of allowing users to post comments during visual exploration, yet approaches for qualifying insight are rare. This paper presents a case study to investigate the possibility of characterizing the quality of insight via the interactions performed. To do this, we devised the interaction of a visualization tool—MediSyn—for insight generation. MediSyn supports five types of interactions: selecting, connecting, elaborating, exploring, and sharing. We evaluated MediSyn with 14 participants by allowing them to freely explore the data and generate insights. We then extracted seven interaction patterns from their interaction logs and correlated the patterns to four aspects of insight quality. The results show the possibility of qualifying insights via interactions. Among other findings, exploration actions can lead to unexpected insights; the drill-down pattern tends to increase the domain values of insights. A qualitative analysis shows that using domain knowledge to guide exploration can positively affect the domain value of derived insights. We discuss the study’s implications, lessons learned, and future research opportunities.
keywords:
Insight, interaction, interaction pattern, entity, visualization, insight-based evaluationIntroduction
Insight in visualization denote an advance in knowledge or a piece of information [defining]. Gaining insight is considered one of the major purposes of visual data exploration [understanding]. Hence, understanding the user insight generation process when using visualization tools is an important goal of visualization research [logSurvey, provenance]. For instance, Yi et al. [understanding] identified four categories of insight gaining processes through an extensive literature review: providing an overview, adjusting the level of abstraction and/or the range of selection, detecting patterns, and matching the user’s mental model of the data. Visualization can support these processes to foster insight [promoting].
As insight generation is usually aided by user interaction in visualization, Reda et al. [modeling] and Guo et al. [casestudy] explored which types of interactions foster or hinder insight via interaction logs and verbal transcripts. In this paper, instead of investigating the relations between interaction types and the quantity of insight, we seek to characterize the quality of insight by interactions.
The trend of allowing users to post comments during visual exploration (e.g., [manyeyes, voyager, insideinsights]) makes the quality of generated insights more critical than the quantity. Wang et al. [knowledge] suggested that unrelated or incorrect insights would degrade the benefits of representing insights in a visualization. However, verifying and validating diverse insights is challenging by nature [knowledge]. We suggest that the quality of insight can be relevant to the types of interactions performed. The interactions performed result from user intent [mental, analyticprove], whereas user intent may further affect the quality of insight. For instance, with the intent of taking an in-depth look at an issue, a user may retrieve the details of the data for exploration, and then the insight that the user gains may be deeply related to this issue. Thus, the interaction of retrieving details on demand is related to the depth of the generated insight based on a distinct user intent.
Gotz and Zhou [characterizing] characterized user interaction at four levels of granularity: tasks, sub-tasks, actions, and events. Tasks and sub-tasks are usually domain specific, whereas events, such as mouse clicks, have no meaning without context. In the action level, each action represents a distinct user intent, which makes actions generic across visualization tools yet semantically rich. Interaction categorization based on actions also serves our purpose of using user intent to relate interaction and insight. Furthermore, ElTayeby and Dou [logSurvey] suggested an extra level between actions and sub-tasks that consists of patterns of multiple actions to support the reuse of analysis across different applications.
This work thus explores which action or pattern relate to which aspect of insight quality via a case study. First, we redesigned the interaction of MediSyn [medisyn], a visualization tool that synthesizes five datasets of drug-target relations. MediSyn uses the concept of entities (that is, taking drugs and targets as entities) to afford five types of interactions for insight generation: 1) selecting entities of interest, 2) connecting relevant entities, 3) elaborating by retrieving the details of entity relations, 4) exploring other entities, and 5) entity-based insight sharing. We then evaluated MediSyn with 14 participants by asking them to input their tasks, freely explore the data with their tasks in mind, and derive insights by inputting notes. We graded the recorded insights on four aspects, manually extracted seven interaction patterns from the logged interactions, and analyzed the correlations between interactions and insights. The results show the potential to qualify insights by interactions. Among others findings, exploration actions tend to increase the unexpectedness of insights; the drill-down pattern can lead to insights with high domain values, which resonates with a qualitative analysis. The qualitative analysis of user strategies also uncovered that with domain-specific data, using domain knowledge to guide data exploration helps derive insights with high domain values; users tend to explore public insights when they are stuck with data exploration. We discuss the implications of this study, lessons learned, and future research opportunities.
1 Related work
The traditional task-based evaluation, which measures task time and error, hinders the assessment of the exploratory feature of visualization [toward, rome]. Researchers, therefore, proposed insight-based evaluation instead, which investigates the characteristics of insights derived from visualization tools [biology, longitudinal]. Choe et al. [selfer] and Yang et al. [composing] studied categories of insights derived from various charts, as well as the appropriate charts to use to derive these insights, to gain knowledge on building visualization tools for insight discovery and communication. Smuc et al. [score] evaluated a visualization by analyzing 1) the quantity of generated insights, 2) insight categories, and 3) relations between insights (i.e., how insights build on one another). They found that the third analysis was more informative on improving the design of the visualization tool.
However, analyzing insight alone is often limited. Looking into the insight generation process as a whole can shed more light on improving visualization design [rome]. Mayr et al. [rome] compared three evaluation methods: the task-based method, the insight-based method, and problem-solving strategies. Problem-solving strategies are extracted by analyzing thinking aloud data, eye movement data, and interaction logs. They found that the insight-based approach informs the types of insights that the tool fosters or hinders, whereas analyzing problem-solving strategies helps identify how the tool should be improved.
The key role that interaction plays in identifying the insight generation, sensemaking, and reasoning processes puts the science of interaction under the focus of the visualization community [science, sensemaking, semantic]. Pohl et al. [interactivity] studied interaction patterns extracted from logs during user visual exploration, and they found that patterns can be valid across visualizations. To support interaction pattern analysis, researchers have proposed several tools. Liu et al. [Sequences] and SensePath [sensepath] used multiple-linked views to support the pattern analysis of user online activities. Liu et al. coordinated multiple levels of granularity of web clickstream data. SensePath captures and displays user actions in temporal order. Analysts can inspect the web page, the recorded video, and the transcribed information of a selected action in other linked views [sensepath]. Blascheck et al. [VA2, datarich] proposed two visual analytics tools that integrate transcribed thinking aloud data, eye movement data, and interaction logs to assist with the analysis of user studies. These tools support the interactions such as pattern search and comparisons between participants for analysis. Blascheck et al. further used this concept to study the strategies that users employ to discover the interaction techniques available in a visualization [discovery].
Apart from interaction pattern analysis, other metrics are used to reveal new facets of people’s interaction with visualization tools. Two such metrics of exploration uniqueness and exploration pacing were proposed by Feng et al. [pace]. Battle and Heer [tableau] found that users tend to plan and execute a few steps of their interactions at a time as an exploration pace.
Recorded interaction logs can also be used to infer user tasks [behavior], to recover reasoning processes [recovering, capturing, helping], to predict task efficiency and personality traits [waldo], etc. Dabek and Caban [grammar] built a model that learned from user interactions of solving close-ended tasks and provided suggestions to new users to guide them through the same tasks. Shrinivasan et al. [Connectingthedots] proposed an algorithm that recommends related notes and concepts to users based on their line of analysis.
Previous work has significantly advanced research on evaluating visualization and understanding users by analyzing user insight or interaction. However, the interrelations between insight and interaction are under-explored. For instance, the thinking aloud data acquired by Blascheck et al. were not further analyzed and connected to insight. There are a few exceptions to this, however. Reda et al. [modeling] proposed a graph that captures transitions between users’ mental and interaction states. Each design variation generates a transition graph, which facilitates the discovery of which design variation or interaction type fosters or hinders insight. However, this method omits the effects of interaction sequences on insight generation. Guo et al. [casestudy] analyzed the correlations between the types or sequences of interactions and the quantity of insight by asking users to complete open-ended tasks using a visual analytics tool. The results showed, among others, that exploration actions promote the generation of facts, whereas filtering actions inhibit it. With a similar purpose of bridging interaction and insight, this work investigates interaction types and patterns in relation to the quality of insight.
2 Design considerations
We propose to use the notion of entities to design the interaction for insight generation, and we review the quality of insight for investigation.
2.1 Entity-based interaction design
Entities represent any real-world objects or concepts, such as people, places, and topics. To design interaction for data visualization, we found the notion of entities useful in supporting visual representation and manipulation, as stated in Klouche et al. [hypercue]. Entities can yield other related entities to support exploration; they can be organized to support pattern recognition; and they can be shared to assist in collaboration [hypercue]. These concepts have been successfully applied to various visualization tools. For instance, Pivotpaths [pivotpath] allows users to pivot on an entity to view its relevant entities in a graph. Jigsaw [jigsaw] coordinates multiple views, and each one shows entity relations from a different perspective to support pattern recognition. Bier et al. [entitycollaboration] proposed an entity workspace that allows users to organize and share their entity graphs and obtain recommendations based on their peers’ entity graphs.
The trend of allowing users to share insight during visual exploration has led to two new design considerations that we identified from previous work. First, the visualization and insight should be linked to support bidirectional exploration [insideinsights, ink]. On the one hand, data exploration should be linked to insight exploration [dynamics, voyager]. Heer et al.’s research [voyager] and InsideInsights [insideinsights] display related insights when users navigate to a visualization to which those insights refer. This can be opportunistic. Heer and Shneiderman [dynamics] later proposed the concept of data-aware annotations, which indicates applying annotations to different views of the same data. We found that entities can support this concept well. The entities that compose a view can change, whereas insights can be dynamically displayed to match the entities under exploration ( e.g., [datasite]). The other direction is exploring how to use insight to stimulate data exploration. Bier et al. [entitycollaboration] allowed analysts to discover new entities as potential interests from their peers’ entity graphs. ManyEyes [manyeyes] and InsideInsights enable restoring the visualization when the user navigates to an insight. This method, however, limits users’ ability to derive insight from relating multiple views.
We propose using entities to mediate insight and visualization exploration. For instance, the entities mentioned in the insight can be used to stimulate the visual exploration of their relations. Entities in the visualization can trigger user exploration of related insights.
The second consideration is that mechanisms should be provided to help users rationalize individual insights. Alspaugh et al. [interview] and Madanagopal et al. [practice] identified the key role of analytic provenance in helping data analysts recall, reason, and collaborate through expert interviews. But the provenance feature is not well-supported by existing tools [interview]. See Nguyen et al. [survey] and Ragan et al. [characterizingProvenance] for detailed reviews of existing research on visualizing provenance data. Provenance can be supported by enabling users to attach data sources to notes [annotationgraph, redundancy], by allowing them to manually create a trail depicting visualization or data flows [graphTrail, explates], or by automatically capturing and displaying actions [sensepath, analyticTrails, Groth, handoff] or visualization states [vistrail, model, graphical, script].
To support insight communication, some research has featured the manual construction of a knowledge graph. A knowledge graph allows users to take recorded visualization states [sensemap], to create notes [supporting], or to do both [scalable] as entities and link the entities as causal relations to communicate findings. The manual construction of a knowledge graph may allow users to flexibly map the graphs to their mental models, but this approach requires extra user effort. To provide the rationale of an insight, a trail that leads to the insight and that records semantically meaningful actions as well as their resulted visualization states is attached to the insight in our design.
2.2 Quality of insight
To evaluate insights, some research (e.g., [score, selfer, casestudy]) has classified insights by analyzing the content of collected insights. For instance, Guo et al. [casestudy] classified insights as facts, hypotheses, and generalizations. To assess the quality of insight, however, we found that it was important to look at one insight from multiple perspectives rather than simply categorizing it. North et al. [toward] characterized insight as complex, deep, qualitative, unexpected, and relevant. This is for defining insight rather than for quantifying insight for practical use. To support the practical and in-depth analysis of insight quality, Saraiya et al. [biology] characterized insight by directness versus unexpectedness, correctness, breadth versus depth, and domain values based on realistic case studies. We use this characterization to qualify insight in this paper, although previous studies that have analyzed these characteristics have not produced promising results. For example, in quantifying the domain value of individual insights, North et al. [comparison] found that only the “summary” type of insights was more valuable than the others. In Saraiya et al.’s study, most insights were the “breadth” type rather than the “depth” type. We think that this may be due to the lack of interaction types supported by the visualizations they studied. The visualizations that North et al. evaluated were mostly static, whereas the ones that Saraiya et al. studied supported mostly standard charts, such as scatter plots and histograms, which facilitated pattern recognition, but limited the user intent of drilling down into the details of individual data items. The limited support of having users elaborate on the data may cause a lack of depth in insights. This work would be the first attempt to link multiple types of interactions to these aspects of insight quality.
3 The Entity-Based Visualization Tool
The tool we used synthesizes five publicly available, manually curated drug-target datasets to assist in the research of personalized cancer therapy. Target here means point mutations in specific tumors.
3.1 Visualization design
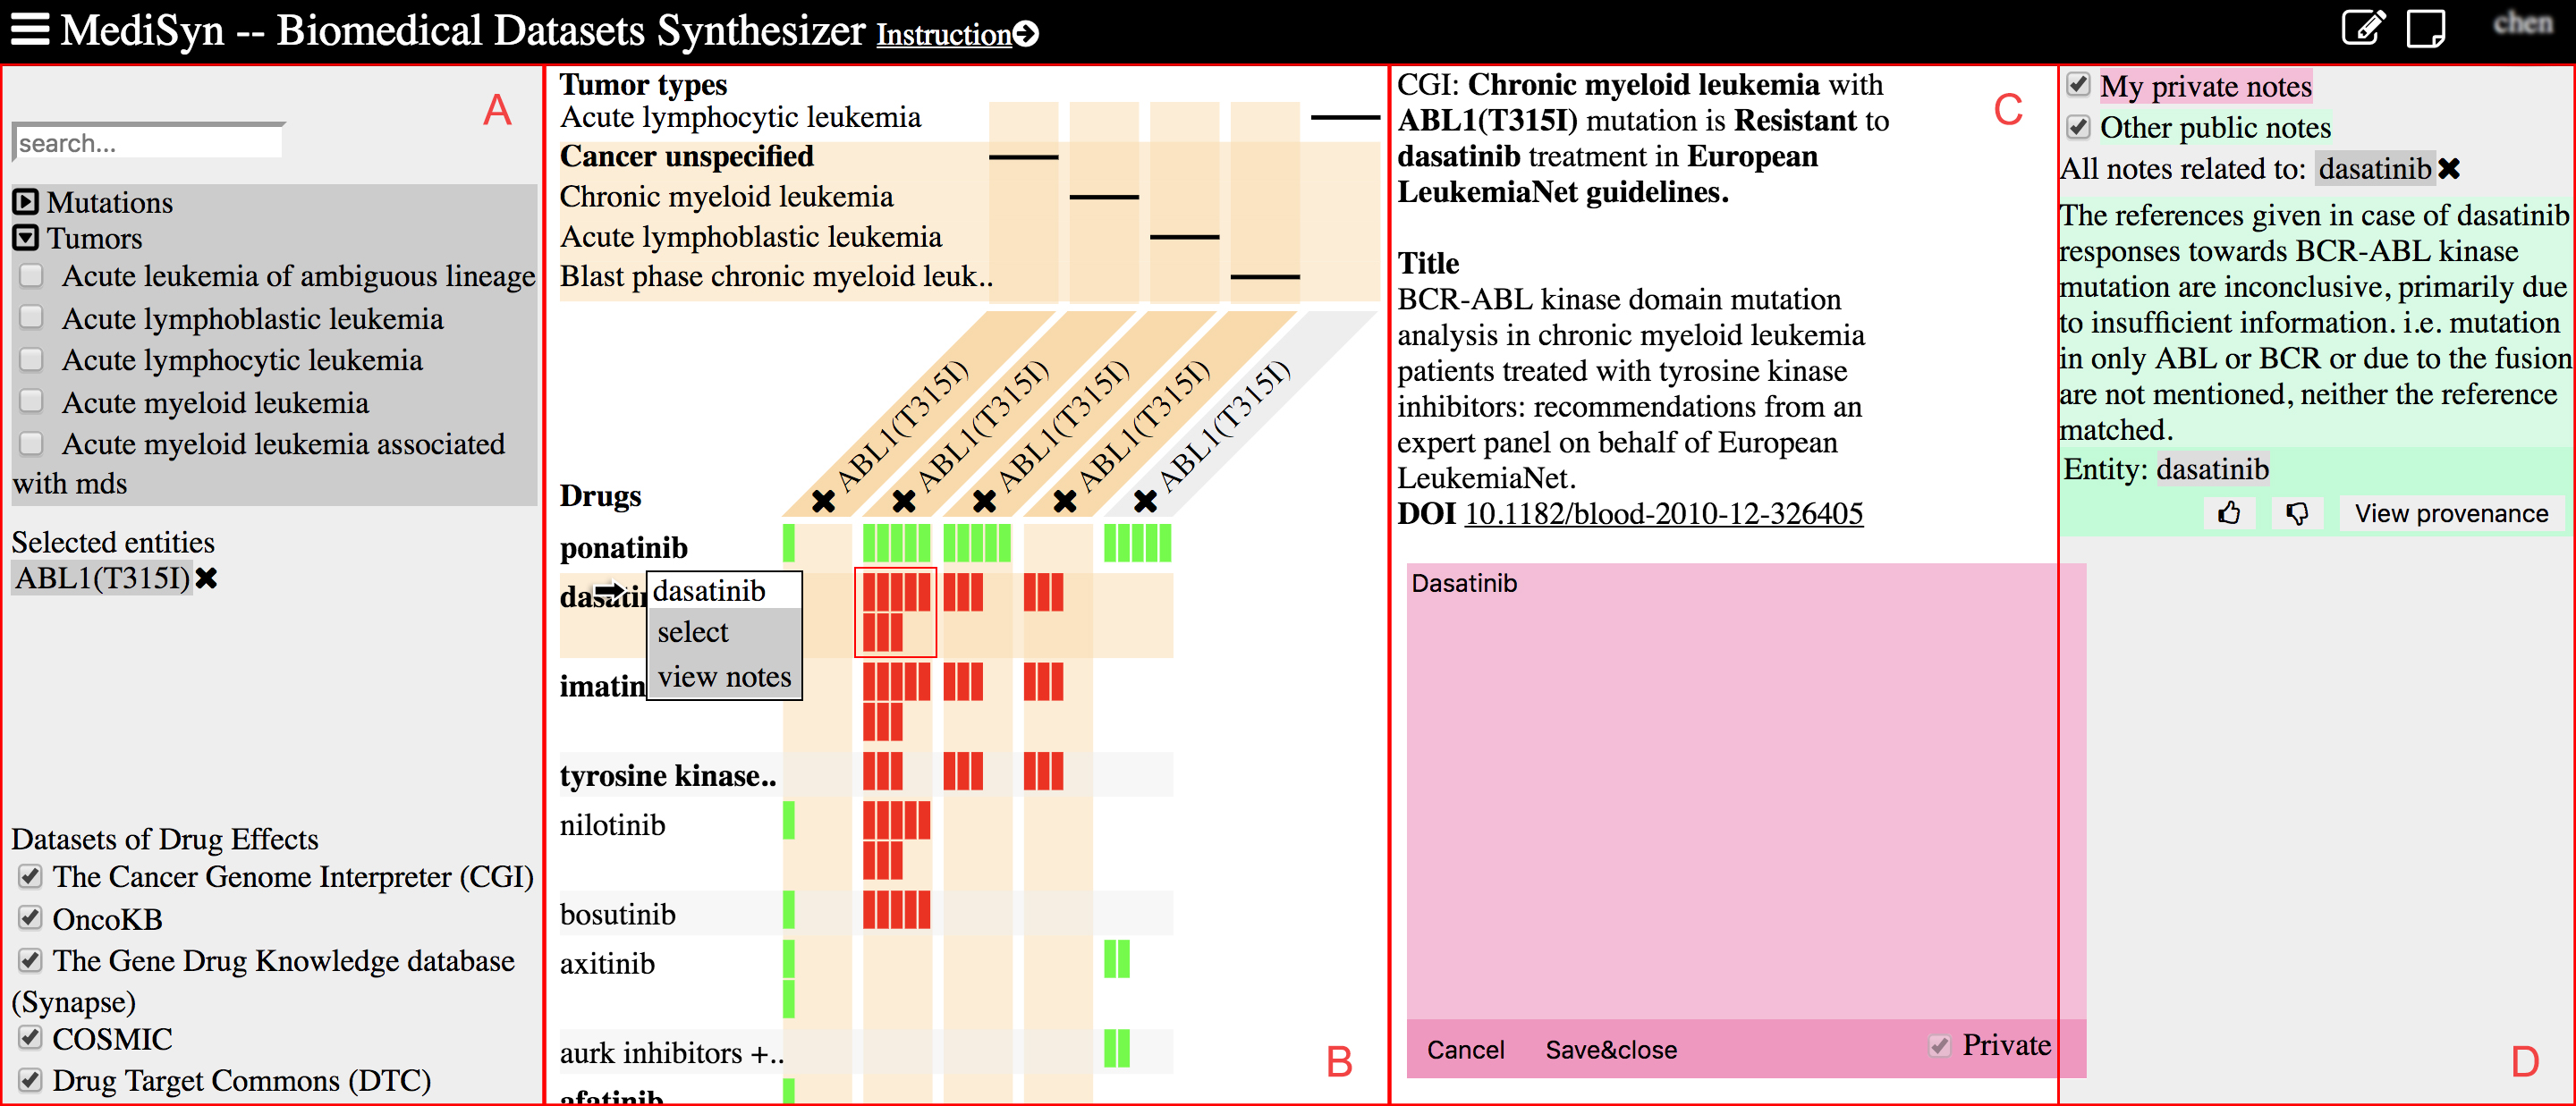
The visual encodings of data variables have been rationalized in previous work [medisyn]. MediSyn uses a matrix-based view to relate drugs, mutations, and tumors. As Fig. 1B shows, the upper rows depict tumors, the columns denote mutations, the lower rows represent drugs, and the table cells depict their relations. The horizontal line of a cell in the upper rows denotes the tumor to which the drug-target effect refers. In the lower rows, we use colored horizontal bars to depict the corresponding effects and their evidence levels. The hues represent effects. For example, the effects of responsiveness and resistance are depicted by green and red hues, respectively. The length of the bars denotes the evidence level of an effect. As validated in the previous study, MediSyn makes knowledge about genomically informed therapy accessible and evaluable to biologists [medisyn]. Based on the previous study [medisyn], we had three updates in this version:
-
•
We use discreet bar segments to ease the previous version’s perceptual difficulty of comparing the lengths of the bars across columns. From one to five segments, the bars represent ascending evidence levels from preclinical assays to guidelines, such as Food and Drug Administration guidelines.
-
•
We extended the number of datasets from two to five. The five datasets result in 427 types of drugs or drug combinations, 827 kinds of mutations, 58 kinds of cancers, and 20,887 total relations. The various datasets contain 19,299, 365, 320, 408, and 495 numbers of relations.
-
•
We use juxtaposed bars to depict values from various datasets to support comparison. The previous design, which used overlaid layers to depict data values from two datasets, is not scalable to the increased number of datasets. In this design, for instance, two juxtaposed bars of the outlined table cell in Fig. 1B depict resistant effects from two datasets with varying evidence levels.
3.2 Entity-based interaction design
To support insight generation, we redesigned MediSyn’s interaction. We present the types of interactions based on Yi et al.’s taxonomy [taxonomy]. This taxonomy categorizes interaction based on user intent, which maps to the “action” tier according to Gotz et al. [characterizing] and serves our purpose of relating interaction and insight by user intent. Additionally, we created a new type of action called “share” that indicates the user intent of exploring shared insights. We also discuss how each type of action can support insight generation.
3.2.1 Select entities of interest
Considering drugs, mutations, and tumors as entities allows users to explore the data from various aspects. As Figure 1A shows, users can select drugs, mutations, and tumors from the list to add to the view. Once a user selects an entity, its relevant entities across all datasets will be retrieved and depicted in the view for analysis. The user can deselect an entity by clicking the cross icon next to an entity (Fig. 1).
3.2.2 Connect related entities
Viewing data from various perspectives facilitates insight [understanding, science]. MediSyn allows users to center on an entity to see its connections to other entities in two ways. One is to highlight related entities by mousing over the entity, and the other is to aggregate the related entities through the reordering of rows and columns by clicking on the entity, which we call a “pivot” interaction. To be specific, when a user mouses over a drug, the columns of its relevant mutations and the upper rows of its relevant tumors are highlighted in a semitransparent orange color. When a user clicks on the drug, its relevant mutations gather to the left of the columns, which pushes the irrelevant columns to the right in animated transitions. The relevant tumors gather to the bottom of the upper rows in the same manner (Fig. 1B). The same actions also apply to the other types of entities, mutations and tumors. For the display of mutations, the same mutation can appear in multiple columns because the same mutation can appear in various tumors. When a user clicks on a mutation, it aggregates the columns of that mutation as well as its relevant drugs and tumors.
This allows the user to analyze the data from various perspectives, centering on the drug, tumor, or mutation. For example, users can focus on a drug by highlighting or aggregating relevant mutations and tumors, and they can investigate how the effects change across mutations and tumors. The users can also sequentially highlight two tumors and check how the drugs overlap.
3.2.3 Elaborate by retrieving the details of entity relations
Being able to view the data in multiple levels of granularity allows users to focus on what is important at the current moment and omit distracting information [entitycollaboration]. With MediSyn, users can retrieve details on demand for further inspection. When a user hovers over a colored bar, the corresponding drug, mutation, and tumor are highlighted, which indicates the intent of viewing an entity relation. When users click on a colored bar, they can see its details on the right side of the matrix (Fig. 1C), which includes the natural language description of the relation and the titles and digital object identifiers (DOIs) of the publication sources. Users can click on DOI links to further review the publications in a new window.
3.2.4 Explore other entities
To generate insight, users first need to collect sufficient information [sensemaking]. Exploring other entities is an effective way to do so. In MediSyn, exploring other entities is indicated by the user adding an entity to the view while attending to other information. First, in the current view, the user can add an existing entity to the view by mousing over the entity and choosing to “select” the entity through the drop-down menu (Fig. 1B). Afterward, all relevant entities will be added to the view. Second, the user can select the entity to add to the view from an insight display, as articulated next.
3.2.5 Entity-based insight sharing
The user can input an insight by clicking the upper-left paper-and-pen icon (Fig. 1). A text area resembling a sticky paper will appear. Afforded by sticky papers, the user can drag and drop the area freely on the interface and can continue to analyze the data while taking notes. By clicking the paper icon next to the note-taking icon, the user can check publicly available notes as well as one’s own notes, as shown in Fig. 1D. The user can choose to like or dislike notes by clicking the thumbs-up or thumbs-down icon, and view the provenance trail by clicking the “view provenance” button (Fig. 1D).
To support the bidirectional exploration of the insight and visualization we discussed in Section 2.1, entities mentioned in a note are automatically extracted as tags of the note and are displayed below the note itself, as shown in Fig. 1D. The user can explore the entity mentioned in the note by clicking the tag, which results in a select action. On the other hand, visual cues in the visualization imply opportunities to explore related notes without being distracted [entitycollaboration]. If an entity in the view has related notes available, it will be shown in bold (Fig. 1B). As the user hovers over the bold entity, a drop-down menu allows him or her to choose to “view notes” on part D of Fig. 1.
To help users rationalize others’ insights, each insight has a trail attached that records semantically meaningful actions leading to the insight. To construct the visualization of interaction trails, we take a description of an action together with its resulting view as a node and connect them sequentially (e.g., Appended Fig. LABEL:fig:prove). For simplicity of display, the trail will always take the action of changing the numbers of entities in the view as a starting point, such as selecting, de-selecting, and selecting an entity from a note. Sequential select and de-select actions are combined into one node. The interaction of writing the corresponding note completes the trail. In addition, hovering interaction is omitted. See Supplemental Video 1 for a video demonstration of the interaction of MediSyn. Additionally, MediSyn is accessible with a user registration at https://d4health.hiit.fi.
3.3 Use case
To illustrate the use of MediSyn, we describe a use case collected from the user study we will present later. To explore approved drugs for lung cancer, the biologist selected the entity “lung” from the left list. The selected entity and its related mutations and drugs were then displayed in the visualization. The biologist viewed the details of some relations by clicking on or hovering over colored relation bars sequentially. The relations she checked included that the lung cancer carrying mutation EGFR(T790M) was resistant to erlotinib or afatinib treatment, the lung cancer carrying BRAF(V600E) was responsive to the drug combination of “dabrafenib + trametinib” based on guidelines, and so forth. She then retrieved all available notes related to the entity “lung” cancer. The first note in the list was “Lung cancer carrying EGFR (T790M) are highly resistant to EGFR inhibitors like afatinib and erlotinib. However, combination of afatinib together with cetuximab or nimotuzumab is effective.”
The biologist continued to explore the details of several relations and highlighted three entities—“dabrafenib + trametinib,” “egfr tkis + mek inhibitors in egfr mutant,” and “egfr tkis”—to see their relations to targets. Next, she started to input the following note: “There currently are only a few approved targeted therapies for lung cancer, such as ceritinib, afatinib and erlotinib, but several more are undergoing clinical trials.” During this inputting, she retrieved all notes related to “ceritinib.” Afterward, she moused over the relation that showed that the lung cancer carrying BRAF(G469A) is resistant to egfr tkis treatment based on a case report. She then explored the existing targets of egfr tkis treatment by clicking on the entity. After clicking on a series of entities of drug combinations, including “egfr tkis + mek inhibitors in egfr mutant,” she continued to write, “Depending on a mutation, different drugs show desired potency. In particular, lung cancer carrying BRAF(G469A) mutation is resistant to egfr tkis treatment but shows response to a combination of egfr tkis and mek inhibitors in preclinical studies.” She then saved and closed the note.
| Action | Application-specific instantiations |
| Select | Select an entity of interest from the left list. |
| Connect |
Highlight entities related to an entity by mousing over the entity.
Aggregate entities related to an entity by clicking on the entity. |
| Elaborate |
Highlight a table cell depicting entity relations and its related entities by mousing over the cell.
Retrieve the details of an entity relation by clicking on a colored bar. Retrieve a publication source by clicking a DOI link. |
| Explore |
Retrieve other entities related to an existing entity by mousing over the entity and clicking “select” from a drop-down menu.
Explore an entity mentioned in a note by selecting the entity from the note display. |
| Share |
Retrieve all available notes.
Retrieve notes related to an entity by mousing over the entity and clicking “view notes” from a drop-down menu. View the provenance view of a note. Like or dislike a note. |
4 User study
To investigate the research question—which action or pattern relate to which aspect of insight quality—and explore user strategies of deriving insight using MediSyn, we conducted a lab study.
4.1 Participants
In total, we recruited 18 paid participants from a research institute related to personalized cancer therapy. Two were recruited for a pilot study whose research topics were machine prediction of drug-target interactions. The remaining 16 were recruited for the lab study, but two quit in the middle of the experiment, as one was interested in mutation frequencies in cancer, not drug-target interactions, and the other, a junior researcher, stated she was not able to write notes. The remaining 14 participants ( mean age: 31.36; SD: 5.11; female: 5) had sufficient knowledge to analyze the data. Among them, eight were doctoral students, four were postdoctoral researchers, one was a master’s student, and the last was a senior researcher. Their specific focus areas differed. For instance, one focused on lung cancer, another specialized in ovarian cancer, two had expertise in leukemia, and one was studying multiple melanoma and leukemia. Others focused on drug discovery or translational medicine research and did not explicitly point out diseases of focus.
4.2 Pilot study
The purpose of the pilot study was to collect public notes and to have pilot participants go through the procedure of the actual study. The two pilot participants followed the same procedure as in the lab study, as we describe next. However, their task differed from that of the lab study. They were encouraged to write as many notes as they could and to post them publicly. If they reached a certain quantity of qualified notes, they could get higher amounts of compensation. A qualified note was considered a useful observation on the data and had to contain at least one entity name. As the participants were instructed, the published notes were anonymous to other users to avoid the influence of user identity on the experiment. The pilot study was conducted in the participants’ own offices with use of their own computers.
We collected 40 public notes from the pilot study. Another domain expert, one of the authors, screened through these notes and selected 27 as public notes for the lab study. The remaining were screened out because they were either simple observations of drug-target relations for the visualization or purely based on domain knowledge and disconnected from the visualized data. Accordingly, we updated the description of a qualified note for the lab study, which we present next. On average, the public notes contained 3.74 different entities each (SD: 2.26).
4.3 Lab study
The lab study started with a training session. Participants first walked through the functionalities of MediSyn by following a step-by-step interactive tutorial we created using Intro.js [intro]. In total, the tutorial consisted of 12 interactive steps. In each step, the participants carried out 1-2 interactions following the instructions and clicked the “next” button to move to the next step until they finished the tutorial. After this process, they were instructed to create accounts in MediSyn and to freely explore the tool until they were satisfied. They were encouraged to ask the experimenter questions during the training session. The training session took around 20 minutes.
In the actual study, the participants were instructed to first input a task by opening a dialog box. Then they could freely explore the interface with the task in mind and write notes. Whenever they changed tasks, they could open the dialog box, input a new task, and continue to explore that new task. We provided some open-ended task examples to help participants start, such as “to investigate ** disease” and “to explore effective drugs for ** tumor.” They each could finish the experiment when they thought they had written at least five qualified notes. The requirements for a qualified note were as follows: i) it was a useful observation, such as one’s findings, hypotheses, or generalizations, on the underlying data based on one’s domain knowledge (a simple observation of a drug and cancer mutation relationship from the visualization, for example, not being a useful note); and ii) it included at least one entity name, such as the drug, tumor type, and/or mutation.
During the experiment, we logged user interactions and recorded the screen and voice of each participant with the participants’ consent. We did not establish time constraints for the study. Participants were only able to post private notes, and their likes and dislikes of notes were visible only to themselves, as they were instructed.
After the experiment, participants filled out a questionnaire regarding their subjective feedback about MediSyn. The entire experiment took around 1-1.5 hours. The lab study was conducted using a Chrome browser in full-screen state on a 27-inch display with an external mouse and keyboard. The display resolution was 2,560 * 1,440 pixels.
4.4 Measures
To investigate the research question, we logged types of interactions, time stamps and entities related to each interaction, and the user inputs of the tasks and notes. Hovering interaction was recorded when data were highlighted for more than three seconds.
We then constructed interaction trails from the logged sequential interaction data. The trails we collected always started with an entity-selection action, either from the list or from the public notes. De-selecting all entities, or sequentially selecting and de-selecting entities to yield a completely different set of selected entities, marked the start of a new trail. In each trail, the last note-writing action indicates the end of the trail, as we are interested in actions that lead to insight.
We also manually extracted interaction patterns from the interaction trails. An interaction pattern here denotes a sequence of actions consisting of at least two types of actions. To extract patterns, we considered not just the sequential relations of actions but also the entities on which the participants operated. For instance, suppose a user were to start from select actions, then retrieve the details of an entity relation, and then connect entities by pivoting on one entity. If entities in the connect action did not appear in the previous elaboration action, then we would have counted two patterns, as select – elaborate and select – connect. Otherwise, we would have counted this as one pattern: select – elaborate – connect. After extracting all patterns from the trails, we took the patterns performed by at least two participants as candidate patterns for further analysis.
| Characteristics | Grading criteria |
| Directness versus Unexpectedness |
Give 1-2 if the note is related to the task.
Give 4-5 if the note goes beyond the task description. Give 3 if the note is in between. |
| Correctness |
Give 1-2 if the note is verified to be wrong through the visualization or Internet.
Give 4-5 if the note is verified to be right through the visualization or Internet. Give 3 if the correctness is difficult to discern. |
| Breadth versus Depth |
Give 1-2 if the note refers to relations of mutation groups, multiple tumor types, and/or drug groups.
Give 4-5 if the note refers to one or more specific relations of drugs and mutations. Give 3 if the note is in between. |
| Domain value |
Give 1-2 if the note is a simple observation from the visualization, such as one drug-target relation or a missing value.
Give 1-3 if the note complements missing information with domain knowledge. Give 3-5 if the note reveals patterns across the visualization. Give 4-5 if the note derives hypotheses from the visualization. |
4.5 Assessing notes
We collected 86 notes from the study. Removing 27 notes, 25 of which were data requests (notes such as “FAM46C mutation is quite frequent in Myeloma. Can’t find any information in the database.”) and two of which were user interface suggestions, we took the remaining 59 notes as insights. As stated in Section 2.2, following Saraiya et al. [biology], we characterized the insight quality by directness versus unexpectedness, correctness, breadth versus depth, and domain value. Two experts, also authors of this paper, first agreed upon detailed grading criteria (Table 2) and then graded the notes on the four aspects from 1 to 5 independently. For instance, directness versus unexpectedness indicates a spectrum (1 to 5) of one insight quality, where grade one indicates direct insights, and grade five denotes unexpected insights. Directness versus unexpectedness was assessed by the relation of an insight to the user-inputted task. Direct insights related to user tasks, whereas unexpected insights were exploratory and went beyond user tasks. Note that a task could have zero or multiple notes. We assigned a note to the last inputted task, as participants were instructed to do.
Correctness indicates whether the insight can be verified or not. If the insight was a hypothesis, we assessed the rationale for the derivation of the hypothesis. Breadth versus depth relates to the scope of the insight. Broad insights refer to multiple entities or entity groups, whereas deep insights relate to a specific aspect of an entity or entity relation. A domain value ranges from low for simple observations to high for pattern recognition and hypothesis derivation.
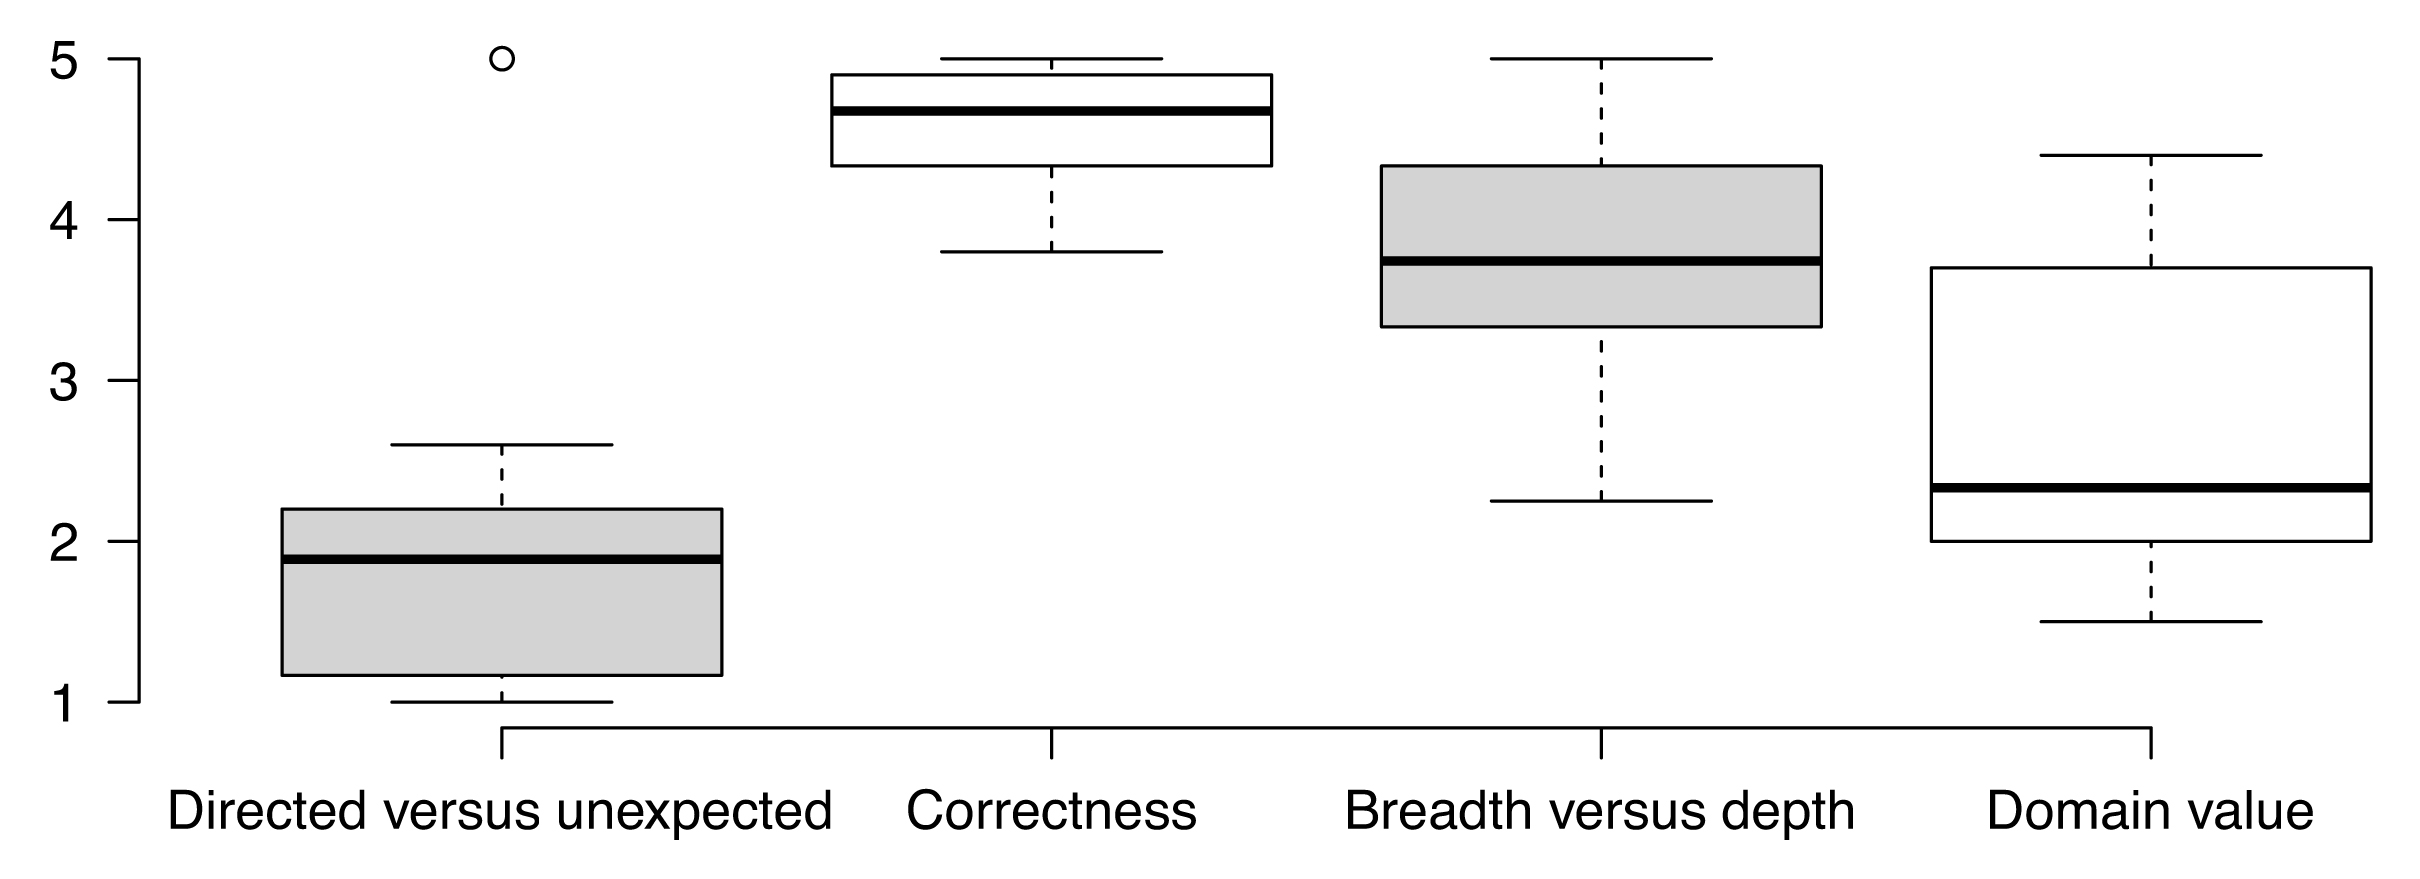
Kendall’s tau-b association test shows a correlation between two raters (p 0.01). The tau-b values for the characteristics grading of directness versus unexpectedness, correctness, breadth versus depth, and domain value are 0.415, 0.290, 0.423, and 0.245, respectively. Then, for grades differing by more than one point, two raters had a discussion to either change the score or keep their original values. Finally, we took the average of the grades from two raters as the final grades. The distribution of grades of individual characteristics averaged across participants is shown in Fig. 2. The insights we collected tended to be direct rather than unexpected, which we discuss in Section LABEL:sec:evaluation.
We computed the correlations between each pair of characteristics. Two moderate-to-strong correlations existed between the domain value and correctness of insights (r = -0.573, p = 0.032), and the domain value and breadth versus depth of insights (r = -0.607, p = 0.021). The correlations were not statistically significant after the Bonferroni p-value adjustment. Considering all the insights we collected were correct, we could skip the first correlation. However, the second correlation hinted that broader insights tended to have higher domain values in our assessment.
| Directness versus Unexpectedness | |
| Exploration action (Mean: 0.07, SD: 0.10) | = 0.384, p = 0.064, CI [0.0127, 0.7137] |
| Explore – (connect) – elaborate (Mean: 0.09, SD: 0.13) | = 0.489, p = 0.024, CI [0.1800, 0.7574] |
| Explore – connect (Mean: 0.15, SD: 0.18) | = 0.375, p = 0.076, CI [-0.0132, 0.6805] |
| Select / Explore – share (Mean: 0.11, SD: 0.13) | = 0.326, p = 0.126, CI [-0.0977, 0.7686] |
| Number of interactions (Mean: 13.57, SD: 11.87) | = 0.363, p = 0.079, CI [-0.0749, 0.8049] |
| Breadth versus Depth | |
| Elaboration action (Mean: 0.14, SD: 0.15) | = 0.262, p = 0.202, CI [-0.1707, 0.6110] |
| Explore – (connect) – elaborate (Mean: 0.09, SD: 0.13) | = 0.462, p = 0.033, CI [0.0679, 0.7923] |
| Domain value | |
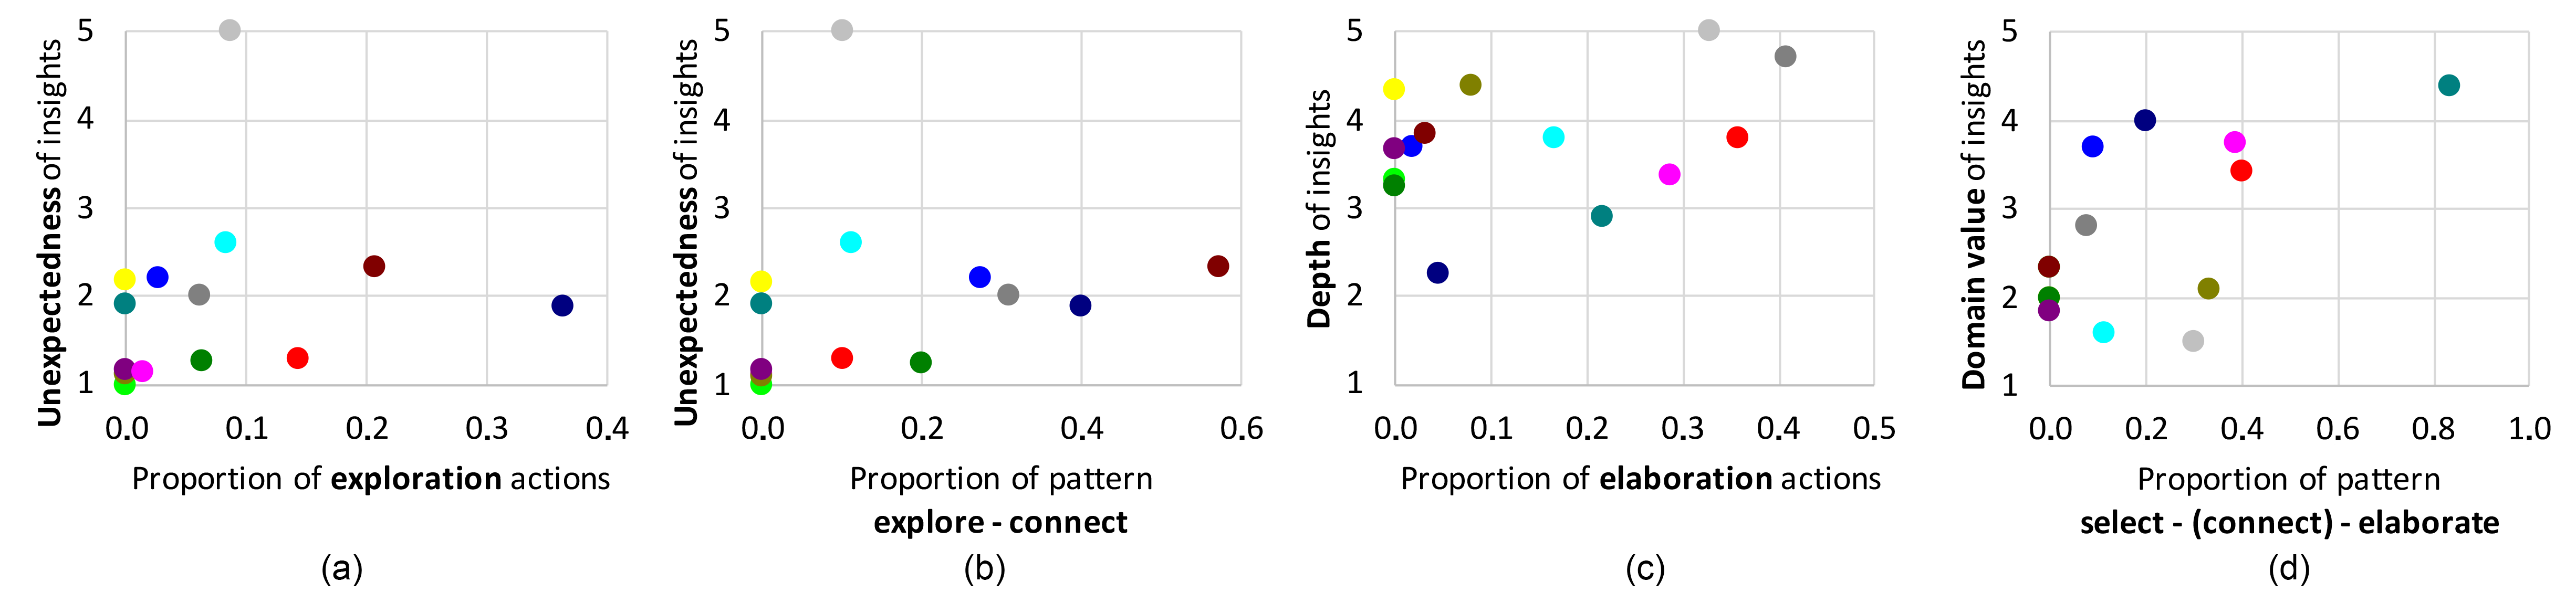
| Select – (connect) – elaborate (Mean: 0.20, SD: 0.24) | = 0.365, p = 0.081, CI [-0.1056, 0.7754] |
| Number of interactions (Mean: 13.57, SD: 11.87) | = 0.256, p = 0.207, CI [-0.1950, 0.6387] |
4.6 Results
In total, we collected 37 trails, leading to the 59 insights (Appended Fig. LABEL:fig:trail). Some trails were short, such as “select, select, and write a note,” whereas some others could be as long as 60-70 interactions. Some participants wrote multiple notes in one exploration trail, whereas others wrote one note in each trail.
4.6.1 Interaction patterns
Interaction patterns indicate higher-level user intents that can be accomplished by carrying out multiple actions [behavior]. The following seven patterns resulted from the study. We named the patterns by the implied user intents. Each action in the pattern can contain arbitrary numbers of the action in succession.
-
•
Drill-down: select – (connect) – elaborate. The participants selected an entity or entities from the list, explored entity relations in the view, and then elaborated on certain entity relations. The connect action in this pattern could be zero or more. It was also possible for the participants to carry out the combination of connect – elaborate in succession multiple times. This pattern featured drilling down into the data of interest. In total, nine users used this pattern.
-
•
Scanning: select – connect. The participants selected entities from the list and then explored entity relations through connect actions. Differently from the previous pattern, in this pattern, participants did not dig into the details of entity relations. Thus, the count of this pattern excludes the count of the previous pattern. Eleven participants’ trails contained this pattern.
-
•
Sampling: explore – (connect) – elaborate. Compared with the first pattern, rather than merely selecting entities from the list, in this pattern, the participants added an entity or entities to the view through exploration actions, then carried out connect and elaborate actions. Similarly to the first pattern, connect actions existed zero or more times, and the combination of connect – elaborate actions could recur in succession. This pattern featured exploring and drilling down into the details of other interesting data. Six participants used this pattern.
-
•
Probing: explore – connect. The participants added an entity or entities to the view by selecting from the existing view or the note display and then explored the entity relations through connect actions. Similarly to the scanning pattern, the count of this pattern excludes the previous pattern. This pattern existed in eight participants’ trails.
-
•
Expanding: select – elaborate – connect. The participants selected some entities, then elaborated on certain entity relations, and ultimately switched to connect entities in the view. Differently from the first pattern, in this pattern, the participants transitioned from the details of interest to a broader view of data relations. Only three participants used this pattern.
-
•
Referencing: select / explore – share. The participants selected or added entities to the view and then explored notes related to certain entities in the view. Seven participants used this pattern.
-
•
Annotating: select – write. The participants selected some entities and wrote notes directly without further exploration. Seven participants performed this sequence of actions.
Referring to previous work, which also extracted action patterns [casestudy, behavior, interactivity], we found two common patterns. The drill-down pattern proposed by Gotz and Wen [behavior] features users’ intent of narrowing down the analytic focus to a targeted subset of items, which corresponds to the pattern of select – (connect) – elaborate in this work and the locating pattern in Guo et al. [casestudy]. The pattern of explore – (connect) – elaborate was also discovered by Pohl et al. [interactivity] and Guo et al., the latter of whom led us to name the sampling pattern. But for an application, specific actions or patterns can dominate. For instance, a visualization that provides an overview of the data first and allows users to filter the data of interest may not result in the pattern starting with select actions. We thus suggest that the patterns we extracted from the study are specific to a type of applications.
4.6.2 Relations between interaction and insight
To investigate the research question, we took the proportion of each action and pattern from each participant for analysis. The insight characteristics were averaged on each participant. As we considered de-select actions “passive” reactions to select actions, we did not count them in the analysis. We omitted too the expanding pattern due to insufficient data, as well as the insight correctness, because it might have been affected by the user interpretation of the visual encodings. In the analysis, we did not provide hypotheses on the relations of the interaction types and insight characteristics, but rather we investigated each pair to find interesting and noteworthy relations. Depending on whether the values were normally distributed or not via the Shapiro-Wilk test, we calculated Kendall’s tau-b or Pearson’s correlation to explore their relations. Except for the actions of select and connect, all other actions and patterns were positively skewed. We report all moderate to strong relations in Table 3. The p-values should be compared with the Bonferroni-corrected value of 0.003 due to multiple comparisons.
Exploring other interesting entities can lead to unexpected insights. Among the 14 participants, nine used exploration actions leading to an insight. Only two users explored entities from the note display. Kendall’s tau-b test shows a correlation between exploration actions and the unexpectedness of insights ( = 0.384, p = 0.064, Fig. 3(a)). In addition, two other correlations exist between the unexpectedness of insights and the sampling pattern ( = 0.489, p = 0.024), as well as the probing pattern ( = 0.375, p = 0.076, Fig. 3(b)).
Ten participants checked other notes through the visualization. Among them, three participants checked the provenance views of notes. We expect that the action of exploring other notes may lead to unexpected insights, but no correlation is found ( = 0.148, p = 0.471). However, a moderate correlation exists between the referencing pattern and the unexpectedness of insights ( = 0.326, p = 0.126).
Moreover, a correlation exists between the number of total interactions and the unexpectedness of insights ( = 0.363, p = 0.079). It is not so surprising that the more interactions the user carries out, the stronger the tendency is for the insights of that user to go beyond the initial task.
Select actions have a moderate but not statistically significant correlation to the directness of insights. Select actions were used the most (Mean: 0.41, SD: 0.30). We expect that select actions might relate to the directness of insights because with a clear intent in mind, the user might directly select the entities of interest to look up the answer, and consequentially, the answer that he or she gets may be directly related to the task.