The host galaxy of OJ 287 revealed by optical and near-infrared imaging
Abstract
The BL Lacertae object OJ 287 (z = 0.306) has unique double-peaked optical outbursts every 12 years, and it presents one of the best cases for a small-separation binary supermassive black hole (SMBH) system, with an extremely massive primary 10.3. However, the host galaxy is unresolved or only marginally detected in all optical studies so far, indicating a large deviation from the bulge mass - SMBH mass relation. We have obtained deep, high spatial resolution i-band and K-band images of OJ 287 when the target was in a low state, which enable us to detect the host galaxy. We find the broad-band photometry of the host to be consistent with an early type galaxy with and , placing it in the middle of the host galaxy luminosity distribution of BL Lacertae objects. The central supermassive black hole is clearly overmassive for a host galaxy of that luminosity, but not unprecedented, given some recent findings of other “overmassive” black holes in nearby galaxies.
1 Introduction
Spheroidal galaxies and galactic bulges harbor central supermassive black holes (SMBH), and there is a fundamental tight relation between the SMBH mass and the bulge luminosity (mass), both in quiescent and active galaxies Gültekin et al. (2009); Kormendy & Bender (2011); Sanghvi et al. (2014). Methods to measure the central BH mass include stellar and gas kinematics (e.g. Gebhardt & Thomas, 2009), megamasers (e.g. Kuo et al., 2011), reverberation mapping (e.g. Kaspi et al., 2000) and emission line widths in quasars (e.g. Decarli et al., 2012; Sanghvi et al., 2014). Given that galaxy mergers are thought to be common, especially at high redshift (e.g. Somerville et al., 2008), it is reasonable to expect that double, even multiple BH systems form in galactic nuclei.
The BL Lacertae object OJ 287 (z = 0.306) presents one of the best cases for a small-separation SMBH binary system (e.g. Valtonen et al., 2008), another examples being SDSS J120136.02+300305.5 (Saxton et al., 2012; Liu et al., 2014) and possibly GSN 069 (Miniutti et al., 2019). Its historical light curve is unique among active galaxies, due to the prominent recurring double-peaked optical outbursts every 12 years. Each outburst consists of two rapid brightenings, separated by 1 year and lasting 6 weeks (Sillanpaa et al., 1996; Valtonen & Pihajoki, 2013). A notable feature of the outbursts is that they are not strictly periodic, nor is the separation of the two peaks constant from one outburst to the next. This behavior is attributed to strong precession of the secondary’s orbit in the model. We also note that the redshift of OJ 287 is secure, based on the detection of several clearly identifiable emission lines (e.g. Nilsson et al., 2010).
The binary BH model of OJ 287 is very successful in reproducing the previous outbursts, and it makes specific predictions about future outbursts. It is extremely unlikely that a single BH model would produce such good light curve predictions as the binary BH model has done (Valtonen et al., 2011). In the binary BH model, the best-fitting orbital parameters correspond to mass of the primary BH: M = 1.84 1010 , and mass of the secondary BH: m = 1.30 108 . Notably, the primary SMBH is at the high mass end of the quasar BH mass function (e.g Vestergaard et al., 2008; Portinari et al., 2012).
If OJ 287 contains an extremely massive primary BH, and if it follows the tight BH - bulge relation of active galaxies (e.g. Dotti et al., 2012), its host galaxy is also expected to be extremely luminous and massive. Puzzlingly, there have only been marginal or non-detections of the host galaxy of OJ 287 based on optical imaging (Benitez et al., 1996; Wurtz et al., 1996; Yanny et al., 1997; Heidt et al., 1999; Urry et al., 2000; Pursimo et al., 2002; Nilsson et al., 2003). The reported host luminosities in these studies are MR -23.5, much fainter than expected from the BH–bulge relation, MR -26). Converting the host galaxy absolute magnitudes into stellar mass by adopting the M/L of a single stellar population originated at z(burst) = 5 and passively evolving down to z = 0 (Decarli et al., 2010), these luminosities translate into host galaxy mass in the range of = 11.4–11.9, much smaller than the expected host galaxy mass based on the BH–bulge relation, 13. Conversely, based on the marginal host galaxy detections in the optical, if OJ 287 follows the BH–bulge relation, the primary BH mass is only = 8 – 9. Interestingly, this value is within the range of typical BH masses for BL Lac objects (Falomo et al., 2003; Plotkin et al., 2011), but much smaller than required in the binary SMBH model.
There is a reported near-infrared (NIR) detection of the host galaxy of by Wright et al. (1998), who found for the host galaxy to be extremely bright, = -28.9 0.6. Transforming this to our cosmology we obtain = -28.5 0.6. With this luminosity, OJ 287 would fall exactly on the host galaxy luminosity - SMBH mass relation. However, the implied color of the host galaxy, R - K = 6.1 , would be much redder than in a typical elliptical galaxy (R - K = 2.7). We note that the data were taken with one of the first generation NIR imagers (IRCAM 62 58 px) and that they could not resolve the host galaxy in the R-, J- or H-band with observations under similar seeing conditions and with similar exposure times as in the K-band. Furthermore, the relatively poor spatial resolution (0.3-0.6 arcsec pixels and 0.9-1.3 arcsec seeing) and poor definition of the PSF severely limit their accuracy.
In this paper we present new observations, which enable us to detect the host galaxy of OJ 287 both in the optical and in Near-IR. This enables us to constrain the host galaxy luminosity further and to shed some light into some conflicting results obtained so far. In all calculations w e use the cosmology km s-1 Mpc-1, and = 0.33.
2 Observations and data reduction
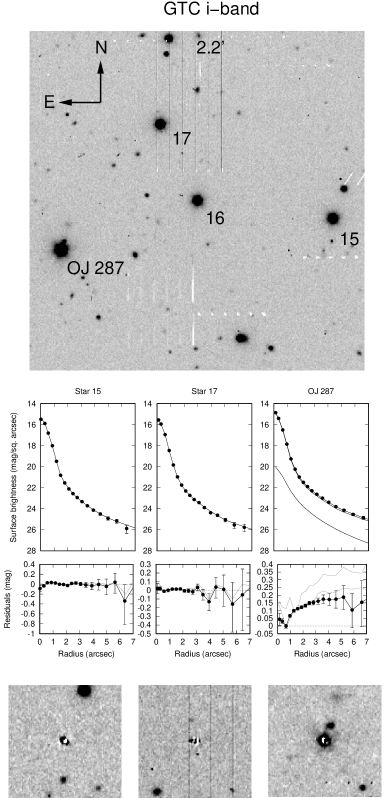
OJ 287 went into a deep minimum in November 2017, fading to R 15.8 (S. Zola, priv. comm.), which is about 1 mag fainter than on average between the flares. We exploited the favorable AGN/host brightness ratio by obtaining a deep SDSS i-band image at the Gran Telescopio Canarias (GTC) on the night of Dec 2, 2017 when OJ 287 was already coming up from the minimum, but still about R 15.2. We obtained 77 exposures of 1.5 seconds with the OSIRIS instrument with a pixel scale of 0.254 arcsec/pix, totalling in 115.5 seconds of exposure. The images were bias subtracted and flat-fielded with twilight flats and registered using stars in the field of view. The images were then co-added and deviations from an uniform background were removed by fitting a low-order polynomial to the background pixels and subtracted. The co-added image has a FWHM of 0.78 arcsec. Calibration of this image was obtained through stars 15 and 16 in González-Pérez et al. (2001) using SDSS DR14 published magnitudes. The zero points derived from these two stars differed by 0.01 mag.
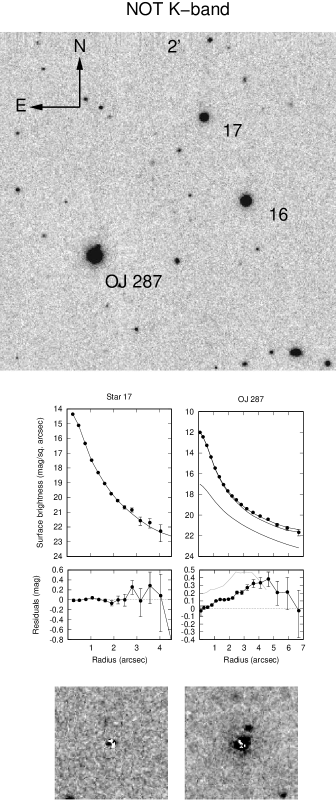
Ks-band observations were obtained at the 2.5 m Nordic Optical Telescope (NOT), La Palma, during the night of December 18, 2012. At this epoch OJ 287 was also at relatively low state at R 15.4. We used the 1024 1024 pixel NOTCam detector in imaging mode with a pixel scale of 0.235 arcsec px-1, giving a field of view of 4 4 arcmin2. The seeing during the observations was 0.8 arcsec. The images were acquired by dithering the target across the array in a random grid within a box of 20 arcsec, and taking a 14.4 sec exposure at each position. Individual exposures were then co-added to produce the final frame. A total of 237 exposures of 14.4 sec were acquired, which provided a total exposure time of 3412 sec.
Data reduction was performed using IRAF111IRAF is distributed by the National Optical Astronomy Observatories, which are operated by the Association of Universities for Research in Astronomy, Inc., under cooperative agreement with the National Science Foundation. and followed the procedure described in Kotilainen et al. (2007) and Hyvönen et al. (2007). In each image, bad pixels were corrected for using a mask made from the ratio of two sky flats with different illumination levels. Sky subtraction was performed for each science image using a median averaged frame of all the other temporally close frames in a grid of eight exposures. Flat fielding was performed using normalized median averaged twilight sky frames with different illumination levels. Finally, images were aligned to sub-pixel accuracy using field stars as reference points and combined after removing spurious pixel values to obtain the final reduced co-added image.
For photometric calibration, we used stars 16 and 17 in González-Pérez et al. (2001), imaged simultaneously with the science observations. The zero points derived from these two stats deviate 0.03 mag from each other, which is 1 difference considering the error bars in González-Pérez et al. (2001). Possible small systematic error may remain due to the deviation of OJ 287 spectrum from a stellar spectrum and from the fact that González-Pérez et al. (2001) list K-band magnitudes and we used the Ks-band filter.
3 Analysis
We analyzed the images by fitting two-dimensional surface brightness models to the observed light distribution of OJ 287. The models consisted of two components, an unresolved AGN nucleus and a host galaxy. The former was described by three parameters, x-y position and the flux in mJy and the latter by four parameters, x-y position, flux and effective radius. Given that the host galaxy is very weak and difficult to detect, we abandoned attempts to characterize it in more detail. Therefore, the host was assumed to be a early-type galaxy with Sérsic index equal to 4 and zero ellipticity. These assumptions are quite reasonable since BL Lac nuclei are almost exclusively found in giant ellipticals with Sérsic indices concentrated around (e.g Falomo et al., 2000; Nilsson et al., 2003). On the other hand, given the special nature of OJ 287, it may not be hosted by an “ordinary” galaxy. We will discuss this point later.
The faintness of the host galaxy and the inevitable errors in the PSF model make it very difficult to reliably establish any offset FWHM between the host and the AGN nucleus. We thus assume that the AGN nucleus is centered on the host galaxy. The total number of parameters is therefore 5: AGN/host , AGN/host , AGN flux, host galaxy flux and host galaxy effective radius.
Prior to fitting, we performed three critical steps: masking, sky background subtraction and PSF construction. Firstly, we masked out any pixels with visible contribution from targets other than OJ 287. Then we determined the sky background by measuring the average pixel brightness in 10 rectangular clean areas around OJ 287, and then computing their average. We then checked the obtained sky value by plotting line and column cuts near OJ 287, looking also for any slope in the background that might have remained from previous steps.
| Band | PSF star | PSF star mag | mAGN | mhost | re |
|---|---|---|---|---|---|
| (mag) | (mag) | (mag) | (arcsec) | ||
| i | 15 | 15.49 | 14.83 0.01 | 18.71 0.09 | 1.3 0.2 |
| 16 | 15.67 | 14.92 0.01 | 18.30 0.05 | 1.4 0.2 | |
| 17 | 15.60 | 14.82 0.01 | 18.73 0.10 | 0.9 0.1 | |
| Ks | 16 | 13.13 | 11.96 0.01 | 15.27 0.08 | 1.5 0.3 |
| 17 | 14.02 | 12.19 0.02 | 14.25 0.10 | 0.5 0.1 |
Obtaining a good PSF was complicated by the fact that OJ 287 was 2 times brighter than any star in the field of view in both bands. This means that using a stellar image directly as the PSF model does not work very well; the noise in the PSF image gets amplified when the PSF is scaled to the brightness of OJ 287 and both the fit and the residuals become very noisy. Analytical models are noise-free and therefore don’t have this problem. However, stellar images give a more accurate PSF models than analytical models, so they are to be preferred, if possible.
Since the PSF is often a function of the position on the detector, we constructed PSF models of several stars in the field of view. More specifically we used stars 15, 16 and 17 in the i-band and 16 and 17 in the K-band. We first fitted an analytical model consisting of two Moffat profiles to the stars. Subtracting this model revealed some asymmetric features plus the diffraction pattern from the secondary mirror support. These residuals were filtered using a wavelet-based multiscale filtering technique (Murtagh & Starck, 1998), which recovers any significant signal in the residual image with high fidelity. This filtered image was then summed to the analytical model. In this way we obtain a low-noise PSF image, which accurately preserves the deviations from perfect symmetry.
The model fits were made with an affine-invariant Monte Carlo Markov Chain (MCMC) ensemble sampler (Goodman & Weare, 2010). The posteriori probability distribution was first sampled using this sampler with multiple walkers. The number of walkers was equal to three times the number of free parameters. We used Gaussian priors which were not very restrictive, but nevertheless rejected unreasonable parameter values, like for example parameters which would place the model several pixels away from the observed position. The host galaxy priors we especially carefully constructed so that the priors would not dominate the fit over data. Typically 5000-10000 iterations we made during each fit. After the sampler had finished, we checked that the success rate for most of the walkers was close to 50%. Then the marginalized histograms for each parameter were extracted and the best-fit parameter values and their errors were derived by fitting a Gaussian to these histograms.
The following noise model was used to compute the likelihood: A pixel with a brightness of ADUs had an associated uncertainty
| (1) |
where
| (2) |
is the photon and readout noise term, where is the effective gain, the effective readout noise and is a constant ( 1.2 in this case) taking into account the smoothing caused by interpolation when the images were registered. The term
| (3) |
where is the background rms and is a constant parametrizing our estimate of the background accuracy. Here we use . The last term represents the PSF uncertainty and it is obtained from
| (4) |
where is a constant, whose value was determined during the fit process (see below). This PSF error model, while simplified, captures one crucial aspect, namely that that far from the PSF center the sky uncertainty dominates the PSF error, whereas close to the PSF core, other factors dominate.
The fit proceeded as follows: First the value of was determined in both bands by fitting a pure point source model to a star in the field. We used stars 15 and 17 in the SDSS i-band and star 17 in the Ks band. This fit had four free parameters, , , flux and . This fit yielded and 0.06 for the SDSS-i and Ks-bands, respectively. Then we fitted OJ 287 with the 5 parameter model keeping the value constant.
4 Results
The results of model fitting are summarized in Table 1 and Fig. 1. There is a small but significant excess over the PSF in both bands, visible in both the 1-d profiles and in the 2-d residuals. This excess is best visible in the lower portion of the middle panel, which shows the residuals after subtracting the scaled PSF. Since the host galaxy is finite in size, we expect these residuals to tend towards zero at distances of a few effective radii, about 3-5 arcsec in case the of OJ 287. In the K-band the excess starts to turn down at arcsec, but in the r-band there is no clear turning.
However, none of the stars show any hint of an excess. Furthermore, far from the center, the error bars are dominated by the uncertainty of the sky level, which affects all points similarly. For instance, if the sky level is increased by 1 sigma, the residual plots would follow the lower ends of the error bars. Thus within one sigma sky uncertainty a turning down is possible in both bands. Thus we conclude that there is a excess of light around OJ 287 with respect to the stars in the vicinity, but this excess is rather weak and difficult to characterize.
Modeling the excess as a de Vaucouleurs profile, we obtain the values in Table 1. Two things can be read from this table. Firstly, changing from one PSF star to another changes the host galaxy properties more than indicated by the error bars derived from the posteriori. This is especially true to the host galaxy magnitude and it is a clear indication that the dominant source of error is the PSF error.
Secondly, the host galaxy magnitude is less constrained in the K-band. This is not due to the K-band observation having a less favorable AGN/host flux ratio. Both images were taken with similar AGN brightness and since the host galaxy is brighter in the K-band than in the i-band, the core/host flux ratio is more favorable in the K-band. The reason for worse performance in the K-band is most likely due to the fact that the PSF stars are relatively fainter in the K-band than in the i-band. Thus when the PSF is scaled to the brightness of OJ87, the inevitable errors in the PSF model are amplified more in the K-band than in the i-band.
For the discussion below we convert the magnitudes to fluxes and take the mean of the results in table 1 in both bands. The error bars are set to the smallest number that keeps all results within the error bars. Thus in what follows we use Jy and Jy.
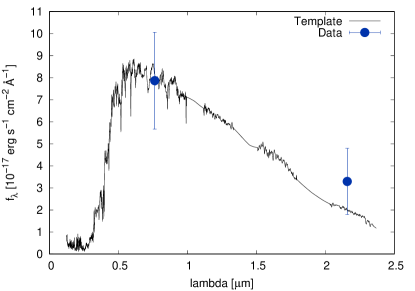
In Fig. 2 we show the rest-frame broadband flux of the host galaxy as a function of wavelength. We also overplot an early-type galaxy spectrum at zero redshift. To transfer the data to the same redshift, we need to apply the K-correction and evolution correction , both of which depend on the filter and galaxy type. We assume here that the host galaxy is an early type galaxy and obtain from Chilingarian et al. (2010). The K-correction has almost no dependence on galaxy type in the K-band and also in the SDSS r-band, which we use as a proxy for the R band, the dependence is mild, except for the starburst galaxies. There appears to be very little star formation going on in OJ 287. Nilsson et al. (2010) measured a narrow Hα line flux of erg s-1 cm-2, which transforms to a Hα line luminosity erg s-1. Using the formula for the star forming rate SFR = M⊙ yr-1 (Twite et al., 2012), we obtain SFR = 0.07 M⊙ yr-1. This has to be considered as a generous upper limit since the narrow Hα line could be produced mostly by the AGN activity. We thus do not consider the starburst models in Chilingarian et al. (2010) and obtain = 0.45, 0.25 and -0.5 for the R, SDSS i and K-bands, respectively. For the evolution correction, we use = 0.2 for both bands. This value was determined by running the Pegase 3 code (Fioc & Rocca-Volmerange, 2019) for a scenario with a single starburst 10 Gyr ago and passive evolution thereafter. The vertical scaling of the template in Fig. 2 was determined by integrating the template over the respective bandpasses and finding the scaling factor that minimizes the chi squared between our i and K-band observations and the template fluxes.
5 Discussion
The observed fluxes are consistent with an early-type galaxy spectrum, corrected for passive evolution from z=0.306 (Fig. 2). The scaled template corresponds to a galaxy with , which is within the range of BL Lac host galaxy luminosities =-22.8 0.5 found by Sbarufatti et al. (2005). The K-band luminosity of the scaled template is with (R - K) = 2.7. For the effective radii we find = 5 2 kpc in the SDSS i-band and = 4 3 kpc in the Ks band. both are consistent with sizes found for BL Lac host galaxies, although the errors are so high that we can only rule out a very large galaxy. Therefore, the host galaxy of OJ 287 does not look special in any particular way in comparison to BL Lac host galaxies in general.
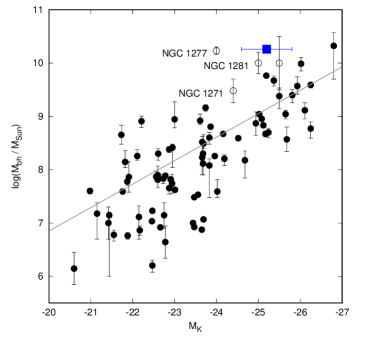
We next study how our results relate to the SMBH mass M⊙ indicated by the binary black hole model. In Figure 3 we plot the host galaxy luminosity - SMBH mass data from Graham & Scott (2013) together with some recently found very massive SMBHs and OJ 287, assuming for the latter the mass indicated by the binary model and the luminosity of our scaled template. The line in Fig. 3 show the fit to the “core-Sérsic” galaxies of the Graham & Scott (2013) sample, i.e. essentially to galaxies brighter than = -23.5. The SMBH in OJ 287 is overmassive by 1.13 dex, roughly 2.6 times the vertical rms scatter, 0.44 mag,in this plot, compared to SMBHs found in luminous nearby bulges studied by Graham & Scott (2013).
The central SMBH in OJ 287 is thus at the high mass end of SMBHs with a similar host, but not significantly deviating from the distribution. The BH mass is basically a result of applying general relativity to the timing of the flares and it is very accurately determined (e.g. Valtonen et al., 2008). Furthermore, such over-massive SMBHs, challenging the co-evolution between SMBHs and their host galaxy, have recently been found in an increasing number of galaxies, e.g., NGC 4486B (McConnell et al., 2011), NGC1277 (van den Bosch et al., 2012), NGC1281 (Yıldırım et al., 2016) , NGC1332 (Rusli et al., 2011), NGC 1271 (Walsh et al., 2015) and SDSS J151741.75-004217.6 (Lasker et al., 2013). However, to our knowledge no such detections have ever been made in supposedly spheroidal, massive host galaxies of bright AGN.
According to Ferré-Mateu et al. (2015), such galaxies form their SMBHs early (z2) and then experience lack of merger activity and subsequent galaxy growth, preventing them from reaching the present-day scaling relation. They are compact (R 2 kpc) and consist of purely old stellar population (t 10 Gyr), and may be the local analogs (relics) of z2 massive galaxies (e.g. van Dokkum et al., 2008; Trujillo et al., 2007). Interestingly, these galaxies, including OJ 287, are at the expected location of the M(BH)-Mbulge scaling relation at high redshift (e.g. Decarli et al., 2010; Portinari et al., 2012). Another way to produce an undermassive host galaxy is via tidal stripping (see e.g. Graham & Scott, 2015), but this applies only to the case of stellar mass loss due to tidal interaction with a more massive galaxy, which is not the case for OJ 287.
References
- Benitez et al. (1996) Benitez, E., Dultzin-Hacyan, D., Heidt, J., et al. 1996, ApJ, 464, L47
- Chilingarian et al. (2010) Chilingarian, I. V., Melchior, A.-L., & Zolotukhin, I. Y. 2010, MNRAS, 405, 1409
- Decarli et al. (2012) Decarli, R., Falomo, R., Kotilainen, J. K., et al. 2012, Advances in Astronomy, 2012, 782528
- Decarli et al. (2010) Decarli, R., Falomo, R., Treves, A., et al. 2010, MNRAS, 402, 2453
- Dotti et al. (2012) Dotti, M., Sesana, A., & Decarli, R. 2012, Advances in Astronomy, 2012, 940568
- Falomo et al. (2003) Falomo, R., Kotilainen, J. K., Carangelo, N., & Treves, A. 2003, ApJ, 595, 624
- Falomo et al. (2000) Falomo, R., Scarpa, R., Treves, A., & Urry, C. M. 2000, ApJ, 542, 731
- Ferré-Mateu et al. (2015) Ferré-Mateu, A., Mezcua, M., Trujillo, I., Balcells, M., & van den Bosch, R. C. E. 2015, ApJ, 808, 79
- Fioc & Rocca-Volmerange (2019) Fioc, M., & Rocca-Volmerange, B. 2019, A&A, 623, A143
- Gebhardt & Thomas (2009) Gebhardt, K., & Thomas, J. 2009, ApJ, 700, 1690
- González-Pérez et al. (2001) González-Pérez, J. N., Kidger, M. R., & Martín-Luis, F. 2001, AJ, 122, 2055
- Goodman & Weare (2010) Goodman, J., & Weare, J. 2010, Communications in Applied Mathematics and Computational Science, Vol. 5, No. 1, p. 65-80, 2010, 5, 65
- Graham & Scott (2013) Graham, A. W., & Scott, N. 2013, ApJ, 764, 151
- Graham & Scott (2015) —. 2015, ApJ, 798, 54
- Gültekin et al. (2009) Gültekin, K., Richstone, D. O., Gebhardt, K., et al. 2009, ApJ, 698, 198
- Heidt et al. (1999) Heidt, J., Nilsson, K., Appenzeller, I., et al. 1999, A&A, 352, L11
- Hyvönen et al. (2007) Hyvönen, T., Kotilainen, J. K., Örndahl, E., Falomo, R., & Uslenghi, M. 2007, A&A, 462, 525
- Kaspi et al. (2000) Kaspi, S., Smith, P. S., Netzer, H., et al. 2000, ApJ, 533, 631
- Kormendy & Bender (2011) Kormendy, J., & Bender, R. 2011, Nature, 469, 377
- Kotilainen et al. (2007) Kotilainen, J. K., Falomo, R., Labita, M., Treves, A., & Uslenghi, M. 2007, ApJ, 660, 1039
- Kuo et al. (2011) Kuo, C. Y., Braatz, J. A., Condon, J. J., et al. 2011, ApJ, 727, 20
- Lasker et al. (2013) Lasker, R., van den Bosch, R. C. E., van de Ven, G., et al. 2013, MNRAS, 434, L31
- Liu et al. (2014) Liu, F. K., Li, S., & Komossa, S. 2014, ApJ, 786, 103
- Mannucci et al. (2001) Mannucci, F., Basile, F., Poggianti, B. M., et al. 2001, MNRAS, 326, 745
- McConnell et al. (2011) McConnell, N. J., Ma, C.-P., Gebhardt, K., et al. 2011, Nature, 480, 215
- Miniutti et al. (2019) Miniutti, G., Saxton, R. D., Giustini, M., et al. 2019, Nature, 573, 381
- Murtagh & Starck (1998) Murtagh, F., & Starck, J. L. 1998, in Astronomical Society of the Pacific Conference Series, Vol. 145, Astronomical Data Analysis Software and Systems VII, ed. R. Albrecht, R. N. Hook, & H. A. Bushouse, 449
- Nilsson et al. (2003) Nilsson, K., Pursimo, T., Heidt, J., et al. 2003, A&A, 400, 95
- Nilsson et al. (2010) Nilsson, K., Takalo, L. O., Lehto, H. J., & Sillanpää, A. 2010, A&A, 516, A60
- Plotkin et al. (2011) Plotkin, R. M., Markoff, S., Trager, S. C., & Anderson, S. F. 2011, MNRAS, 413, 805
- Portinari et al. (2012) Portinari, L., Kotilainen, J., Falomo, R., & Decarli, R. 2012, MNRAS, 420, 732
- Pursimo et al. (2002) Pursimo, T., Nilsson, K., Takalo, L. O., et al. 2002, A&A, 381, 810
- Rusli et al. (2011) Rusli, S. P., Thomas, J., Erwin, P., et al. 2011, MNRAS, 410, 1223
- Sanghvi et al. (2014) Sanghvi, J., Kotilainen, J. K., Falomo, R., et al. 2014, MNRAS, 445, 1261
- Saxton et al. (2012) Saxton, R. D., Read, A. M., Esquej, P., et al. 2012, A&A, 541, A106
- Sbarufatti et al. (2005) Sbarufatti, B., Treves, A., & Falomo, R. 2005, ApJ, 635, 173
- Sillanpaa et al. (1996) Sillanpaa, A., Takalo, L. O., Pursimo, T., et al. 1996, A&A, 315, L13
- Somerville et al. (2008) Somerville, R. S., Hopkins, P. F., Cox, T. J., Robertson, B. E., & Hernquist, L. 2008, MNRAS, 391, 481
- Trujillo et al. (2007) Trujillo, I., Conselice, C. J., Bundy, K., et al. 2007, MNRAS, 382, 109
- Twite et al. (2012) Twite, J. W., Conselice, C. J., Buitrago, F., et al. 2012, MNRAS, 420, 1061
- Urry et al. (2000) Urry, C. M., Scarpa, R., O’Dowd, M., et al. 2000, ApJ, 532, 816
- Valtonen & Pihajoki (2013) Valtonen, M., & Pihajoki, P. 2013, A&A, 557, A28
- Valtonen et al. (2011) Valtonen, M. J., Lehto, H. J., Takalo, L. O., & Sillanpää, A. 2011, ApJ, 729, 33
- Valtonen et al. (2008) Valtonen, M. J., Lehto, H. J., Nilsson, K., et al. 2008, Nature, 452, 851
- van den Bosch et al. (2012) van den Bosch, R. C. E., Gebhardt, K., Gültekin, K., et al. 2012, Nature, 491, 729
- van Dokkum et al. (2008) van Dokkum, P. G., Franx, M., Kriek, M., et al. 2008, ApJ, 677, L5
- Vestergaard et al. (2008) Vestergaard, M., Fan, X., Tremonti, C. A., Osmer, P. S., & Richards, G. T. 2008, ApJ, 674, L1
- Walsh et al. (2015) Walsh, J. L., van den Bosch, R. C. E., Gebhardt, K., et al. 2015, ApJ, 808, 183
- Wright et al. (1998) Wright, S. C., McHardy, I. M., & Abraham, R. G. 1998, MNRAS, 295, 799
- Wurtz et al. (1996) Wurtz, R., Stocke, J. T., & Yee, H. K. C. 1996, ApJS, 103, 109
- Yanny et al. (1997) Yanny, B., Jannuzi, B. T., & Impey, C. 1997, ApJ, 484, L113
- Yıldırım et al. (2016) Yıldırım, A., van den Bosch, R. C. E., van de Ven, G., et al. 2016, MNRAS, 456, 538