A General Model of Conversational Dynamics and an Example Application in Serious Illness Communication
Abstract
Conversation has been a primary means for the exchange of information since ancient times. Understanding patterns of information flow in conversations is a critical step in assessing and improving communication quality. In this paper, we describe COnversational DYnamics Model (CODYM) analysis, a novel approach for studying patterns of information flow in conversations. CODYMs are Markov Models that capture sequential dependencies in the lengths of speaker turns. The proposed method is automated and scalable, and preserves the privacy of the conversational participants. The primary function of CODYM analysis is to quantify and visualize patterns of information flow, concisely summarized over sequential turns from one or more conversations. Our approach is general and complements existing methods, providing a new tool for use in the analysis of any type of conversation. As an important first application, we demonstrate the model on transcribed conversations between palliative care clinicians and seriously ill patients. These conversations are dynamic and complex, taking place amidst heavy emotions, and include difficult topics such as end-of-life preferences and patient values. We perform a versatile set of CODYM analyses that (a) establish the validity of the model by confirming known patterns of conversational turn-taking and word usage, (b) identify normative patterns of information flow in serious illness conversations, and (c) show how these patterns vary across narrative time and differ under expressions of anger, fear and sadness. Potential applications of CODYMs range from assessment and training of effective healthcare communication to comparing conversational dynamics across language and culture, with the prospect of identifying universal similarities and unique “fingerprints” of information flow.
Keywords Conversation Analysis Information Flow Markov Model Conversational Dynamics Palliative Care Serious Illness Communication Healthcare Communication Turn Taking Computational Linguistics
Introduction
Conversation is a fundamental form of human communication. Conversations are highly complex phenomena [1], but use simple rules to maintain discourse [2]. Humans have an innate ability to learn spoken language from infancy, yet despite the importance of conversations in our daily lives, achieving effective communication through conversations can be difficult [3, 4]. Developing a better understanding of information flow in different conversational contexts can help guide efforts to improve conversation quality.
Conversation analysis (CA) became established as a discipline of study beginning in the late 1970’s with the seminal work of Harvey Sacks and others, such as in their formative 1978 paper [2], in which they present a framework for the process of conversation. Sacks described conversation as being highly structured around turn-taking, with participants being able to fluidly transition between turns without turns overlapping. This fundamental property of conversation has subsequently been observed and measured across languages and cultures, revealing itself to be a universal trait [5]. Sacks theorized that this discourse is maintained by a set of rules, or norms, that are followed by participants and govern when the speaking floor is relinquished and which participant may speak next. Perhaps the most important aspect of his framework is the heavy focus on the sequential nature of conversation and the dependence of each speaker turn on the turns that came before it [2].
The traditional conversation analytic approach to understanding sequence is to use meticulous transcriptions of recorded conversations in order to study a pre-specified conversational phenomenon and understand its normative patterns [6, 7]. For example, in one early, influential study, Schegloff examined the opening sequence of turns in 500 telephone calls and attempted to explain the patterns he observed [8]. This approach has been widely adopted and applied in diverse contexts, resulting in a vast body of work comprising thousands of research papers. While the value and importance of this inherently qualitative approach remains relevant today [6, 7, 9], quantitative methods have gained increasing popularity in CA (e.g., [10, 11]). In particular, Markov Models (MMs) inherently model sequential events [12], and so have been widely applied in CA.
In a MM, the likelihood of a given event occurring is determined by the current state of the system, and when an event does occur it causes the system to transition to a new state [12]. The “order” of a MM defines the number of previous events that are recorded in each state (i.e., the length of the “memory” in the model). In most CA applications of MMs, state transitions are defined to take place between some constant, fixed intervals of time. Examples of these include 1st-order MMs that were used to classify dialog scenarios in conversations based on speech/silence states [13], and for identifying conversational structure within non-verbal states, such as gaze patterns in four-person conversations [14], and 2nd-order MMs used to study the effects of conversational speech/silence patterns on communication systems [15]. In contrast, sequences of speaker order in four-person conversations were used to predict who the next speaker would be, using MMs up to order 5 [16]; 2nd-order MMs proved significantly better than 1st-order MMs for this task, but little further improvement was gained by moving to higher order models on this data set, and a simple context-sensitive model based on speaker roles was shown to out-perform the MMs.
While the examples above use MMs as a tool for making predictions or classifications regarding conversations, another approach to understanding the structure of information flow involves classifying units of conversation by their functional roles (e.g., [17, 18]). Once these functional roles have been defined, 1st-order Markov models have been used to understand the sequence of these functions in conversation [19, 20, 21]. Influence modeling is yet another Markov-based method, where individual Markov chains for each speaker are coupled together to understand how speakers interact, including understanding which speakers are most influential [22, 23, 24] and the functional role of each speaker [25].
Visualizing data to aid interpretation has also grown in popularity [26], and a number of methods have been proposed for visualizing conversational dynamics [27, 28, 29]. Good visualizations allow complex data to be displayed in a more easily digestible format, allowing readers to better recognize and understand patterns that may not otherwise be apparent [30]. One popular tool for visualizing conversational dynamics is Discursis [29], which uses conceptual recurrence plots for unsupervised identification and visualization of shared content between speaker turns in the analysis of conversational discourse. This method has been used in a variety of contexts, including the study of healthcare conversations [31, 32, 33, 34, 35, 36]. Discursis visualizations portray the lengths of each speaker turn throughout an individual conversation, along with the amount of overlap in content in these turns. Thus, the size and complexity of Discursis visualizations vary for each conversation, and access to full transcriptions are necessary to create these very detailed visualizations of individual conversations.
In this paper, we describe the COnversational DYnamics Model (CODYM), a novel approach for analyzing and visualizing information flow across sequences of turns in one or many conversations, using 2nd-order and 3rd-order MMs of discretized turn lengths. CODYMs are based on the assumption that the length of a speaker turn is a simple proxy for the capacity of information conveyed in the turn, and that the amount of information conveyed during a given turn is influenced by the amount of information conveyed in previous speaker turns. The proposed method is scalable and can be fully automated. Since CODYMs do not rely on knowledge of the specific content of conversations, they do not compromise the privacy of the conversational participants. However, CODYMs can also be contextualized to study information flow patterns surrounding specific topics of interest, if such are known. In contrast to previous applications of MMs to conversation analysis, the primary function of CODYM analysis is to quantitatively summarize and visualize information flow patterns throughout one or more conversation(s), rather than to make predictions or classifications. Our approach is general and provides a new tool for use in the analysis of any type of conversation.
In healthcare communication, and especially in serious illness communication, the quality of doctor-patient conversations can have profound tangible impacts [37, 38, 39]. Promoting high-quality communication in serious illness healthcare is considered a national priority [40, 41], and there is an increasing recognition that automated methods for analyzing clinical conversations, such as turn-taking analysis, could provide useful feedback and insights for improving communication between clinicians and patients [39, 42]. Thus, as an important first application, we apply CODYM analysis to a corpus of 355 transcribed conversations between palliative care clinicians and seriously ill patients, recorded as part of the Palliative Care Communication Research Initiative (PCCRI) [43]. These conversations are dynamic, complex phenomena that take place amidst heavy emotions such as anger, fear, and sadness [44]. They include difficult topics such as end-of-life preferences and values, all while patients endure suffering from the symptoms of their illness. We seek to answer the following questions. What are the normative information flow patterns in serious illness conversations? How do those patterns change during the course of a conversation? Do certain words or topics tend to appear more in one information sharing pattern than another? How does the expression of distressing emotion impact information flow? We show that CODYM analysis provides a quantitative approach, with an intuitive interpretation, that helps to answer these questions.
The remaining sections of this manuscript are organized as follows. We first describe the methods involved in CODYM analysis, and the PCCRI corpus of palliative care conversations. We then present results of applying CODYM analysis to the PCCRI corpus in various ways that demonstrate the model’s versatility, followed by a discussion of the significance of our findings and their relation to the current literature. Finally, we close with some general conclusions and ideas for future work.
Methods
Conversational dynamics model
Due to the sequential nature of conversations [2], we expect that the amount of information conveyed in each turn influences the amount of information conveyed in subsequent turns. Here, we propose using the number of words in a speaker turn as a simple proxy for the capacity of information that the turn can convey. We define a COnversational DYnamics Model (CODYM) to be a Markov Model (MM), where events are speaker turns of a given length and states comprise the lengths of some number (defined by the order of the model) of previous turns. CODYMs thus model the sequential patterns in turn lengths.
Any MM requires a discrete state-space, so turn lengths in a CODYM are discretized into a finite number of bins. Although, in principle, turn lengths can be discretized into any number of bins, the most appropriate number of bins will depend, in part, on the size of the data set. In the PCCRI corpus used here, turn lengths follow a heavy-tailed distribution, with a median turn length of 7 (Fig. S1). Here, we binarize turn lengths into short (S) turns and long (L) turns, with short turns defined as those with 1-7 words and long turns as those with 8 or more words. Using the median turn length as the maximum length of short turns (a) creates a relatively balanced data set with 53,751 short turns and 47,812 long turns, and (b) maximizes the Shannon entropy (a measure of information content) for the distribution of states in a 3rd-order CODYM (Fig. S2). In preliminary experimentation with the PCCRI corpus, we found that discretizing turn lengths into ternary bins (Short/Medium/Long) was problematic because it both (a) created sample size issues by reducing the number of turns associated with each transition, and (b) resulted in more complex models that were difficult to interpret.
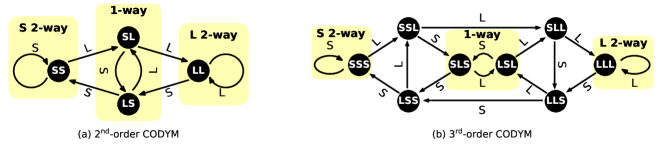
Note that the number of states in an th-order CODYM of binarized turn lengths has states and transitions. For example, a 2nd-order CODYM has 4 states and 8 transitions, and a 3rd-order CODYM has 8 states and 16 transitions, as illustrated in Fig. 1, where states are represented as nodes and transitions are represented as directed edges in a network. We use 2nd- and 3rd-order CODYMs in our analyses for the reasons explained below.
We use 3rd-order CODYMs for analyzing normative patterns in serious illness conversations, and for examining how these patterns change both temporally and when distressing emotions are expressed. We selected 3rd-order CODYMs for this because: (a) for dyadic conversations, such as between a patient and a clinician, having memory of 3 previous turns can represent a complete back-and-forth exchange between the 2 sides; (b) higher-order models become difficult to interpret; (c) large state spaces result in fewer observations of each state/transition, potentially resulting in small sample sizes that may preclude accurate characterization of normative patterns (e.g., the median numbers of occurrences of the different states for each conversation in the PCCRI corpus are 57, 28, 13, 6, and 3, for CODYMs of orders 1-5, respectively); and (d) we found that features taken from 3rd-order CODYMs had greater predictive power over those from 1st- or 2nd-order CODYMs on an emotion-based classification task (described in more detail later), as shown in Table S1. On the other hand, a 2nd-order CODYM has half the number of transitions as a 3rd-order model (Fig. 1). Thus, when studying patterns of word associations with transitions, we use 2nd-order CODYMs to increase the number of words associated with each of the transitions.
Different sub-networks of a CODYM can be interpreted as distinct regimes of information flow (highlighted in yellow in Fig. 1). For example, we refer to the center loop (, in a 2nd-order CODYM, and , in a 3rd-order CODYM) as “one-way information exchanges”, because alternation between S and L turns in a dyadic conversation implies that one party is conveying most of the information. We refer to the leftmost self-loop (, in a 2nd-order CODYM, and , in a 3rd-order CODYM) as “short two-way information exchanges”. Conversely, we refer to the rightmost self-loop (, in a 2nd-order CODYM, and , in a 3rd-order CODYM) as “long two-way information exchanges”. As we will show, each of these information flow regimes can be associated with different functions in conversations.
Observing patterns of information flow
In most MMs, the weights on all outgoing edges of each given node sum to 1.0, where each edge weight represents the probability that the node is left via that edge. This is appropriate when MMs are used as generative models or to make predictions of future states. However, with CODYMs our primary intent is to study patterns of information flow through all states and transitions in an existing corpus of dialog, not to generate simulated sequences of short and long speaker turns or to predict subsequent turn lengths. Thus, in a CODYM, the weights on nodes and edges represent their respective percentage frequencies of occurrence over all turns being analyzed. Consequently, the sum of all edge weights (transition frequencies) in an entire CODYM is 100% and the sum of all node weights (state frequencies) is also 100%.
We “populate” a CODYM by computing observed frequencies of each state/transition across a specified set of speaker turns. This set may comprise all turns in an entire corpus of conversations, all turns for a given speaker, all turns within individual conversations, or some other subset of turns that satisfy some pre-specified condition, depending on the question being addressed. When different CODYMs are populated separately for a number of conversations, they can be visualized as a single CODYM populated with the mean weights for each of states and transitions, averaged over all of the CODYMs populated from individual conversations. A CODYM of mean frequencies can be interpreted as a representation of the overall “normative” pattern of information flow in the set of conversations under study, assuming the distributions of frequencies are uni-modal for each state and transition. Alternatively, when CODYMs are populated from a subset of turns in the corpus, turns from multiple conversations may be pooled to increase sample sizes in the states/transitions; in this case, we compute a single set of CODYM frequencies for the pooled data.
Where possible, we seek to determine whether a CODYM computed from observed data exhibits state and/or transition frequency distributions that differ from what would be expected if the given conversational feature of interest was independent of prior sequences of turn lengths (the null hypothesis). How we determine “expected” frequencies, and how we compare observed frequencies to them, depends on the particular experiment. For example, we compare two sets of observed CODYM frequency distributions, computed from turns with or without a given feature present, using 2-sample Kolmogorov-Smirnov tests. However, in most cases, we generate expected frequencies from appropriate null CODYMs, which are populated from data that have been randomly sampled (or randomly reorganized) in such a way as to disrupt any possible association between the conversational feature of interest and previous sequences of turn lengths, while preserving other salient characteristics of the data, such as sample size and the number of long and short turns used by patients and clinicians. When comparing to null CODYMs created by random sampling, we derive empirical probability distributions for null models computed from randomly sampled data by generating 1000 random copies of each, using Monte Carlo (MC) simulations. (Prior experimentation had shown that probability distributions were quite stable when created with 1000 MC simulations). When we visualize these null CODYMs, we display mean state and transition frequencies, averaged over all 1000 copies. If observed state and/or transition frequencies are outside of the empirically derived 95% confidence interval from the distribution of 1000 corresponding null models, the difference is considered to be statistically significant at the level. To minimize confusion, we provide the specifics of how we determined expected values for each type of experiment in the Results.
State space diagrams of CODYMs are displayed in one of two formats, based on what we believe most effectively conveys the results we are trying to highlight. In some cases, we display transition frequencies directly ( or ), while in other cases we display mean observed transition frequencies minus the mean expected frequencies of the corresponding null models (). In the former, all state weights sum to 100%, all transition weights sum to 100%, and the color bars represent only positive percentages. In the latter, transition weights sum to 0%, negative values indicate the degree to which the feature of interest is under-represented on a given transition, and positive values indicate the degree to which it is over-represented, relative to the corresponding null model. We use different colormaps to help distinguish these two visualization techniques. In both visualization formats, the thickness and color of transition arrows indicate the magnitude of the corresponding transition weights, and nodes are sized according to the frequency of their respective states. Where relevant, state and transition frequencies that are statistically significantly different from the corresponding null model are indicated by coloring states black (vs. gray) and drawing transition arrows with solid lines (vs. dashed lines).
To assess how normative patterns in information flow may change over the course of a conversation, we divide the turns of each conversation in the corpus into sequential deciles of words (ten bins of narrative time, as in [45]), stratified by patient and clinician turns. Note that different conversations have different numbers of turns, so the number of turns per bin varies by conversation. Individually, conversations average only about 28 turns per decile, split approximately equally between patient turns and clinician turns. Since 14 turns are inadequate to robustly determine frequencies on 16 transitions, we pool the data by summing the number of patient and clinician turns per decile over all conversations. We then compute the frequencies of the pooled turns on each of the 16 transitions in 3rd-order CODYMs, one per decile.
Contextualization of CODYMs
A CODYM is based exclusively on turn lengths, so is thus independent of what is actually said or expressed during those turns. However, a CODYM can be used to examine the information flow patterns involving different words, topics, expressions of emotion, or more generally, “contextual events”.
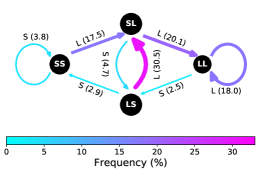
We use two complementary approaches to study how word usage varies between conversational regimes. In the first approach, we use an unsupervised cluster analysis to determine which commonly used words have similar CODYM patterns of information sharing. Of the 14,848 unique words that appear in the PCCRI corpus, we only consider those that appear at least 100 times and for which the absolute value of is greater than 10; expected values are the observed frequencies in a 2nd-order CODYM populated from all words over all turns in the corpus (Fig. 2). We use this method for prefiltering words because: (a) requiring a minimum number of occurrences ensures that a word is frequent enough in the corpus to asses its typical usage; and (b) by considering only words whose information flow patterns differ substantially from overall word frequencies, we focus on words that have specialized usages with respect to the normative information flow pattern.
The resulting list of 114 words was clustered using a standard K-Means clustering algorithm (implemented with Python’s scikit-learn package, with default settings [46]), using the 8 transition frequencies from 2nd-order CODYMs (computed for each of the 114 words) as the input features for clustering. Note that each of the 114 words are weighted equally during this clustering, even though some words occurred much more frequently than others. After qualitatively assessing cluster membership when using between three and ten clusters, we determined that using six clusters resulted in the most logically cohesive word groupings.
In the second approach, we populate CODYMs using frequencies of occurrence of terms from pre-defined lists. In this work, we focus on two such lists of interest in serious illness conversations: hedging terms and treatment terms.
There are many definitions of uncertainty terms and subtypes used in clinical conversations (e.g., [47, 48, 49, 50]). Here we focus on a list of “hedging” terms, recently developed for use in natural language processing of serious illness conversations, which was found to be the most prevalent subtype of uncertainty expressed in the PCCRI corpus [51]. According to this definition, hedging occurs in a conversation when the speaker makes a word choice to suggest something rather than state it as fact, such as to say “I expect you will feel better” instead of “You will feel better”. Using the word expect injects some uncertainty into the statement. Some examples of hedging terms include expect, hint, imply, perceive, presume, speculate, suspect, and think. The complete list of 35 hedging terms used in this study, and the frequency of occurrence of each term in the PCCRI corpus, is shown in Table S2. See [51] for a detailed description of how this list was compiled.
Treatment terms are those used to discuss medical care provided to patients. A list of 51 treatment words occurring at least 100 times each in the PCCRI corpus was previously prepared, and it was shown that these words vary temporally throughout the PCCRI conversations, being most prevalent in deciles 4 and 5 [45]. Some examples of treatment terms include antibiotics, ICU, chemo, fentanyl, machine, milligram, procedure, radiation, and ventilator. The complete list of the treatment terms used in this study (from [45]), and the frequency of occurrence of each term in the PCCRI corpus, are shown in Table S3.
Note that specific hedging terms or treatment terms that are more frequent in the overall corpus have a greater influence on resulting state and transition frequencies, since CODYM frequencies were computed over all occurrences of all terms in a given list. Thus, to assess robustness of the observed information patterns for both hedging and treatment terms, we remove a random 10% of terms that occurred at least once in the PCCRI corpus from each list and re-perform the analysis. This process is repeated with a different 10% of terms removed each time, until all terms have been removed at least two times.
In what is perhaps our most intriguing application of contextualization, we study how the expression of distressing emotions by patients affects patterns of information flow, both locally (by comparing CODYM patterns between turns in which anger, fear or sadness were or weren’t expressed) and globally (by comparing CODYM patterns between entire conversations in which anger and/or fear were or weren’t expressed). As part of the latter analysis, a Random Forest classifier (implemented using Python’s Scikit-learn package with 100 trees and default settings [46]) was trained to distinguish conversations that included anger and/or fear from those that didn’t, using normalized conversation-level transition frequencies from 1st-order through 5th-order CODYMs as input features. Each Random Forest was trained on a random 80% of conversations from each class and tested on the remaining 20% of conversations from each class. This process was repeated 1,000 times for each order CODYM, with different random 80-20 data splits. The distribution of observed testing accuracies in these 1000 Random Forests was used to assess how consistently CODYM features could distinguish between conversations with fear and/or anger and those without.
The PCCRI corpus
The Palliative Care Communication Research Initiative (PCCRI) is a multisite observational cohort study conducted between January 2014 and May 2016 [43]. The study took place at two large U.S. academic medical centers, one in the Northeast and one in the West. Any English-speaking patients who were hospitalized and referred for inpatient palliative care consultation were eligible for this study, provided they were diagnosed with a metastatic nonhematologic cancer, did not have a documented exclusively comfort-oriented plan of care at the time of referral, were age 21 or over, and were able to consent for research either directly or via health care proxy (if lacking capacity as determined by the clinical team). All members of the interprofessional Palliative Care Inpatient Consult teams at both sites were eligible to participate.
A total of 240 hospitalized patients with advanced cancer at the time of referral for inpatient palliative care consultation were enrolled in the study. Four withdrew, three died, and two were discharged before completing the palliative care consultation. Each consultation comprised one to three conversations between the patient, and potentially family members and/or close friends of the patient, and the palliative care team. More than one conversation occurred with the same patient when the initial conversation was only a preliminary assessment or when a conversation was interrupted prematurely (e.g., a patient was taken for x-rays) [43].
All conversations that were part of a palliative care consultation were audio recorded. With prior informed consent from all study participants, digital recorders were placed in unobtrusive locations in the rooms where the conversations took place (e.g., on a tray table next to a patient’s bed); research assistants retrieved the recorders at the end of the visit by the palliative care team. All audio recordings were later transcribed verbatim and prepared in a standard format to facilitate natural language processing. The speaker during each transcribed turn was tagged as either a patient (which could include family members and/or close friends who were present in support of the patient) or a clinician, except in rare occasions ( of turns) when transcribers could not determine whether the speaker was from the patient side or the clinician side (these turns were excluded from analyses that stratified turns by patient and clinician). In total, we examined 360 conversations that were recorded and transcribed for 231 unique patients.
Of these, five transcripts were excluded from this study because either a high proportion of speaker turns were inaudible rendering the transcripts very incomplete, or because the conversations were too short (less than 20 speaker turns long) to perform meaningful analysis. The remaining 355 conversations, which were used in our analyses, contained 1,464,167 total words (14,812 unique) in 101,563 total speaker turns, with a median of 242 turns per conversation (Fig. S1).
Since transcribers were not always able to distinguish patients from family members or friends, or which clinician was speaking, in this work we adopt the convention that “patient” refers to anyone on the patient-side of the conversation and “clinician” refers to anyone on the clinical team. Although there were up to 8 participants in a conversation, patient turns were followed by clinician turns (and vice versa) during 86% of all transitions, closely resembling the alternating speaker pattern that would be expected in dyads.
All speaker turns in which the patient was audibly perceived to be expressing anger, fear, or sadness, had been previously labeled in the PCCRI transcripts, using well-established and reliable human coding methods [52, 53]. Anger was defined to include expressions of either frustration or anger. Fear was defined to be inclusive of words and sounds indicating worry, anxiety, fear or terror. Sadness was defined to include expressions with sad, disappointed, depressed, hopeless or discouraged sentiments. Turns that included multiple sentiments were coded as such. Ambiguous words or sounds that might indicate underlying emotion, or referred to emotions felt in the past, were not included in our analysis.
Results
Normative patterns of information flow in serious illness conversations
CODYMs reveal normative patterns (“fingerprints”) of information flow in serious illness conversations. The existence of such normative patterns is supported by the uni-model distributions observed for all states and transitions in 3rd-order CODYMs, for both patients and clinicians, indicating a prevailing pattern across all conversations in the corpus (Figs. S4, S5, and S6). These patterns are similar, and yet distinct, between patients and clinicians.
When interpreting the populated CODYMs, it is important to consider that only 42% of patient turns are long whereas 53% of clinician turns are long. Thus, to create appropriate null models, we randomize the locations of specific turns (thereby preserving the exact distributions of patient and clinician turn lengths), while maintaining the overall sequential order of patient and clinician turn-taking in the actual conversations. Null 3rd-order CODYMs are generated from 1000 randomized versions of these conversations, stratified by patient and clinician turns.
Despite the skew apparent in most of these distributions (Figs. S4, S5, and S6), we elect to populate the CODYMs with the means (rather than medians) of transition and state values, since this preserves the more intuitive properties that (a) the sum of all edge weights in a CODYM is 100%, (b) the sum of all node weights in a CODYM is 100%, and (c) for each node, the sum of weights of incoming edges equals the sum of the weights of outgoing edges. We verified that using the means, rather than the medians, does not qualitatively change any insights or conclusions drawn from the models (see Figs. S4, S5, and S6 for a comparison of mean vs. median values).
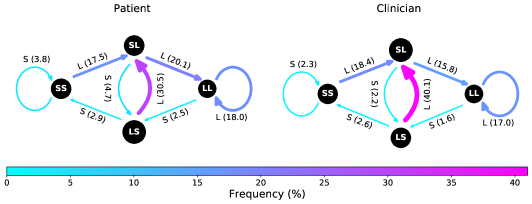
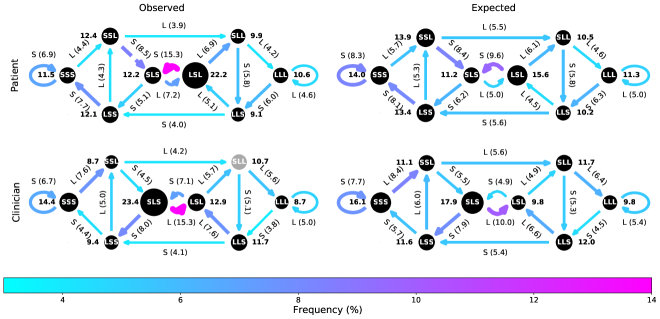
When comparing the observed CODYMs (Fig. 3, left column) to the expected values from the corresponding null models (Fig. 3, right column), states SLS and LSL, and the transitions between these two states, occur more frequently in the observed data than expected by chance in both patients and clinicians, whereas all other states occur less frequently than expected by chance (Tables S4 and S5). This indicates that conversations include more one-way information exchanges than would be expected by chance, and that sometimes it is the clinician imparting more information and sometimes it is the patient.
Despite the qualitative similarities between normative patterns of patients and clinicians described above, all but two of the eight states and five of the sixteen transitions are siginficantly different for the two speaker types (Tables S4 and S5). Most notably, it is evident that the LSL state is the most frequent state prior to a patient turn and is most often followed by a short patient turn (Fig. 3, upper left) whereas the SLS state is the most frequent state prior to a clinician turn and is most often followed by a long clinician turn (Fig. 3, lower left). This implies that clinicians, rather than patients, are most often imparting more information in one-way information exchanges. Other aspects of the normative CODYM patterns are discussed in subsequent sections.
Dynamic Changes in Normative Patterns of Information Flow
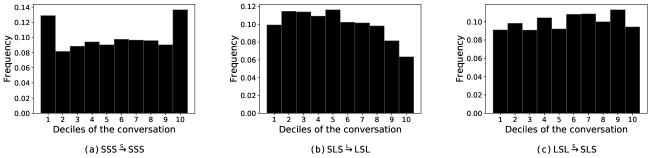
Some transitions show distinct patterns of change in frequency across temporal deciles of conversations (Figs. 4, S7, and S8). For example, the short two-way information exchange, while occurring overall less frequently than expected by chance (Fig. 3), occurs more frequently in the first and last decile of the conversation for both patient turns (Fig. 4a) and clinician turns (Fig. S7). This is consistent with our observation that words associated with ritualistic openings and closings of a conversation are over-represented in short two-way information exchanges (see Contextualization by Word Clustering, in the next Section). For patient turns, we also see a decrease in one-way information exchanges from patient-to-clinician from deciles 5 through 10 (Fig. 4b, ), but no corresponding significant increase in the one-way information flow from clinician-to-patient over deciles 5 through 10 (Fig. 4c, ). The complementary changes in one-way information flow patterns for clinician turns exhibit nearly identical patterns (Figs. S7 and S8).
Contextualization
Contextualization by word clustering
Unsupervised clustering was used to group 114 words (selected as previously described in the Methods) into six clusters, based on the transition frequencies of individual words in 2nd-order CODYMs. For each cluster, we generate a representative CODYM by averaging the transition frequencies for all words in the cluster (for the distribution of transition frequencies in each cluster, see Fig. S9). We compare these to the CODYM of occurrences of all words (Fig. 2), to see which transitions are over- or under-represented. Because the CODYM of occurrences of all words is not formulated from a distribution of random trials, it is not possible to empirically derive the confidence interval to determine whether the differences between observed and expected frequencies are significant. However, the purpose of the clustering is not to determine which state/transition frequencies are significantly different from random, but to observe which words share similar patterns of information sharing.
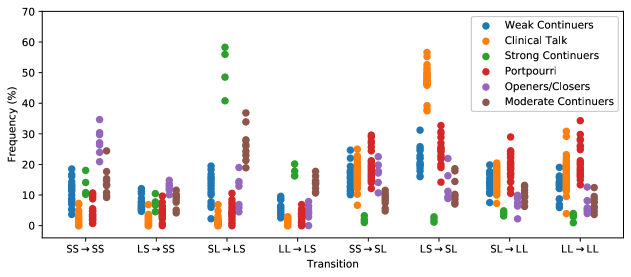
We find that many words with similar information flow patterns fill similar functions in the context of information flow, and we refer to these clusters by monikers according to these functions (Table 1, Fig. 5). A complete listing of words in each cluster and their frequencies in the PCCRI corpus are shown in Table Supplemental Figures and Tables. Results are displayed in Fig. 5 as to accentuate how each cluster differs from the norm. (The for each transition in each cluster are shown in Table S7.)
| Cluster Moniker | # Words | %L | Example Words |
|---|---|---|---|
| Strong Continuers | 4 | 10.8 | hm, hmmm, mm, aha |
| Moderate Continuers | 10 | 36.9 | yeah, yes, yep, yup, ok, wow, huh |
| Weak Continuers | 19 | 63.5 | fine, right, sorry, no, beautiful, meeting, appreciate |
| Openers/Closers | 7 | 44.3 | thank(s), meet, hi/hello, welcome, bye |
| Clinical Talk | 51 | 95.5 | um, comfort, symptoms, treatments, chemotherapy, continue, disease |
| Potpourri | 23 | 84.8 | hurts, tylenol, concern, risk, confused, scary, funny |
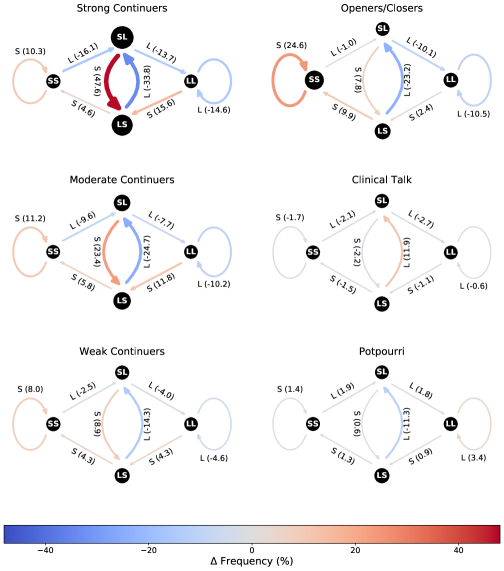
Three similar clusters include words that often occur in S turns during one-way information exchanges, linguistically referred to as “continuers” [54, 55, 56]. We refer to these three clusters as “strong”, “moderate”, and “weak” continuers, based on the degree to which the one-way information exchange pattern differs from that in the CODYM of all word frequencies. The most specialized grouping, the strong continuer cluster, comprises sounds of acknowledgment that serve to encourage the primary speaker to continue (e.g., hm, aha). These words have the most extreme specialization as continuers and are rarely used in other contexts, nearly always occurring during S turns and, specifically, appearing in the transition more frequently than all other transitions combined. The moderate continuer group contains positive affirmations (e.g., yeah, yes, yep, ok) that, while often used as continuers, have a less extreme over-representation in the one-way information exchange, and not infrequently (in over a third of turns) occur in L turns. The weak continuer cluster contains some words that act as continuers in one-way information exchanges (e.g., right, no, nice, great, fine, exactly), but also occur in L turns nearly two thirds of the time and contain some words that aren’t generally considered continuers (e.g., meeting, appreciate, appetite).
The “openings/closings” cluster contains words that are almost exclusively associated with starts and ends of conversations, occurring nine times as often in short two-way information exchanges, relative to the CODYM of all word frequencies. This is consistent with our earlier observation that short two-way information exchanges occur most often in the first and last deciles of conversations (Fig. 4).
The cluster we have dubbed “clinical talk” is the largest cluster, containing 51 of the 114 words considered. The words in this cluster most often occur during L turns in one-way information exchanges, with a slight under-representation in all other transitions, relative to the model of all word frequencies. While many of the words in this cluster specifically relate to clinical talk (e.g., comfort, symptoms, treatments, chemotherapy), others are more general (e.g., sort, may, whether); the most prevalent word in this cluster is “um”, a word often used for holding the floor during a L turn.
The remaining 23 words were grouped into a cluster we refer to as “potpourri”, since the relationships between these words are less obvious than in the other clusters. Although several of them described feelings (e.g., hurts, concern, confused, scary, funny), the word risk, a word used predominantly by clinicians (Table S2), also appears in this cluster. The general pattern of information flow in this cluster is opposite of what was observed for the “clinical talk” cluster. Specifically, these words are under-represented on the L turns of one-way information exchanges and slightly over-represented on all the other transitions, more so on other L turns than on S turns, with the greatest over-representation during long two-way exchanges.
Contextualization by hedging and treatment terms
To assess whether patients and clinicians use hedging and/or treatment terms differently, we stratify the corpus into patient turns and clinician turns. We compare observed CODYM transition frequencies to expected frequencies in null CODYMs, where these null models were created from size-matched samples drawn according to the known frequencies of each state/transition over all patient and clinician turns. In this way, the null models capture the amount of random noise that would be expected due to chance, given the sample size. As shown in Fig. S12, the mean frequencies of these stratified null CODYMs are very similar to the single CODYM of the entire unstratified corpus already shown in Fig. 2, so are not shown in the main text.
Patients and clinicians used hedging terms 3,805 and 5,794 times, respectively. Overall, hedging terms increased in frequency over the first half of the conversation, especially when used by clinicians (for patients, the usage of hedging terms peaked in decile 3); the use of hedging terms then remained high until decile 9 for both speaker types, dropping in the last decile (Fig. S3). The differences in CODYM patterns where hedging terms were used, relative to the CODYMs of all words, were similar for patients and clinicians (Figure 6, left column). Hedging terms are generally used 2-3% more frequently than expected in L turns following another L turn, especially during long two-way information exchanges. Patients, but not clinicians, used hedging terms over 3% less frequently in the L turn of a one-way information exchange, than in the corresponding null models. All other transitions with significant differences (Fig. 6, left column, solid transition arrows) had hedging terms slightly under-represented, relative to the corresponding null models.
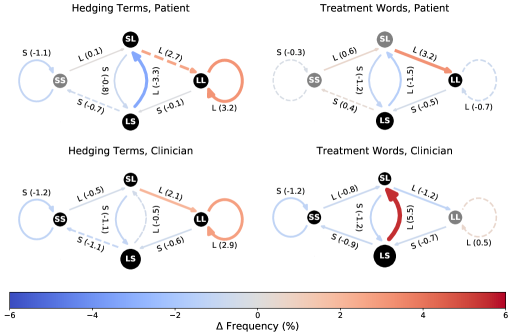
Patients and clinicians used treatment terms 4,247 and 10,469 times, respectively. In contrast to the relatively similar CODYM patterns in their use of hedging terms, patients and clinicians exhibited very different CODYM patterns in their use of treatment terms (Figure 6, right column). Clinicians used treatment terms nearly 6% more frequently during L turns in one-way information exchanges (from clinician-to-patient), with absolute differences from expected for all other transitions, nearly all significantly lower than expected (Figure 6, lower right, solid transition arrows). Patients, however, used treatment terms over 3% more frequently than expected on the transition, but with absolute differences from expected for all other transitions, most of which were not significantly different from the null model (Figure 6, upper right, dashed transition arrows).
The overall CODYM patterns shown in Fig. 6 were not qualitatively affected by removal of different random sets of 10% of hedging terms or treatment terms. This robustness to removal of random terms confirms that the observed patterns within term groupings are not reliant on a particular subset of terms.
Contextualization by expression of distressing emotion
In total, 208 conversations (58.6%) contained at least one patient turn where anger, fear or sadness was detected, and in 102 conversations (28.7%) at least two of these different types of distressing emotion were present. Conversations that had at least one patient turn with a distressing emotion typically (89.4% of the time) had more than one, with a heavy-tailed distribution indicating that a small number of conversations had very high instances of emotion. It was also common to have multiple consecutive patient turns where emotion was expressed. Consequently, the previous turns, used in defining the state prior to a given transition where emotion was present, also often included expressed emotions. This should be considered when interpreting the results herein.
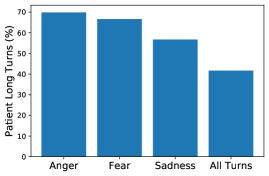
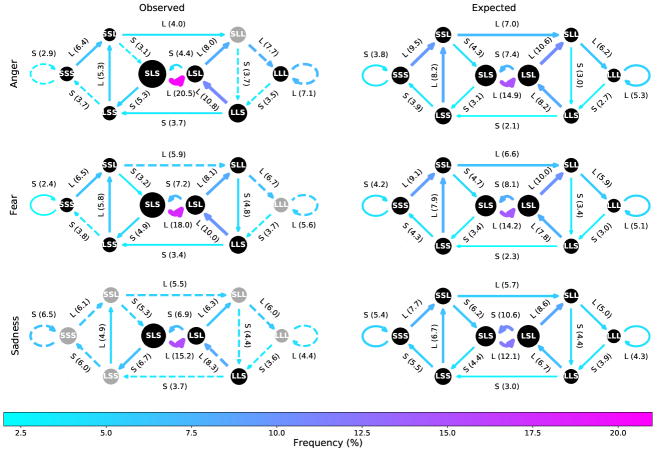
The expression of anger, fear, and sadness occurs during L patient turns 69.8%, 66.6%, 56.7% of the time, respectively, whereas only 42% of all patient turns were L (Fig. S10). To compare CODYM patterns in patient turns with or without expression of distressing emotions, we analyzed all patient turns with audibly expressed anger, fear or sadness, relative to null CODYMs created by randomly sampling patient turns in which no distressing emotion was present, but with the same number of patient turns and same frequency of L turns as in those patient turns where distressing emotion was detected. As a result of the higher proportion of patient L turns, the resulting null CODYM models for expression of distressing emotion differ from the normative CODYM pattern of discourse for all patient turns (compare the models in Fig. 7, right column with Fig. 3, top right).
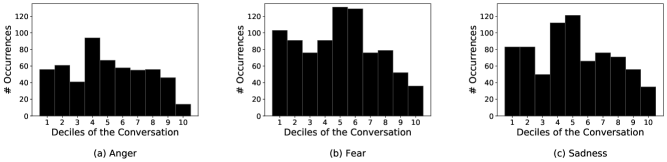
The observed CODYM patterns during turns where distressing emotion was expressed (Fig. 7, left column) differ markedly from what would be expected due to the increased proportion of patient long turns alone (Fig. 7, right column). Note that, for anger and fear, all but one state and most transitions differ significantly from their respective null model. However, for sadness, only three states and fewer than half of transitions are significantly different from the null model. The most notable differences, present in all three emotions, are (a) an over-representation of expression of distressing emotions during L patient turns in one-way patient-to-clinician information exchanges, and (b) an under-representation during S patient turns in one-way clinician-to-patient information exchanges. These differences are most extreme for turns in which anger is expressed, and least extreme when sadness is expressed. Additionally, fear is significantly under-represented during short two-way information exchanges, relative to its null model. Expressions of anger, fear, and sadness all peak in deciles 4 and 5 (Fig. S11), and then decrease over the remainder of narrative time in the conversations. The strong similarities in temporal patterns of the three emotions arise, in part, because multiple turns were determined to include more than one of these emotions.
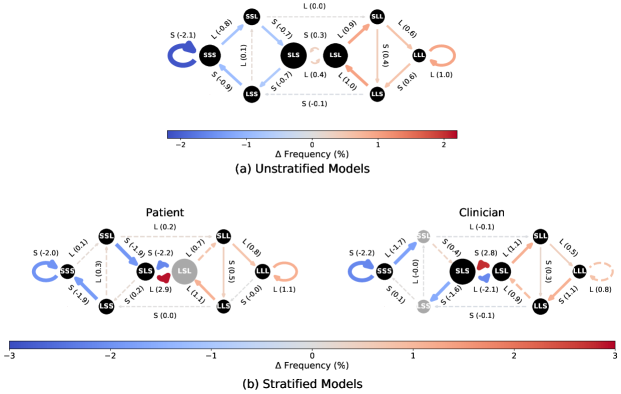
To examine the impact of distressing emotions on information flow at the conversation level, we focused on expressions of anger and fear, since expressions of sadness caused relatively few significant differences at the turn level (as seen in Fig. 7). Out of 355 conversations, 187 (53%) had at least one instance of anger or fear, creating a relatively balanced data set. The distributions of CODYM transition frequencies for conversations with at least one instance of anger or fear differed significantly from the distributions of CODYM transition frequencies for conversations without any expression of fear or anger, for 13 of 16 transitions (2-sample Kolmogorov-Smirnov test, , Fig. 8a solid edges). In conversations with at least one expression of anger or fear, transitions through states with a predominance of L turns, including long two-way information exchanges, and transitions that perpetuate one-way information exchanges, are over-expressed (shown in warm colors in Fig. 8a). Conversely, transitions through states dominated by S, especially short two-way information exchanges, are under-expressed (shown in cool colors in Fig. 8a). CODYMs from conversations that are stratified by patient and clinician turns tell a more nuanced story. Not only do these show a larger range in absolute differences of transition frequencies between conversations with and without anger or fear than in the unstratified CODYM model (note the different ranges on the colorbars in Figs. 8a,b), but there are complementary changes in patients and clinicians. Most notably, conversations where anger or fear are expressed have more one-way information flow from patients to clinicians (Fig. 8b, left) and less one-way information flow from clinicians to patients (Fig. 8b, right), than do conversations with no anger or fear expressed. In addition, we see that the patient extends long two-way information exchanges significantly more often in conversations where they are expressing anger or fear.
The differences in CODYM transition frequencies between conversations with or without expressions of anger or fear were significant enough to produce a signal with predictive power. Random Forest classifiers, trained on conversation-level transition frequencies of 1st- through 5th-order CODYMs, were able to predict which conversations included any expression of anger and/or fear more often than expected by chance (, Table S1). Prediction accuracy (averaged over 1000 trained classifiers) was (a) slightly higher when using data from stratified vs. unstratified CODYMs, and (b) generally increased with increasing CODYM order. For example, the 3rd-order stratified transitions frequencies (shown in Fig. 8) yielded an average prediction accuracy of 64.5%, whereas 5th-order stratified transition frequencies raised that to 67.3%. Even 1st-order stratified transition frequencies exhibited an average prediction accuracy of nearly 60%.
Discussion
We have shown how CODYM analysis enables one to quantify, visualize, and compare high-level patterns in conversational dynamics from one or more conversations. We have made a deliberate choice to keep CODYMs simple, requiring only sequences of binarized turn lengths and using memory of only 2-3 turns. We have made these choices in order to facilitate interpretability, ensure adequate sample sizes, and to protect privacy. Because of this, there are many important conversational features that CODYMs, as defined here, do not directly incorporate, such as interruptions, overlapping speech, conversational pauses, accent, intonation, gestures, facial expressions and eye contact, all of which play some role in conversational discourse (e.g., see [57] for a discussion of the importance of “connectional silences” in serious illness conversations). Although any of the aforementioned features could be directly incorporated into a CODYM, the state space of the resulting model would be larger, less well populated, and more difficult to interpret. As illustrated by our analyses of hedging terms, treatment terms, and expression of distressing emotion, even simple turn-length-based CODYMs provide a means to consider additional verbal and non-verbal features, through contextualization.
CODYM visualizations effectively summarize the overall patterns of sequential dependencies in speaker turn lengths in concise plots, whose size and complexity are independent of the number of turns being analyzed. This facilitates rapid identification and comparison of patterns of information flow in sequences of turns that may include all or parts of one or many conversations. Since CODYM construction does not require access to detailed conversational content, the approach completely preserves the privacy of conversational participants and can conceptually be incrementally constructed in real-time, precluding the need for storage, or even transcription, of conversations (as discussed further in Conclusions and Future Work). Although CODYMs can be contextualized and can be used to study temporally discretized patterns in information flow, they are not natively designed to capture the turn-level flow of concepts in individual conversations. CODYMs and Discursis [29] are thus complementary methods for visualizing information flow in conversations at different scales and levels of detail.
Through unsupervised word clustering, we discovered that related groups of words often exhibit similar CODYM patterns. This, in itself, helps to validate that CODYMs represent semantically meaningful patterns of information flow. Three of the emergent clusters contained words that are specialized, to different degrees, for use in the short turns of one-way information exchanges, consisting primarily of strong, moderate, and weak continuers. This is consistent with conversation analytic theory, which suggests continuers are words or phrases used by speakers to convey they are relinquishing an opportunity to command the speaking floor, thus signaling the currently dominating speaker to continue [54, 55, 56]. Words in the strong and moderate continuer clusters alone appear 44,548 times in the PCCRI corpus (Table Supplemental Figures and Tables), accounting for 41.8% of all short turns in the corpus. The short two-way information exchange appears less frequently than expected by chance (Fig. 3), with one notable exception. Word clustering identified a group of openers and closers that occur disproportionately often during short two-way information exchanges (Fig. 5). The importance of openers and closers in conversation was explored by some of the early pioneers of conversation analysis [8, 58] and has been the subject of much attention since then [59, 60, 61, 62, 63]. These ritualistic transitions into and out of a conversation serve an important role, although little information need actually be exchanged. It is thus to be expected that openers and closers appear most often in short two-way exchanges (Fig. 5), and that this information flow pattern occurs most commonly at the beginnings and ends of conversations (Fig. 4a).
Conversation has generally been observed to be asymmetric, with a single dominant speaker holding the floor much of the time [64]. During these one-way information exchanges in didactic conversations, the typical alternating pattern of speakers results in one speaker taking all the long turns (being the “talker”) while the other takes the short turns (being the “listener”). This is particularly true in institutional settings with defined speaker roles [64], so we expect it will be prevalent in clinical conversations, given the power dynamics between clinicians and patients. Consistent with this expectation, one-way information exchanges from clinician-to-patient were observed to be the most common information sharing pattern in the PCCRI corpus (Fig. 3), and occurred throughout serious illness conversations at a roughly constant level (Fig. 4c). It is likely that these one-way clinician-to-patient information exchanges are often used for delivering information and treatment options related to the patient’s illness. Thus, it is not surprising that treatment terms are most often used when clinicians are in the talker role (Fig. 6), and words commonly used in clinical talk clustered together as words occurring most often during one-way information exchanges (Fig. 5), presumably when the clinician is the talker.
Overall, patients adopt the talker role less often than clinicians do, although still more frequently than expected by chance, in serious illness conversations (Fig. 3). In pooled patient turns, over all conversations in the corpus, one-way information exchanges from patient-to-clinician are most frequent near the centers of conversations and then steadily decline (Fig. 4b). These temporal changes in patient as talker are similar to the temporal patterns in the usage of treatment terms reported in [45], and also roughly coincide with temporal patterns in the expression of distressing emotions (Fig. S11). We also note that patient expressions of distressing emotion occur disproportionately often in long turns (Fig. S10), in particular during one-way patient-to-clinician information exchanges (Fig. 7). In our previous work, we observed that sentiment scores become increasingly positive over the course of the PCCRI conversations, which was largely attributed to a decrease in the use of disease-related terms that are ascribed negative sentiments [45]. We hypothesize that the palliative care clinicians in the PCCRI, trained to be highly skilled communicators, may be taking on the role of “good listener” [64] during portions of the conversation in which difficult topics are being discussed, as a means of encouraging the patients to express their values and preferences relating to available treatment options. After the patient has finished expressing themselves and one-way patient-to-clinician information exchanges abate, these serious illness conversations may then naturally come to a close.
We also observed an increase in the overall frequency of one-way patient-to-clinician information exchanges, along with a decrease in the prevalence of short two-way information exchanges and an increase in long two-way information exchanges, in conversations where fear or anger are expressed (Fig. 8). While these differences at the conversation level are modest, they are strong enough to have predictive power in distinguishing conversations with anger or fear from those without. This is especially true when the data are stratified by patient and clinician turns; but even when the speaker role is completely anonymized we find that differences in information flow patterns can be a marker for expression of distressing emotions. Our findings regarding the impact of distressing emotions on patterns of conversational dynamics are important because anger, fear, and sadness manifest frequently in palliative care conversations [53], and have been found to have therapeutic effects. Being able to process and express distressing emotions is linked to improved health outcomes for patients with cancer [65], and it has recently been shown in the PCCRI corpus that expression of anger, in particular, is associated with improvement in how much patients feel heard and understood by the clinical team following a palliative care consult [44].
Uncertainty is prevalent in the discussion of prognosis [66] and treatment options [67], where outcomes are often unknown. Effectively communicating this uncertainty is essential to having patients fully informed before they make decisions regarding their care [68, 69]. Helping patients to manage uncertainty is fundamental to patient-centered communication and may be a key ingredient in the beneficial effects of palliative care consultations on patient quality of life [67, 70, 71]. Hedging terms are often used to soften claims and insert uncertainty into a statement, and are the most prevalent subtype of uncertainty found in the PCCRI corpus [51]. As we found previously, the general story arc of conversations in the PCCRI corpus moves from discussion of symptoms, to treatments, to prognosis, to use of modal verbs, peaking in deciles 2,4,6,9, respectively [45]. Here, we observed that the use of hedging terms by clinicians is highest from deciles 5-9, coinciding with the parts of the conversations where prognosis terms and modal verbs (indicators of possibility) are most frequent. This suggests that clinicians may be using hedging terms in conveying prognostic uncertainty.
Long two-way information exchanges represent conversational regimes where alternating speakers are trading information. Although this is one of the least frequent information sharing patterns in the corpus (Fig. 3), it is more frequent in conversations where audible patient expressions of anger and fear occur (Fig. 8) and in turns when commonly used words associated with feelings are expressed (Fig. 5). It is thus interesting that long two-way exchanges are also over-represented when hedging terms are used, for both patients and clinicians (Fig. 6). This may indicate that there is bilateral sharing regarding uncertainty about difficult topics, as would be expected to occur when clinicians are actively helping patients to manage their uncertainty.
Conclusions and future work
We have presented and validated a novel approach to quantify and visualize the dynamics of information flow in conversations with CODYMs (COnversational DYnamics Models). CODYMs are the first Markov Model to use speaker turn length as the fundamental unit of information and to provide concise, high-level, quantitative summaries of overall dependencies in sequences of speaker turn lengths. This new approach facilitates identification and comparison of normative patterns of information flow across sequences of turns from one or more conversations, in context-independent or context-dependent ways. CODYMs complement existing qualitative and quantitative approaches for studying conversational dynamics, and comprise a new tool for conversational analysis. We provide open source code for populating, visualizing, and contextualizing CODYMs [72].
We applied the method to a unique and important corpus of palliative care consultations with seriously ill patients. We discovered normative patterns of information flow in these conversations that differ between patients and clinicians, and between conversations with and without expressions of distressing emotions. While these normative patterns are interesting in their own right, they may also have practical applications. For example, it would be interesting to compare normative CODYMs from in-person palliative care consultations to those conducted remotely, to see how telehealth platforms impact the patterns of information flow between patients and clinicians. Similarly, CODYM analysis of mock consultations between clinicians-in-training and actors portraying seriously ill patients could be used to assess how closely the information flow patterns of these training scenarios reflect those observed in palliative care consultations with real patients. If associations can be found between CODYM patterns and quality indicators of healthcare conversations (e.g., the degree to which patients feel heard and understood [73], a measure that is currently being considered for widespread use [74]), these could provide valuable insights for institutions seeking to improve the quality of conversations with seriously ill patients.
Achieving patient-centered care, in which clinical decisions are guided by patient preferences, needs, and perspectives [75], has long been recognized as a means for improving healthcare delivery [76]. Patient-centered communication, which includes recognizing and responding to emotions, helping patients to manage uncertainty, promoting reciprocal exchanges of information to create a shared understanding, and helping patients make informed decisions regarding their care, is central to achieving this aim [77]. However, it is not clear how to effectively measure or assess patient centered communication [67]. In this work, we have shown how CODYM analysis offers a new approach to quantifying and visualizing patterns of information flow related to markers of patient centered communication, such as the rates of one-way patient-to-clinician information exchanges and long two-way information exchanges, and how these rates change when distressing emotions or uncertainty are expressed. CODYMs may thus be helpful in assessing the degree to which clinical conversations are patient centered. For example, such an analysis could potentially be useful in understanding observed racial and ethnic disparities in prognosis communication [78].
It is not clear whether the conversational “fingerprints” uncovered in the PCCRI corpus are unique to serious illness conversations, or represent more general conversational paradigms in healthcare or other contexts. We suspect that the frequency of one-way patient-to-clinician information exchanges, and long two-way information exchanges, may be higher in serious illness communication relative to conversations in other clinical contexts (e.g., [79]). It will be fascinating to compare CODYMs across a wide variety of corpora from different languages, cultures, and contexts (including online conversations), to reveal which patterns of information flow in conversations are universal, and which are unique to certain settings.
Conversation analysis has traditionally been a discipline reliant on manual transcription of conversations with highly detailed annotations [6]. This is a resource-intensive process that requires full access to the often very private content of conversations. Indeed, the CODYM analyses presented here used transcriptions of audio-recordings of sensitive serious illness conversations. However, we envision an alternate formulation of CODYMs that uses turn duration (in seconds), in lieu of the number of words, for defining turn lengths. A time-based definition of turn length would facilitate real-time automation and analysis of conversational dynamics, precluding the need for transcription or even storage of conversational audio, thus completely protecting privacy. Large numbers of conversations are already taking place in a medium that is natively capable of capturing conversational data appropriate for automated CODYM analysis. For example, many popular video conferencing services already incorporate tools that automate the detection of speaker turns, and such services have exploded in popularity in the wake of the Covid-19 global pandemic. Ongoing advances in the automated detection of conversational features including speaker recognition [80, 81], emotion [82, 83], conversational pauses [57], empathy [84, 85], gaze patterns [86], and word recognition [87], will facilitate real-time analysis and contextualization of CODYMs. Ultimately, we foresee a fully-automated pipeline for CODYM analyses, with no compromise to the privacy of conversational content.
As more conversational data become available, whether as transcriptions or through real-time processing, CODYMs will be a valuable tool for studying information flow in a wide variety of contexts and contributing to our understanding of how to have more effective conversations. Such a tool could be of practical utility in training and assessment of high quality communication in healthcare and other application domains, while also yielding new theoretical insights into conversational dynamics across languages, cultures, and contexts.
Acknowledgments
This work was funded in part by a Research Scholar Grant from the American Cancer Society (RSG PCSM124655; PI: Robert Gramling), by the Holly & Bob Miller Endowed Chair in Palliative Medicine at the University of Vermont Larner College of Medicine, and by the National Science Foundation (NSF OIA 1556770; PI: Arne Bomblies, and NSF CRISP 1735513; PI: Paul Hines). We thank the American Cancer Society and the palliative care clinicians, patients, and families who participated in this work for their dedication to enhancing care for people with serious illness. We also thank S.B. Heinrich for constructive comments that helped us to improve the manuscript.
References
- [1] Prevignano C, Thibault PJ. Discussing conversation analysis: The work of Emanuel A. Schegloff. John Benjamins Publishing; 2003.
- [2] Sacks H, Schegloff EA, Jefferson G. A simplest systematics for the organization of turn taking for conversation. In: Studies in the Organization of Conversational Interaction. Elsevier; 1978. p. 7–55.
- [3] Coiera E. When conversation is better than computation. Journal of the American Medical Informatics Association. 2000;7(3):277–286.
- [4] Street Jr RL, Makoul G, Arora NK, Epstein RM. How does communication heal? Pathways linking clinician–patient communication to health outcomes. Patient Education and Counseling. 2009;74(3):295–301.
- [5] Stivers T, Enfield NJ, Brown P, Englert C, Hayashi M, Heinemann T, et al. Universals and cultural variation in turn-taking in conversation. Proceedings of the National Academy of Sciences. 2009;106(26):10587–10592.
- [6] Hutchby I, Wooffitt R. Conversation analysis. Polity; 2008.
- [7] Hoey EM, Kendrick KH. Conversation analysis. Research Methods in Psycholinguistics: A Practical Guide. 2017; p. 151–173.
- [8] Schegloff EA. Sequencing in conversational openings 1. American Anthropologist. 1968;70(6):1075–1095.
- [9] Bolden GB. Transcribing as research:“manual” transcription and conversation analysis. Research on Language and Social Interaction. 2015;48(3):276–280.
- [10] Westerman MA. Conversation analysis and interpretive quantitative research on psychotherapy process and problematic interpersonal behavior. Theory & Psychology. 2011;21(2):155–178.
- [11] Kasper G, Wagner J. Conversation analysis in applied linguistics. Annual Review of Applied Linguistics. 2014;34:171–212.
- [12] Gagniuc PA. Markov chains: from theory to implementation and experimentation. John Wiley & Sons; 2017.
- [13] Cristani M, Pesarin A, Drioli C, Tavano A, Perina A, Murino V. Generative modeling and classification of dialogs by a low-level turn-taking feature. Pattern Recognition. 2011;44(8):1785–1800.
- [14] Otsuka K, Takemae Y, Yamato J. A probabilistic inference of multiparty-conversation structure based on Markov-switching models of gaze patterns, head directions, and utterances. In: Proceedings of the 7th International Conference on Multimodal Interfaces. ACM; 2005. p. 191–198.
- [15] Kekre H, Saxena C, Srivastava H. A two-state Markov model of speech in conversation and its application to computer communication systems. Computers & Electrical Engineering. 1977;4(2):133–141.
- [16] Parker KC. Speaking turns in small group interaction: A context-sensitive event sequence model. Journal of Personality and Social Psychology. 1988;54(6):965.
- [17] Thomas AP, Bull P, Roger D. Conversational exchange analysis. Journal of Language and Social Psychology. 1982;1(2):141–155.
- [18] Core MG, Allen J. Coding dialogs with the DAMSL annotation scheme. In: AAAI Fall Symposium on Communicative Action in Humans and Machines. vol. 56. Boston, MA; 1997. p. 28–35.
- [19] Thomas AP. Conversational routines: A Markov chain analysis. Language & Communication. 1985;(5)4:287–296.
- [20] Thomas A. Describing the Structure of Conversation Using Markov Chains, Chain Analysis and Monte Carlo Simulation. Journal of Literary Semantics. 1987;16(3):159–181.
- [21] Stolcke A, Ries K, Coccaro N, Shriberg E, Bates R, Jurafsky D, et al. Dialogue act modeling for automatic tagging and recognition of conversational speech. Computational Linguistics. 2000;26(3):339–373.
- [22] Basu S, Choudhury T, Clarkson B, Pentland A, et al. Learning human interactions with the influence model. MIT Media Laboratory; 2001. Technical Report 539.
- [23] Pentland A. Social dynamics: The voice of power and influence. Tech Rep 579. 2004.
- [24] Pentland A. Learning communities—understanding information flow in human networks. BT Technology Journal. 2004;22(4):62–70.
- [25] Dong W, Lepri B, Cappelletti A, Pentland AS, Pianesi F, Zancanaro M. Using the influence model to recognize functional roles in meetings. In: Proceedings of the 9th International Conference on Multimodal Interfaces; 2007. p. 271–278.
- [26] Beck F, Burch M, Diehl S, Weiskopf D. A taxonomy and survey of dynamic graph visualization. In: Computer Graphics Forum. vol. 36. Wiley Online Library; 2017. p. 133–159.
- [27] Wulvik A, Jensen MB, Steinert M. Temporal Static Visualisation of Transcripts for Pre-Analysis of Video Material: Identifying Modes of Information Sharing. Anal Des Think Stud Cross-Cult Co-Creat Leiden CRC Press Francis. 2017.
- [28] Bergstrom T, Karahalios K. Seeing more: visualizing audio cues. In: IFIP Conference on Human-Computer Interaction. Springer; 2007. p. 29–42.
- [29] Angus D, Smith A, Wiles J. Conceptual recurrence plots: Revealing patterns in human discourse. IEEE Transactions on Visualization and Computer Graphics. 2011;18(6):988–997.
- [30] Thomas JJ, Cook KA. A visual analytics agenda. IEEE Computer Graphics and Applications. 2006;26(1):10–13.
- [31] Fusaroli R, Tylén K. Investigating conversational dynamics: Interactive alignment, Interpersonal synergy, and collective task performance. Cognitive Science. 2016;40(1):145–171.
- [32] Wong HM, Bridges SM, Ma KW, Yiu CKY, McGrath CP, Zayts OA. Advanced informatics understanding of clinician-patient communication: A mixed-method approach to oral health literacy talk in interpreter-mediated pediatric dentistry. PLoS One. 2020;15(3):e0230575.
- [33] Angus D, Watson B, Smith A, Gallois C, Wiles J. Visualising conversation structure across time: Insights into effective doctor-patient consultations. PLoS One. 2012;7(6):e38014.
- [34] Angus D, Rintel S, Wiles J. Making sense of big text: a visual-first approach for analysing text data using Leximancer and Discursis. International Journal of Social Research Methodology. 2013;16(3):261–267.
- [35] Watson BM, Angus D, Gore L, Farmer J. Communication in open disclosure conversations about adverse events in hospitals. Language & Communication. 2015;41:57–70.
- [36] Baker R, Angus D, Smith-Conway ER, Baker KS, Gallois C, Smith A, et al. Visualising conversations between care home staff and residents with dementia. Ageing and Society. 2015;35(2):270.
- [37] Haidet P, Paterniti DA. Building a history rather than taking one: A perspective on information sharing during the medical interview. Archives of Internal Medicine. 2003;163(10):1134–1140.
- [38] Bernacki RE, Block SD. Communication about serious illness care goals: a review and synthesis of best practices. JAMA Internal Medicine. 2014;174(12):1994–2003.
- [39] Tulsky JA, Beach MC, Butow PN, Hickman SE, Mack JW, Morrison RS, et al. A research agenda for communication between health care professionals and patients living with serious illness. JAMA Internal Medicine. 2017;177(9):1361–1366.
- [40] Dying in America: Improving quality and honoring individual preferences near the end of life. National Academies Press; 2015.
- [41] Ferrell B, Connor SR, Cordes A, Dahlin CM, Fine PG, Hutton N, et al. The national agenda for quality palliative care: the National Consensus Project and the National Quality Forum. Journal of Pain and Symptom Management. 2007;33(6):737–744.
- [42] Ryan P, Luz S, Albert P, Vogel C, Normand C, Elwyn G. Using artificial intelligence to assess clinicians’ communication skills. BMJ. 2019;364:l161.
- [43] Gramling R, Gajary-Coots E, Stanek S, Dougoud N, Pyke H, Thomas M, et al. Design of, and enrollment in, the palliative care communication research initiative: a direct-observation cohort study. BMC palliative care. 2015;14(1):40.
- [44] Gramling R, Straton J, Ingersoll L, Clarfeld L, Hirsch L, Gramling C, et al. Epidemiology of Fear, Sadness and Anger Expression in Palliative Care Conversations. Journal of Pain and Symptom Management. 2020; in press, preprint available online at: https://doi.org/10.1016/j.jpainsymman.2020.08.017.
- [45] Ross L, Danforth CM, Eppstein MJ, Clarfeld LA, Durieux BN, Gramling CJ, et al. Story Arcs in Serious Illness: Natural Language Processing features of Palliative Care Conversations. Patient Education and Counseling. 2020;103(4):826–832.
- [46] Pedregosa F, Varoquaux G, Gramfort A, Michel V, Thirion B, Grisel O, et al. Scikit-learn: Machine Learning in Python. Journal of Machine Learning Research. 2011;12:2825–2830.
- [47] Vincze V. Uncertainty detection in natural language texts; 2015. PhD Dissertation, SZTE.
- [48] Strekalova YA, James VS. Language of uncertainty: The expression of decisional conflict related to skin cancer prevention recommendations. Journal of Cancer Education. 2017;32(3):532–536.
- [49] Han PK, Klein WM, Arora NK. Varieties of uncertainty in health care: a conceptual taxonomy. Medical Decision Making. 2011;31(6):828–838.
- [50] Hanauer DA, Liu Y, Mei Q, Manion FJ, Balis UJ, Zheng K. Hedging their mets: the use of uncertainty terms in clinical documents and its potential implications when sharing the documents with patients. In: AMIA Annual Symposium Proceedings. vol. 2012. American Medical Informatics Association; 2012. p. 321.
- [51] Durieux BN. Uncertainty Corpus; 2019. Available from: https://vermontconversationlab.com/uncertainty-corpus/.
- [52] Ingersoll LT, Alexander SC, Ladwig S, Anderson W, Norton SA, Gramling R. The contagion of optimism: The relationship between patient optimism and palliative care clinician overestimation of survival among hospitalized patients with advanced cancer. Psycho-oncology. 2019;28(6):1286–1292.
- [53] Alexander SC, Ladwig S, Norton SA, Gramling D, Davis JK, Metzger M, et al. Emotional distress and compassionate responses in palliative care decision-making consultations. Journal of Palliative Medicine. 2014;17(5):579–584.
- [54] Jefferson G. Notes on a systematic deployment of the acknowledgement tokens “yeah”; and “mm hm”. Taylor & Francis, 1984.
- [55] Schegloff EA. Discourse as an interactional achievement: Some uses of ‘uh huh’ and other things that come between sentences. Analyzing Discourse: Text and Talk. 1982;71:93.
- [56] Yngve VH. On getting a word in edgewise. In: Chicago Linguistics Society, 6th Meeting, 1970. p. 567–578.
- [57] Durieux BN, Gramling CJ, Manukyan V, Eppstein MJ, Rizzo DM, Ross LM, et al. Identifying connectional silence in palliative care consultations: a tandem machine-learning and human coding method. Journal of Palliative Medicine. 2018;21(12):1755–1760.
- [58] Schegloff EA, Sacks H. Opening up closings. Semiotica. 1973;8(4):289–327.
- [59] Miller DE, Hintz RA, Couch CJ. The elements and structure of openings. Sociological Quarterly. 1975;16(4):479–499.
- [60] Button G. On varieties of closings. Interaction Competence. 1990;93:148.
- [61] Robinson JD. Getting down to business: Talk, gaze, and body orientation during openings of doctor-patient consultations. Human Communication Research. 1998;25(1):97–123.
- [62] LeBaron CD, Jones SE. Closing up closings: Showing the relevance of the social and material surround to the completion of interaction. Journal of Communication. 2002;52(3):542–565.
- [63] Markman KM. “So What Shall We Talk About” Openings and Closings in Chat-Based Virtual Meetings. International Journal of Business Communication. 2009;46(1):150–170.
- [64] Itakura H. Describing conversational dominance. Journal of Pragmatics. 2001;33(12):1859–1880.
- [65] Stanton AL, Danoff-Burg S, Cameron CL, Bishop M, Collins CA, Kirk SB, et al. Emotionally expressive coping predicts psychological and physical adjustment to breast cancer. Journal of Consulting and Clinical Psychology. 2000;68(5):875.
- [66] Sullivan AM, Lakoma MD, Matsuyama RK, Rosenblatt L, Arnold RM, Block SD. Diagnosing and discussing imminent death in the hospital: a secondary analysis of physician interviews. Journal of Palliative Medicine. 2007;10(4):882–893.
- [67] McCormack LA, Treiman K, Rupert D, Williams-Piehota P, Nadler E, Arora NK, et al. Measuring patient-centered communication in cancer care: a literature review and the development of a systematic approach. Social Science & Medicine. 2011;72(7):1085–1095.
- [68] Epstein RM, Alper BS, Quill TE. Communicating evidence for participatory decision making. JAMA. 2004;291(19):2359–2366.
- [69] Chow J, Senderovich H. It’s time to talk: challenges in providing integrated palliative care in advanced congestive heart failure. a narrative review. Current Cardiology Reviews. 2018;14(2):128–137.
- [70] Kimbell B, Boyd K, Kendall M, Iredale J, Murray SA. Managing uncertainty in advanced liver disease: a qualitative, multiperspective, serial interview study. BMJ Open. 2015;5(11).
- [71] Gramling R, Stanek S, Han PK, Duberstein P, Quill TE, Temel JS, et al. Distress due to prognostic uncertainty in palliative care: frequency, distribution, and outcomes among hospitalized patients with advanced cancer. Journal of Palliative Medicine. 2018;21(3):315–321.
- [72] Clarfeld LA. Source code for COnversation DYnamics Model analysis. A link to source code will be provided when the article is accepted for publication; 2020.
- [73] Gramling R, Stanek S, Ladwig S, Gajary-Coots E, Cimino J, Anderson W, et al. Feeling heard and understood: a patient-reported quality measure for the inpatient palliative care setting. Journal of Pain and Symptom Management. 2016;51(2):150–154.
- [74] National Coalition for Hospice and Palliative Care. MACRA Palliative Care Quality Measures Project; 2019. Available from: https://www.nationalcoalitionhpc.org/macra/.
- [75] NEJM Catalyst. What Is Patient-Centered Care? NEJM Catalyst. 2017;3(1).
- [76] Baker A. Crossing the quality chasm: a new health system for the 21st century. vol. 323. British Medical Journal Publishing Group; 2001.
- [77] Epstein R. Patient-centered communication in cancer care: promoting healing and reducing suffering. 7. US Department of Health and Human Services, National Institutes of Health, National Cancer Institute; 2007.
- [78] Ingersoll LT, Alexander SC, Priest J, Ladwig S, Anderson W, Fiscella K, et al. Racial/ethnic differences in prognosis communication during initial inpatient palliative care consultations among people with advanced cancer. Patient Education and Counseling. 2019;102(6):1098–1103.
- [79] Chhabra KR, Pollak KI, Lee SJ, Back AL, Goldman RE, Tulsky JA. Physician communication styles in initial consultations for hematological cancer. Patient Education and Counseling. 2013;93(3):573–578.
- [80] Gómez-García J, Moro-Velázquez L, Godino-Llorente JI. On the design of automatic voice condition analysis systems. Part I: Review of concepts and an insight to the state of the art. Biomedical Signal Processing and Control. 2019;51:181–199.
- [81] Gómez-García J, Moro-Velázquez L, Godino-Llorente JI. On the design of automatic voice condition analysis systems. Part II: Review of speaker recognition techniques and study on the effects of different variability factors. Biomedical Signal Processing and Control. 2019;48:128–143.
- [82] Schuller BW. Speech emotion recognition: Two decades in a nutshell, benchmarks, and ongoing trends. Communications of the ACM. 2018;61(5):90–99.
- [83] Zhang D, Wu L, Sun C, Li S, Zhu Q, Zhou G. Modeling both Context-and Speaker-Sensitive Dependence for Emotion Detection in Multi-speaker Conversations. In: IJCAI; 2019. p. 5415–5421.
- [84] Alam F, Danieli M, Riccardi G. Annotating and modeling empathy in spoken conversations. Computer Speech & Language. 2018;50:40–61.
- [85] Chen Z, Gibson J, Chiu MC, Hu Q, Knight TK, Meeker D, et al. Automated Empathy Detection for Oncology Encounters. arXiv preprint arXiv:200700809. 2020.
- [86] Sogo H. GazeParser: an open-source and multiplatform library for low-cost eye tracking and analysis. Behavior Research Methods. 2013;45(3):684–695.
- [87] Tabibian S. A survey on structured discriminative spoken keyword spotting. Artificial Intelligence Review. 2020;53(4):2483–2520.
Supplemental Figures and Tables
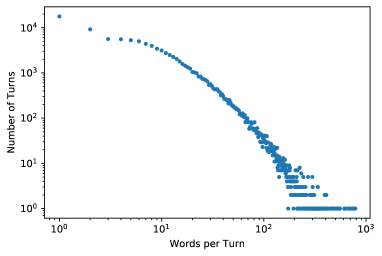
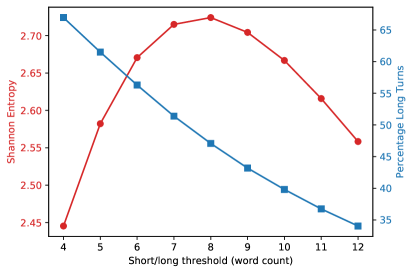
| Unstratified Data | Stratified Data | |||||||
|---|---|---|---|---|---|---|---|---|
| Order | # of Features | (%) | (%) | # of Features | (%) | (%) | ||
| 1 | 4 | 58.8 | 5.3 | 0.048 | 8 | 59.5 | 5.5 | 0.042 |
| 2 | 8 | 60.3 | 5.2 | 0.024 | 16 | 62.4 | 5.5 | 0.012 |
| 3 | 16 | 64.4 | 5.5 | 0.004 | 32 | 64.5 | 5.3 | 0.003 |
| 4 | 32 | 64.2 | 5.2 | 0.003 | 64 | 64.8 | 5.6 | 0.004 |
| 5 | 64 | 65.4 | 5.3 | 0.002 | 128 | 67.3 | 5.2 | < 0.001 |
| Term | Patient | Clinician |
|---|---|---|
| think | 2652 | 4204 |
| guess | 453 | 199 |
| worr* | 235 | 316 |
| hope | 162 | 293 |
| expect | 79 | 163 |
| seem | 78 | 159 |
| imagine | 41 | 108 |
| consider | 30 | 90 |
| risk | 21 | 115 |
| doubt | 18 | 8 |
| suppose | 16 | 7 |
| predict | 9 | 24 |
| suggest | 7 | 59 |
| theor* | 7 | 9 |
| estimate | 5 | 14 |
| foresee | 3 | 4 |
| anticipate | 2 | 42 |
| assess | 2 | 17 |
| perceive | 2 | 4 |
| contemplate | 1 | 2 |
| presume | 1 | 1 |
| ponder | 1 | 0 |
| suspect | 0 | 18 |
| hint | 0 | 2 |
| speculate | 0 | 1 |
| imply | 0 | 1 |
| hypothesi* | 0 | 1 |
| prognosticate | 0 | 0 |
| presuppose | 0 | 0 |
| postulate | 0 | 0 |
| misjudge | 0 | 0 |
| misinterpret | 0 | 0 |
| infer | 0 | 0 |
| deem | 0 | 0 |
| allude to | 0 | 0 |
| Term | Patient | Clinician |
|---|---|---|
| hospice | 413 | 1435 |
| chemo | 369 | 157 |
| radiation | 303 | 467 |
| medicine | 289 | 816 |
| surgery | 236 | 199 |
| medication | 195 | 459 |
| dilaudid | 186 | 363 |
| treatment | 181 | 586 |
| pills | 161 | 177 |
| tube | 121 | 380 |
| pill | 120 | 114 |
| morphine | 111 | 212 |
| medical | 107 | 455 |
| oxycodone | 98 | 192 |
| therapy | 96 | 166 |
| iv | 93 | 304 |
| tylenol | 85 | 83 |
| drug | 83 | 45 |
| oxygen | 80 | 81 |
| drugs | 80 | 38 |
| medications | 79 | 425 |
| dialysis | 78 | 154 |
| patch | 73 | 214 |
| procedure | 72 | 75 |
| dose | 66 | 430 |
| meds | 65 | 46 |
| fentanyl | 64 | 138 |
| methadone | 63 | 200 |
| line | 63 | 66 |
| chemotherapy | 58 | 350 |
| machine | 56 | 126 |
| treatments | 54 | 469 |
| ativan | 48 | 67 |
| milligrams | 47 | 90 |
| liquid | 47 | 76 |
| button | 45 | 116 |
| medicines | 43 | 402 |
| ventilator | 42 | 159 |
| trial | 40 | 74 |
| feeding | 40 | 67 |
| management | 39 | 217 |
| treat | 38 | 191 |
| icu | 37 | 70 |
| fluids | 34 | 83 |
| antibiotics | 33 | 132 |
| oral | 21 | 82 |
| nutrition | 20 | 107 |
| doses | 17 | 135 |
| resuscitation | 17 | 101 |
| cpr | 17 | 78 |
| milligram | 9 | 33 |
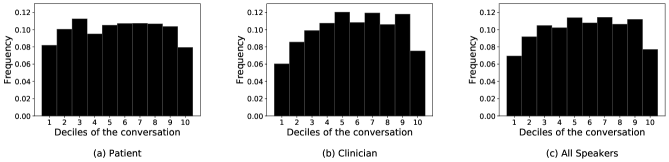
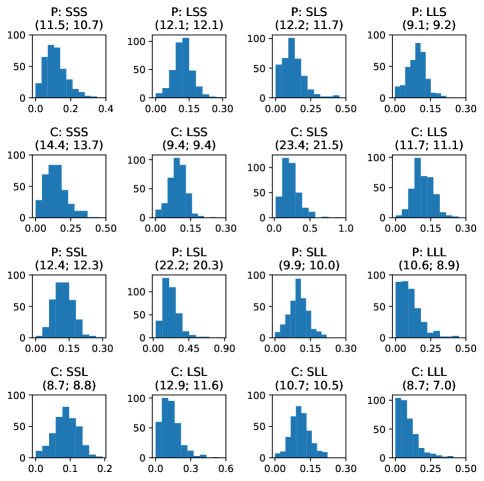
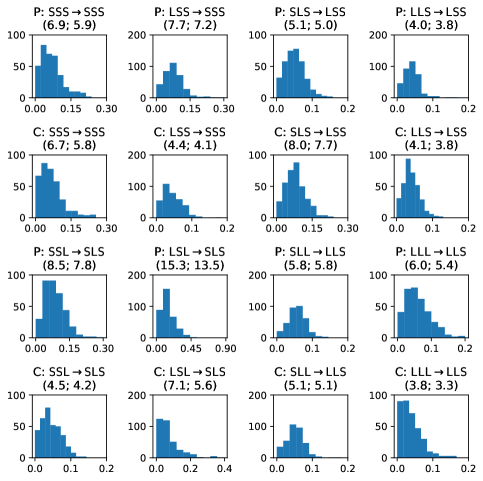
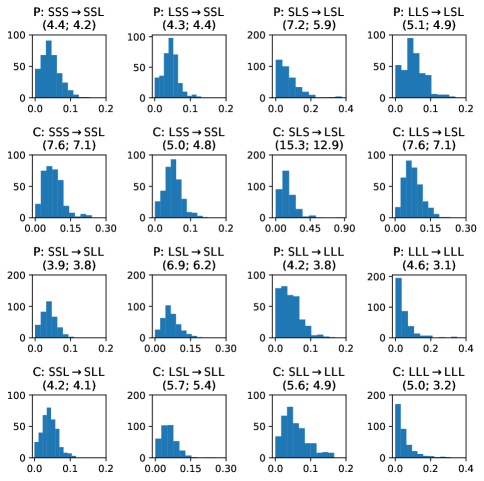
| State | Patient vs. Clinician | Patient vs. Null | Clinician vs. Null |
|---|---|---|---|
| SSS | <0.001 | <0.001 | <0.001 |
| SSL | <0.001 | <0.001 | <0.001 |
| SLS | <0.001 | <0.001 | <0.001 |
| SLL | <0.001 | <0.001 | <0.001 |
| LSS | <0.001 | <0.001 | <0.001 |
| LSL | <0.001 | <0.001 | <0.001 |
| LLS | 0.063 | <0.001 | <0.001 |
| LLL | 0.002 | <0.001 | <0.001 |
| Transition | Patient vs. Clinician | Patient vs. Null | Clinician vs. Null |
|---|---|---|---|
| 0.811 | <0.001 | <0.001 | |
| <0.001 | <0.001 | <0.001 | |
| <0.001 | <0.001 | <0.001 | |
| <0.001 | <0.001 | <0.001 | |
| <0.001 | <0.001 | <0.001 | |
| <0.001 | <0.001 | <0.001 | |
| 0.504 | <0.001 | <0.001 | |
| <0.001 | <0.001 | <0.001 | |
| <0.001 | <0.001 | <0.001 | |
| 0.187 | <0.001 | <0.001 | |
| <0.001 | <0.001 | <0.001 | |
| <0.001 | <0.001 | <0.001 | |
| 0.014 | <0.001 | <0.001 | |
| <0.001 | <0.001 | <0.001 | |
| <0.001 | <0.001 | <0.001 | |
| 0.627 | <0.001 | <0.001 |
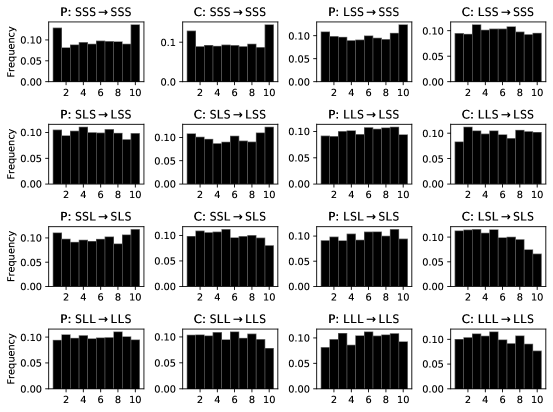
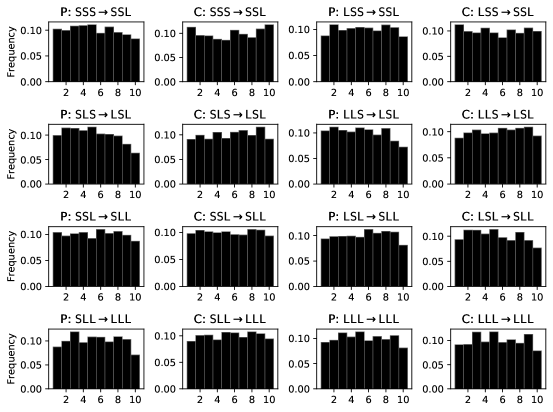
| Cluster Moniker (# words) | Unique Words (# occurrences in PCCRI corpus) |
| Strong Continuers (4 words) | \pbox20cmhm (1987); hmm (1896); mm (1263); aha (277) |
Moderate Continuers (10 words) \pbox20cmyeah (15367); okay (12332); oh (3607); uh (3288); yes (2611); huh (527); absolutely (402); wow (354); yup (334); yep (303)
Weak Continuers (19 words) \pbox20cmright (9663); no (6009); p_name (2578); nice (1032); great (775); fine (679); sorry (630); exactly (465); alright (438); meeting (266); true (247); appreciate (210); correct (191); please (188); perfect (150); appetite (141); beautiful (129); u_date (118); boy (114)
Openers/Closers (7 words) \pbox20cmthank (1232); meet (565); hi (404); thanks (192); welcome (135); hello (125); bye (111)
Clinical Talk (51 words): \pbox20cmum (5993); also (1350); sort (978); may (907); comfort (685); symptoms (623); treatments (525); whether (423); chemotherapy (409); continue (337); disease (267); methadone (263); focus (256); lungs (251); means (233); treat (230); acting (228); system (194); symptom (186); machine (183); oncology (182); likely (176); safe (170); fix (163); recommend (159); show (158); illness (157); page (148); folks (145); decided (139); controlled (135); outpatient (133); homes (130); setting (126); clinic (125); further (124); belly (124); approach (124); death (122); spot (120); consider (120); kept (117); ended (114); words (109); example (108); icu (106); cpr (105); finally (105); depending (103); depressed (102); stronger (101)
Potpourri (23 words): \pbox20cmwell (5239); old (263); 5 (204); u_name (178); hurts (176); tylenol (170); totally (169); agree (165); friend (165); button (159); lives (144); middle (142); concern (141); card (138); risk (137); cold (117); covered (116); fair (116); hit (115); confused (107); scary (104); mg (104); funny (103)
| Transition | ALL | SC | MC | WC | OC | CT | PP |
| 3.0 | 13.3 | 14.2 | 11.0 | 27.6 | 1.3 | 4.4 | |
| 2.7 | 7.4 | 8.5 | 7.0 | 12.7 | 1.3 | 4.0 | |
| 3.3 | 50.9 | 26.7 | 12.1 | 11.1 | 1.1 | 3.9 | |
| 2.0 | 17.6 | 13.8 | 6.3 | 4.4 | 0.9 | 2.9 | |
| 18.1 | 2.0 | 8.5 | 15.5 | 17.1 | 15.9 | 20.0 | |
| 35.8 | 2.0 | 11.1 | 21.4 | 12.5 | 47.7 | 24.5 | |
| 17.7 | 4.0 | 10.0 | 13.7 | 7.7 | 15.1 | 19.5 | |
| 17.4 | 2.9 | 7.2 | 12.9 | 6.9 | 16.8 | 20.8 |