TOTOPO: Classifying univariate and multivariate time series with Topological Data Analysis
Abstract
This work is devoted to a comprehensive analysis of topological data analysis for time series classification. Previous works have significant shortcomings, such as lack of large-scale benchmarking or missing state-of-the-art methods. In this work, we propose TOTOPO for extracting topological descriptors from different types of persistence diagrams. The results suggest that TOTOPO significantly outperforms existing baselines in terms of accuracy. TOTOPO is also competitive with the state-of-the-art, being the best on 20% of univariate and 40% of multivariate time series datasets. This work validates the hypothesis that TDA-based approaches are robust to small perturbations in data and are useful for cases where periodicity and shape help discriminate between classes.
1 Introduction
Working with time-series data is a perennial challenge in science. In medicine, classification of electrocardiogram allows detecting anomalies associated with different illnesses, [11]. In ornithology, scientists can classify audio signals of recorded bird sounds for species recognition, [16]. These are, however, cases of univariate time series. The multivariate case remains specially difficult, as it is seen on the established benchmark in the time-series community by [3]. Compared to univariate time-series, methods for multivariate data remain uncommon. Similarly, their performance is often underwhelming.
Entries, such as [13], [7], [1], [19], validate the significance of topological data analysis (TDA) for time series data analysis. TDA is a set of statistical methods aimed to analyse complex datasets. It relies on ideas from topology and computational geometry, [6]. Especially useful in the case of high-dimensional, complex datasets, as it allows to identify structure and shape. This makes TDA robust to small perturbations in data, [4]. Similarly, TDA can extract seasonality and periodicity, [14], [5]. Authors have found success with TDA for a wide array of applications ranging from marketing data, [18], to cryptocurrencies, [17]. This highlights one of its benefits. It does not require particular assumptions on the data. These characteristics make TDA-based models interesting to address the classification of time series.
Innovation
This work features several innovations compared to other works, such as [10], [20], [23], [15], [22]. Firstly, we compare our approach not only with baseline models, such as 1-Nearest Neighbour Euclidean or Dynamic Time Wrapping models. Rather than that, we also compare TOTOPO with other TDA-based approaches. These techniques are either widely discussed in the literature or are current state-of-the-art models for time series classification. Secondly, common approaches for application of TDA to time series usually rely on creating point clouds from time series data using sliding windows. Our approach, on the other hand, additionally includes direct persistence diagrams. They enable us to enrich the model with additional relevant features. Finally, we combine models based on different TDA descriptors as an ensemble. This allows us to enrich TOTOPO even further. With this, we make it more flexible for different types of signals.
Approach
In general, our proposed approach consists of four steps. First, we create Persistence Diagrams from time series. We do this both directly and using sliding windows. Second, we calculate TDA inputs from the PDs. Third, we train base learners on these TDA inputs as well as the original time series. Finally, we generate an ensemble of base learners.
2 Topological ideas behind
To create the topological inputs, first, we extract persistence diagrams from the original signals in two ways. We do a direct extraction. Also, we do a transformation of the time series with a sliding window. [4] described how to do a direct extraction of persistence diagrams from signals. Such persistence diagrams contain information about extreme points and thus shape of time series. Our work is the first in the time-series classification literature to use summaries from these diagrams. Further, we transform time series into point clouds using sliding windows embedding and extract PDs from them. This is akin to the works of [20] and [15].
3 TOTOPO
In order to include TDA into machine learning pipeline, we create TDA Inputs, which summarize relevant information from PDs. In this work, three main sets of TDA Inputs are calculated: Betti series, -norms series and TDA Summaries.
Feature extraction
For each Persistence Diagram (), we calculate features separately for the set of 0-dim and 1-dim persistent holes. We describe the following five features. First, the number of holes of each dimension . It is the number of points in the , we define them as . Second, the maximal lifetime of holes of each dimension. Lifetime is the difference between death and birth, . Third, the number of "relevant" holes of each dimension. This is the number of points with a lifetime higher or equal than . is the parameter describing the strength of relevancy. Fourth, the average lifetime of holes of each dimension . Fifth, the sum of lifetimes of all holes of each dimension . Since direct PDs contain only -dimensional holes, we extract only one set of five features from them. Overall, TDA Summaries is a set of 15 numerical values. They summarize information from persistence diagrams.
Betti series
Another topological input that we use is Betti series, [22]. For each dimension, Betti series is a sequence of Betti numbers . is an arbitrary number. In our case, it is set to 100. Each Betti number shows how many persistent holes are "alive" at a particular radius. Thus, Betti series is a sequence of Betti numbers for each radius.
L2 norms
[10] and [9] discuss the advantages of -norms for time series analysis. They serve as an inspiration for this work. Firstly, we extract point clouds from each time series, using sliding windows of size . Further, we apply a larger sliding window of size to vectors from . It creates a series of small point clouds of size . Then for each of these point clouds, we calculate the persistence diagrams and persistence landscapes. Finally, we extract a series of norms from consequent persistence landscapes. We can define it as . Here, are lines in a persistence landscape.
Base learner
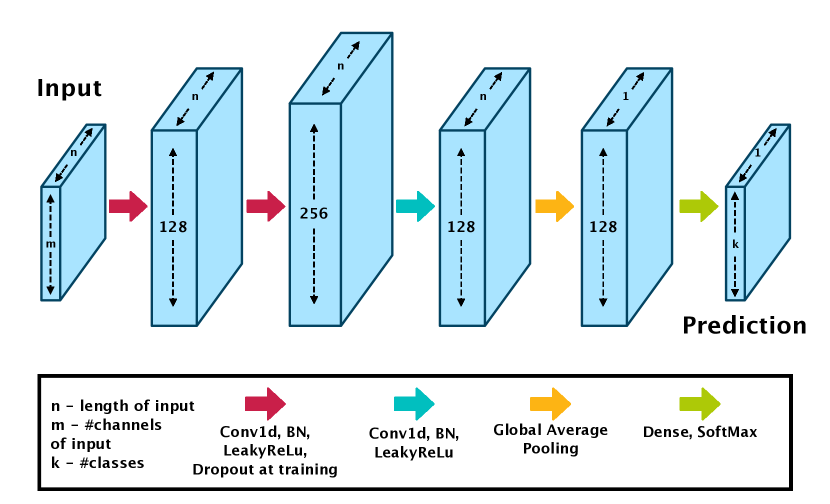
We summarize the architecture of the base learner in Figure 2. The architecture can process multi-channel input signals or features. It contains three convolutional blocks, global averaging, and fully connected layer with SoftMax activation in the end. As an activation function, we use LeakyReLu. Also, we consider dropout for training at the end of two blocks out of three, to avoid overfitting. Further, we train the base learners on four sets of inputs: TS — original time series, Betti series, -norms, and TDA Summaries.
Ensembling
The approaches of [3] and [12] inspire our ensemble. When we train the base learners, we save their training losses for each dataset. Then we weight the predictions of each model by its rank among other models. We sum all weighted predictions to obtain the final one. The final prediction is thus the class with a maximal weighted probability. We outline the ensemble in Algorithm 1.
4 Discussion of results
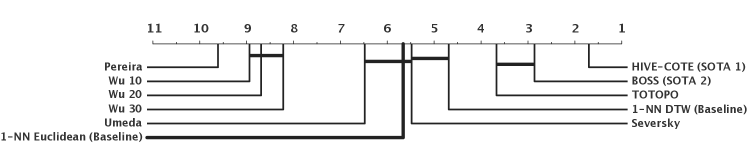
We compare TOTOPO against four techniques widely used in the time series community and other TDA-based time series classifiers. From [3], we consider 78 datasets for the comparison. To evaluate the overall performance of algorithms, we use the critical difference (CD) diagram. We present it in Figure 1. TOTOPO is the third best classifier in the 78 datasets. It is statistically similar to the state-of-the-art method BOSS. TOTOPO beats BOSS on 44% of the datasets.
Multivariate time series
Multivariate time series methods have less entries in the literature than their univariate counterparts. Most methods work either for univariate or for multivariate time series. This is true for the state of the art models for univariate data, such as HIVE-COTE. TOTOPO has an outstanding characteristic. For multivariate time series, TOTOPO belongs to the state-of-the-art in terms of performance. For this evaluationn, we use the datasets available in [2]. We can see the results in a comparison against two baselines and a novel SOTA deep-learning architecture by Franceschi, [8]. Table 1 presents the average ranks for each model. Lower values are better. Our model is the second best performer in the comparison.
| Method | Average Rank | Method | Average Rank |
|---|---|---|---|
| Franceschi | 1.79 | 1-NN DTW | 2.58 |
| TOTOPO | 2.5 | 1-NN Euclidean | 3.11 |
Best results
We want to highlight the dataset 4-channel ERing. The data is related to Human Activity Recognition. On this dataset, our approach significantly outperforms all other methods. It has an accuracy of 94.4% as opposed to an average accuracy of 13.3% in the comparison. Similarly, TOTOPO excels on the univariate datasets of type DEVICE. We show in LABEL:univariate_res the improvement over Dynamic Time Warping. Our approach outperforms all methods. This is the case for both baselines and state-of-the-art, HIVE-COTE and BOSS, on five out of six datasets. Time series from this source type correspond to different devices’ electricity consumption. These time series have regions of periodic behaviour. We assume that TDA makes use of this characteristic.
Limitations
TOTOPO underperforms with datasets containing similar classes. This is the case, for example, for the OliveOil dataset. The differences between classes among the time series are extremely small. Our explanation is that TDA is invariant to constant shifts and small perturbations in data. It requires larger differences in the classes to generate different homologies.
| Seversky | Wu 30 | Pereira | Umeda | HC | BOSS | TOTOPO | ||
|---|---|---|---|---|---|---|---|---|
| Type | Dataset | |||||||
| DEVICE | LargeKitchenAppliances | -6,93 | -46,14 | 2,94 | -9,33 | 6.93 | -2.94 | 9.33 |
| SmallKitchenAppliances | -21,06 | -50,94 | -8,26 | -21,33 | 21.06 | 8.26 | 21.33 | |
| ScreenType | -19,2 | -6,4 | -6,67 | -23,2 | 19.2 | 6.67 | 23.2 | |
| RefrigerationDevices | -9,33 | -10,67 | -3,47 | -14,13 | 9.33 | 3.47 | 14.13 | |
| ElectricDevices | -16,82 | N/A | -19,71 | -16,29 | 16.82 | 19.71 | 16.29 | |
| Computers | -6 | -20 | -5,59 | -12,8 | 6 | 5.6 | 12.8 |
Noise robustness exploration
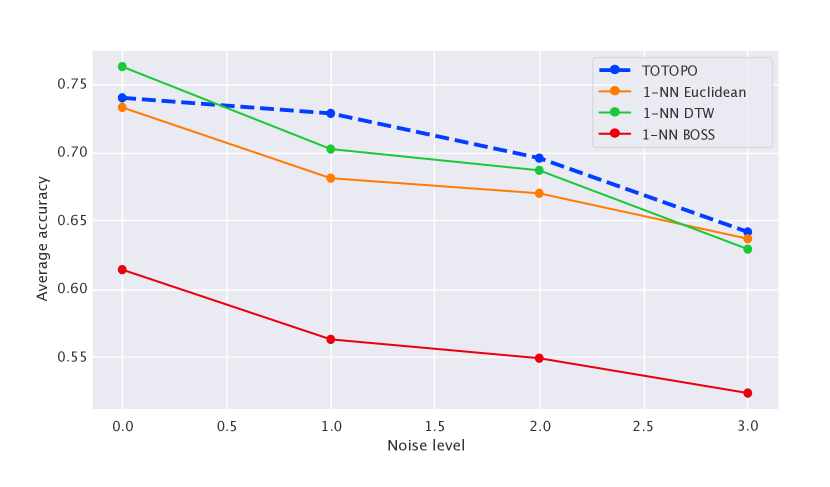
We want to understand the robustness of TOTOPO. For this, we apply three noise levels to the signals. For each noise level we use a targeted Signal to Noise Ration (SNR). We express it in decibels: 10dB, 15dB and 20dB. For each time series , we conver SNR into a linear one. We follow the suggestions in [21]. For the comparison, we plot average accuracies for each noise level on Figure 3. On the -axis, we show noise levels. "0" corresponds to the original time series. "1" is equivalent to an SNR of 20dB, "2" for 15dB and "3" for 10dB. For small noise levels, TOTOPO outperforms all other models. Its accuracy deteriorates less. Overall, this suggests that TDA is indeed robust to noise, especially in case of small changes.
5 Outlook
We aim to improve the base learner classifiers in future works. This includes the hyperparameter tuning for each of the datasets. There is also space to optimize the architecture. Additionally, we seek to evaluate the addition of non-topological descriptors into the model. With this, we want to overcome the methodological problems of TOTOPO described in section 4. These can be features to account for constant shifts in data. We can also use other common descriptors for time series data, i.e., autocorrelation, Fourier coefficients, etc. Moreover, we aim to create and evaluate new topological descriptors. They will allow us to improve TOTOPO even further.
References
- [1] K. L. Anderson, J. S. Anderson, S. Palande, and B. Wang. Topological Data Analysis of Functional MRI Connectivity in Time and Space Domains. pages 67–77. 2018.
- [2] A. Bagnall, H. A. Dau, J. Lines, M. Flynn, J. Large, A. Bostrom, P. Southam, and E. Keogh. The UEA multivariate time series classification archive, 2018. pages 1–36, 2018.
- [3] A. Bagnall, J. Lines, A. Bostrom, J. Large, and E. Keogh. The great time series classification bake off: a review and experimental evaluation of recent algorithmic advances. Data Mining and Knowledge Discovery, 31(3):606–660, may 2017.
- [4] D. Cohen-Steiner, H. Edelsbrunner, and J. Harer. Stability of Persistence Diagrams. Discrete & Computational Geometry, 37(1):103–120, jan 2007.
- [5] P. Dłotko, W. Qiu, and S. Rudkin. Cyclicality, Periodicity and the Topology of Time Series. pages 1–37, 2019.
- [6] Edelsbrunner, Letscher, and Zomorodian. Topological Persistence and Simplification. Discrete & Computational Geometry, 28(4):511–533, nov 2002.
- [7] N. J. L. et al. Topological data analysis for discovery in preclinical spinal cord injury and traumatic brain injury. Nature Communications, 6(1):8581, dec 2015.
- [8] J.-Y. Franceschi and M. Jaggi. Unsupervised Scalable Representation Learning for Multivariate Time Series. Technical report, 2020.
- [9] M. Gidea, D. Goldsmith, Y. Katz, P. Roldan, and Y. Shmalo. Topological recognition of critical transitions in time series of cryptocurrencies. pages 1–29, 2018.
- [10] M. Gidea and Y. Katz. Topological data analysis of financial time series: Landscapes of crashes. Physica A: Statistical Mechanics and its Applications, 491:820–834, 2017.
- [11] S. H. Jambukia, V. K. Dabhi, and H. B. Prajapati. Classification of ECG signals using machine learning techniques: A survey. In 2015 International Conference on Advances in Computer Engineering and Applications, pages 714–721. IEEE, mar 2015.
- [12] J. Lines, S. Taylor, and A. Bagnall. Time series classification with HIVE-COTE: The hierarchical vote collective of transformation-based ensembles. ACM Transactions on Knowledge Discovery from Data, 12(5), 2018.
- [13] A. M, J. D, D. N, and K. AC. A Multimodal Data Analysis Approach for Targeted Drug Discovery Involving Topological Data Analysis (TDA). Advances in experimental medicine and biology, 899, 2016.
- [14] J. A. Perea and J. Harer. Sliding Windows and Persistence: An Application of Topological Methods to Signal Analysis. Foundations of Computational Mathematics, 15(3):799–838, 2015.
- [15] C. M. M. Pereira and R. F. De Mello. Persistent homology for time series and spatial data clustering. Expert Systems With Applications, 42:6026–6038, 2015.
- [16] K. Qian, Z. Zhang, F. Ringeval, and B. Schuller. Bird sounds classification by large scale acoustic features and extreme learning machine. In 2015 IEEE Global Conference on Signal and Information Processing (GlobalSIP), pages 1317–1321. IEEE, dec 2015.
- [17] R. Rivera-Castro, P. Pilyugina, and E. Burnaev. Topological data analysis for portfolio management of cryptocurrencies. In 2019 International Conference on Data Mining Workshops (ICDMW), pages 238–243, Nov. 2019.
- [18] R. Rivera-Castro, P. Pilyugina, A. Pletnev, I. Maksimov, W. Wyz, and E. Burnaev. Topological Data Analysis of Time Series Data for B2B Customer Relationship Management. may 2019.
- [19] R. Rivera-Castro, A. Pletnev, P. Pilyugina, G. Diaz, I. Nazarov, W. Zhu, and E. Burnaev. Topology-Based clusterwise regression for user segmentation and demand forecasting. In 2019 IEEE International Conference on Data Science and Advanced Analytics (DSAA), pages 326–336, Oct. 2019.
- [20] L. M. Seversky, S. Davis, and M. Berger. On Time-Series Topological Data Analysis: New Data and Opportunities. IEEE Computer Society Conference on Computer Vision and Pattern Recognition Workshops, pages 1014–1022, 2016.
- [21] C. H. Sherman and J. L. Butler. Transducers and arrays for underwater sound. Springer, 2007.
- [22] Y. Umeda. Time Series Classification via Topological Data Analysis. Technical Report 3, 2017.
- [23] C. Wu and C. A. Hargreaves. Topological Machine Learning for Multivariate Time Series. 2019.