11email: {tt624,anup.das}@drexel.edu
Thermal-Aware Compilation of Spiking Neural Networks to Neuromorphic Hardware
Abstract
Hardware implementation of neuromorphic computing can significantly improve performance and energy efficiency of machine learning tasks implemented with spiking neural networks (SNNs), making these hardware platforms particularly suitable for embedded systems and other energy-constrained environments. We observe that the long bitlines and wordlines in a crossbar of the hardware create significant current variations when propagating spikes through its synaptic elements, which are typically designed with non-volatile memory (NVM). Such current variations create a thermal gradient within each crossbar of the hardware, depending on the machine learning workload and the mapping of neurons and synapses of the workload to these crossbars. This thermal gradient becomes significant at scaled technology nodes and it increases the leakage power in the hardware leading to an increase in the energy consumption. We propose a novel technique to map neurons and synapses of SNN-based machine learning workloads to neuromorphic hardware. We make two novel contributions. First, we formulate a detailed thermal model for a crossbar in a neuromorphic hardware incorporating workload dependency, where the temperature of each NVM-based synaptic cell is computed considering the thermal contributions from its neighboring cells. Second, we incorporate this thermal model in the mapping of neurons and synapses of SNN-based workloads using a hill-climbing heuristic. The objective is to reduce the thermal gradient in crossbars. We evaluate our neuron and synapse mapping technique using 10 machine learning workloads for a state-of-the-art neuromorphic hardware. We demonstrate an average 11.4K reduction in the average temperature of each crossbar in the hardware, leading to a 52% reduction in the leakage power consumption (11% lower total energy consumption) compared to a performance-oriented SNN mapping technique.
Keywords:
Neuromorphic computing Spiking Neural Network Non-Volatile Memory (NVM) Phase-Change Memory (PCM) Temperature Leakage power consumption Crossbar.1 Introduction
Spiking Neural Networks (SNNs) are machine learning models designed with spike-based computations and bio-inspired learning algorithms [37]. Neurons communicate information using spikes via synapses. SNNs are used to implement both supervised and unsupervised machine learning approaches. Our focus is on supervised approaches, where a machine learning model is first trained using training data, and then deployed for inference with in-field data.
Neuromorphic hardware such as TrueNorth [24], Loihi [23], and DYNAP-SE [39] can significantly improve the energy efficiency of SNNs, thanks to their event-driven computations, efficient implementations of biological neurons using CMOS and FinFET technologies, and the use of Non-Volatile Memory (NVM) such as Phase-Change Memory (PCM) [10, 50, 46, 48, 49], Oxide-base Resistive RAM (OxRRAM) [38], and Spin-Transfer Torque Magnetic or Spin-Orbit-Torque RAM (STT- and SoT-MRAM) [41] for high density synaptic storage. Therefore, neuromorphic hardware can be used to implement machine learning tasks on power-constrained environments such as embedded systems, and sensor and edge devices of the Internet-of-Things (IoT) [27].
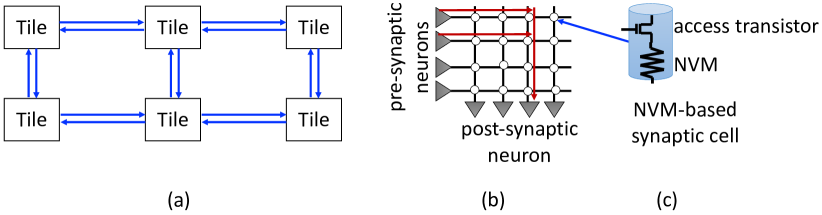
A neuromorphic hardware is implemented as a tile-based architecture [11] with a shared interconnect in the form of Networks-on-Chip (NoC) or Segmented Bus [9] (see Figure 1a). A tile in a neuromorphic hardware is designed as a crossbar, which is an organization of top electrodes (wordlines) and bottom electrodes (bitlines), with NVM-based synaptic elements at their intersections (Figure 1b). A synaptic element is connected to a bitline and a wordline using an access transistor (Figure 1c). Within a crossbar, the pre-synaptic neurons are mapped on the wordlines, while the post-synpatic neurons are mapped along the bitlines. An crossbar has pre-synaptic neurons, post-synaptic neurons, and NVM cells. A pre-synaptic neuron’s spike voltage from a wordline is multiplied with the conductance of the NVM to generate a current. Currents from multiple wordlines are integrated on a bitline, implementing forward propagation of neuron excitation. This is illustrated in Figure 1b.
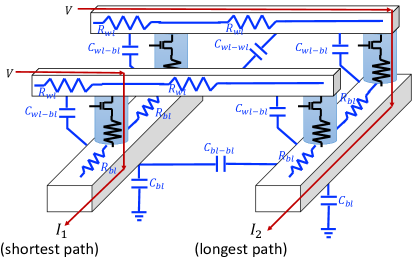
We investigate the internal architecture of a crossbar and observe that the bitlines and wordlines of a crossbar consist of parasitic elements, which consist of capacitance and resistance of the metal interconnect as shown in Figure 2. These parasitic elements create variation in current propagating along different paths in the crossbar. The figure illustrates the shortest and the longest current paths in a crossbar, where the length of a path is measured in terms of the number of parasitic components that are present on the path. Current differences create variation in access speed of the different synaptic elements in the crossbar [26, 55, 51]. A conservative design practice is to use a common spike voltage to obtain the required access speed of the synaptic element on the longest current path.
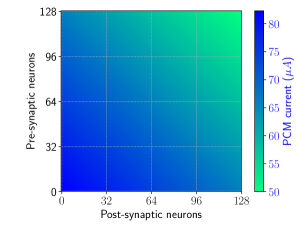
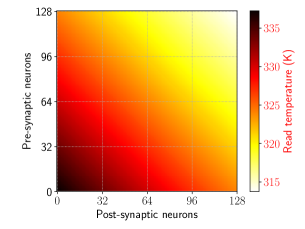
We argue that this conservative approach creates current differences in a crossbar, leading to a wide thermal gradient. Figure 3 illustrates the current and thermal variations in a 128x128 PCM crossbar at 65nm technology node. Accessing the synaptic cells on shorter current paths (bottom left corner of Figure 3b) generate higher temperatures than those on longer current paths (top right corner). Due to the exponential dependency of leakage current on temperature [36], the leakage current through cells with higher temperature is much higher than the current through cells with lower temperature. So, frequently accessing the cells on shorter current paths when executing a workload can lead to higher leakage power consumption in the crossbar.
Existing techniques to map neurons and synapses of SNNs to neuromorphic hardware have mostly focused on improving performance and circuit aging [22, 17, 5, 6, 1, 44, 47, 45, 7, 8]. These techniques do not consider the thermal gradient in a crossbar and therefore, they can increase the leakage power significantly. We build the case for one such mapping technique – SpiNeMap [6]. The leakage energy using this technique constitute between 20% to 30% of the total energy consumption for the typical machine learning workloads (see Section 4), where the total energy of a neuromorphic hardware includes the energy to generate spikes, the energy to communicate spikes, and the leakage energy. Therefore, reducing the leakage power (which we demonstrate in this work) will lead to a significant reduction of the total energy consumption.
Our goal is to minimize the leakage power consumption. We achieve this goal by lowering the average temperature of each crossbar using the proposed mapping technique. To this end, we make the following two key contributions.
-
•
Contribution 1: We propose a new comprehensive thermal model of a crossbar designed with phase-change memory (PCM). Our model incorporates 1) workload dependency, i.e., the temperature obtained in processing spike trains from a given SNN-based machine learning workload, and 2) spatial thermal dependencies, i.e., the temperature contributions from the neighboring cells based on their synaptic excitation in the workload.
-
•
Contribution 2: We propose a novel neuron and synapse mapping approach incorporating the thermal model using a hill climbing heuristic. The objective of the heuristic is to allocate the neurons and synapses of an SNN to the crossbars of the hardware such that the maximum average temperature of all crossbars is minimized, which lowers its leakage power consumption.
We evaluate the proposed technique with 10 machine learning applications from three most commonly-used neural network topology – convolution neural network (CNN), multilayer perceptron (MLP), and recurrent neural network (RNN). Evaluation for DYNAP-SE [39], a state-of-the-art neuromorphic hardware demonstrates the reduction of temperature, leading to a significant reduction in the leakage current.
2 Workload-dependant Thermal Model of Crossbars
In this section, we develop a workload-dependent thermal model of crossbars in a neuromorphic hardware, considering PCM-based synaptic elements. We start by reviewing the internals of a PCM device. The proposed thermal model can be generalized to other NVMs such as OxRRAM and SOT-/STT-MRAM exploiting their specific structures.
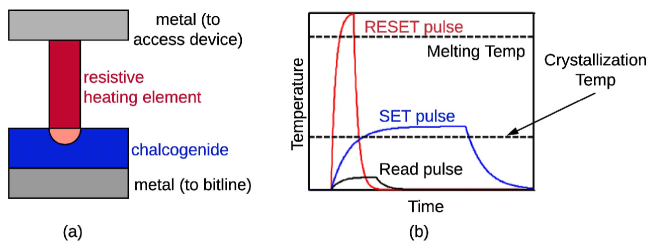
Figure 4(a) illustrates how a chalcogenide semiconductor alloy is used to build a PCM cell. The amorphous phase (logic ‘0’) in this alloy has higher resistance than the crystalline phase (logic ‘1’). Ge2Sb2Te5 (GST) is the most commonly used alloy for PCM [54] due to its high amorphous-to-crystalline resistance ratio, fast switching between phases, and high endurance. However, other chalcogenide alloys are also explored due to their better data retention properties [40]. Phase changes in a PCM cell are induced by injecting current into the resistor-chalcogenide junction and heating the chalcogenide alloy.
Figure 4 (b) shows the different current profiles needed to program and read in a PCM device. To RESET a PCM cell, a high power pulse of short duration is applied and quickly terminated. This first raises the temperature of the chalcogenide alloy to 650C, above its melting point. The melted alloy subsequently cools extremely quickly, locking into an amorphous phase. To SET a PCM cell, the chalcogenide alloy is heated above its crystallization temperature, but below its melting point for a sufficient amount of time. Finally, to read the content (i.e., know the phase) of a PCM cell, a small electrical pulse is applied that is sufficiently low so as not to induce phase change in the PCM cell. We focus on PCM read for the inference of supervised machine learning approaches
Many prior works have developed thermal models for PCM devices [52, 12, 32]. However, these models are developed for individual PCM cell considering the effect of crystallization and amorphization (synaptic weight updates in the context of machine learning). In other words, these models have the following two key limitations for their use in the context of neuromorphic computing. First, they do not consider spatial dependencies, i.e., the thermal contributions from neighboring PCM cells considering their utilization in a machine learning workload. Second, the thermal impact due to PCM reads (as required for machine learning inference) is not modeled. Figure 5a shows the thermal interactions in a crossbar. When a cell is accessed repeatedly within a short time window, there remains very little scope for heat inside the cell to be dissipated. As a result temperature keeps rising on every access, building on the undissipated components, and dissipating the heat to its neighboring cells, raising their temperature.
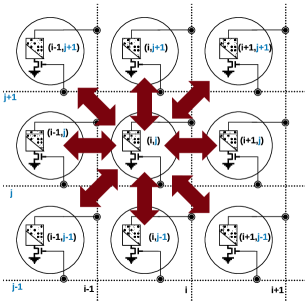
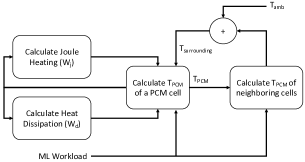
Figure 5b shows the proposed iterative approach of computing the temperature of a crossbar. The model computes the temperature of a single PCM cell incorporating 1) thermal contributions from its neighbors and 2) its activation within a workload.
The temperature of a single PCM cell is computed using Joule heating, and heat dissipation, which is given by the following equation [35],
| (1) |
where C and V are heat capacity of GST and volume of the active region of the cell respectively. The heat generation in the PCM cell is given by,
| (2) |
where is the current through the PCM cell and is the effective resistance of the cell. We use = 10K in the low resistance (SET) state and 200K in the high resistance (RESET) state. A part of this generated heat is dissipated to the surrounding and this heat dissipation is given by the Equation [34],
| (3) |
where represents the temperature dispersion around the active region and expressed as,
| (4) |
For simplicity we assume that the heat is mainly dispersed along the thickness of the cell and the temperature outside the dispersion region is close to the temperature surrounding the cell. Therefore, Equation 3 can be written as [31], [53],
| (5) |
where is the thickness of the GST material and is the thermal conductivity. Substitution of Equations 2 and 5 in Equation 1 yields,
| (6) |
Solving this ODE gives,
| (7) |
Initially the PCM cell’s temperature is assumed to be the same as its surrounding temperature. This boundary condition is used to determine the constant . Finally the cell temperature is modeled as,
| (8) |
The surrounding temperature is computed as
| (9) |
where is the thermal distance of the PCM cell from its neighboring cell , is the temperature of the neighboring cell, and is the ambient temperature of the neuromorphic hardware.
3 Proposed Neuron and Synapse Mapping Technique
Figure 6 shows an overview of the proposed neuron and synapse mapping approach. A machine learning application is first simulated using PyCARL [2], a framework for simulating SNN-based applications. PyCARL internally uses the CARLsim [13] simulator to extract the precise spike times on every synaptic element in the SNN for representative training data. These spike times, together with the neuron and synapse information constitute the SNN workload for the machine learning application.
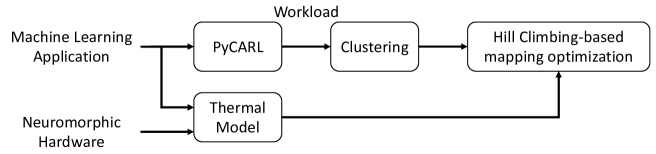
Next, the SNN workload is clustered using a greedy clustering approach, roughly based on the Kernighan-Lin Graph Partitioning algorithm of SpiNeMap [29]. Each cluster is a collection of pre- and post-synaptic neurons, synapses connecting these neurons, and the spike times on these synapses. From the mapping perspective, each cluster maps to a crossbar in the hardware, while the inter-cluster communication channels are mapped on the shared interconnect of the hardware. Therefore, the clustering technique ensures that the neurons and synapses of a cluster can fit onto the resources of the crossbar. PyCARL clusters an SNN to minimize the inter-cluster communication. This reduces the spike congestion on the shared interconnect which improves application latency.
The final step in our approach is the cluster mapping to the hardware. To describe this step, let be the machine learning workload with set of clusters and a set of connections between the clusters. The workload is to be executed on the hardware with a set of tiles (each tile has one crossbar) and a set of links between the tiles. The mapping of the application to the hardware , is defined as
| (11) |
Algorithm 1 provides the pseudo-code of the hill-climbing based average temperature minimization algorithm. The algorithm takes the clustered application and the neuromorphic hardware as input. The algorithm returns the mapping of to , which minimizes the average temperature of the crossbars. The algorithm is iterated for iterations (outer loop lines 1-16). For each iteration of the outer loop, the algorithm generates a random allocation of the clusters to the tiles (line 2) and calculate the average temperature (line 3). The routine CalculateAvgTemperature calculates the temperature of each crossbar for a mapping using the iterative approach of Figure 5b, specifically utilizing Equations 8 & 9, and return the maximum average temperature of all crossbars in the neuromorphic hardware.
At each iteration of the Algorithm 1, a cluster is moved to one of the tiles (line 7), computing the average temperature of this new mapping (line 8). The one mapping that leads to reduction of the average temperature is retained as the new mapping (lines 10-13) and the process is repeated for the next cluster (5-14). Once every cluster is analyzed, the iteration is repeated (lines 4-15) to check if the clusters can be remapped again to reduce the average temperature. The user-defined parameter governs the convergence of the algorithm.
4 Evaluation
4.1 Evaluated Applications
We evaluated 10 machine learning applications that are representative of three most commonly used neural network classes — convolutional neural network (CNN), multi-layer perceptron (MLP), and recurrent neural network (RNN). Table 1 summarizes the topology, the number of neurons and synapses of these applications, and their baseline accuracy.
| Class | Applications | Synapses | Neurons | Topology | Accuracy |
| CNN | LeNet [33] | 282,936 | 20,602 | CNN | 85.1% |
| AlexNet [30] | 38,730,222 | 230,443 | CNN | 90.7% | |
| VGG16 [43] | 99,080,704 | 554,059 | CNN | 69.8 % | |
| HeartClass [4, 16] | 1,049,249 | 153,730 | CNN | 63.7% | |
| MLP | DigitRecogMLP | 79,400 | 884 | FeedForward (784, 100, 10) | 91.6% |
| EdgeDet [13] | 114,057 | 6,120 | FeedForward (4096, 1024, 1024, 1024) | 100% | |
| ImgSmooth [13] | 9,025 | 4,096 | FeedForward (4096, 1024) | 100% | |
| RNN | HeartEstm [14] | 66,406 | 166 | Recurrent Reservoir | 100% |
| VisualPursuit [28] | 163,880 | 205 | Recurrent Reservoir | 47.3% | |
| R-DigitRecog [25] | 11,442 | 567 | Recurrent Reservoir | 83.6% |
4.2 Hardware Models
We model the DYNAP-SE neuromorphic hardware [39] with the following configurations.
-
•
A tiled array of 4 tiles, each with a 128x128 crossbar. There are 65,536 memristors per crossbar.
-
•
Spikes are digitized and communicated between cores through a mesh routing network using the Address Event Representation (AER) protocol.
-
•
Each synaptic element is a PCM-based memristor.
Table 2 reports the hardware parameters of DYNAP-SE.
| Neuron technology | 32nm FD-SOI |
|---|---|
| Synapse technology | PCM |
| Supply voltage | 1.0V |
| Energy per spike | 50pJ at 30Hz spike frequency |
| Energy per routing | 147pJ |
| Switch bandwidth | 1.8G. Events/s |
4.3 Evaluated Techniques
We evaluate the following two approaches.
-
•
SpiNeMap [6]: This is a performance-oriented approach to map SNN-based applications to neuromorphic hardware. This approach first generates clusters of neurons and synapses, where each cluster can fit on to the resources of a tile in the hardware. Then, it uses an optimization algorithm to place these clusters to the hardware, maximizing performance of the machine learning application on the hardware. Temperature gradients are not incorporated in the mapping process.
-
•
Proposed: In this technique the neurons and synapses of an SNN are mapped to the hardware considering the thermal gradient. It uses the clustering technique of SpiNeMap to generate clusters of neurons and synapses, where each cluster can fit on to the resources of a tile. The clusters are mapped to the crossbar using a hill-climbing approach to minimize the average temperature. This reduces the leakage power consumption.
4.4 Evaluated Metrics
We evaluate the following metrics.
-
•
Average Temperature: This is the average temperature of each crossbar in the hardware. We report the highest average temperatures of all crossbars.
-
•
Leakage Power: This is the total leakage power consumed in the hardware.
-
•
Performance: This is the latency, i.e., the time it takes to execute each model on hardware.
-
•
Compilation Time: This is the time it takes to generate the minimum temperature mapping of an application for the hardware.
5 Results and Discussion
5.1 Average Temperature
Figure 7 compares the maximum average temperature of the crossbars for each evaluated application on DYNAP-SE using SpiNeMap and the proposed technique. We make the following two key observations.
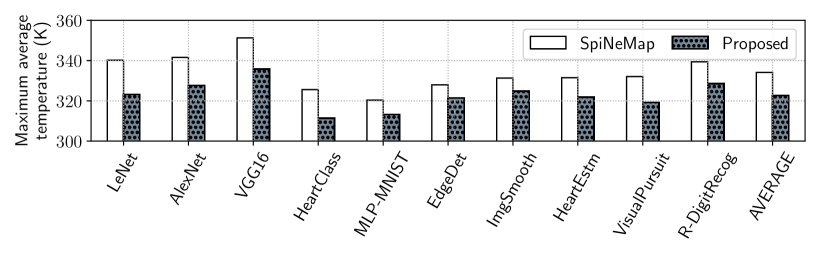
First, the maximum average temperature increases with model size. VGG16, which has more neurons and synapses than AlexNet (see Table 1), results in higher average temperature than AlexNet for both SpiNeMap and the proposed technique. MLP-MNIST, on the other hand, have lower temperature than both these models due to its lower model complexity. Although R-DigitRecog has comparatively fewer neurons and synapses, the average temperature is much higher. This is because R-DigitRecog has higher activation, i.e., spikes in its workload, which increases the temperature. These results clearly demonstrate the workload-dependent nature of the temperature obtained on the hardware. Second, the temperature obtained using the proposed mapping technique is lower than SpiNeMap by an average 11.4K (between 6.4K and 17K) for these 10 applications. This reduction is because of the proposed hill climbing algorithm (Algorithm 1), which incorporates the thermal gradient in optimizing the mapping of neurons and synapses to the crossbars of the hardware.
5.2 Leakage Power
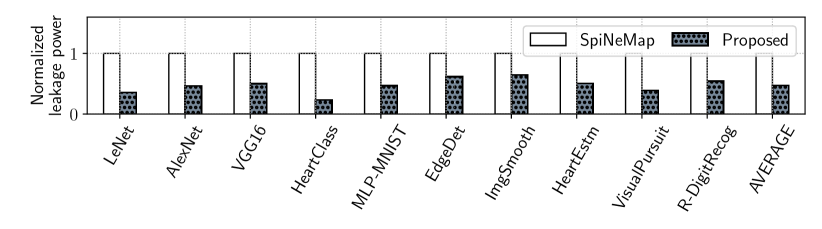
Figure 8 compares the leakage power on DYNAP-SE for each evaluated application using SpiNeMap and the proposed technique. The leakage power constitute between 20%–30% (average 22.8%) of the total energy consumption in the hardware. Results are normalized with respect to the leakage power obtained on the hardware using SpiNeMap. We observe that the leakage power obtained using the proposed technique is lower than SpiNeMap by an average 52%. This significant improvement in the leakage power is due to the reduction of the average temperature of the crossbars, which we analyzed in Section 5.1. This reduction in leakage power results in a reduction of the total energy consumption by 11%.
5.3 Performance
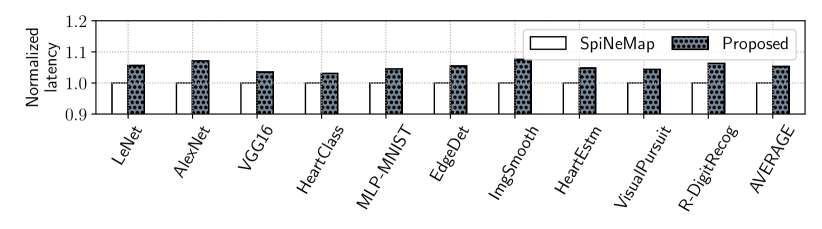
Figure 9 compares the latency of SpiNeMap and the proposed technique on DYNAP-SE for the evaluated applications. We observe that the latency of the proposed technique is only 5% higher (average) than SpiNeMap. Although the optimization objective of SpiNeMap (which is performance) is different from the optimization objective of the proposed technique (which is temperature), the proposed technique uses the clustering technique of SpiNeMap to first generate clusters, minimizing the spike communication on the shared interconnect of the hardware. This results in lower spike latency. Therefore, in the next step when the proposed technique optimizes for temperature during placement of the clusters to crossbars of the hardware, the latency is not significantly higher than SpiNeMap.
5.4 Thermal Model Validation
We validate our thermal model against 1) the thermal model of [56], which models the temperature of a single PCM cell and 2) the detailed model of [20], which performs a detailed layout-based thermal simulations. The individual PCM cell model is fast. However, it does not incorporate the thermal contributions from neighboring PCM cells in a crossbar. Therefore, this model is not accurate. On the other hand, the model in [20] is accurate because it incorporates the spatial thermal contributions. However, it takes 30 minutes of wall clock time to perform each thermal simulation for a 128x128 crossbar. Therefore, incorporating this model in Algorithm 1 to evaluate the temperature of a mapping makes the exploration time infeasible. Instead, we validated our spatial formulation (Equation 9) by incorporating this equation into the framework of [20].
Figure 10 plots the peak temperature obtained using the model of [56] and the proposed model (Equation 8 & 9) for each evaluated application on DYNAP-SE. We observe that existing models such as [56] lead to underestimation of the peak temperature by an average 1.6K for these applications. This is because they do not incorporate the spatial dependency. Underestimation of temperature leads to an underestimation of the leakage power consumption of the hardware.
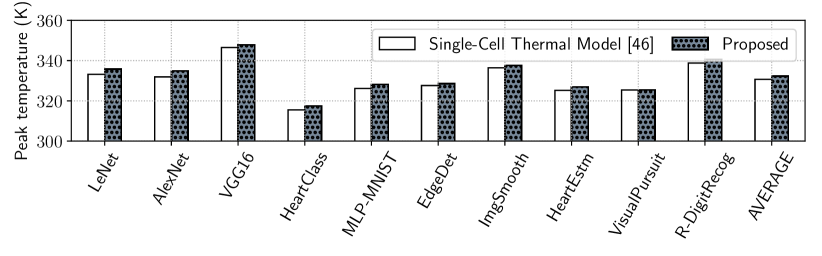
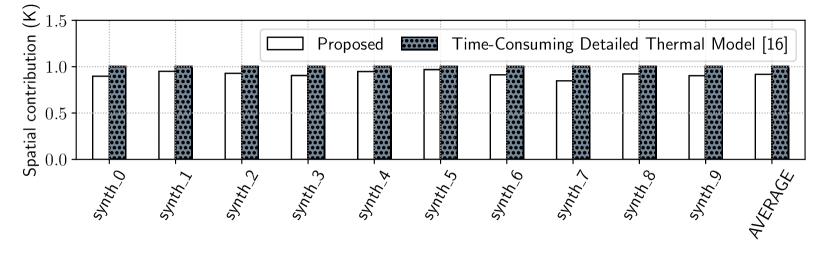
Figure 11 plots the spatial contribution obtained using the model of [20] and the proposed model (Equation 9) for 10 synthetic applications. We observe that the accuracy of the proposed spatial model is close to that of the detailed model [20]. The spatial contribution obtained using Equation 9 is on average 8.2% lower than [20] (0.3K in absolute terms).
These results validate the thermal model proposed in this work.
5.5 Compilation Time and Solution Tradeoff
Table 3 reports the compilation time and the average temperature obtained for three different settings of the variable . We observe that as is increased, the average temperature reduces for all applications. This is because with increase in the number of iterations, Algorithm 1 is able to find a better solution. However, the compilation time also increases. Finally, we observe that increasing from 100 to 1000 results in a significant increase in compilation time with a minimal improvement of the average temperature. We conclude that setting gives the best trade-off in terms of compilation time and the solution quality. User can use this parameter to set a limit on the compilation time of their algorithm by analyzing the complexity of their model against the ones we evaluate (see Table 1).
| Application | ||||||
|---|---|---|---|---|---|---|
| Compilation | Avg. | Compilation | Avg. | Compilation | Avg. | |
| Time | Temperature | Time | Temperature | Time | Temperature | |
| (sec) | (K) | (sec) | (K) | (sec) | (K) | |
| LeNet | 26 | 326.3 | 259 | 323.2 | 2641 | 322.2 |
| AlexNet | 114 | 330.1 | 1144 | 327.6 | 11480 | 326.0 |
| VGG16 | 241 | 344.6 | 2413 | 335.8 | 24180 | 335.3 |
| HeartClass | 96 | 315.1 | 965 | 311.3 | 9699 | 309.9 |
| MLP-MNIST | 14 | 319.7 | 149 | 313.2 | 1520 | 311.6 |
| EdgeDet | 12 | 323.5 | 132 | 321.5 | 1337 | 320.8 |
| ImgSmooth | 26 | 327.11 | 268 | 324.7 | 2740 | 322.8 |
| HeartEstm | 12 | 328.2 | 125 | 321.8 | 1255 | 320.4 |
| VisualPursuit | 27 | 329.1 | 284 | 319.2 | 2883 | 318.7 |
| R-DigitRecog | 15 | 336.3 | 159 | 328.5 | 1615 | 327.9 |
6 Conclusions
We propose a technique to map the neurons and synapses of SNN-based machine learning applications to neuromorphic hardware. Prior work in this space have focused extensively on performance, with no consideration of the thermal aspects and the associated leakage power problem in the hardware. Our technique is based on two key contributions. First, we propose a new thermal model of a crossbar incorporating contributions from the adjacent cells. Second, we incorporate this thermal model in a hill-climbing approach to minimize the average temperature across the crossbars of the hardware. We evaluate our approach using 10 machine learning applications and show the significant reduction of the average temperature of the hardware. By lowering the average temperature, we also show a reduction of leakage power consumption.
7 Acknowledgment
This work is supported by the National Science Foundation Faculty Early Career Development Award CCF-1942697 (CAREER: Facilitating Dependable Neuromorphic Computing: Vision, Architecture, and Impact on Programmability).
References
- [1] Balaji, A., Song, S., Das, A., Dutt, N., Krichmar, J., Kandasamy, N., Catthoor, F.: A framework to explore workload-specific performance and lifetime trade-offs in neuromorphic computing. CAL (2019)
- [2] Balaji, A., Adiraju, P., Kashyap, H.J., Das, A., Krichmar, J.L., Dutt, N.D., Catthoor, F.: PyCARL: A PyNN interface for hardware-software co-simulation of spiking neural network. In: IJCNN (2020)
- [3] Balaji, A., Corradi, F., Das, A., Pande, S., Schaafsma, S., Catthoor, F.: Power-accuracy trade-offs for heartbeat classification on neural networks hardware. JOLPE (2018)
- [4] Balaji, A., Corradi, F., Das, A., Pande, S., Schaafsma, S., et al.: Power-accuracy trade-offs for heartbeat classification on neural networks hardware. JOLPE (2018)
- [5] Balaji, A., Das, A.: A framework for the analysis of throughput-constraints of snns on neuromorphic hardware. In: ISVLSI (2019)
- [6] Balaji, A., Das, A., Wu, Y., Huynh, K., Dell’anna, F.G., Indiveri, G., Krichmar, J.L., Dutt, N.D., Schaafsma, S., Catthoor, F.: Mapping spiking neural networks to neuromorphic hardware. TVLSI (2020)
- [7] Balaji, A., Marty, T., Das, A., Catthoor, F.: Run-time mapping of spiking neural networks to neuromorphic hardware. JSPS (2020)
- [8] Balaji, A., Song, S., Das, A., Krichmar, J., Dutt, N., Shackleford, J., Kandasamy, N., Catthoor, F.: Enabling resource-aware mapping of spiking neural networks via spatial decomposition. ESL (2020)
- [9] Balaji, A., Wu, Y., Das, A., Catthoor, F., et al.: Exploration of segmented bus as scalable global interconnect for neuromorphic computing. In: GLSVLSI (2019)
- [10] Burr, G.W., Shelby, R.M., et al.: Neuromorphic computing using non-volatile memory. Advances in Physics: X (2017)
- [11] Catthoor, F., Mitra, S., Das, A., Schaafsma, S.: Very large-scale neuromorphic systems for biological signal processing. In: CMOS Circuits for Biological Sensing and Processing (2018)
- [12] Chen, I.R., Pop, E.: Compact thermal model for vertical nanowire phase-change memory cells. TED (2009)
- [13] Chou, T.S., Kashyap, H.J., Xing, J., Listopad, S., Rounds, E.L., Beyeler, M., Dutt, N., et al.: CARLsim 4: An open source library for large scale, biologically detailed spiking neural network simulation using heterogeneous clusters. In: IJCNN (2018)
- [14] Das, A., Pradhapan, P., Groenendaal, W., Adiraju, P., Rajan, R., Catthoor, F., Schaafsma, S., Krichmar, J., Dutt, N., et al.: Unsupervised heart-rate estimation in wearables with Liquid states and a probabilistic readout. Neural Networks (2018)
- [15] Das, A., Catthoor, F., Bourdoux, A., Gyselinckx, B.: Energy-efficient mapping of lte-a phy signal processing tasks on microservers. TGCN (2018)
- [16] Das, A., Catthoor, F., et al.: Heartbeat classification in wearables using multi-layer perceptron and time-frequency joint distribution of ECG. In: CHASE (2018)
- [17] Das, A., Kumar, A.: Dataflow-based mapping of spiking neural networks on neuromorphic hardware. In: GLSVLSI (2018)
- [18] Das, A., Kumar, A., Veeravalli, B.: Communication and migration energy aware design space exploration for multicore systems with intermittent faults. In: DATE (2013)
- [19] Das, A., Kumar, A., Veeravalli, B.: Communication and migration energy aware task mapping for reliable multiprocessor systems. FGCS (2014)
- [20] Das, A., Kumar, A., Veeravalli, B.: Reliability and energy-aware mapping and scheduling of multimedia applications on multiprocessor systems. TPDS (2015)
- [21] Das, A., Walker, M.J., Hansson, A., Al-Hashimi, B.M., Merrett, G.V.: Hardware-software interaction for run-time power optimization: A case study of embedded linux on multicore smartphones. In: ISLPED (2015)
- [22] Das, A., Wu, Y., Huynh, K., Dell’Anna, F., Catthoor, F., Schaafsma, S.: Mapping of local and global synapses on spiking neuromorphic hardware. In: DATE (2018)
- [23] Davies, M., Srinivasa, N., et al.: Loihi: A neuromorphic manycore processor with on-chip learning. IEEE Micro (2018)
- [24] Debole, M.V., Taba, B., et al.: TrueNorth: Accelerating from zero to 64 million neurons in 10 years. Computer (2019)
- [25] Diehl, P.U., Cook, M.: Unsupervised learning of digit recognition using spike-timing-dependent plasticity. Frontiers in Computational Neuroscience (2015)
- [26] Fouda, M.E., Eltawil, A.M., Kurdahi, F.: Modeling and analysis of passive switching crossbar arrays. TCAS I: Regular Papers (2017)
- [27] Gubbi, J., Buyya, R., Marusic, S., Palaniswami, M.: Internet of Things (IoT): A vision, architectural elements, and future directions. FGCS (2013)
- [28] Kashyap, H.J., et al.: A recurrent neural network based model of predictive smooth pursuit eye movement in primates. In: IJCNN (2018)
- [29] Kernighan, B.W., Lin, S.: An efficient heuristic procedure for partitioning graphs. Bell system technical journal (1970)
- [30] Krizhevsky, A., Sutskever, I., Hinton, G.E.: Imagenet classification with deep convolutional neural networks. In: NeurIPS (2012)
- [31] Kwong, K.C., Li, L., He, J., Chan, M.: Verilog-A model for phase change memory simulation. ICSICT (2008)
- [32] Le Gallo, M., Athmanathan, A., Krebs, D., Sebastian, A.: Evidence for thermally assisted threshold switching behavior in nanoscale phase-change memory cells. Journal of Applied Physics (2016)
- [33] LeCun, Y., et al.: Lenet-5, convolutional neural networks (2015)
- [34] Liao, Y.B., Chen, Y.K., Chiang, M.H.: An analytical compact PCM model accounting for partial crystallization. EDSSC (2007)
- [35] Liao, Y.B., Lin, J.T., Chiang, M.H.: Temperature-based phase change memory model for pulsing scheme assessment. ICICDT (2008)
- [36] Liu, Y., Dick, R.P., Shang, L., Yang, H.: Accurate temperature-dependent integrated circuit leakage power estimation is easy. In: DATE (2007)
- [37] Maass, W.: Networks of spiking neurons: The third generation of neural network models. Neural Networks (1997)
- [38] Mallik, A., Garbin, D., Fantini, A., Rodopoulos, et al.: Design-technology co-optimization for OxRRAM-based synaptic processing unit. In: VLSIT (2017)
- [39] Moradi, S., Qiao, N., Stefanini, F., Indiveri, G.: A scalable multicore architecture with heterogeneous memory structures for dynamic neuromorphic asynchronous processors (DYNAPs). TBCAS (2017)
- [40] Morikawa, T., Kurotsuchi, K., Kinoshita, M., et al.: Doped in-ge-te phase change memory featuring stable operation and good data retention. In: IEDM (2007)
- [41] Ramasubramanian, S.G., Venkatesan, R., Sharad, M., et al.: Spindle: Spintronic deep learning engine for large-scale neuromorphic computing. In: ISLPED (2014)
- [42] Shafik, R.A., Das, A., Yang, S., Merrett, G., Al-Hashimi, B.M.: Adaptive energy minimization of openmp parallel applications on many-core systems. In: PARMA-DITAM (2015)
- [43] Simonyan, K., Zisserman, A.: Very deep convolutional networks for large-scale image recognition. arXiv (2014)
- [44] Song, S., Balaji, A., Das, A., Kandasamy, N., Shackleford, J.: Compiling spiking neural networks to neuromorphic hardware. In: LCTES (2020)
- [45] Song, S., Das, A.: A case for lifetime reliability-aware neuromorphic computing. In: MWSCAS (2020)
- [46] Song, S., Das, A., Kandasamy, N.: Exploiting inter- and intra-memory asymmetries for data mapping in hybrid tiered-memories. In: ISMM (2020)
- [47] Song, S., Das, A., Kandasamy, N.: Improving dependability of neuromorphic computing with non-volatile memory. In: EDCC (2020)
- [48] Song, S., Das, A., Mutlu, O., Kandasamy, N.: Enabling and exploiting partition-level parallelism (PALP) in phase change memories. TECS (2019)
- [49] Song, S., Das, A., Mutlu, O., Kandasamy, N.: Improving phase change memory performance with data content aware access. In: ISMM (2020)
- [50] Song, S., Das, A., Mutlu, O., Kandasamy, N.: Aging aware request scheduling for non-volatile main memory. In: ASP-DAC (2021)
- [51] Titirsha, T., Das, A.: Reliability-performance trade-offs in neuromorphic computing. In: CUT (2020)
- [52] Warren, R., Reifenberg, J., Goodson, K.: Compact thermal model for phase change memory nanodevices. In: ICTTPES (2008)
- [53] Wei, Y., Lin, X., Jia, Y., Cui, X., He, J., Zhang, X.: A SPICE model for a phase-change memory cell based on the analytical conductivity model. JOS (2012)
- [54] Wong, H.S.P., Raoux, S., Kim, S., Liang, J., Reifenberg, J.P., Rajendran, B., Asheghi, M., et al.: Phase change memory. Proc. of the IEEE (2010)
- [55] Woo, J., Yu, S.: Resistive memory-based analog synapse: The pursuit for linear and symmetric weight update. IEEE Nanotechnology Magazine (2018)
- [56] Xi, L., Zhitang, S., Daolin, C., Xiaogang, C., Houpeng, C.: An spice model for phase-change memory simulations. JOS (2011)