Uncertainty over Uncertainty: Investigating the Assumptions, Annotations, and Text Measurements of Economic Policy Uncertainty
Abstract
Methods and applications are inextricably linked in science, and in particular in the domain of text-as-data. In this paper, we examine one such text-as-data application, an established economic index that measures economic policy uncertainty from keyword occurrences in news. This index, which is shown to correlate with firm investment, employment, and excess market returns, has had substantive impact in both the private sector and academia. Yet, as we revisit and extend the original authors’ annotations and text measurements we find interesting text-as-data methodological research questions: (1) Are annotator disagreements a reflection of ambiguity in language? (2) Do alternative text measurements correlate with one another and with measures of external predictive validity? We find for this application (1) some annotator disagreements of economic policy uncertainty can be attributed to ambiguity in language, and (2) switching measurements from keyword-matching to supervised machine learning classifiers results in low correlation, a concerning implication for the validity of the index.
1 Introduction
The relatively novel research domain of text-as-data, which uses computational methods to automatically analyze large collections of text, is a rapidly growing subfield of computational social science with applications in political science Grimmer and Stewart (2013), sociology Evans and Aceves (2016), and economics Gentzkow et al. (2019). In economics, textual data such as news editorials Tetlock (2007), central bank communications Lucca and Trebbi (2009), financial earnings calls Keith and Stent (2019), company disclosures Hoberg and Phillips (2016), and newspapers Thorsrud (2020) have recently been used as new, alternative data sources.
| No. | Example |
|---|---|
| 1 | Demand for new clothing is uncertain because several states may implement large hikes in their sales tax rates. |
| 2 | The outlook for the H1B visa program remains highly uncertain. As a result, some high-tech firms fear that shortages of qualified workers will cramp their expansion plans. |
| 3 | The looming political fight over whether to extend the Bush-era tax cuts makes it extremely difficult to forecast federal income tax collections in 2011. |
| 4 | Uncertainty about prospects for war in Iraq has encouraged a build-up of petroleum inventories and pushed oil prices higher. |
| 5 | Some economists claim that uncertainties due to government industrial policy in the 1930s prolonged and deepened the Great Depression. |
| 6 | It remains unclear whether the government will implement new incentives for small business hiring. |
In one such economic text-as-data application, Baker et al. (2016) aim to construct an economic policy uncertainty (EPU) index whereby they quantify the aggregate level that policy is influencing economic uncertainty (see Table 1 for examples). They operationalize this as the proportion of newspaper articles that match keywords related to the economy, policy, and uncertainty.
The index has had impact both on the private sector and academia.111As of October 7, 2020, Google Scholar reports Baker et al. (2016) to have over 4400 citations. In the private sector, financial companies such as Bloomberg, Haver, FRED, and Reuters carry the index and sell financial professionals access to it. Academics show economic policy uncertainty has strong relationships with other economic indicators: Gulen and Ion (2016) find a negative relationship between the index and firm-level capital investment, and Brogaard and Detzel (2015) find that the index can positively forecast excess market returns.
The EPU index of Baker et al. has substantive impact and is a real-world demonstration of finding economic signal in textual data. Yet, as the subfield of text-as-data grows, so too does the need for rigorous methodological analysis of how well the chosen natural language processing methods operationalize the social science construct at hand. Thus, in this paper we seek to re-examine Baker et al.’s linguistic, annotation, and measurement assumptions. Regarding measurement, although keyword look-ups yield high-precision results and are interpretable, they can also be brittle and may suffer from low recall. Baker et al. did not explore alternative text measurements based on, for example, word embeddings or supervised machine learning classifiers.
In exploring Baker et al.’s construction of EPU, we identify and disentangle multiple sources of uncertainty. First, there is the real underlying uncertainty about economic outcomes due to government policy that the index attempts to measure. Second, there is semantic uncertainty that can be expressed in the language of newspaper articles. Third, there is annotator uncertainty about whether a document should be labeled as EPU or not. Finally, there is modeling uncertainty in which text classifiers are uncertain about the decision boundary between positive and negative classes.
In this paper, we revisit and extend Baker et al.’s human annotation process (§3) and computational pipeline that obtains EPU measurement from text (§4). In doing so, we draw on concepts from quantitative social science’s measurement modeling, mapping observable data to theoretical constructs, which emphasizes the importance of validity (is it right?) and reliability (can it be repeated?) Loevinger (1957); Messick (1987); Quinn et al. (2010); Jacobs and Wallach (2019).
Overall, this paper contributes the following:
-
•
We examine the assumptions Baker et al. use to operationalize economic policy uncertainty via keyword-matching of newspaper articles. We demonstrate that using keywords collapses some rich linguistic phenomena such as semantic uncertainty (§2.1).
-
•
We also examine the causal assumptions of Baker et al. through the lens of structural causal models Pearl (2009) and argue that readers’ perceptions of economic policy uncertainty may be important to capture (§2.2).
-
•
We conduct an annotation experiment by re-annotating documents from Baker et al.. We find preliminary evidence that disagreements in annotation could be attributed to inherent ambiguity in the language that expresses EPU (§3).
-
•
Finally, we replicate and extend Baker et al.’s data pipeline with numerous measurement sensitivity extensions: filtering to US-only news, keyword-matching versus supervised document classifiers, and prevalence estimation approaches. We demonstrate that a measure of external predictive validity, i.e., correlations with a stock-market volatility index (VIX), is particularly sensitive to these decisions (§4).
| KeyOrg | KeyExp | |
|---|---|---|
| Economy | economic, economy | + growth, economies, financial, recession, slowdown |
| Uncertainty | uncertain, uncertainty | + unclear, unsure, uncertainties, turmoil, confusion, worries |
| Policy | regulation, deficit, legislation, congress, white house, federal reserve, the fed, regulations, regulatory, deficits, congressional, legislative, legislature | |
2 Assumptions of Measuring Economic Policy Uncertainty from News
The goal of Baker et al. (2016) is to measure the theoretical construct of policy-related economic uncertainty (EPU) for particular times and geographic regions. Baker et al. assume they can use information from newspaper articles as a proxy for EPU, an assumption we explore in great detail in Section 2.2, and they define EPU very broadly in their coding guidelines: “Is the article about policy-related aspects of economic uncertainty, even if only to a limited extent?”222http://policyuncertainty.com/media/Coding_Guide.pdf For an article to be annotated as positive, there must be a stated causal link between policy and economic consequences and either the former or the latter must be uncertain.333“If the article discusses economic uncertainty in one part and policy in another part but never discusses policy in connection to economic uncertainty, then do not code it as about economic policy uncertainty.” Grounds for labeling a document as a positive include “uncertainty regarding the economic effects of policy actions” (or inactions), and “uncertainty over who makes or will make policy decisions that have economic consequences.” In Table 1, we provide examples of text spans that successfully encode EPU given these guidelines. For instance, the first example indicates that a government policy (increase in state sales tax) is causing uncertainty in the economy (demand for new clothing). Baker et al. operationalize this theoretical construct of EPU as keyword-matching of newspaper documents: for each document, if the document has at least one word in each of the economy, uncertainty, and policy keyword categories (see Table 2 in the Appendix) then it is considered a positive document. Counts of positive documents are summed and then normalized by the total number of documents published by each news outlet.
2.1 Semantic Uncertainty
While the keywords Baker et al. (2016) select (“uncertain” or “uncertainty”) are the most overt ways to express uncertainty via language, they do not capture the full extent of how humans express uncertainty. For instance, Example No. 6 in Table 1 would be counted as a negative by Baker et al. despite indicating semantic uncertainty via the phrase “it remains unclear.” These keyword assumptions are a threat to content validity, “the extent to which a measurement model captures everything we might want it to” Jacobs and Wallach (2019).
We look to definitions from linguistics to potentially expand the operationalization of uncertainty; we refer the reader to Szarvas et al. (2012) for all subsequent definitions and quotes. In particular, uncertainty is defined as a phenomenon that represents a lack of information. With respect to truth-conditional semantics, semantic uncertainty refers to propositions “for which no truth value can be attributed given the speaker’s mental state.” Discourse-level uncertainty indicates “the speaker intentionally omits some information from the statement, making it vague, ambiguous, or misleading” and in the context of Baker et al. could result from journalists’ linguistic choices to express ambiguity in economic policy uncertainty. For instance, in the first example in Table 3, the lexical cues “suggest” and “might” indicate to the reader that the journalist writing the article is unclear about the intention of Alan Greenspan. In contrast, epistemic modality “encodes how much certainty or evidence a speaker has for the proposition expressed by his utterance,” (e.g., “Congresswoman X: ‘We may delay passing the tariff bill.’”) and doxastic modality refers to the beliefs of the speaker (“I believe that Congress will …”). In the second example in Table 3, the entity “he” seems to be uncertain about the fate of the economy because he “shakes his head in bewilderment,” which demonstrates that uncertainty can also be conveyed through world knowledge and inference.
Collapsing all these types of semantic uncertainty to the keywords “uncertainty” and “uncertain” has major implications: (a) the relationship between the uncertainty journalists express and what readers infer impacts the causal assumptions (§2.2) and annotation decisions (§3) of this task, and (b) Baker et al.’s keywords are most likely low-recall which could affect empirical measurement results (§4). We see fruitful future work in improving content validity and recall via automatic uncertainty and modality analysis from natural language processing, e.g. McShane et al. (2004); Ganter and Strube (2009); Saurí and Pustejovsky (2009); Farkas et al. (2010); Szarvas et al. (2012).
| Example | Docid |
|---|---|
| The stock market had soared on Mr. Greenspan’s suggestion that global financial problems posed as great a threat to the United States as inflation did, suggesting that a rate cut to stimulate the economy might be on the horizon | 1047100 |
| But ask him whether the Mexican stock market will rise or plunge tomorrow and he shakes his head in bewilderment. | 1043578 |
2.2 Causal Assumptions
Using the paradigm of structural causal models Pearl (2009), we re-examine the causal assumptions of Baker et al.. In Figure 1, for a single time-step,444Baker et al. (2016) aggregate by day, month, quarter, or year. represents the real, aggregate level of economic policy uncertainty in the world which is unobserved. If one could obtain a measurement of , then one could analyze the causal relationship between and other macroeconomic variables, . Presumably, newspaper reporting, , is affected by and where is a non-parametric function that represents a causal process. In our setting, represents the process of media production: for example, the ability of journalists to collect information from sources; or editorial decisions on what topics will be published. The major assumption of Baker et al. is that they can obtain a measure of via a proxy measure from newspaper text, , where . By simple composition, . Yet, aside from examining the political bias of media, Baker et al. largely ignore and how the media production process could influence EPU measurements.
However, an alternative causal path from to goes through , the macro-level human perception of real EPU. In this case, is irrelevant as long as people are perceiving policy-related economic uncertainty to be changing, they could potentially make real economic decisions (e.g. hiring or purchases) that could affect the greater macro-economy, .
It is unclear how to design a causal intervention in which one manipulates the real EPU, , in order to estimate its effect on and . However, one could design an ideal causal experiment to intervene on newspaper text, ; one could artificially change the level of EPU coverage in synthetic articles, show these to participants, and measure the resulting difference in participants’ economic decisions. If to is the causal path of interest,555There is some evidence from the original authors that human perception is important: In the EPU index released to the public, one of three underlying components is a disagreement of economic forecasters as a proxy for uncertainty. See http://policyuncertainty.com/methodology.html. then it is extremely important to measure and model human perception of EPU, an assumption we explore in terms of annotation decisions in Section 3.

| Subset | Ann. Source | Num. Docs | Num. Anns. | Prop. Pos. Anns. | Prop. Docs. Agr. | Pairwise Agree | Krip.- |
|---|---|---|---|---|---|---|---|
| All | BBD | 13797 | 16060 | 0.42 | – | – | – |
| 2+ Anns. | BBD | 2150 | 4413 | 0.43 | 0.80 | 0.80 | 0.60 |
| Sample A (Unan.) | BBD | 19 | 41 | 0.29 | 1.00 | 1.00 | 1.00 |
| Ours | 19 | 96 | 0.29 | 0.37 | 0.68 | 0.21 | |
| Sample B (Non-unan.) | BBD | 18 | 40 | 0.50 | 0.00 | 0.07 | -0.80 |
| Ours | 18 | 97 | 0.54 | 0.28 | 0.65 | 0.27 |
| Sample | PXA | Total pairs |
|---|---|---|
| A | 0.70 | 206 |
| B | 0.50 | 218 |
3 Annotator Uncertainty
Reliable human annotation is essential for both building supervised classifiers and assessing the internal validity of text-as-data methods. In order to validate their EPU index, Baker et al. sample documents from each month, obtain binary labels on the documents from annotators, and then construct a “human-generated” index which they report has a 0.86 correlation with their keyword-based index (aggregated quarterly). Yet, in our analysis of Baker et al.’s annotations (denoted below as BBD), we find only 16% of documents have more than one annotator and of these, the agreement rates are moderate: 0.80 pairwise agreement and 0.60 Krippendorff’s chance-adjusted agreement Artstein and Poesio (2008). See Line 2 of Table 4 for additional descriptive statistics of these annotations. The original authors did not address whether this disagreement is a result of annotator bias, error in annotations, or true ambiguity in the text.
In contrast to the popular paradigm that one should aim for high inner-annotator agreement rates Krippendorff (2018), recent research has shown “disagreement between annotators provides a useful signal for phenomena such as ambiguity in the text” Dumitrache et al. (2018). Additionally, recent research in natural language processing Paun et al. (2018); Pavlick and Kwiatkowski (2019) and computer vision Sharmanska et al. (2016) has leveraged annotator uncertainty to improve modeling. Thus, for our setting, we ask the following research question:
RQ1: Is there inherent ambiguity in the language that expresses economic policy uncertainty? If so, are annotator disagreements a reflection of this ambiguity?
The following evidence lends to our hypothesis that there is inherent ambiguity in whether documents encode EPU: (1) the original coding guide of Baker et al. had 17 pages of “hard calls” that describe difficult or ambiguous documents, (2) there was a moderate amount of annotator disagreement in BBD (Table 4), (3) we qualitatively analyze examples with disagreement and reason about what makes the inferences of these documents difficult (§3.2, and Tables 11 and 10 in the Appendix), and (4) we run an experiment in which we gather additional annotations and show that our annotations have more disagreement with documents that have non-unanimous labels in BBD (§3.1).
3.1 Our annotation experiment
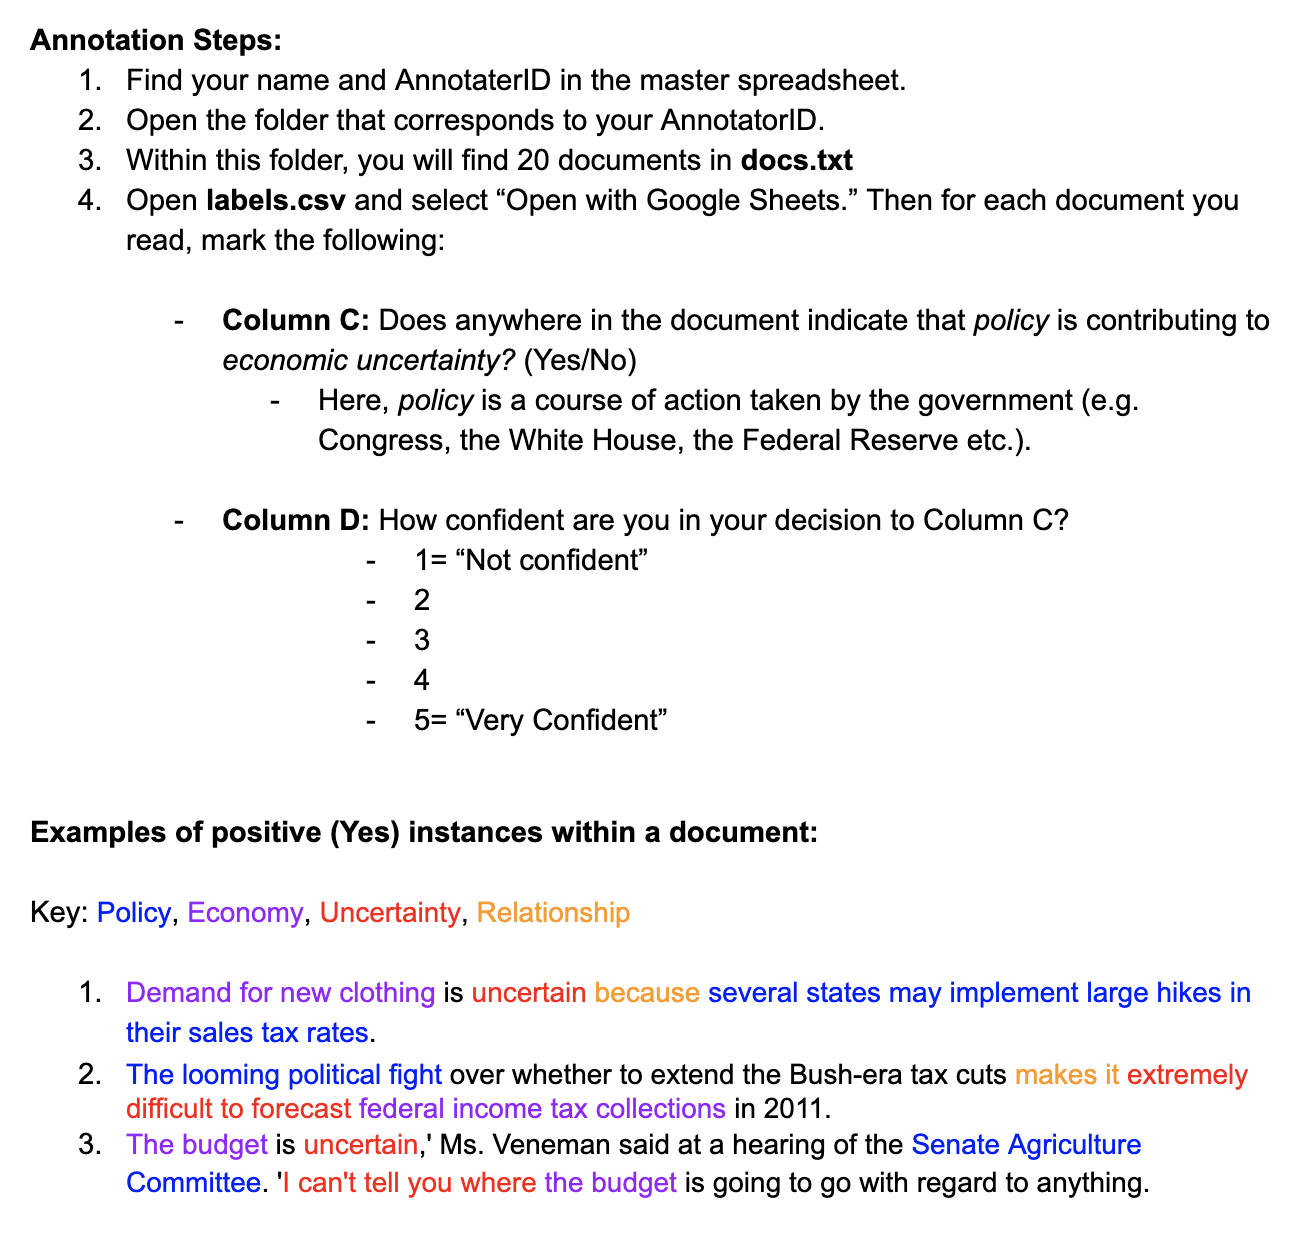
The ideal assessment of inherent annotator uncertainty would be to gather a large number of annotations for many documents and then analyze the posterior distribution over labels.666For instance, Pavlick and Kwiatkowski (2019) analyze disagreement in natural language inference by gathering 50 annotations per document and find the label distributions are often bi-modal, indicating meaningful disagreement. We perform a similar, small-scale experiment in which we recruit 10 annotators, a mix of professional analysts and PhD students, who annotate 37 documents for a total of 193 annotations. 777We originally sampled 40 documents but after annotation had to discard some that were duplicates or had errors from HTML extraction. We sampled documents from the pool of BBD documents that had more than one annotator and the BBD labels were unanimous (Sample A) and non-unanimous (Sample B). We re-annotated these samples in order to provide insight into the nature of these unanimous and non-unanimous labels. See Figure 4 in the Appendix for our full annotation instructions.
Pairwise cross-agreement. In order to quantitatively compare two annotation rounds (ours vs. Baker et al.’s), we provide a new metric, pairwise cross-agreement (PXA). Formally, for each document of interest, , let the and be the set of annotations on that document from each of the two rounds respectively. Let be the set of all pairs, from combining one annotation from each of the two rounds. Then,
| (1) |
Results. The results of our experiment (Tables 4 and 5) provide evidence supporting our hypothesis that there is inherent ambiguity in documents about EPU that contributes to annotator disagreement. In Table 5, PXA is higher in Sample A (0.70), in which BBD annotators had unanimous agreement, compared to Sample B (0.50) in which BBD annotators had non-unanimous labels. Since our annotations agreed with Sample A more, this could indicate these documents inherently have more agreement. The pairwise agreement between our annotations on Sample A and B are roughly the same (Table 4) but the proportion of documents that had unanimous agreement among our five annotators per document was slightly more in Sample A versus Sample B (0.37 vs. 0.28). Limitations of our experiment include that our sample size is relatively small and our annotation instructions are different and significantly shorter than Baker et al..
3.2 Qualitative Document Analysis
Our qualitative analysis suggests that readers’ perceptions of EPU differ meaningfully and it is difficult to measure EPU with a simple document-level binary label. In Tables 10 and 11 in the Appendix, we present documents with the highest levels of agreement from Sample A and disagreement from Sample B. Annotators are likely to disagree on the label of the document when need real world knowledge to infer whether a policy is contributing to economic uncertainty. For instance, in Table 11 Example 1, the reader has to infer that the author of an op-ed would only write an op-ed about a policy if it was uncertain, but the uncertainty is never explicitly stated in text. In other instances, the causal link between policy and economic uncertainty is unclear. In Table 11 Example 4, economic downturn is mentioned as well as turnover in the administration but these are never explicitly linked; yet, some annotators may have read “questions about what lies ahead” as uncertainty that also encompasses economic uncertainty. Although there has been a rise of common sense reasoning research in natural language processing (e.g. Bhagavatula et al. (2020); Huang et al. (2019); Sap et al. (2019)), we suspect current state-of-the-art NLP systems would be unable to accurately resolve the inferences stated above. Furthermore, if there is inherent ambiguity in the language that expresses EPU, and, as we argue in Section 2.2, human perception is important, then we may desire to build models that can identify ambiguous documents and account for the uncertainty from ambiguity of language into measurement predictions, e.g. Paun et al. (2018). We leave this for future work.
4 Measurement
| Split | Model | Prec. | Recall | F1 | Acc. |
|---|---|---|---|---|---|
| Train | KeyOrg | 0.63 | 0.67 | 0.65 | 0.65 |
| LogReg-BOW | 0.86 | 0.90 | 0.88 | 0.88 | |
| Test | KeyOrg | 0.61 | 0.69 | 0.64 | 0.70 |
| LogReg-BOW | 0.69 | 0.72 | 0.71 | 0.76 |
For text-as-data applications, substantive results are contingent on how researchers operationalize measurement of the (latent) theoretical construct of interest via observed text data. Using Baker et al.’s original causal assumptions (Section 2.2), we formally define the measurement of interest as:
| (2) |
where is the measurement function that maps text, , to economic policy uncertainty, .888Egami et al. (2018) call this function the codebook function and describe how it can generically map text to any lower-dimensional representation. For text-as-data practitioners, we emphasize that there is a “garden of forking paths” Gelman and Loken (2014) of how can be operationalized, for instance, in the representation of text (bag-of-words vs. embeddings), document classification function (deterministic keyword matching vs. supervised machine learning classifiers), and ways of aggregating individual document predictions (mean of predictions vs. prevalence-aware aggregation).
RQ2: What happens when we change to equally or more valid measurement functions? In particular, we are interested in sensitivity: for two measurements, and , does correlate well with ; and external predictive validity: for each measurement, , does correlate well with the VIX, a stock-market volatility index based on S&P 500 options prices?
Baker et al. also use the VIX as a measure of external validity, and like Baker et al. we note that the VIX is a good proxy for economic uncertainty, but does not necessarily capture policy uncertainty. As Baker et al. mention, “differences in the topical scope between the VIX and the EPU index are an important source of distinct variation in the two measures.” In the future, we could compare our measures to the other two external validity measures of Baker et al.: mentions of uncertain in the Federal Reserve’s Beige Books and large daily moves in the S&P stock index.
Data and pre-processing. Although Baker et al. use 10 newspapers to construct their US-based index, we instead use the New York Times Annotated Corpus (NYT-AC) Sandhaus (2008) because the text data is cleaned, easily accessible, and results on the corpus are reproducible. This collection includes over 1.8 million articles written and published by the New York Times between January 1, 1987 and June 19, 2007. Baker et al. assume that using newspapers based in the United States is sufficient to find a signal of US-based EPU. To test this assumption, we apply a simple heuristic to the dateline of NYT-AC articles and remove articles that mention non-US cities. However, we find relatively little variation in results via this heuristic (see Appendix, Figure 7).
4.1 Keyword matching
Matching keyword lists, also known as lexicons or dictionaries, is a straightforward method to retrieve and/or classify documents of interest, and has the advantage of being interpretable. However, relying on a small set of keywords can create issues with recall and generalization. On NYT-AC, we apply the original keyword matching method of Baker et al. (2016) who label a document as positive if it matches any of 2 economy keywords, AND any of 2 uncertainty keywords, AND any of 13 policy keywords, (KeyOrg). We also compare a method with the same economy and uncertainty matching criteria without policy keyword matching (KeyEU); and a method for which we expand the economic and uncertainty keywords via word embeddings (KeyExp). See Table 2 in the Appendix for the full list of keywords.
KeyExp. Although Baker et al. use human auditors to find policy keywords that minimize the false positive and false negative rates, they do not expand or optimize for economy or uncertainty keywords. Thus, we expand these keyword lists via GloVe word embeddings999We used the 200-dimensional, 6B token corpus from Wikipedia and Common Crawl http://nlp.stanford.edu/data/glove.6B.zip Pennington et al. (2014), and find the five nearest neighbors via cosine distance.101010 We manually remove clear obvious negative keywords: policy from the economic keyword bank and prospects and remain from the uncertainty keyword banks. This is a simple keyword expansion technique. In future work, one could look to the literature on lexicon induction to improve creating lexicons that represent the semantic concepts of interest Taboada et al. (2011); Pryzant et al. (2018); Hamilton et al. (2016); Rao and Ravichandran (2009). Alternatively, one could also create a probabilistic classifier over pre-selected lexicons to soften the predictions, or use other uncertainty lexicons or even automatic uncertainty cue detectors.
4.2 Document classifiers
Probabilistic supervised machine learning classifiers are optimized to minimize the training loss between the predicted and true classes, and typically have better precision and recall trade-offs compared to keyword matching methods. We use 1844 documents and labels from BBD from 1985-2007 as training data and 687 documents from 2007-2012 as a held-out test set. We train a simple logistic regression classifier using sklearn111111Version 0.22.1 https://scikit-learn.org/ Pedregosa et al. (2011) with a bag-of-words representation of text (LogReg-BOW). We tokenize and prune the vocabulary to retain words that appear in at least 5 documents, resulting in a vocabulary size of 15,968. We tune the L2-penalty via five-fold cross-validation. We also try alternative (non-BOW) text representations but these did not result in improved performance (Appendix, § D). Note that the labeled documents in BBD are a biased sample as the authors select documents to annotate that match the economy and uncertainty keyword banks and do not select documents at random.
4.3 Prevalence estimation
Measuring economic policy uncertainty is an instance of prevalence estimation, the task of estimating the proportion of items in each given class. Previous work has shown that simple aggregation methods over individual class labels can be biased if there is a shift in the distribution from training to testing or if the task is difficult Keith and O’Connor (2018). We compare aggregating via classify and count (CC), taking the mean over binary labels, and probabilistic classify and count (PCC), taking the mean over classifiers’ inferred probabilities. See the Appendix §D.3 for additional prevalence estimation experiments.
4.4 Results
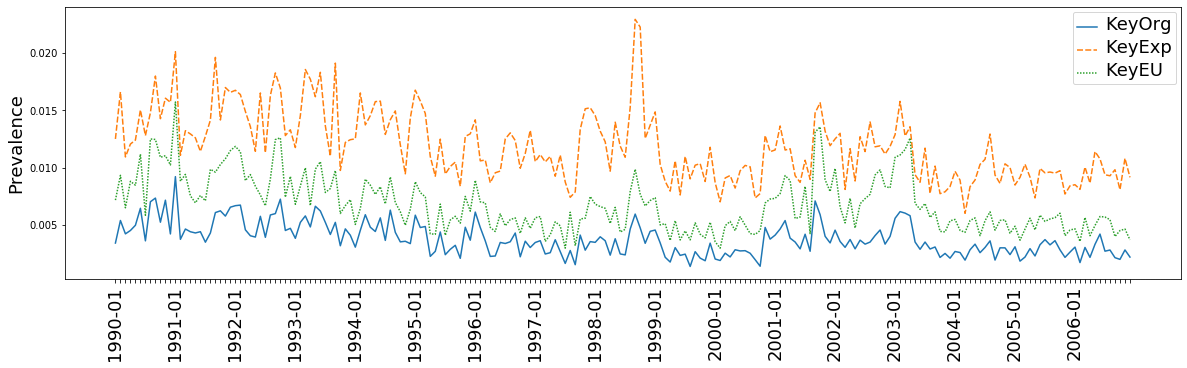
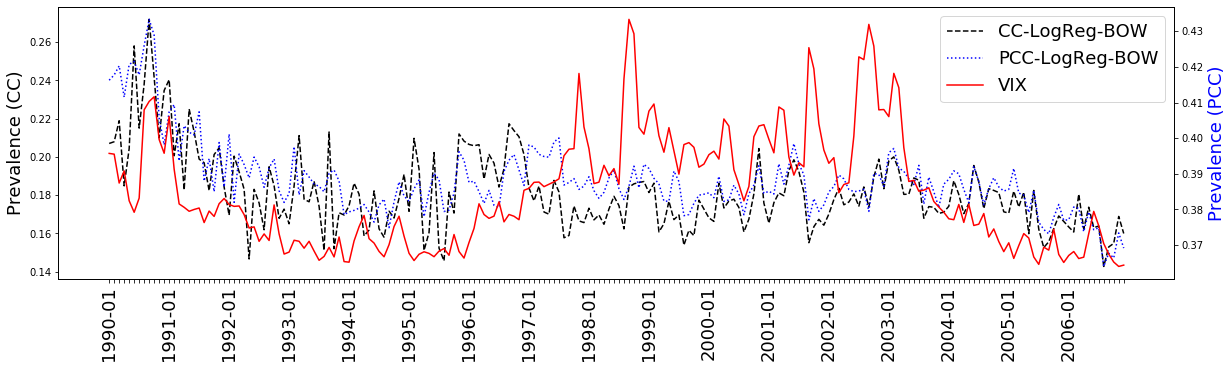
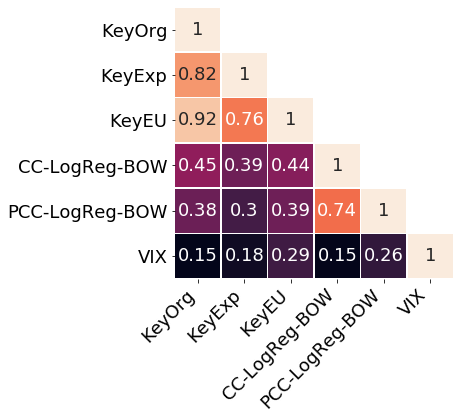
Addressing RQ2, our experimental results show that changes in measurement can result in substantial differences in the corresponding index. Table 6 presents individual classification results on the training and test sets of BBD, and Figures 3 and 3 show inference of the models on NYT-AC. In Figure 3, we note that the overall prevalences are substantially different: KeyExp has higher prevalence than KeyOrg as expected with more keywords but the supervised methods infer prevalences near 0.2 (CC) and 0.4 (PCC) which indicates they may be biased towards the training prevalence. LogReg-BOW achieves both better individual classification predictive performance and combined with a probabilistic classify and count (PCC) prevalence estimation method achieves better correlation with the VIX (0.26 vs. KeyOrg’s 0.15). The better predictive performance and correlation with VIX suggests PCC-LogReg-BOW represents a reasonable measurement of economic policy uncertainty. Given this, the low correlation between PCC-LogReg-BOW and KeyOrg (0.38) raises concerning questions about KeyOrg’s validity.
4.5 Limitations
| Pearson’s r | |
|---|---|
| KeyOrg-10 vs. KeyOrg-NYT | 0.68 |
| KeyOrg-10 vs. VIX | 0.57 |
| KeyOrg-NYT vs. VIX | 0.15 |
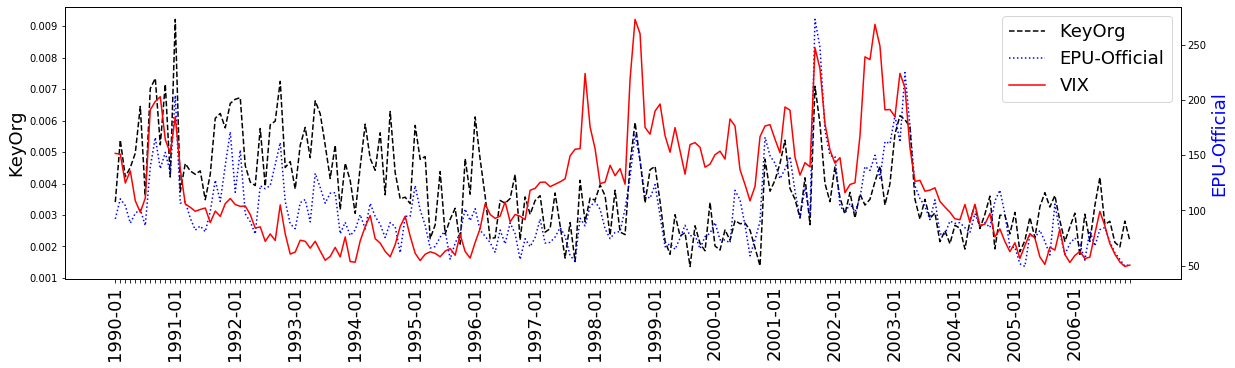
We use the NYT-AC as a “sandbox” for our experiments because of proprietary restrictions that limit us from acquiring the full text of all 10 news outlets used by Baker et al. To understand the limitations of using only a single news outlet, we compare the “official” aggregated index of Baker et al.121212From “News_Based_Policy_Uncert_Index” column of http://policyuncertainty.com/media/US_Policy_Uncertainty_Data.xlsx with KeyOrg applied to only the NYT-AC. Table 7 shows a 0.68 correlation between the official EPU index (KeyOrg-10) and the same keyword-matching method on only the NYT-AC (KeyOrg-NYT). Yet, KeyOrg-10 has a much higher correlation with the VIX, 0.57, compared to KeyOrg-NYT’s correlation of 0.15. See Figure 8 in the Appendix for a graph of these different indexes. We hypothesize applying PCC-LogReg-BOW to the texts of the all 10 newspapers used by Baker et al. would result in improved external predictive validity, but we leave an empirical confirmation of this to future work. In practice, while keyword look-ups have lower recall than supervised methods they have the advantage of being interpretable and can use counts from document retrieval systems instead of full texts.
5 Related work
There have been only a few other attempts to construct alternative, non-keyword measurements of economic policy uncertainty. Azqueta-Gavaldón (2017) apply topic models and manually map the topics to Baker et al.’s EPU categories and find their method tightly correlates (0.94) with the original index. In an unpublished manuscript, Nyman and Ormerod (2020) expand the uncertainty keywords of Baker et al. via nearest neighbor embeddings and find Granger causality between their expanded keyword list and the original EPU index. In contrast, we are the first to take a fully supervised learning approach to measuring EPU and analyze the original annotations of Baker et al..
Measurement of economic variables from text. Other work has examined measuring economic variables from text data (see Gentzkow et al. (2019) for a survey). For example, topic models have been applied to central bank communications Hansen et al. (2018) and newspaper articles Thorsrud (2020); Bybee et al. (2020) while other work identifies negated uncertainty markers (e.g. “there is no uncertainty”) in the Federal Reserve’s Beige Books Saltzman and Yung (2018) and extracts sentiment from central bank communications Apel and Grimaldi (2012). Boudoukh et al. (2019) use off-the-shelf supervised document classifiers to demonstrate that the information in news can predict stock prices.
Text-as-data methods. Traditional ways of analyzing textual data include content analysis where human annotators read and hand-code documents for particular phenomena Krippendorff (2018). In the last decade, many researchers have adapted machine learning and NLP methods to the needs of social scientists Card (2019); O’Connor et al. (2011). NLP technologies such as lexicons, topic models Roberts et al. (2014); Blei et al. (2003), supervised classifiers, word embeddings Mikolov et al. (2013); Pennington et al. (2014), and large-scale pre-trained language model representations Devlin et al. (2019) have been applied to textual data to extract relevant signals. More recent work attempts to extend text-as-data methods to incorporate principles from causal inference Pryzant et al. (2018); Wood-Doughty et al. (2018); Veitch et al. (2020); Roberts et al. (2020); Keith et al. (2020).
6 Future directions
In the future, estimating the sensitivity of causal estimates to the different measurement approaches presented in this paper could potentially have substantive impact. Using a Bayesian modeling approach to annotator uncertainty Paun et al. (2018), investigating better calibration, which has been shown to improve prevalence estimation Card and Smith (2018), or estimating model uncertainty could improve measurement. One could also shift from document-level predictions of EPU to paragraph, sentence, or span-level predictions. Annotating discourse structure and selecting discourse fragments, e.g. Prasad et al. (2004), could potentially increase annotator agreement. These sub-document extraction models could also potentially provide human-interpretable contextualization of movements in an EPU index.
7 Conclusion
There is great promise for text-as-data methods and applications; however, we echo the cautionary advice of Grimmer and Stewart (2013) that automatic methods require extensive “problem-specific validation.” Our paper’s investigation of Baker et al. provides a number of general insights for text-as-data practioners along these lines. First, content validity: when dealing with text data, one needs to think carefully about the kinds of linguistic information one is trying to measure. For instance, mapping economic policy uncertainty to a document-level binary label collapses all types of semantic uncertainty, many of which cannot be identified via keywords alone. Second, one needs to examine social perception assumptions. Is one trying to prescribe an annotation schema, or, as we argue in this paper, are people’s perceptions about the concept as important as the concept itself, especially in the face of ambiguity in language? Third, sensitivity of measurements: text-as-data practitioners can strengthen their substantive conclusions if multiple measurement approaches give similar results. For economic policy uncertainty, this paper demonstrates that switching from keywords to aggregating the outputs of a document classifier are not tightly correlated, a concerning implication for the validity of this index.
Acknowledgements
The authors thank Bloomberg’s AI Engineering team, especially Diego Ceccarelli, Miles Osborne and Anju Kambadur, as well as Su Lin Blodgett for helpful feedback and directions. Additional thanks to the anonymous reviewers from the 2020 Natural Language Processing and Computational Social Science Workshop for their insights. Katherine Keith acknowledges support from Bloomberg’s Data Science Ph.D. Fellowship.
References
- Apel and Grimaldi (2012) Mikael Apel and Marianna Grimaldi. 2012. The information content of central bank minutes. Riksbank Research Paper Series.
- Arora et al. (2017) Sanjeev Arora, Yingyu Liang, and Tengyu Ma. 2017. A simple but tough-to-beat baseline for sentence embeddings. In ICLR.
- Artstein and Poesio (2008) Ron Artstein and Massimo Poesio. 2008. Inter-coder agreement for computational linguistics. Computational Linguistics, 34(4):555–596.
- Azqueta-Gavaldón (2017) Andrés Azqueta-Gavaldón. 2017. Developing news-based economic policy uncertainty index with unsupervised machine learning. Economics Letters, 158:47–50.
- Baker et al. (2016) Scott R Baker, Nicholas Bloom, and Steven J Davis. 2016. Measuring economic policy uncertainty. The Quarterly Journal of Economics, 131(4):1593–1636.
- Beltagy et al. (2020) Iz Beltagy, Matthew E Peters, and Arman Cohan. 2020. Longformer: The long-document transformer. arXiv preprint arXiv:2004.05150.
- Bhagavatula et al. (2020) Chandra Bhagavatula, Ronan Le Bras, Chaitanya Malaviya, Keisuke Sakaguchi, Ari Holtzman, Hannah Rashkin, Doug Downey, Wen-tau Yih, and Yejin Choi. 2020. Abductive commonsense reasoning. In ICLR.
- Blei et al. (2003) David M Blei, Andrew Y Ng, and Michael I Jordan. 2003. Latent dirichlet allocation. Journal of machine Learning research, 3(Jan):993–1022.
- Boudoukh et al. (2019) Jacob Boudoukh, Ronen Feldman, Shimon Kogan, and Matthew Richardson. 2019. Information, trading, and volatility: Evidence from firm-specific news. The Review of Financial Studies, 32(3):992–1033.
- Brogaard and Detzel (2015) Jonathan Brogaard and Andrew Detzel. 2015. The asset-pricing implications of government economic policy uncertainty. Management Science, 61(1):3–18.
- Bybee et al. (2020) Leland Bybee, Bryan T Kelly, Asaf Manela, and Dacheng Xiu. 2020. The structure of economic news. Technical report, National Bureau of Economic Research.
- Card (2019) Dallas Card. 2019. Accelerating Text-as-Data Research in Computational Social Science. Ph.D. thesis, Carnegie Mellon University.
- Card and Smith (2018) Dallas Card and Noah A Smith. 2018. The importance of calibration for estimating proportions from annotations. In Proceedings of the 2018 Conference of the North American Chapter of the Association for Computational Linguistics: Human Language Technologies, Volume 1 (Long Papers), pages 1636–1646.
- Devlin et al. (2019) Jacob Devlin, Ming-Wei Chang, Kenton Lee, and Kristina Toutanova. 2019. Bert: Pre-training of deep bidirectional transformers for language understanding. In NAACL-HLT.
- Dumitrache et al. (2018) Anca Dumitrache, Lora Aroyo, and Chris Welty. 2018. Crowdsourcing ground truth for medical relation extraction. ACM Transactions on Interactive Intelligent Systems, 8(2):1–20.
- Egami et al. (2018) Naoki Egami, Christian J Fong, Justin Grimmer, Margaret E Roberts, and Brandon M Stewart. 2018. How to make causal inferences using texts. arXiv preprint arXiv:1802.02163.
- Evans and Aceves (2016) James A Evans and Pedro Aceves. 2016. Machine translation: Mining text for social theory. Annual Review of Sociology, 42:21–50.
- Farkas et al. (2010) Richárd Farkas, Veronika Vincze, György Móra, János Csirik, and György Szarvas. 2010. The CoNLL-2010 shared task: learning to detect hedges and their scope in natural language text. In Proceedings of the fourteenth conference on computational natural language learning–Shared task, pages 1–12.
- Ganter and Strube (2009) Viola Ganter and Michael Strube. 2009. Finding hedges by chasing weasels: Hedge detection using wikipedia tags and shallow linguistic features. In Proceedings of the ACL-IJCNLP 2009 Conference Short Papers, pages 173–176.
- Gelman and Loken (2014) Andrew Gelman and Eric Loken. 2014. The statistical crisis in science: data-dependent analysis–a “garden of forking paths”. American scientist, 102(6):460–466.
- Gentzkow et al. (2019) Matthew Gentzkow, Bryan Kelly, and Matt Taddy. 2019. Text as data. Journal of Economic Literature, 57(3):535–74.
- Grimmer and Stewart (2013) Justin Grimmer and Brandon M Stewart. 2013. Text as data: The promise and pitfalls of automatic content analysis methods for political texts. Political analysis, 21(3):267–297.
- Gulen and Ion (2016) Huseyin Gulen and Mihai Ion. 2016. Policy uncertainty and corporate investment. The Review of Financial Studies, 29(3):523–564.
- Hamilton et al. (2016) William L Hamilton, Kevin Clark, Jure Leskovec, and Dan Jurafsky. 2016. Inducing domain-specific sentiment lexicons from unlabeled corpora. In Proceedings of the Conference on Empirical Methods in Natural Language Processing. Conference on Empirical Methods in Natural Language Processing, volume 2016, page 595. NIH Public Access.
- Hansen et al. (2018) Stephen Hansen, Michael McMahon, and Andrea Prat. 2018. Transparency and deliberation within the FOMC: a computational linguistics approach. The Quarterly Journal of Economics, 133(2):801–870.
- Hoberg and Phillips (2016) Gerard Hoberg and Gordon Phillips. 2016. Text-based network industries and endogenous product differentiation. Journal of Political Economy, 124(5):1423–1465.
- Huang et al. (2019) Lifu Huang, Ronan Le Bras, Chandra Bhagavatula, and Yejin Choi. 2019. Cosmos QA: Machine reading comprehension with contextual commonsense reasoning. In Proceedings of the 2019 Conference on Empirical Methods in Natural Language Processing and the 9th International Joint Conference on Natural Language Processing (EMNLP-IJCNLP), pages 2391–2401.
- Iyyer et al. (2015) Mohit Iyyer, Varun Manjunatha, Jordan Boyd-Graber, and Hal Daumé III. 2015. Deep unordered composition rivals syntactic methods for text classification. In Proceedings of the 53rd annual meeting of the association for computational linguistics and the 7th international joint conference on natural language processing (volume 1: Long papers), pages 1681–1691.
- Jacobs and Wallach (2019) Abigail Z Jacobs and Hanna Wallach. 2019. Measurement and fairness. arXiv preprint arXiv:1912.05511.
- Keith et al. (2020) Katherine Keith, David Jensen, and Brendan O’Connor. 2020. Text and Causal Inference: A review of using text to remove confounding from causal estimates. In Proceedings of the 58th Annual Meeting of the Association for Computational Linguistics, Online. Association for Computational Linguistics.
- Keith and O’Connor (2018) Katherine Keith and Brendan O’Connor. 2018. Uncertainty-aware generative models for inferring document class prevalence. In Proceedings of the 2018 Conference on Empirical Methods in Natural Language Processing, pages 4575–4585.
- Keith and Stent (2019) Katherine Keith and Amanda Stent. 2019. Modeling financial analysts’ decision making via the pragmatics and semantics of earnings calls. In Proceedings of the 57th Annual Meeting of the Association for Computational Linguistics, pages 493–503.
- Krippendorff (2018) Klaus Krippendorff. 2018. Content analysis: An introduction to its methodology. Sage publications.
- Liu et al. (2019) Yinhan Liu, Myle Ott, Naman Goyal, Jingfei Du, Mandar Joshi, Danqi Chen, Omer Levy, Mike Lewis, Luke Zettlemoyer, and Veselin Stoyanov. 2019. Roberta: A robustly optimized BERT pretraining approach. arXiv preprint arXiv:1907.11692.
- Loevinger (1957) Jane Loevinger. 1957. Objective tests as instruments of psychological theory. Psychological reports, 3(3):635–694.
- Lucca and Trebbi (2009) David O Lucca and Francesco Trebbi. 2009. Measuring central bank communication: an automated approach with application to fomc statements. Technical report, National Bureau of Economic Research.
- McShane et al. (2004) Marjorie McShane, Sergei Nirenburg, and Ron Zacharski. 2004. Mood and modality: out of theory and into the fray. Natural Language Engineering, 10(1):57–89.
- Messick (1987) Samuel Messick. 1987. Validity. ETS Research Report Series, 1987(2):i–208.
- Mikolov et al. (2013) Tomas Mikolov, Ilya Sutskever, Kai Chen, Greg S Corrado, and Jeff Dean. 2013. Distributed representations of words and phrases and their compositionality. In Advances in neural information processing systems, pages 3111–3119.
- Nyman and Ormerod (2020) Rickard Nyman and Paul Ormerod. 2020. Text as data: a machine learning-based approach to measuring uncertainty. arXiv preprint arXiv:2006.06457.
- O’Connor et al. (2011) Brendan O’Connor, David Bamman, and Noah A Smith. 2011. Computational text analysis for social science: Model assumptions and complexity. In Second Workshop on Comptuational Social Science and the Wisdom of Crowds (NIPS 2011).
- Paun et al. (2018) Silviu Paun, Bob Carpenter, Jon Chamberlain, Dirk Hovy, Udo Kruschwitz, and Massimo Poesio. 2018. Comparing Bayesian models of annotation. Transactions of the Association for Computational Linguistics, 6:571–585.
- Pavlick and Kwiatkowski (2019) Ellie Pavlick and Tom Kwiatkowski. 2019. Inherent disagreements in human textual inferences. Transactions of the Association for Computational Linguistics, 7:677–694.
- Pearl (2009) Judea Pearl. 2009. Causality. Cambridge university press.
- Pedregosa et al. (2011) Fabian Pedregosa, Gaël Varoquaux, Alexandre Gramfort, Vincent Michel, Bertrand Thirion, Olivier Grisel, Mathieu Blondel, Peter Prettenhofer, Ron Weiss, Vincent Dubourg, et al. 2011. Scikit-learn: Machine learning in python. the Journal of machine Learning research, 12:2825–2830.
- Pennington et al. (2014) Jeffrey Pennington, Richard Socher, and Christopher D Manning. 2014. Glove: Global vectors for word representation. In Proceedings of the 2014 conference on empirical methods in natural language processing (EMNLP), pages 1532–1543.
- Prasad et al. (2004) Rashmi Prasad, Eleni Miltsakaki, Aravind Joshi, and Bonnie Webber. 2004. Annotation and Data Mining of the Penn Discourse Treebank. In In Proceedings of the ACL Workshop on Discourse Annotation.
- Pryzant et al. (2018) Reid Pryzant, Kelly Shen, Dan Jurafsky, and Stefan Wagner. 2018. Deconfounded lexicon induction for interpretable social science. In Proceedings of the 2018 Conference of the North American Chapter of the Association for Computational Linguistics: Human Language Technologies, Volume 1 (Long Papers), pages 1615–1625.
- Quinn et al. (2010) Kevin M Quinn, Burt L Monroe, Michael Colaresi, Michael H Crespin, and Dragomir R Radev. 2010. How to analyze political attention with minimal assumptions and costs. American Journal of Political Science, 54(1):209–228.
- Rao and Ravichandran (2009) Delip Rao and Deepak Ravichandran. 2009. Semi-supervised polarity lexicon induction. In Proceedings of the 12th Conference of the European Chapter of the ACL (EACL 2009), pages 675–682.
- Roberts et al. (2020) Margaret E. Roberts, Brandon M. Stewart, and Richard A. Nielsen. 2020. Adjusting for confounding with text matching. American Journal of Political Science.
- Roberts et al. (2014) Margaret E Roberts, Brandon M Stewart, Dustin Tingley, Christopher Lucas, Jetson Leder-Luis, Shana Kushner Gadarian, Bethany Albertson, and David G Rand. 2014. Structural topic models for open-ended survey responses. American Journal of Political Science, 58(4):1064–1082.
- Saltzman and Yung (2018) Bennett Saltzman and Julieta Yung. 2018. A machine learning approach to identifying different types of uncertainty. Economics Letters, 171:58–62.
- Sandhaus (2008) Evan Sandhaus. 2008. The new york times annotated corpus. Linguistic Data Consortium, Philadelphia, 6(12):e26752.
- Sap et al. (2019) Maarten Sap, Hannah Rashkin, Derek Chen, Ronan LeBras, and Yejin Choi. 2019. SocialIQA: Commonsense reasoning about social interactions. EMNLP.
- Saurí and Pustejovsky (2009) Roser Saurí and James Pustejovsky. 2009. Factbank: a corpus annotated with event factuality. Language resources and evaluation, 43(3):227.
- Sharmanska et al. (2016) Viktoriia Sharmanska, Daniel Hernández-Lobato, Jose Miguel Hernandez-Lobato, and Novi Quadrianto. 2016. Ambiguity helps: Classification with disagreements in crowdsourced annotations. In Proceedings of the IEEE Conference on Computer Vision and Pattern Recognition, pages 2194–2202.
- Szarvas et al. (2012) György Szarvas, Veronika Vincze, Richárd Farkas, György Móra, and Iryna Gurevych. 2012. Cross-genre and cross-domain detection of semantic uncertainty. Computational Linguistics, 38(2):335–367.
- Taboada et al. (2011) Maite Taboada, Julian Brooke, Milan Tofiloski, Kimberly Voll, and Manfred Stede. 2011. Lexicon-based methods for sentiment analysis. Computational linguistics, 37(2):267–307.
- Tetlock (2007) Paul C Tetlock. 2007. Giving content to investor sentiment: The role of media in the stock market. The Journal of finance, 62(3):1139–1168.
- Thorsrud (2020) Leif Anders Thorsrud. 2020. Words are the new numbers: A newsy coincident index of the business cycle. Journal of Business & Economic Statistics, 38(2):393–409.
- Veitch et al. (2020) Victor Veitch, Dhanya Sridhar, and David Blei. 2020. Adapting text embeddings for causal inference. In Conference on Uncertainty in Artificial Intelligence, pages 919–928. PMLR.
- Wood-Doughty et al. (2018) Zach Wood-Doughty, Ilya Shpitser, and Mark Dredze. 2018. Challenges of using text classifiers for causal inference. In Proceedings of the Conference on Empirical Methods in Natural Language Processing. Conference on Empirical Methods in Natural Language Processing, volume 2018, page 4586. NIH Public Access.
Appendix
Appendix A Datasets
Here we provide more information on the data used in annotation and measurement experiments.
-
•
BBD. From Baker et al. (2016), we combine the authors’ annotations with the full text data they provided.131313http://policyuncertainty.com/AUDIT_ANALYSIS.zip and http://policyuncertainty.com/media/All%20Audit%20Hard%20Copies.rar These documents and annotations are sampled from ten major newspapers in the United States.141414LA Times, USA Today, Chicago Tribune, Washington Post, Boston Globe, Wall Street Journal, New York Times, Miami Herald, Dallas Morning News, San Francisco Chronicle We also study and refer to their Code Guide when analyzing examples for this paper.151515http://policyuncertainty.com/media/Coding_Guide.pdf See Lines 1-2 of Table 4 for descriptive statistics of this dataset.
-
•
NYT-AC. We use the New York Times Annotated Corpus as a sandbox for our experiments Sandhaus (2008).161616https://catalog.ldc.upenn.edu/LDC2008T19 This corpus includes over 1.8 million articles written and published by the New York Times between January 1, 1987 and June 19, 2007.
-
•
VIX. The VIX is an index of market expectations of the next 30 days’ U.S. stock market volatility, derived from S&P 500 options prices. Like Baker et al., we take a monthly average over the daily VIX measures, obtained from a standard proprietary database.
Appendix B Annotation notes
We provide additional descriptive statistics of Baker et al. (2016)’s original annotations in Tables 8 and 9. The annotation instructions for our experiment (§3.1) are provided in Figure 4. In our annotation experiment, the mean annotator confidence levels are 3.81 for Sample A and 3.85 for Sample B.
| Annotator | Mean pos. | Std | N |
|---|---|---|---|
| A | 0.300 | 0.46 | 50 |
| B | 0.619 | 0.49 | 278 |
| C | 0.431 | 0.50 | 297 |
| D | 0.445 | 0.50 | 449 |
| E | 0.551 | 0.50 | 472 |
| F | 0.330 | 0.47 | 790 |
| G | 0.402 | 0.49 | 1168 |
| H | 0.389 | 0.49 | 1185 |
| I | 0.350 | 0.48 | 1265 |
| J | 0.398 | 0.49 | 1443 |
| K | 0.455 | 0.50 | 1606 |
| L | 0.397 | 0.49 | 1740 |
| M | 0.405 | 0.49 | 2320 |
| N | 0.443 | 0.50 | 2997 |
| Num. Annotators | Num. Docs |
|---|---|
| 1 | 11647 |
| 2 | 2053 |
| 3 | 83 |
| 4 | 12 |
| 5 | 2 |
Appendix C Qualitative examples
| Example selection | Our analysis | Label Mean, Docid | |
|---|---|---|---|
| 1 | …Several recent news reports have questioned the stamina of Wells Fargo’s real estate portfolio in the event of a recession that extends to California. The analysis had driven the bank’s stock sharply down. …. | Stock market newsletter digest. Economics policy is not mentioned as uncertain | 0.0, MIHB_11_1990_8 |
| 2 | …Just eight days before the threatened imposition of punitive U.S. tariffs on Japanese luxury cars, Japanese automakers are signaling a strong desire to compromise with Washington in the bitter dispute over automotive trade. … | Report on international trade dispute. ”threatened” directly expresses uncertainty, ”tariffs” are economic policy | 0.8, DMNB_6_1995_8 |
| Example selection | Our analysis | Label Mean, Docid | |
|---|---|---|---|
| 1 | …I am a true believer that mobile broadband will help my company and hundreds of other businesses in South Florida work more efficiently, better serve consumers and hire more employees. On a related matter, policymakers in Washington, D.C. are making decisions on whether to allow AT&T to pay approximately $39 billion for its wireless rival T-Mobile. This is a deal of vital importance to our community …. | An op-ed arguing that a merger should be allowed to go forward. Arguing for a certain outcome implies uncertainty of the outcome, but uncertainty is never explicitly stated. | 0.4, MIHB_5_2011_3 |
| 2 | …angst over rising interest rates triggered a nasty sell-off in the stock market Friday …The markets also fret that the Federal Reserve Board will move to curb that inflation threat … | Reports on downturn in stock market. Annotators must decide: is there uncertainty about FED actions or strong expectation of disfavoured actions. | 0.4, LA_8_1997_9 |
| 3 | …If Cuba’s fledgling recovery is to continue, Mr. Castro must legalize small- and medium-sized businesses, boost wages and gradually introduce free markets, U.S. officials say. …Cuban officials have a very different view and blame the long-time U.S. ban on trade with the island for much of their economic woes.… | Reports on state of affairs in Cuba. States assumption that US or Cuban policy will eventually lead to economic problems. Uncertainty is only implied and no concrete policies are mentioned | 0.6, DMNB_12_1999_2 |
| 4 | …Two military coups and several attempts, race riots and poverty have made the Kingdom in the Sky a place of turmoil in the past years. Economic problems and the repeal of apartheid in South Africa, Lesotho’s overpowering neighbor on all sides, raise even more questions about what lies ahead. Sympathetic foreign powers have donated millions to Lesotho. … | Describes situation in Lesotho. Mentions economic downturn, large turnover in administrations and race riots. Not stated that turnover/riots lead to uncertainty over economic policy, but could be reasonably inferred as part reason for downturn. | 0.4, MIHB_7_1991_15 |
Appendix D Measurement: Additional Experiments
In this section, we provide additional measurement experiments. Also note there is a very small overlap between our training time documents and inference time NYT-AC documents. There are 375 documents at training time from NYT between the years of 1990 and 2006. However, the total number of inference documents is 1,501,131 so this is less than 0.025% of documents.
D.1 Filtering to US-Only News
Initial qualitative analysis reveals that many documents, and in particular articles with high annotator disagreement, are focused on events outside the United States. An unstated assumption of Baker et al. (2016) is that US-based news sources will primarily report US-based news and thus US-based economic policy uncertainty. We test this assumption empirically.
To remove non-US news, we use a simple heuristic that gives almost perfect precision. NYT-AC has metadata about the dateline of an article, for example “KUWAIT, Sunday, March 30,” “SAN ANTONIO, March 29,” or “BAGHDAD, Iraq, March 29.” We (1) use the GeoNames Gazateer171717http://www.geonames.org/ and filter to cities that have greater than 15,000 inhabitants;181818https://datahub.io/core/world-cities (2) separate these city names into US and non-US cities such that ties go to US. For example, Athens would not be removed because the town of Athens, Georgia is in the United State; (3) write a rule-based text parser that extracts the span of text that is in all capitals, (4) if the city name is in non-US cities, we discard the document.
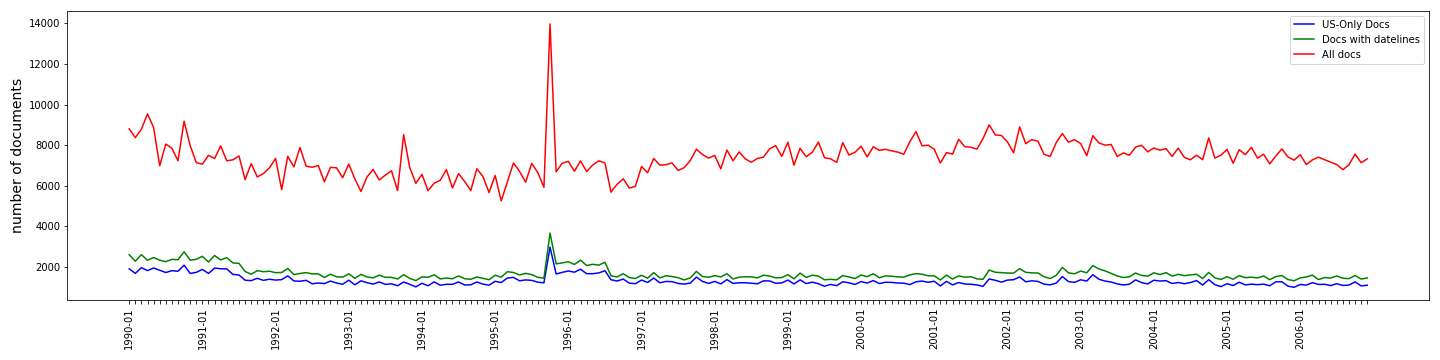
Per month, on average, we remove 449 documents that were about non-US news. See Figure 6 for a comparison of all NYT articles, articles with the dateline, and US-only articles based on our heuristic.
Figure 7 displays correlation results for all models with the US-Only document filter. Applying the US-Only filter only slightly improves correlation of all models with the VIX (0.01-0.04 correlation). From these results, it seems that Baker et al.’s assumption is valid. However, we also acknowledge that our heuristic is high-precision, low recall and in the future, one could possibly use a country-level document classifier instead.
D.2 Predicting after EU filter
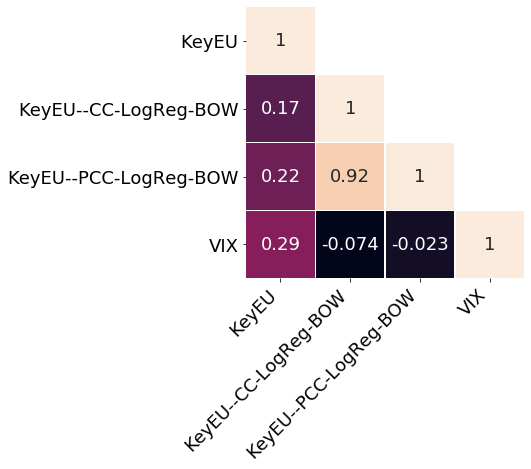
As we acknowledge in the main text, the training set is biased because documents were sampled only if they matched the economy and uncertainty keyword banks. To make a fair comparison at inference time, we looked at the predictions of our document classifiers on the subset of documents in NYT-AC that also matched these economy and uncertainty keyword banks (KeyEU). In Figure 5, we see that the subset of these models had lower correlation with the VIX.
| Split | Model | Prec. | Recall | F1 | Acc. |
|---|---|---|---|---|---|
| Train | LogReg-BERT | 0.79 | 0.77 | 0.78 | 0.79 |
| Test | LogReg-BERT | 0.61 | 0.59 | 0.60 | 0.68 |
D.3 Additional prevalence estimation experiments
As an alternative to classify and count (CC) and probabilistic classify and count (PCC) prevalence estimation methods, we also experiment with the Implicit Likelihood (ImpLik) prevalence estimation method of Keith and O’Connor (2018). This method gives the predictions of a discriminative classifier a generative re-interpretation and backs out an implicit individual-level likelihood function which can take into account bias in the training prevalence. We use the authors’ freq-e software package.191919https://github.com/slanglab/freq-e. For the label prior we used the training prevalence of 0.48. Figure 7 shows a high correlation between ImpLik and PCC, 0.83 correlation; however, ImpLik had much lower correlation with the VIX (0.1). Note, the mean prevalences from ImpLik are much lower than PCC or CC with a mean monthly prevalence across 1990-2006 of 0.02. Thus, the method seems to be correcting for a more realistic prevalence but the true prevalence values may be too low to pick-up relevant signal via this method.
D.4 BERT representations
Finally, we acknowledge that a bag-of-words representation in the document classifier is dissatisfying to capture long-range semantic dependencies and the contextual nature of language that has motivated recent research in contextual, distributed representations of text. Thus, we use the frozen representations of a large, pre-trained language model that has been optimized for long documents, the LongFormer Beltagy et al. (2020). This is a model that optimizes a RoBERTa model Liu et al. (2019) for long documents. We use the huggingface implementation of the LongFormer202020https://huggingface.co/transformers/model_doc/longformer.html and use the 768-dimensional “pooled output”212121This is the hidden state of the last layer of the first token of the sequence which is then passed through a linear layer and Tanh activation function. The linear layer weights are trained from the next sentence prediction objective during pre-training. as our document representation. We then use the same sklearn logistic regression training as the BOW models.
Comparing Table 12 to Table 6, we see that this representation has decreased performance compared to LogReg-BOW. We speculate that this decrease in performance may originate in having to truncate documents to 4096 tokens due to the constraints of the model architecture. With more computational resources, we would fine-tune the pre-trained weights instead of leaving them frozen. Future work could also consider obtaining alternative representations of text via weighted averaging of embeddings Arora et al. (2017), deep averaging networks Iyyer et al. (2015), or pooling BERT embeddings of all paragraphs in a document.