Using Graph Neural Networks for
Mass Spectrometry Prediction
Abstract
Detecting and quantifying products of cellular metabolism using Mass Spectrometry (MS) has already shown great promise in many biological and biomedical applications. The biggest challenge in metabolomics is annotation, where measured spectra are assigned chemical identities. Despite advances, current methods provide limited annotation for measured spectra. Here, we explore using graph neural networks (GNNs) to predict the spectra. The input to our model is a molecular graph. The model is trained and tested on the NIST 17 LC-MS dataset. We compare our results to NEIMS, a neural network model that utilizes molecular fingerprints as inputs. Our results show that GNN-based models offer higher performance than NEIMS. Importantly, we show that ranking results heavily depend on the candidate set size and on the similarity of the candidates to the target molecule, thus highlighting the need for consistent, well-characterized evaluation protocols for this domain.
1 Introduction
Metabolomics is a powerful approach that can characterize small molecules produced in cells, tissues and other biological systems. Metabolites are direct products of enzymatic reactions and provide a functional readout of cellular state [1, 2]. Compared to genes and proteins that are regulated and post-translationally modified, respectively, metabolites are most predictive of the phenotype [3]. So far, metabolomics studies identified biomarkers for several diseases, and advanced our understanding of nutrition, the environment, and other complex biological systems.
Mass Spectrometry (MS) techniques coupled with liquid or gas chromatography separation techniques, LC-MS or GC-MS, have become a standard analytical platform for untargeted metabolomics [4, 5]. The LC or GC step aims to separate compounds within the sample, while the MS step aims to ionize, fragment and detect a fragmentation pattern. For each compound, this pattern forms a spectral signature, comprising a chromatographic retention time (RT) paired with mass measurements (m/z) and their respective relative intensities for a particular compound and its fragments.
Interpreting metabolomics measurements requires annotation, the process of assigning putative chemical identities to each spectral signature. From a computational perspective, mapping molecules to their respective spectral signatures represents a “forward problem”. Mapping spectral signatures back to their respective molecular identity is an “inverse problem”. The inverse problem is exceptionally challenging as not all fragments are measured and many isomers (same molecular formula but different atom configurations) have almost indistinguishable spectra.
Current annotation techniques attempt to solve the forward problem, and can be broadly classified into two categories. Database lookup relies on comparing measured spectra against experimentally generated spectra cataloged in spectral databases such as METLIN [6], HMDB [7], MassBank [8], and NIST [9]. Coverage of such libraries however is limited, as experiments are required to generate signatures from known, trusted chemical standards. Based on a predetermined set of candidate molecules, in-silico annotation tools recommend a candidate molecule that best explains the measured spectra. The candidate set is typically culled from large molecular databases, such as PubChem, based on molecular mass or formula, if possible. Earlier works generated fragmentation patterns of candidate metabolites using rule-based approaches, e.g., Mass Frontier [10], ACD/MS Fragmenter [11], and Hammer [12]. Subsequent efforts introduced combinatorial enumeration methods, e.g., MetFrag [13], Fragment Identificator (FiD) [14], Fragment Formula Calculator [15], and Mass Spectrum Interpreter [16]. More recently, machine-learning algorithms have been investigated. CFM-ID trains a probabilistic generative model of the fragmentation process to predict patterns of fragmentation [17, 18]. CSI:FingerID [19] first predicts a fragmentation tree based on a spectral signature [20]. CSI:FingerID then uses multiple-kernel learning [21] and support vector machines (SVMs) to predict fragmentation tree properties that are then searched against properties of candidate molecules. All of these techniques explicitly model compound fragmentation. A recent study proposed a model, NEIMS (Neural Electron-Ionization Mass Spectrometry), to augment existing NIST 17 GC-MS libraries with with synthetic spectra predicted from candidate molecules [22]. The molecules are first mapped to their ECFP (Extended-Connectivity Fingerprints) fingerprint that record the count of molecular subgraphs within a specified radius centered on each atom in the molecule. Using a radius of 2, the fingerprint consisted of 4096 entries. The fingerprint is input to a fully connected feed forward neural network (FFNN) with a gated bidirectional design to improve the prediction accuracy. However, fingerprints, while common and useful, are not tailored to the prediction task. Moreover, NEIMS was only evaluated on the NIST data generated via the GC-MS technique. GC-MS fragmentation patterns are simpler than those obtained using LC-MS. Further GC-MS is typically used to measure volatile compounds (or compounds that can be extracted into an organic solvent and vaporized using GC), which typically have masses less than 500 Daltons.
Here, we evaluate the feasibility of using Graph Neural Networks (GNNs) on the MS spectral prediction task. GNNs have been shown powerful in terms of learning representations from structured data [23, 24, 25, 26], such as social networks, knowledge graphs and molecules. Here, we represent each molecule as a graph, where atoms are represented as nodes, and bonds are represented as edges. We explore the use of both Graph Convolutional Networks (GCN) [24] and Graph Attention Networks (GAT) [25]. We train and evaluate our technique on the NIST 17 LC-MS dataset.
2 Methods
2.1 Datasets
The NIST 17 dataset consists of several mass spectrum datasets, including the EI MS library, the GC library, and the tandem MS/MS library. For training and evaluation, we focused our efforts on the tandem MS/MS dataset, and selected spectra obtained using HCD (higher energy collisional dissociation), which provides a richer and more varied spectra than CID (collision induced dissociation). The HCD option was used to measure 69.6% of the MS/MS data. We also restricted the precursor types to only include ones that are common in the dataset (e.g., [M+H]+, [M-H]-, [M+H-H2O]+, [M-H-H2O], etc.). We selected one spectrum with the largest collision energy under 40eV for each training and test molecule.
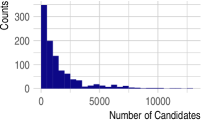
From the reduced dataset, we randomly select 1000 molecules as a test set. We then split the remaining dataset into training and validation (4:1 ratio), yielding 6,188 training and 1,539 test molecules. The validation set is used for model selection while the test set is used to report performance. The relevant candidate sets for the test molecules were queried from PubChem using the exact molecular formula of each test molecule (Figure 1).
2.2 Data Preprocessing
A molecule is represented as a graph , where atoms correspond to the node set and bonds correspond to the edge set . Let denote a set of node features, where is the number of nodes and is the number of node features. The connectivity among nodes is described by an adjacency matrix . Node features include standard atomic weight, atom type, number of bonds, number of neighboring hydrogen atoms, and indicators if the atom is part of a ring or an aromatic ring.
The spectra data is a list of paired mass-to-charge ratio (m/z) and their relative intensities. Each m/z value was rounded down to the nearest integer m/z bin. If more than one m/z values are rounded to the same bin, we record the highest intensity. The range of intensity values has a long tail of large values, so we take either the logarithm or the square-root of these intensity values as the fitting target. Then denote the vector as .
2.3 Neural Network
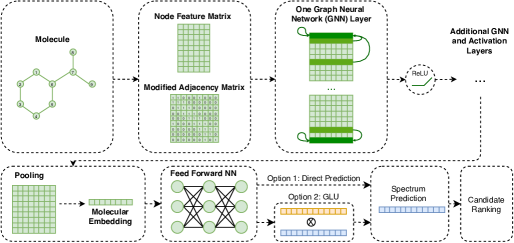
An overview of our neural network (NN) architecture is illustrated in Figure 2. The model comprises multiple GNN layers, a pooling layer and a fully-connected feed forward regression model. In each GNN layer, node information is propagated along graph edges. More specifically, let denote the input of a GNN layer, where is the dimension of input node embedding vector. Let denote the output with as the dimension of the new node embedding. The weight matrix of such a layer is and the bias term is . In the first GNN layer, is set to the original node features, . By stacking several layers of GNN layers, information on each node propagates along edges to a broader neighborhood within the graph.
We explore using two GNN implementations: GCN [24] and GAT [25]. The propagation rule of a single GCN layer is given as:
where is the set of neighbors of node and is an activation function. is a normalization term and it is set equal to . The normalization penalizes nodes with too many connections to avoid extreme values. In contrast to GCN, GAT utilizes attention mechanism to propagate information as follows:
where is the attention term and equals to . In essence, GAT introduces additional trainable attention weights, , on the concatenated and vectors, to model a weighting term that controls how the message from each neighbor should be propagated to node . The softmax activation ensures that the sum of these weighting terms equals to 1 for each node. By design, GAT does not have a bias term.
In the second step of this model, after the learned node representation is obtained, node information is “pooled” into a graph embedding vector , thus aggregating information about the entire graph. We compared several different pooling methods including Global Maximum, Global Average and Global Attention [27].
After the pooling layer, the graph embedding vector is fed into a feed forward network (FFNN) that predicts . We also evaluated a gated linear unit (GLU) [28] instead of a dense layer for the outcome prediction. A GLU predicts two outputs simultaneously while one of the two outputs is activated by sigmoid and acts as a gate for the other output. The final output is activated by a ReLU function [29] to ensure positive outcome.
2.4 Training
The model was trained by minimizing the mean square error (MSE) between and . Since spectrum intensity itself is relative, we normalized both and . To reduce overfitting, we used L2 regularization with lambda set to 1.0 and a dropout rate at 0.5. All models were trained on a Nvidia P100 for a maximum of 1,000 epochs using Adam [30] with early stopping on validation loss with a window size of 15.
2.5 Evaluation
We evaluated our models using two metrics. First, the cosine similarity between the predicted and target spectra is used to assess the quality of the predicted spectra. Second, recall@k, a common metric for evaluating annotation tools, measures the the portion of correctly identified molecular identities in the test dataset when considering the top k ranked candidate molecules for each test spectra. We used the NEIMS model [22] as a baseline.
3 Results
| Experiment | Similarity | Avg Rank | Recall@1 | Recall@5 | Recall@10 |
| NIST 17 + Candidates from PubChem (Sampled with Average Size = 50) | |||||
| NEIMS | 0.157 | 16.7 | 30.2 | 52.5 | 65.1 |
| GCN (3 layers) | 0.426 | 10.8 | 33.9 | 62.3 | 75.9 |
| GAT (3 layers) | 0.468 | 9.2 | 36.0 | 65.2 | 76.6 |
| GAT (10 layers) | 0.512 | 7.1 | 41.2 | 70.7 | 81.4 |
| GAT + GLU | 0.517 | 6.8 | 45.1 | 70.8 | 83.3 |
Our experiments had two purposes: 1) explore a wide variety of NN architectures and select the model that minimizes the MSE, and 2) evaluate the model’s ranking performance on the candidate set as compared to our baseline model.
Compared with the molecular fingerprint based NEIMS model (Table 1), GNN-based NN models generate significantly more accurate spectra and exhibit higher recall@k. To find the NN architecture that minimizes the MSE, we examined the effect of including adjacent bond information in the model. We also performed hyper-parameter searching on MS intensity data transformation methods (square root or log transformation), graph pooling methods on nodes (Global Max, Global Average or Global Attention), GNN types (GCN or GAT), GNN architecture and the outcome prediction layer (Dense layer or GLU). Including bond information was beneficial. Log transformation consistently provides better performance than square-root transformation. GAT performs better than GCN, suggesting that the attention mechanism is effective for this task. We also observed that the performance of GCN quickly dropped as the number of GCN layers increase. This agrees with previous reported findings [26]. However, by using GAT, it was possible to build deeper GNN models. The best performance happens when there are 10 layers of stacked GATs with 64 hidden units, with the output predicted by GLU. Among the three pooling methods, Global Max provided better performance than the other two. After the model was trained, it achieved ~11,000 predictions per second on an Nvidia V100 GPU card.
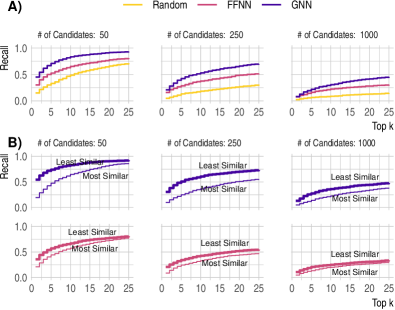
To evaluate how the size of candidate set impacts ranking performance, we sample a proportion of candidates for each test molecule. We calculated the ratio of the average number of candidates per test molecule (1,530) and 50, 250 and 1000 and used these ratios to scale the candidate set for each test molecule appropriately. As shown in Figure 3A, the recall@k performances for both models decrease as the average number of candidates increases. With more candidates to choose from, correct identification becomes more challenging. In Figure 3B, where MACCS Fingerprints were used to identify the most similar and least similar compounds in the candidate set, recall@k performances are low when candidate molecules are similar with their target molecule.
Ranking on a candidate set using recall@k is widely used for annotation evaluation. Current evaluation datasets (in terms of test molecules and their candidate sets), however, vary tremendously. Our results show that ranking results for both models heavily depend on the candidate set size and the similarity of the candidates to the target molecule, thus highlighting the need for better and consistent evaluation protocols for annotation tools.
4 Conclusion
We investigated several GNN-based models to predict the mass spectra for query molecular structure. Our model outperforms previously reported NN models. Importantly, we found that ranking results are heavily dependent on the candidate set size as well as the similarity of candidate molecules with target molecule. We encourage researchers to standardize performance evaluation for the MS spectra prediction task, and to consider GNN-based methods for annotation.
References
- [1] Oliver Fiehn. Metabolomics – the link between genotypes and phenotypes. Plant Molecular Biology, 48(1):155–171, jan 2002.
- [2] Gary J. Patti, Oscar Yanes, and Gary Siuzdak. Metabolomics: The apogee of the omics trilogy. Nature Reviews Molecular Cell Biology, 13(4):263–269, apr 2012.
- [3] L. M. Raamsdonk, B. Teusink, D. Broadhurst, N. Zhang, A. Hayes, M. C. Walsh, J. A. Berden, K. M. Brindle, D. B. Kell, J. J. Rowland, H. V. Westerhoff, K. van Dam, and S. G. Oliver. A functional genomics strategy that uses metabolome data to reveal the phenotype of silent mutations. Nature Biotechnology, 19(1):45–50, jan 2001.
- [4] Arnald Alonso, Sara Marsal, and Antonio Juli\a‘a. Analytical Methods in Untargeted Metabolomics: State of the Art in 2015. Frontiers in Bioengineering and Biotechnology, 3, mar 2015.
- [5] Naomi L. Kuehnbaum and Philip Britz-McKibbin. New Advances in Separation Science for Metabolomics: Resolving Chemical Diversity in a Post-Genomic Era. Chemical Reviews, 113(4):2437–2468, apr 2013.
- [6] Colin A Smith, Grace O?? Maille, Elizabeth J Want, Chuan Qin, Sunia A Trauger, Theodore R Brandon, Darlene E Custodio, Ruben Abagyan, and Gary Siuzdak. METLIN: A Metabolite Mass Spectral Database. Therapeutic Drug Monitoring, 27(6):747–751, dec 2005.
- [7] David S. Wishart, Dan Tzur, Craig Knox, Roman Eisner, An Chi Guo, Nelson Young, Dean Cheng, Kevin Jewell, David Arndt, Summit Sawhney, Chris Fung, Lisa Nikolai, Mike Lewis, Marie-Aude Coutouly, Ian Forsythe, Peter Tang, Savita Shrivastava, Kevin Jeroncic, Paul Stothard, Godwin Amegbey, David Block, David D. Hau, James Wagner, Jessica Miniaci, Melisa Clements, Mulu Gebremedhin, Natalie Guo, Ying Zhang, Gavin E. Duggan, Glen D. MacInnis, Alim M. Weljie, Reza Dowlatabadi, Fiona Bamforth, Derrick Clive, Russ Greiner, Liang Li, Tom Marrie, Brian D. Sykes, Hans J. Vogel, and Lori Querengesser. HMDB: The Human Metabolome Database. Nucleic Acids Research, 35(suppl_1):D521–D526, jan 2007.
- [8] MassBank: A public repository for sharing mass spectral data for life sciences - Horai - 2010 - Journal of Mass Spectrometry - Wiley Online Library. https://onlinelibrary.wiley.com/doi/full/10.1002/jms.1777.
- [9] Henry Lam, Eric W. Deutsch, James S. Eddes, Jimmy K. Eng, Nichole King, Stephen E. Stein, and Ruedi Aebersold. Development and validation of a spectral library searching method for peptide identification from MS/MS. Proteomics, 7(5):655–667, March 2007.
- [10] Christoph Bueschl, Bernhard Kluger, Marc Lemmens, Gerhard Adam, Gerlinde Wiesenberger, Valentina Maschietto, Adriano Marocco, Joseph Strauss, Stephan Bödi, Gerhard G. Thallinger, Rudolf Krska, and Rainer Schuhmacher. A novel stable isotope labelling assisted workflow for improved untargeted LC–HRMS based metabolomics research. Metabolomics, 10(4):754–769, aug 2014.
- [11] Accurately Predict Mass Spec Fragmentation | ACD/MS Fragmenter. https://www.acdlabs.com/products/adh/ms/ms_frag/.
- [12] Jiarui Zhou, Ralf J. M. Weber, J. William Allwood, Robert Mistrik, Zexuan Zhu, Zhen Ji, Siping Chen, Warwick B. Dunn, Shan He, and Mark R. Viant. HAMMER: Automated operation of mass frontier to construct in silico mass spectral fragmentation libraries. Bioinformatics, 30(4):581–583, feb 2014.
- [13] Sebastian Wolf, Stephan Schmidt, Matthias Müller-Hannemann, and Steffen Neumann. In silico fragmentation for computer assisted identification of metabolite mass spectra. BMC bioinformatics, 11:148, mar 2010.
- [14] Markus Heinonen, Ari Rantanen, Taneli Mielikäinen, Juha Kokkonen, Jari Kiuru, Raimo A. Ketola, and Juho Rousu. FiD: A software for ab initio structural identification of product ions from tandem mass spectrometric data. Rapid Communications in Mass Spectrometry, 22(19):3043–3052, 2008.
- [15] Andr\a’e Wegner, Daniel Weindl, Christian Jäger, Sean C. Sapcariu, Xiangyi Dong, Gregory Stephanopoulos, and Karsten Hiller. Fragment Formula Calculator (FFC): Determination of Chemical Formulas for Fragment Ions in Mass Spectrometric Data. Analytical Chemistry, 86(4):2221–2228, feb 2014.
- [16] Nicola Segata, Jacques Izard, Levi Waldron, Dirk Gevers, Larisa Miropolsky, Wendy S. Garrett, and Curtis Huttenhower. Metagenomic biomarker discovery and explanation. Genome Biology, 12(6):R60, jun 2011.
- [17] Felicity Allen, Allison Pon, Michael Wilson, Russ Greiner, and David Wishart. CFM-ID: A web server for annotation, spectrum prediction and metabolite identification from tandem mass spectra. Nucleic Acids Research, 42(Web Server issue):W94–W99, jul 2014.
- [18] Felicity Allen, Russ Greiner, and David Wishart. Competitive fragmentation modeling of ESI-MS/MS spectra for putative metabolite identification. Metabolomics, 11(1):98–110, feb 2015.
- [19] Kai Dührkop, Huibin Shen, Marvin Meusel, Juho Rousu, and Sebastian Böcker. Searching molecular structure databases with tandem mass spectra using CSI:FingerID. Proceedings of the National Academy of Sciences, øø(41):12580–12585, oct 2015.
- [20] Florian Rasche, Ales Svatos, Ravi Kumar Maddula, Christoph Böttcher, and Sebastian Böcker. Computing fragmentation trees from tandem mass spectrometry data. Analytical Chemistry, 83(4):1243–1251, feb 2011.
- [21] Huibin Shen, Kai Dührkop, Sebastian Böcker, and Juho Rousu. Metabolite identification through multiple kernel learning on fragmentation trees. Bioinformatics (Oxford, England), 30(12):i157–164, jun 2014.
- [22] Jennifer N. Wei, David Belanger, Ryan P. Adams, and D. Sculley. Rapid Prediction of Electron–Ionization Mass Spectrometry Using Neural Networks. ACS Central Science, 5(4):700–708, apr 2019.
- [23] Justin Gilmer, Samuel S. Schoenholz, Patrick F. Riley, Oriol Vinyals, and George E. Dahl. Neural Message Passing for Quantum Chemistry. arXiv:1704.01212 [cs], jun 2017.
- [24] Thomas N. Kipf and Max Welling. Semi-Supervised Classification with Graph Convolutional Networks. arXiv:1609.02907 [cs, stat], feb 2017.
- [25] Petar Veličkovi\a’c, Guillem Cucurull, Arantxa Casanova, Adriana Romero, Pietro Li\a‘o, and Yoshua Bengio. Graph Attention Networks. arXiv:1710.10903 [cs, stat], feb 2018.
- [26] Zonghan Wu, Shirui Pan, Fengwen Chen, Guodong Long, Chengqi Zhang, and Philip S. Yu. A Comprehensive Survey on Graph Neural Networks. IEEE Transactions on Neural Networks and Learning Systems, pages 1–21, 2020.
- [27] Yujia Li, Daniel Tarlow, Marc Brockschmidt, and Richard Zemel. Gated Graph Sequence Neural Networks. arXiv:1511.05493 [cs, stat], sep 2017.
- [28] Yann N. Dauphin, Angela Fan, Michael Auli, and David Grangier. Language Modeling with Gated Convolutional Networks. arXiv:1612.08083 [cs], sep 2017.
- [29] Vinod Nair and Geoffrey E. Hinton. Rectified linear units improve restricted boltzmann machines. In Proceedings of the 27th International Conference on International Conference on Machine Learning, ICML’10, page 807–814, Madison, WI, USA, 2010. Omnipress.
- [30] Diederik P. Kingma and Jimmy Ba. Adam: A Method for Stochastic Optimization. arXiv:1412.6980 [cs], jan 2017.