Gini in a Bottleneck: Sparse Molecular Representations for Graph Convolutional Neural Networks
Abstract
Due to the nature of deep learning approaches, it is inherently difficult to understand which aspects of a molecular graph drive the predictions of the network. As a mitigation strategy, we constrain certain weights in a multi-task graph convolutional neural network according to the Gini index to maximize the “inequality” of the learned representations. We show that this constraint does not degrade evaluation metrics for some targets, and allows us to combine the outputs of the graph convolutional operation in a visually interpretable way. We then perform a proof-of-concept experiment on quantum chemistry targets on the public QM9 dataset, and a larger experiment on ADMET targets on proprietary drug-like molecules. Since a benchmark of explainability in the latter case is difficult, we informally surveyed medicinal chemists within our organization to check for agreement between regions of the molecule they and the model identified as relevant to the properties in question.
1 Introduction
Multi-task graph convolutional neural networks (GCNs) have become competitive in predicting some molecular properties e.g. for drug screening [4, 9]. However, their opaque nature remains a stumbling block for wider adoption within the chemistry community. While several approaches exist for rationalizing the predictions of GCNs applied to molecular problems [1, 11, 18], we take a somewhat orthogonal approach and introduce a bottleneck in the training itself.
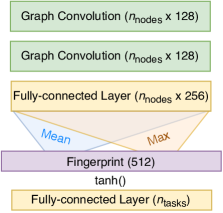
A typical architecture (see Figure 1(a)) converts the final node-level aggregations or “fingerprint” into the chemical targets of interest with a linear layer. In this work, we introduce a regularizer on the weights of this layer to enforce sparsity in the hopes that this will reduce the number of relevant node-level aggregations necessary to inspect to explain a model’s prediction. The usual or regularization is not appropriate here, as penalizing the magnitude of the weights directly damages the performance of regression metrics. Instead, we borrow from economics and use the Gini coefficient [7, 15] as a regularizer:
| (1) |
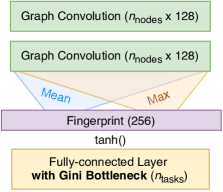
where range over all weights in the layer. The Gini coefficient ranges from zero to one: zero if all are equal and one if one is non-zero and the rest zero. Since weights of a linear transform are not necessarily restricted to be non-negative, we will always use rather than in our calculations. The training loss becomes where is the multi-task regression loss, and is a hyperparameter to tune the effect of the Gini regularization. These changes are illustrated in Figure 1(b).
2 Experiment Setup
Graph Convolutional Neural Network
We use molecular fingerprint convolutions [3] in all our network architectures and the QM9 dataset [12, 14] for training. We use the GCN multitask architecture given by [9] but with multitask targets adjusted for the QM9 dataset and a smaller featurization given in [6]. Since max and mean aggregations are applied to the node representations and concatenated to generate the molecular fingerprint, we apply separate Gini regularizers to weights of the output layer which operate on each aggregation. Though we are benchmarking against the Deepchem implementation [16, 13], we have implemented everything with Pytorch Geometric [5].
Quantum Electronic Structure Calculations
To verify that the representations selected by our model have chemical relevance, we wish to compare them to some visual representation on the molecule. We chose the highest- and lowest-occupied molecular orbitals (HOMO and LUMO) as their energies are included as targets in QM9. Since the HOMO and LUMO electron densities have more complex spatial structures than node representations generated by molecular convolutions, which are limited to one real number per atomic site, we opt to compute the condensed Fukui function[10, 17]. The Fukui function gives the change in electronic population at the site for the removal or addition of one electron to the molecule:
| (2) |
| (3) |
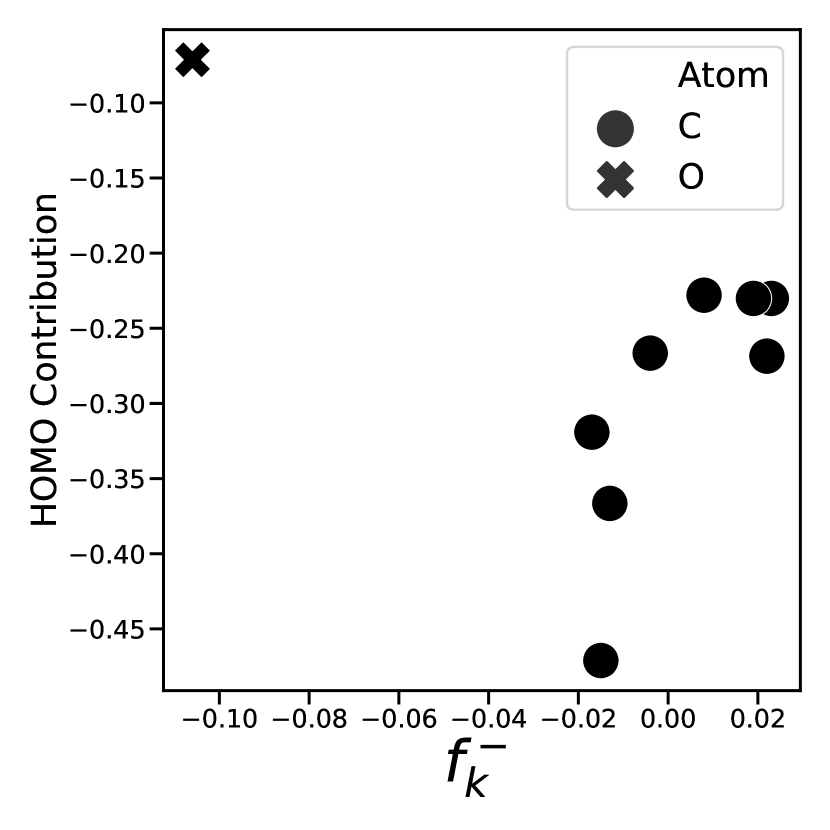
The and can be regarded as the relative nucleophilicity and electrophilicity of each site, respectively. Intuitively, sites with high nucleophilicity correspond to electron population in the HOMO, whereas sites with high electrophilicity correspond to electron population in the LUMO (if an electron were added to the molecule). We propose, therefore, that interpretable learned convolutional representations of the HOMO and LUMO will correspond to and , respectively. The xtb [2] package is used to calculate the Fukui functions.
3 Results
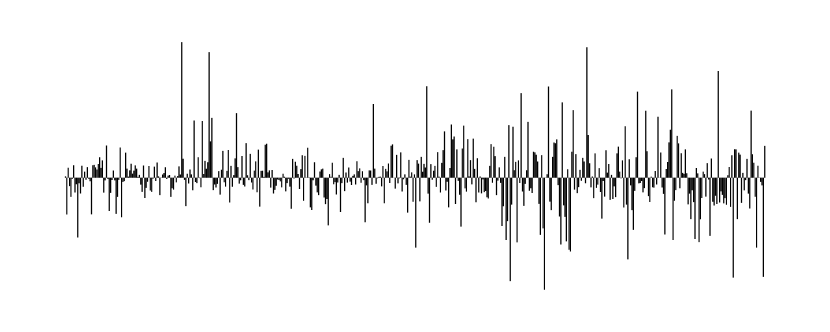
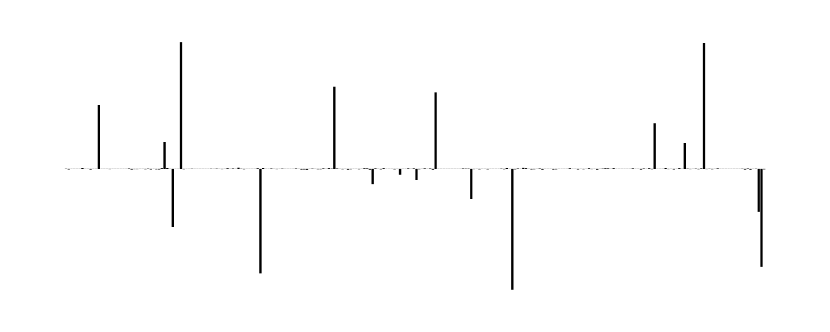
Our reported results (Table 1) are the mean of random 5-fold cross-validation. HOMO and LUMO energy errors are stable across architectures, while other targets suffer some performance degradation from the multi-task setting and introduction of the Gini bottleneck. The effect of the Gini bottleneck on the weights of the final linear layer is depicted in Figure 2.
| Target | Units | MTGCN Baseline | MTGCN Explainable | Single task GCN [16] |
|---|---|---|---|---|
| (this work) | (this work) | |||
| Debye | 0.615 | 0.604 | 0.583 | |
| Bohr3 | 1.961 | 2.567 | 1.370 | |
| HOMO | Hartree | 0.00609 | 0.00606 | 0.00716 |
| LUMO | Hartree | 0.00681 | 0.00716 | 0.00921 |
| delta | Hartree | 0.00896 | 0.00913 | 0.01120 |
| R2 | Bohr2 | 81.8 | 95.4 | 35.9 |
| ZPVE | Hartree | 0.00409 | 0.00538 | 0.00299 |
| Hartree | 10.544 | 13.077 | 3.410 | |
| cal/mol | 0.846 | 1.112 | 0.650 |
HOMO and LUMO
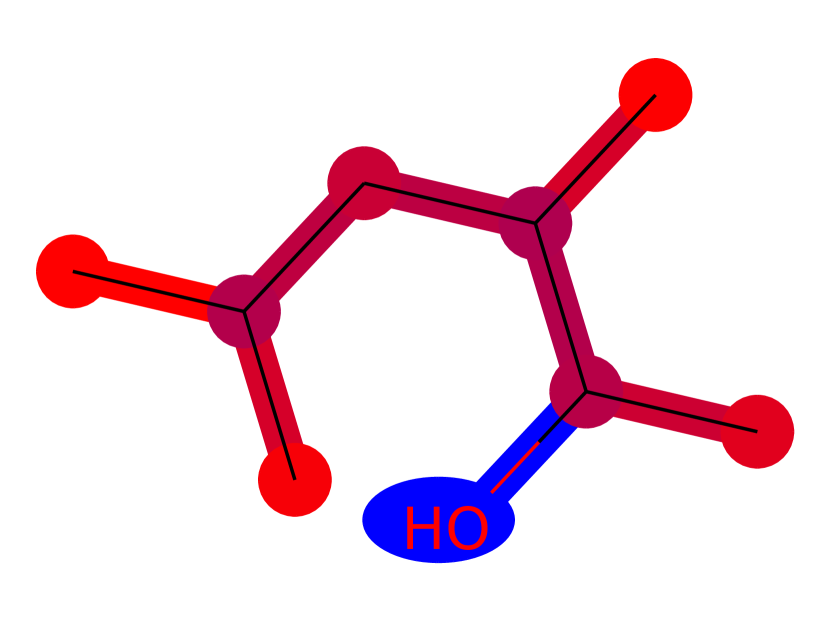
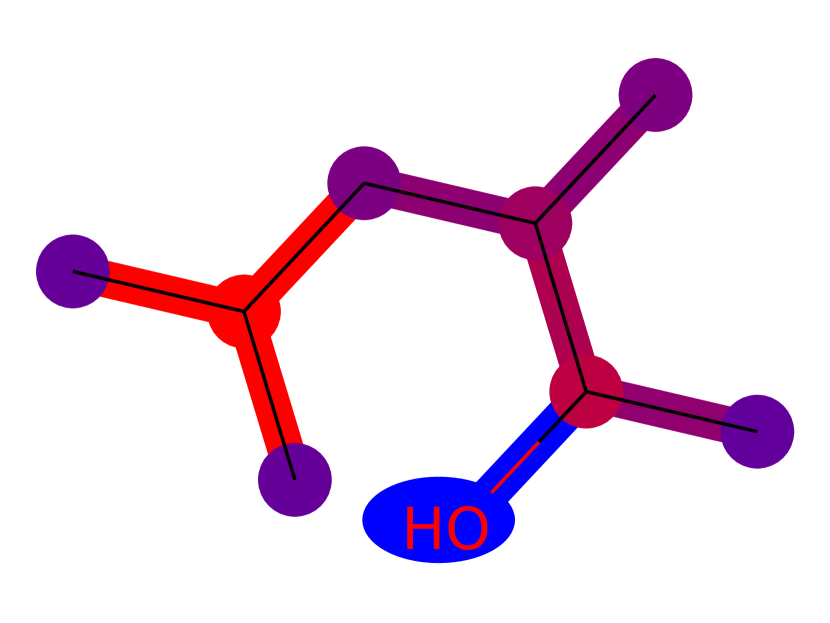
Since we have removed the intermediate fully-connected layer in the explainable architecture (Figure 1(b)), each weight (Figure 2(b)) corresponds to the mean or max of a learned convolutional node-level representation. These representations are sparse enough to be considered individually, but for brevity’s sake we will combine them into one picture as a contribution-weighted linear combination of all node outputs (mean) or maximum node output (max) from the last graph convolutional layer. The contribution to the final prediction is , where is a weight in the last fully-connected layer corresponding to the th endpoint and th node representation, . is max or mean. Figure 3 shows how the contribution-weighted sum of the node representations compare with the Fukui function for an example molecule from the QM9 dataset.
Survey of Medicinal chemists
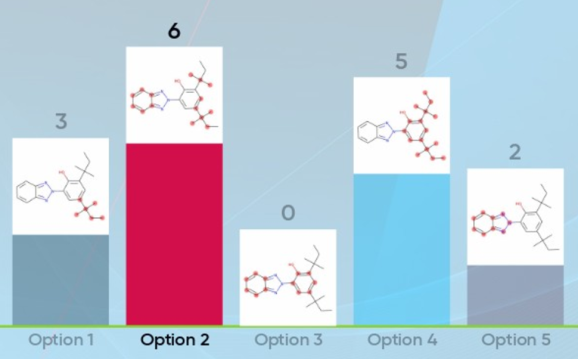
While the results on the QM9 dataset are encouraging, the molecules are not drug-like and the given targets reflect that. We retrained our model on a corpus of drug-like molecules [9] with measured targets of interest to medicinal chemists [8]. Since the model had reasonable performance (similar to what is reported in [9]), we were confident we could generate good rationalizations of the various properties as in the previous section. We presented a few unseen examples to chemists within our organization in an interactive presentation with atomic contributions highlighted as in Figure 3, along with a few random but plausible alternatives. See Figure 4(a) for an example question. Agreement between the audience and the explainable model is summarized in Table 4(b).
| Top 1 | Top 2 | |||
|---|---|---|---|---|
| HSA Binding | 6 | 17.3 | 0.67 | 1.00 |
| Melting Point | 2 | 15.5 | 0.00 | 0.50 |
| Membrane affinity | 3 | 9.0 | 0.33 | 1.00 |
| Solubility | 10 | 18.7 | 0.30 | 0.70 |
4 Conclusions & Future Work
We demonstrated a new method for reducing the number of relevant learned representations for a regression target in a multi-task graph neural network. We further show that this constraint can be applied in some cases without degrading the model performance, and that the remaining representations are qualitatively connected to the predicted property.
In the future we want to combine this sparsity with orthogonalization techniques to make sure the relevant learned representations are not only few, but mutually informative. We will further explore how best to combine the representations into actionable rationalizations, and continue to query practicing chemists on the usefulness of the generated rationalizations.
Acknowledgments and Disclosure of Funding
We would like to thank Andreas Goeller for suggesting the use of Fukui functions. Funding in direct support of this work: Bayer AG Life Science Collaboration (“Explainable AI”).
References
- [1] Federico Baldassarre and Hossein Azizpour. Explainability Techniques for Graph Convolutional Networks. arXiv:1905.13686 [cs, stat], May 2019. arXiv: 1905.13686.
- [2] Christoph Bannwarth, Eike Caldeweyher, Sebastian Ehlert, Andreas Hansen, Philipp Pracht, Jakob Seibert, Sebastian Spicher, and Stefan Grimme. Extended tight-binding quantum chemistry methods. WIREs Computational Molecular Science, August 2020.
- [3] David Duvenaud, Dougal Maclaurin, Jorge Aguilera-Iparraguirre, Rafael Gómez-Bombarelli, Timothy Hirzel, Alán Aspuru-Guzik, and Ryan P. Adams. Convolutional Networks on Graphs for Learning Molecular Fingerprints. arXiv:1509.09292v2 [cs.LG], September 2015. arXiv: 1509.09292v2.
- [4] Evan N. Feinberg, Debnil Sur, Zhenqin Wu, Brooke E. Husic, Huanghao Mai, Yang Li, Saisai Sun, Jianyi Yang, Bharath Ramsundar, and Vijay S. Pande. PotentialNet for Molecular Property Prediction. ACS Central Science, 4(11):1520–1530, November 2018. Publisher: American Chemical Society.
- [5] Matthias Fey and Jan Eric Lenssen. Fast Graph Representation Learning with PyTorch Geometric. arXiv:1903.02428 [cs, stat], April 2019. arXiv: 1903.02428.
- [6] Justin Gilmer, Samuel S. Schoenholz, Patrick F. Riley, Oriol Vinyals, and George E. Dahl. Neural Message Passing for Quantum Chemistry. arXiv:1704.01212 [cs], June 2017. arXiv: 1704.01212.
- [7] C Gini. Variabilità e Mutuabilità . Contributo allo Studio delle Distribuzioni e delle Relazioni Statistiche . C. Cuppini, Bologna, 1912.
- [8] Christian Kramer, Attilla Ting, Hao Zheng, Jérôme Hert, Torsten Schindler, Martin Stahl, Graeme Robb, James J. Crawford, Jeff Blaney, Shane Montague, Andrew G. Leach, Al G. Dossetter, and Ed J. Griffen. Learning Medicinal Chemistry Absorption, Distribution, Metabolism, Excretion, and Toxicity (ADMET) Rules from Cross-Company Matched Molecular Pairs Analysis (MMPA): Miniperspective. Journal of Medicinal Chemistry, 61(8):3277–3292, April 2018.
- [9] Floriane Montanari, Lara Kuhnke, Antonius Ter Laak, and Djork-Arné Clevert. Modeling Physico - Chemical ADMET Endpoints with Multitask Graph Convolutional Networks. Molecules, 25(1):44, December 2019.
- [10] Robert G. Parr and Weitao Yang. Density-functional theory of atoms and molecules. Number 16 in International series of monographs on chemistry. Oxford Univ. Press [u.a.], New York, NY, 1. iss. as … paperback edition, 1994. OCLC: 832732716.
- [11] Kristina Preuer, Günter Klambauer, Friedrich Rippmann, Sepp Hochreiter, and Thomas Unterthiner. Interpretable Deep Learning in Drug Discovery. arXiv:1903.02788 [cs, q-bio, stat], March 2019. arXiv: 1903.02788.
- [12] Raghunathan Ramakrishnan, Pavlo O. Dral, Matthias Rupp, and O. Anatole von Lilienfeld. Quantum chemistry structures and properties of 134 kilo molecules. Scientific Data, 1(1):140022, December 2014.
- [13] Bharath Ramsundar, Peter Eastman, Patrick Walters, and Vijay Pande. Deep learning for the life sciences: applying deep learning to genomics, microscopy, drug discovery and more. O’Reilly Media, Sebastopol, CA, first edition edition, 2019. OCLC: on1051083869.
- [14] Lars Ruddigkeit, Ruud van Deursen, Lorenz C. Blum, and Jean-Louis Reymond. Enumeration of 166 Billion Organic Small Molecules in the Chemical Universe Database GDB -17. Journal of Chemical Information and Modeling, 52(11):2864–2875, November 2012.
- [15] Wikipedia contributors. Gini coefficient — Wikipedia, the free encyclopedia. https://en.wikipedia.org/w/index.php?title=Gini_coefficient&oldid=974584849, 2020. [Online; accessed 7-October-2020].
- [16] Zhenqin Wu, Bharath Ramsundar, Evan N. Feinberg, Joseph Gomes, Caleb Geniesse, Aneesh S. Pappu, Karl Leswing, and Vijay Pande. MoleculeNet : A Benchmark for Molecular Machine Learning. arXiv:1703.00564 [physics, stat], October 2018. arXiv: 1703.00564.
- [17] Weitao. Yang and Wilfried J. Mortier. The use of global and local molecular parameters for the analysis of the gas-phase basicity of amines. Journal of the American Chemical Society, 108(19):5708–5711, September 1986.
- [18] Rex Ying, Dylan Bourgeois, Jiaxuan You, Marinka Zitnik, and Jure Leskovec. GNNExplainer: Generating Explanations for Graph Neural Networks. arXiv:1903.03894 [cs, stat], November 2019. arXiv: 1903.03894.