Coordinated Assembly of Galaxy Groups and Clusters in the IllustrisTNG Simulations
Abstract
Recent stellar population analysis of early-type galaxy spectra has demonstrated that the low-mass galaxies in cluster centers have high [] and old ages characteristic of massive galaxies and unlike the low-mass galaxy population in the outskirts of clusters and fields. This phenomenon has been termed “coordinated assembly” to highlight the fact that the building blocks of massive cluster central galaxies are drawn from a special subset of the overall low-mass galaxy population. Here we explore this idea in the IllustrisTNG simulations, particularly the TNG300 run, in order to understand how environment, especially cluster centers, shape the star formation histories of quiescent satellite galaxies in groups and clusters (). Tracing histories of quenched satellite galaxies with , we find that those in more massive dark matter halos, and located closer to the primary galaxies, are quenched earlier, have shorter star formation timescales, and older stellar ages. The star formation timescale- and stellar age- scaling relations are in good agreement with observations, and are predicted to vary with halo mass and cluster-centric distance. The dependence on environment arises due to the infall histories of satellite galaxies: galaxies that are located closer to cluster centers in more massive dark matter halos at were accreted earlier on average. The delay between infall and quenching time is shorter for galaxies in more massive halos, and depends on the halo mass at its first accretion, showing that group pre-processing is a crucial aspect in satellite quenching.
Subject headings:
methods: numerical — galaxies: clusters: general — galaxies: groups: general — galaxies: formation — galaxies: evolution — galaxies: halos1. Introduction
Recent observations and simulations provide us an increasingly clear picture of the build-up of massive early type galaxies (ETGs) (Naab et al., 2009; Oser et al., 2010, 2012; van Dokkum et al., 2010; Patel et al., 2013). At high-, strong dissipational processes such as gas accretion and gas rich mergers lead to rapid star formation, while at lower redshifts the accretion of low-mass systems dominate their growth. The disrupted low-mass galaxies are predicted to leave their imprint, such as stellar population information, on massive galaxies, especially in their outer envelopes (Di Matteo et al., 2009; Cook et al., 2016). Meanwhile, observations of nearby ETGs reveal scaling relations between their stellar mass and stellar populations, e.g., stellar metallicity, stellar age, -abundance (Trager et al., 2000; Thomas et al., 2005; Conroy et al., 2014). Whether the building blocks of massive galaxies are intrinsically the same as the low-mass galaxies we observe today is still in debate.
In a recent paper, Gu et al. (2018), we described the “Coordinated Assembly” picture of massive galaxies using observations of an ongoing brightest cluster galaxy (BCG) assembly in Abell 3827. We found that the ETGs in the central regions of the galaxy cluster do not follow the []- and age- trends established by the general ETG sample, but instead obey much shallower relations. Our work indicates that the building blocks of massive galaxies in this special environment are different from the overall ETG population. As a result, massive central galaxies grow by accreting preferentially high [] and old stellar systems. The flat age and [] radial profiles confirm that the disrupted systems should be old and -enhanced.
This picture highlights the role that environment has on galaxy quenching (Peng et al., 2010, 2012; Wetzel et al., 2013, 2014): ETGs in the central region of galaxy clusters have ceased their star formation activity earlier than their counterparts elsewhere. Galaxy quenching could be due to multiple physical mechanisms, including strangulation (Larson et al., 1980; Balogh et al., 2000), ram-pressure stripping (Gunn & Gott, 1972; Abadi et al., 1999), harassment (Farouki & Shapiro, 1981; Moore et al., 1996), etc. These processes preferentially occur when a galaxy falls into a high density environment, but the details about how these mechanisms depend on environment, e.g., halo mass or local over-density, is still ambiguous.
Comparing observations with cosmological hydro-dynamical simulations grants us access to a more complete history about how those galaxies form in different environments, and allows us to explore the coordinated assembly picture in detail. The IllustrisTNG suites are state-of-the-art hydrodynamical simulations that include a large population of massive galaxy clusters (Springel et al., 2018; Pillepich et al., 2018, 2019; Naiman et al., 2018; Marinacci et al., 2018; Nelson et al., 2018, 2019b, 2019a), and allows us to trace the life stories of a statistical sample of massive galaxies and their surrounding satellite galaxies in groups and clusters. In this paper, we focus on quenched satellite galaxies. The contribution from star forming satellite galaxies, although they may be the minority in clusters, also depends on environment (Donnari et al., 2020). By directly analyzing the star formation, quenching, and assembly histories of ETGs in IllustrisTNG, we address the following questions: Does the coordinated assembly picture hold in IllustrisTNG? Are the relevant scaling relations consistent with observations? What is the possible explanation for the coordinated assembly picture?
In this Letter, we briefly review how we make use of the simulations in Section 2, and present the results, including the environmental dependence, and comparison with observations in Section 3. We discuss the importance of group pre-processing as well before summarizing our conclusions in Section 4.
2. Methods
The IllustrisTNG suite is a set of cosmological gravo-magneto-hydrodynamical simulations (Springel et al., 2018; Pillepich et al., 2018, 2019; Naiman et al., 2018; Marinacci et al., 2018; Nelson et al., 2018, 2019b, 2019a), based on the original Illustris simulations (Genel et al., 2014; Vogelsberger et al., 2014a, b). Significant improvements in the galaxy formation model provide a more realistic prediction of galaxy evolution. The galaxies are more consistent with observations in terms of galaxy sizes and morphological types, star formation stellar contents, etc (e.g. Pillepich et al., 2018; Nelson et al., 2018; Genel et al., 2018; Rodriguez-Gomez et al., 2019; Diemer et al., 2017; Donnari et al., 2019). The IllustrisTNG simulations adopt the CDM cosmology with parameters from Planck Collaboration et al. (2016): , , , , and . It includes three different cosmological volumes. In this Letter, we focus on the TNG300 run, the run of the IllustrisTNG simulations with the largest box with a side length of about 300 Mpc. The mass resolution of the TNG300 simulation is for dark matter and for baryons. The combination between the simulated volume and resolution makes this run an ideal one for studying the formation and assembly histories of the massive galaxies and their satellites in clusters.
We make use of the halos and subhalos identified by the
friends-of-friends (FOF) (Davis et al., 1985) and SUBFIND
(Springel et al., 2001; Dolag et al., 2009) algorithms, and merger trees
generated by the SUBLINK algorithm (Rodriguez-Gomez et al., 2015).
Throughout this work, We focus on groups and clusters with
. There are 3733 such dark matter halos at
up to a cluster of , each modeled with dark matter, gas,
stars, magnetic fields and SMBHs. The stellar mass of a galaxy refers to the
total stellar mass of all stellar particles within kpc. We employ only
the well-resolved galaxies so the minimum stellar mass in our sample
is . We focus on quiescent galaxies in this work, and select
galaxies with a specific star-formation rate (sSFR) less than
yr-1 at , and only satellite galaxies, excluding
primary galaxies in our sample. The satellite galaxies in this work are all those
within parent FOF groups above the mass threshold, including those located
outside . There are , and quiescent satellite
galaxies with in halos with more than
, and , respectively.
We calculate the quenching time, star formation timescale, and the accretion
time by tracing the main progenitors of galaxies selected at back in
time. Specifically, we calculate the time since quenching as the time since
a galaxy’s sSFR last fell and remained below /yr. We define
the time since accretion as the time since a satellite galaxy
initially fell within of its host dark matter halo. The star formation
timescale is calculated using stars formed in-situ, as in
Rodriguez-Gomez et al. (2016). The star formation timescale refers to half
of the time it takes for the galaxy to form between and of
its in-situ stars. The stellar ages in this work refer to the mass-weighted
stellar ages within kpc from the galaxy center.
3. Results and Discussion
3.1. Dependence on Halo Mass and Cluster-centric Distance
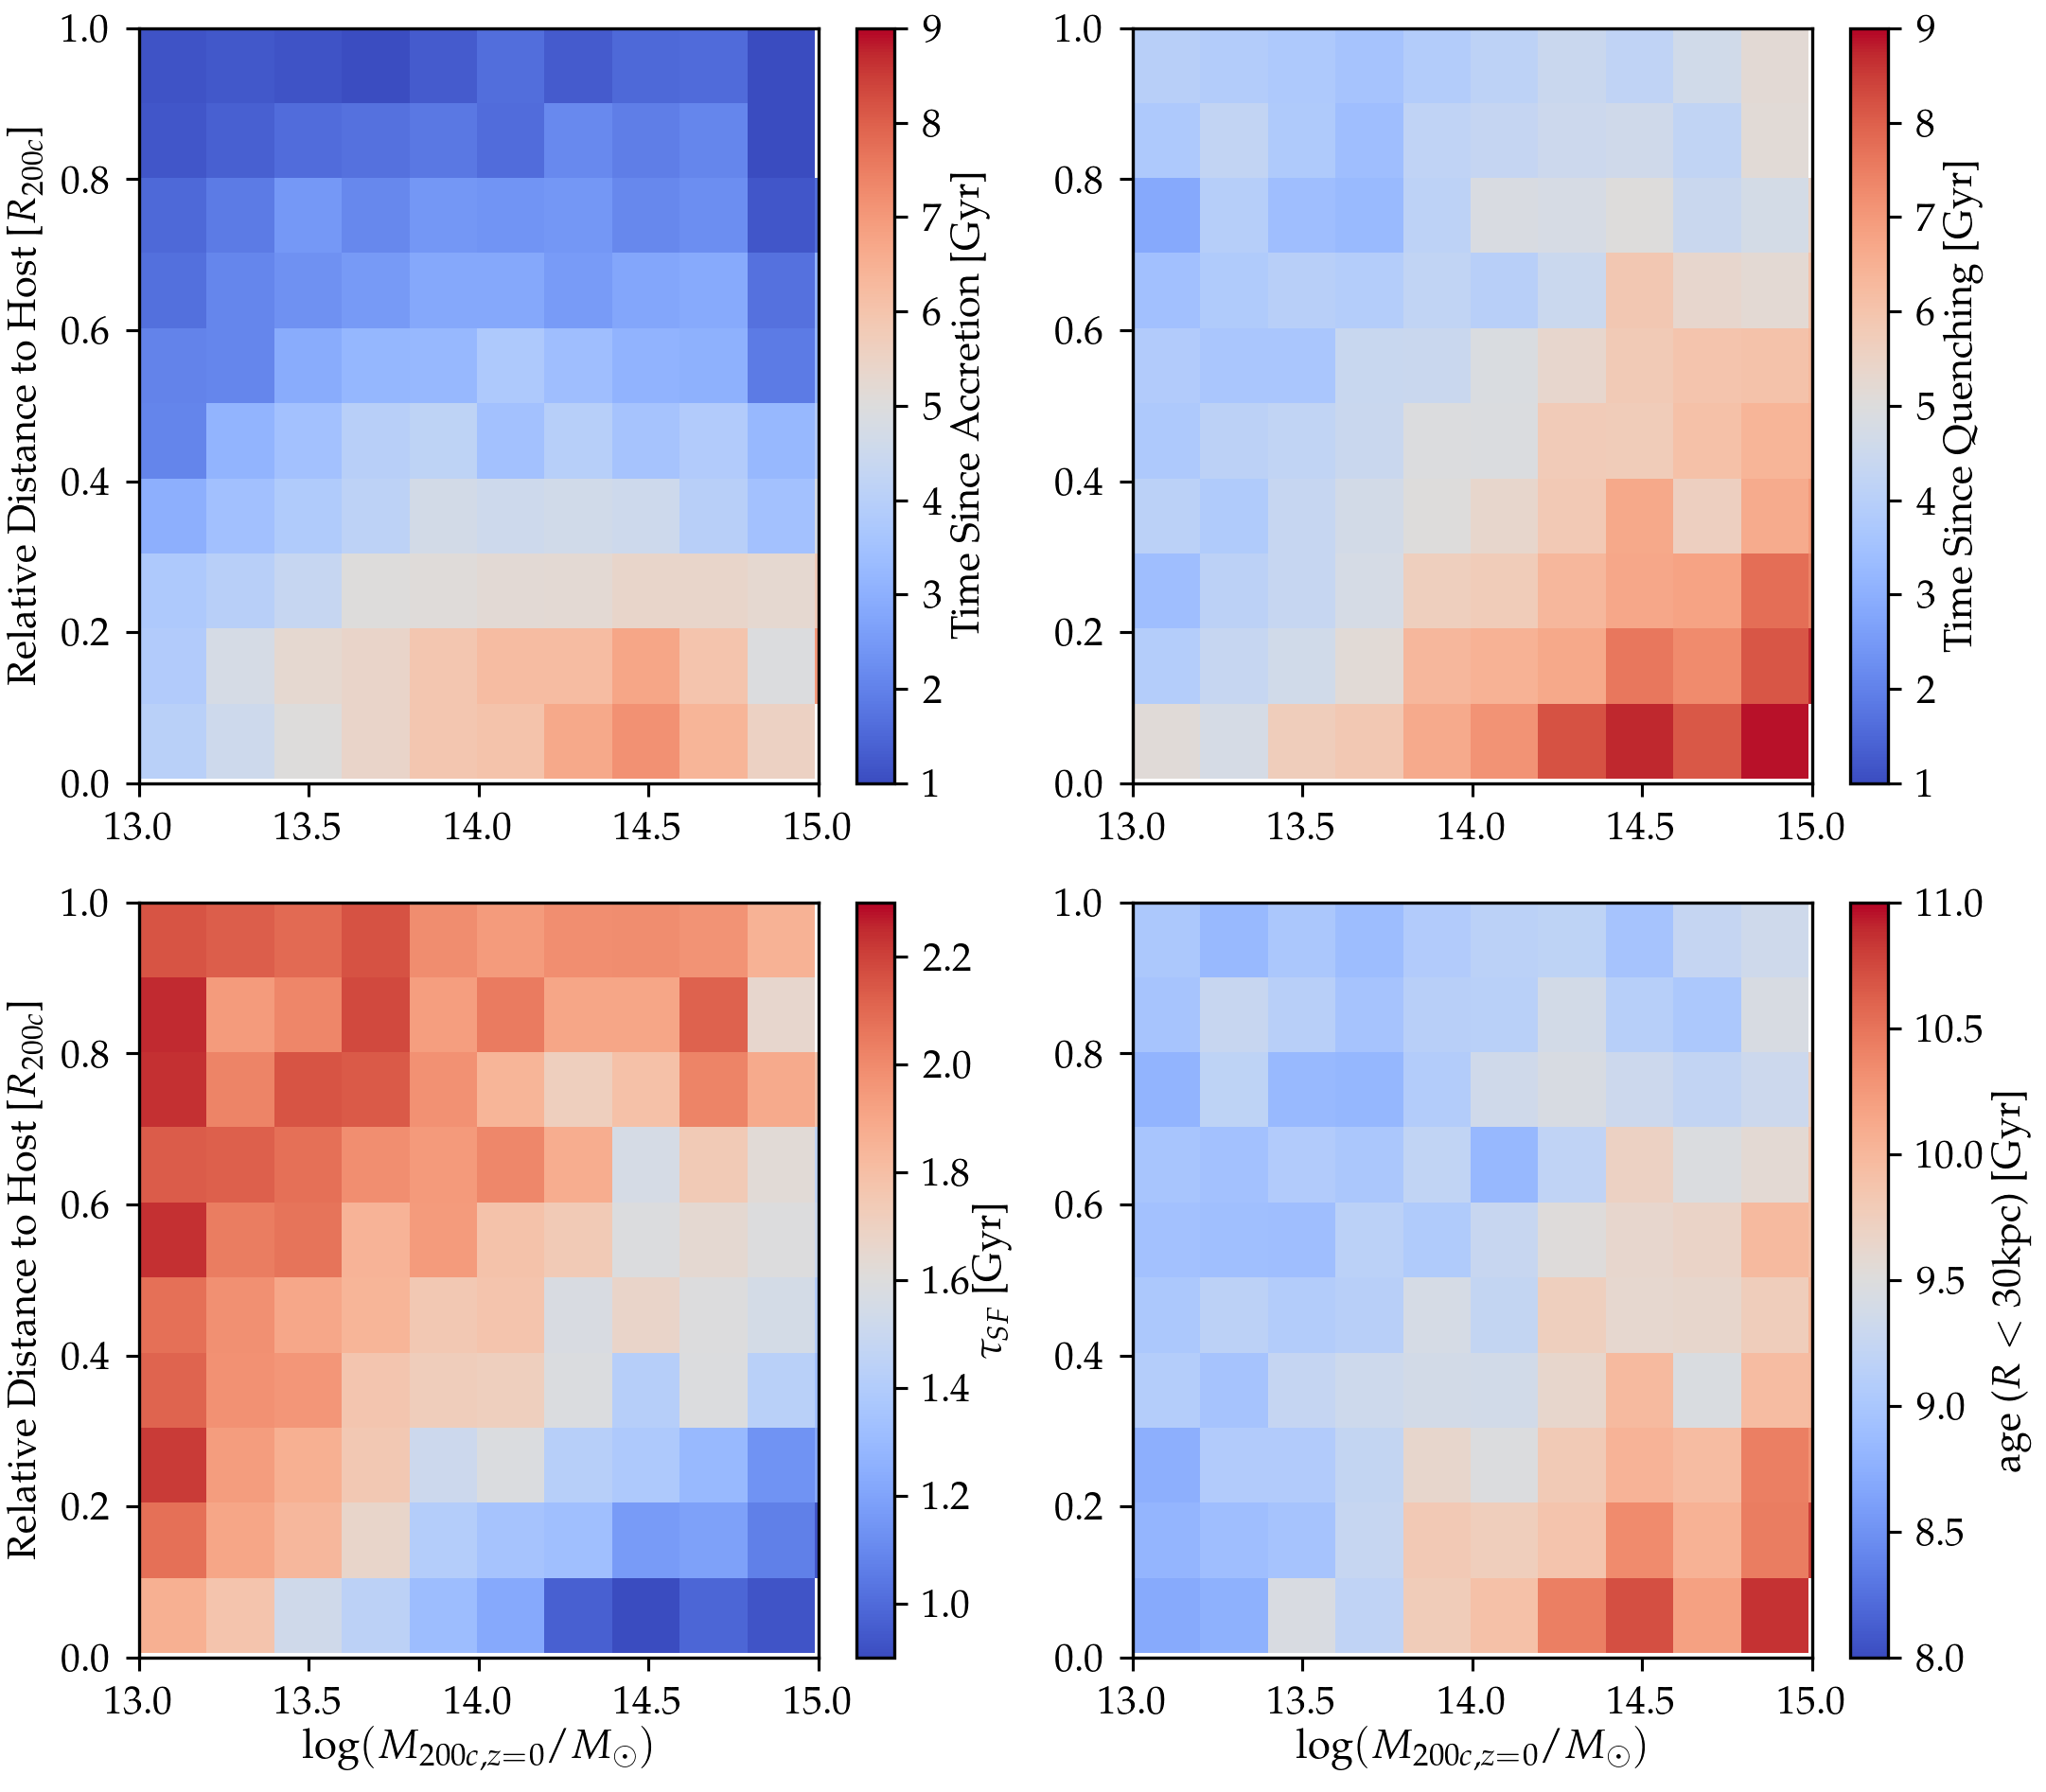
Figure 1 shows the coordinated assembly signal in the TNG300 simulation. Specifically, the panels show the dependence on environment. We focus on quenched satellite galaxies in a small stellar mass range at , , and show their accretion time (top left), their quenching time (top right), the star formation timescale (bottom left) and their mass-weighted stellar age (bottom right) in this figure. The color-maps show the mean values of these parameters as a function of both the 3D cluster-centric distance at in bins, and their host halo mass () in dex bins. The figure reveals a strong dependence on environment for all four parameters. From the top two panels, in general, quenched satellite galaxies that live in more massive halos and are located closer to the central galaxies are accreted to earlier and quenched earlier, possibly because an early accretion means they may get the chance to experience all the quenching mechanisms earlier and/or longer than their counterparts. In fact, as shown in Rhee et al. (2017), satellites at small cluster-centric distances have accreted earlier. Those located at in massive clusters () at are accreted Gyr ago and quenched Gyr ago, while those at in low mass dark matter halos () are only accreted and quenched Gyr ago. Looking at the most massive bins with the smallest cluster-centric distance, the trend of time since accretion does not peak in the most massive halo mass bin. There are several reasons for this: 1. the fraction of pre-processed galaxies (which will be discussed in Section 3.3) increases with increasing mass of the final host halos. 2. On average, satellite galaxies that have been pre-processed are accreted into the final host halos at a later time than their direct infall counterparts. 3. For satellite galaxies that have been pre-processed, those in a more massive host halos at on average have a later accretion time into their final host halos. This 3rd point is not statistically strong though, and we need more data to verify it.
From the color-maps of star formation timescales and stellar ages, galaxies in more massive halos and those located closer to the central galaxies are formed earlier and cease star formation more abruptly. This is consistent with the coordinated assembly picture revealed by observational stellar population analysis: galaxies in the central regions of massive clusters have high [] and old stellar ages. As a result, the most massive galaxies in the centers of the most massive dark matter halos will only get the chance to merge with those satellite galaxies that have old stellar ages, earlier quenching histories, and short star formation timescales. The assembled galaxies will imprint their stellar populations in the outskirts of massive galaxies, and this result can be examined by observational radial profiles of [] and stellar ages.
3.2. Ages and Star Formation Histories
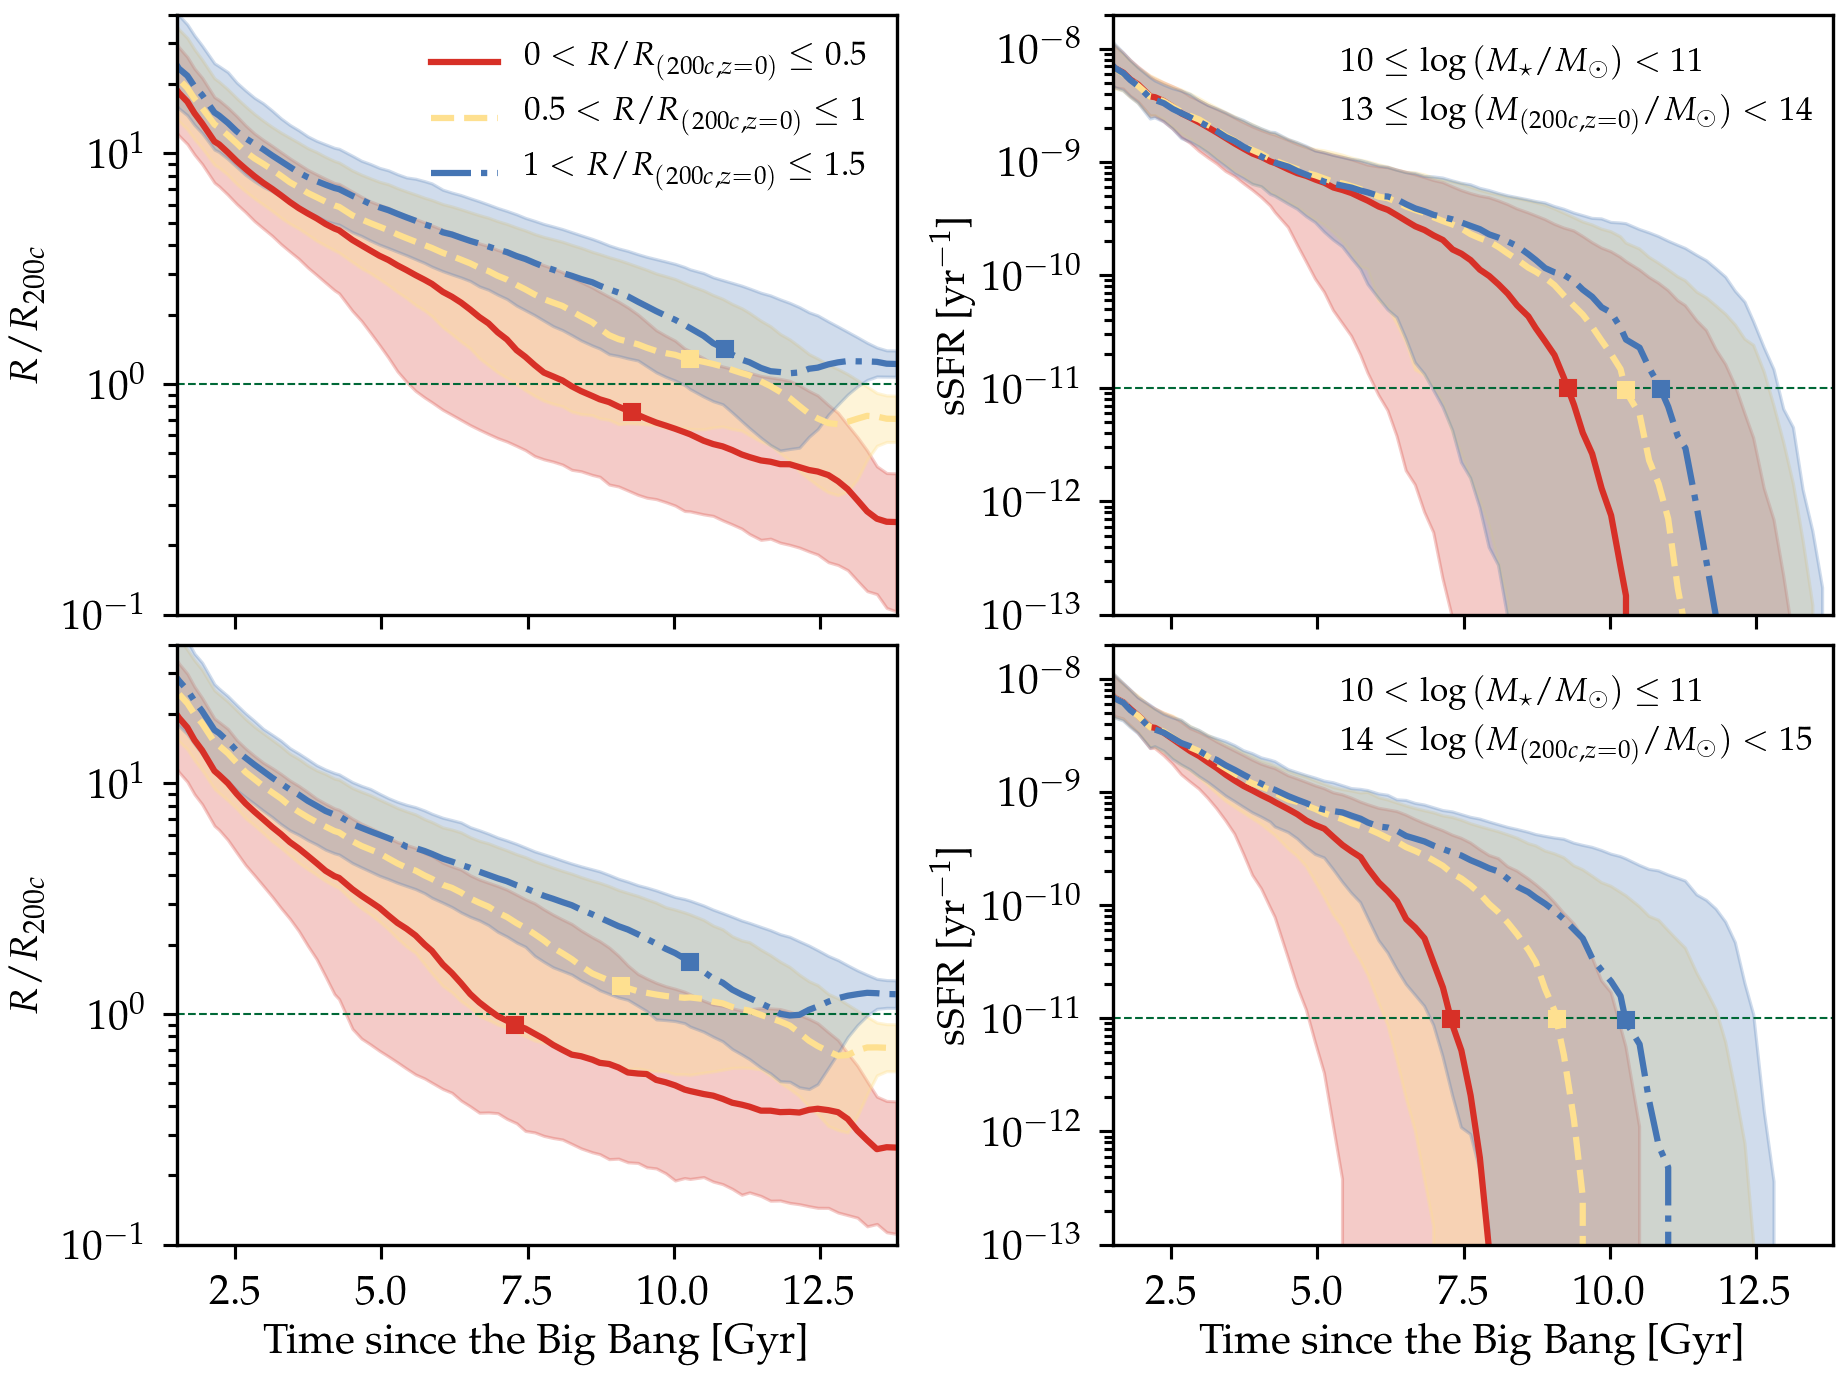
In Figure 2 we show the evolution of the quenched satellite galaxies in different environment. We focus on galaxies with . The top two panels show their accretion histories and evolution of sSFR in groups (), and the bottom panels show the evolution in clusters (). Galaxies are grouped by their relative cluster-centric distance at into 3 bins: (red), (orange) and (blue). Squares mark the average time that galaxies are quenched. As shown in Figure 2, in both group and cluster environments, galaxies that are located closer to the primary galaxies have earlier accretion histories. Their sSFR falls faster and they are quenched earlier on average. Comparing galaxies with similar relative cluster-centric distances in group and cluster environments reveals that those in clusters have earlier accretion and quenching histories. Some galaxies are quenched even before they enter the of their final host dark matter halos, indicating that their gas has been stripped before entering their final host dark matter halos or pre-processed in smaller groups.
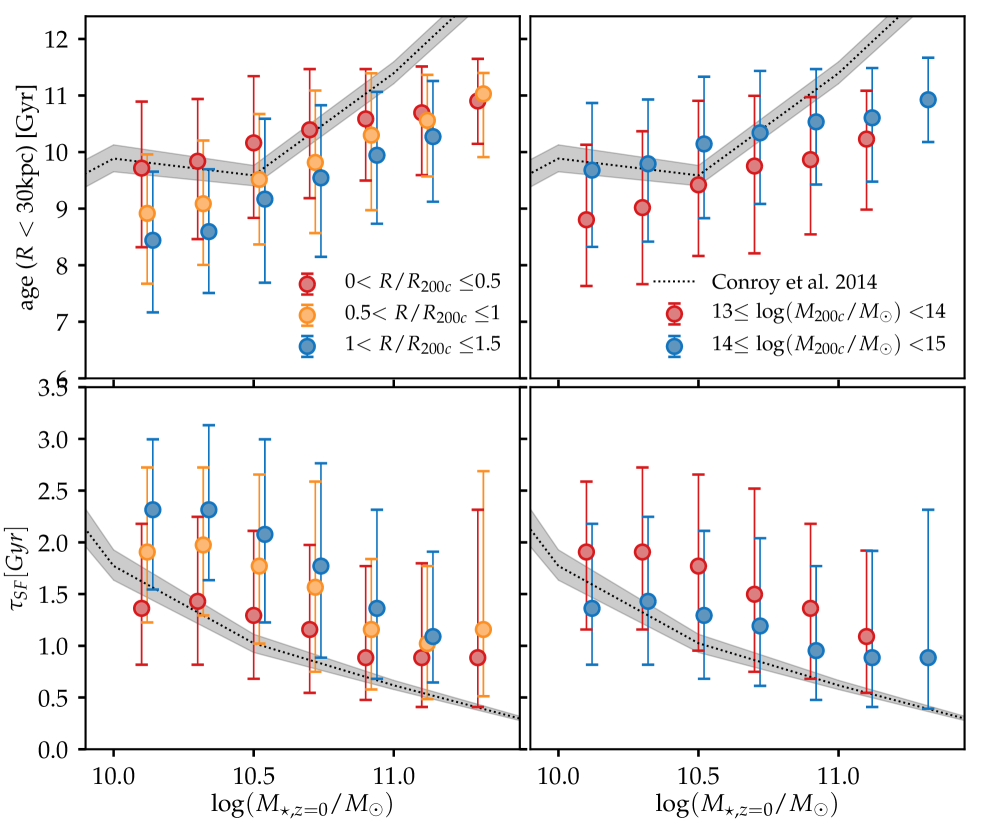
In Figure 3, we compare the - and stellar age- scaling relations of the TNG300 quiescent galaxies with observed quiescent galaxies. Black dotted lines and the corresponding gray regions show observational results of stellar age and star formation timescale (th, th and th percentiles) based on stacked SDSS early-type galaxies (ETGs) that are binned in stellar mass (Conroy et al., 2014). The stacked spectra are fit with the upgraded response functions. The star formation timescales are estimated using [] of these stacked ETGs, and the conversion between [] and star formation timescale based on a simple chemical evolution model in Thomas et al. 1999, 2005: . We examine how these scaling relations depend on cluster-centric distance (left panes, focusing on ) and halo mass (right panels, focusing on ) using TNG300 galaxies. The trends are calculated in 0.2 dex bins of . Only bins including more than 25 galaxies are shown in the figure. The overall trends followed by TNG300 quiescent galaxies are in good agreement with observations. In both previous observations and this work, more massive galaxies are older and have short star formation timescales. More importantly, the TNG300 simulations predict strong variation in different environments: galaxies in the central regions and in more massive halos have shallower - and stellar age- relations, indicating that in special environments, such as the central regions of galaxy clusters, even the relatively low mass galaxies have old stellar ages, and short star formation timescales in the past. This is consistent with the coordinated assembly picture.
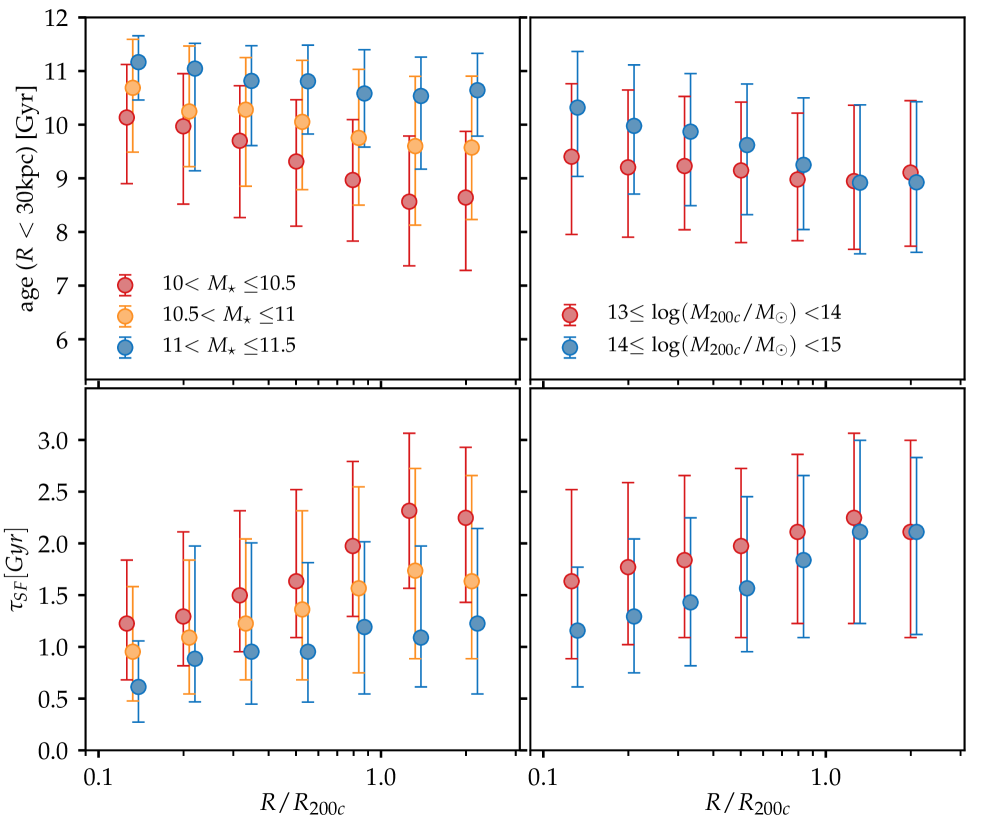
Figure 4 shows the stellar ages and star formation timescales of quenched satellite galaxies as a function of relative cluster-centric distance in different environments. We focus on galaxies in in the left panels, and galaxies with in the right panels. The general trends are: satellite galaxies located further away from the primary galaxies are younger, and have longer star formation timescales in the past. From the left panels, the dependence on cluster-centric distance is more robust for low mass galaxies. The left panels also predict that for galaxies in clusters with similar mass, the relation between stellar age and/or [] and cluster-centric distance may have larger scatter towards the outskirts of galaxy clusters. From the right panels, galaxies in more massive dark matter halos are older and on average formed faster in the past, but this effect is only strong within .
3.3. Group Pre-processing
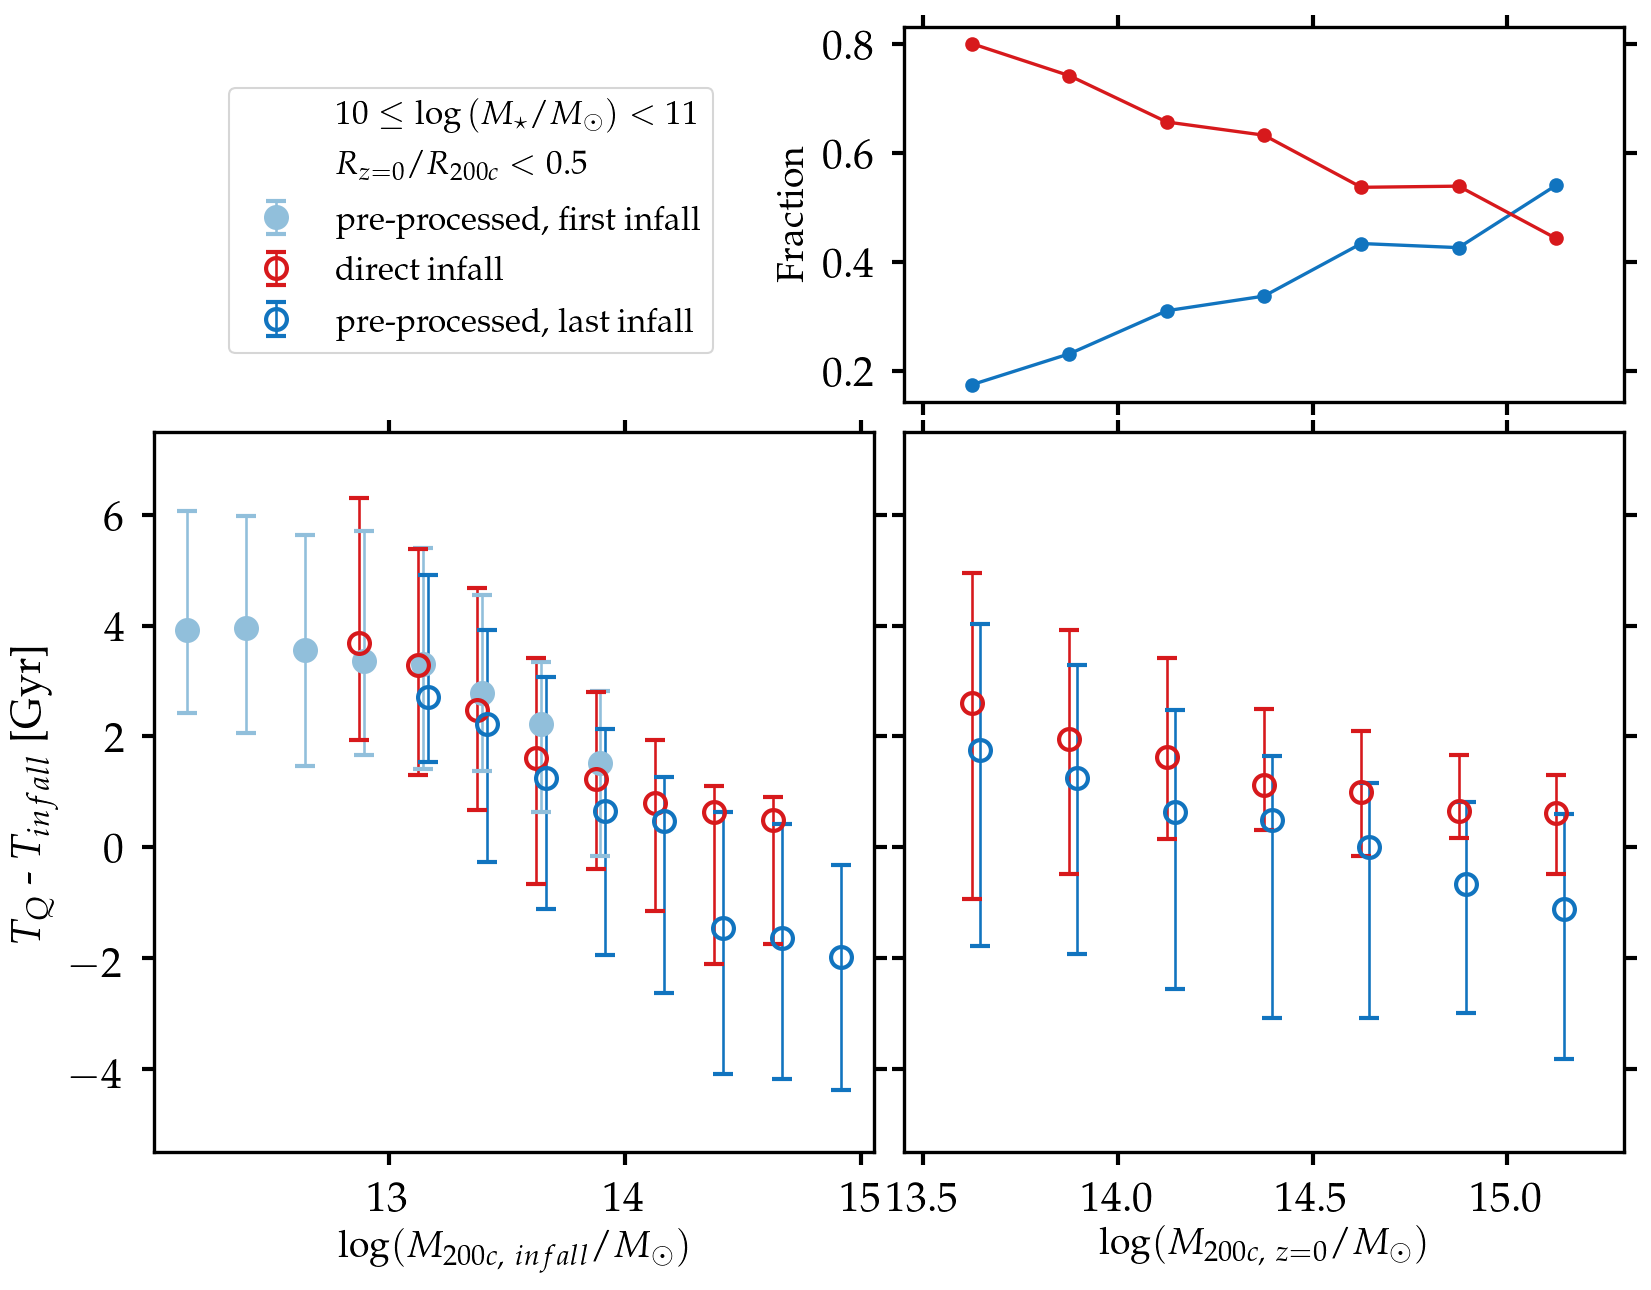
Previous work has highlighted the importance of group pre-processing on galaxy quenching histories (e.g. Fujita, 2004; Balogh & McGee, 2010; Wetzel et al., 2013; Bahé et al., 2019). In Figure 5, we look into the dependence on halo mass in detail, and examine whether group pre-processing plays a role in the coordinated assembly picture. We focus on satellite galaxies with that are located relatively close to the cluster centers (). We identify satellite galaxies that fall into their halos directly as central galaxies, and include them in the “direct infall” groups in Figure 5. The first time they are accreted into of their final host dark matter halos are marked as their infall times (red). Next, we identify those that were accreted onto their halos as satellites, and look into the most recent time they fell into any dark matter halos with as central galaxies. We include these galaxies as “pre-processed” galaxies, and mark the time they are accreted as central galaxies as their first infall time (light blue), and the time they are accreted into their final host dark matter halos as the last infall time (blue). We note that one caveat comes from the uncertainty in merger scenarios where position-space halo finders may not successfully trace the separation of all subhalos.
The top right panel of Figure 5 shows the fraction of direct infall and group pre-processed galaxies as a function of their host dark matter halo mass at . In halos with , galaxies are accreted as central galaxies, and only have been pre-processed by a smaller halos. However, group pre-processing plays an increasingly important role in more massive galaxies. In the massive clusters with , more than half the quenched galaxies have experienced group pre-processing.
In the bottom panels, we plot the delay between the quenching and infall times as a function of the halo mass at the infall time (left) and the halo mass at (right). As shown in the bottom left panels, the time delay is shorter when galaxies are accreted into more massive dark matter halos. More importantly, the slopes of the relations between the time delay and the first infall halo mass are similar in both the “direct infall” and “pre-processed” cases, indicating that the quenching processes have already started since the first infall. If we only compare the time delay since the last infall, galaxies that have experienced group pre-processing have much shorter delay times than the direct infall galaxies, some of which are quenched even before they are accreted. This panel shows that group pre-processing is crucial in satellite quenching. The bottom right panel shows the time delay since their final accretion as a function of halo mass. Galaxies that have been pre-processed have shorter time delays (Gyr) at all halo masses, while the direct infall galaxies are quenched Gyr after they are accreted. In both cases galaxies are quenched faster in more massive groups and clusters. See Donnari et al. (2020) for additional in-depth characterization of pre-processing with the IllustrisTNG simulations.
4. Summary
In this Letter, we use TNG300 galaxies to explore the coordinated assembly picture (Gu et al., 2018), namely the idea that the ETGs in the central regions of galaxy clusters do not obey the []- and age- trends established by the general ETG sample, but instead follow much shallower relations. We try to understand whether the simulations show coordinated assembly and, if they do, what could be the underlying physical cause. We focus on quiescent satellite galaxies with in massive halos () from the TNG300 run. Our conclusions are summarized as follows:
-
•
At , quenched satellite galaxies in the central regions of massive groups and clusters are accreted earlier, quenched earlier, have shorter star formation timescales and older stellar ages compared to their counterparts in other environments. This is consistent with observational results that galaxies in the central regions of massive clusters are old and -enhanced.
-
•
The star formation timescale ()- and stellar age- scaling relations followed by the TNG300 galaxies are in good agreement with observations. The slopes of these relations are much shallower in the central regions of massive dark matter halos, indicating that in this special environment even the low-mass ETGs have old stellar ages, and short star formation timescales.
-
•
Both stellar ages and star formation timescales depend on cluster-centric distance. Galaxies in more massive dark matter halos are older and formed faster on average within . The dependence on cluster-centric distance is stronger for low mass galaxies.
-
•
Group pre-processing is a crucial aspect in galaxy quenching, and plays an increasingly important role in more massive halos. Galaxies accreted into more massive groups and clusters are quenched faster, and the time delay is primarily determined by the halo mass of the first accretion.
To test the prediction of the environmental dependence in this work with observations, both halo mass and cluster-centric distance should be carefully measured from the observational side so that a robust comparison can be made. During the assembly of massive galaxies, the building blocks will imprint their stellar population signatures in the outskirts of these galaxies. Investigating the radial profiles of stellar population properties such as age and -abundance in different environments, in both observations and simulations, will test the coordinated assembly picture.
References
- Abadi et al. (1999) Abadi, M. G., Moore, B., & Bower, R. G. 1999, MNRAS, 308, 947
- Bahé et al. (2019) Bahé, Y. M., Schaye, J., Barnes, D. J., et al. 2019, MNRAS, 485, 2287
- Balogh & McGee (2010) Balogh, M. L., & McGee, S. L. 2010, MNRAS, 402, L59
- Balogh et al. (2000) Balogh, M. L., Navarro, J. F., & Morris, S. L. 2000, The Astrophysical Journal, 540, 113
- Conroy et al. (2014) Conroy, C., Graves, G. J., & van Dokkum, P. G. 2014, The Astrophysical Journal Letters, 780, 33
- Cook et al. (2016) Cook, B. A., Conroy, C., Pillepich, A., Rodriguez-Gomez, V., & Hernquist, L. 2016, ApJ, 833, 158
- Davis et al. (1985) Davis, M., Efstathiou, G., Frenk, C. S., & White, S. D. M. 1985, ApJ, 292, 371
- Di Matteo et al. (2009) Di Matteo, P., Pipino, A., Lehnert, M. D., Combes, F., & Semelin, B. 2009, A&A, 499, 427
- Diemer (2018) Diemer, B. 2018, ApJS, 239, 35
- Diemer et al. (2017) Diemer, B., Sparre, M., Abramson, L. E., & Torrey, P. 2017, ApJ, 839, 26
- Dolag et al. (2009) Dolag, K., Borgani, S., Murante, G., & Springel, V. 2009, MNRAS, 399, 497
- Donnari et al. (2019) Donnari, M., Pillepich, A., Nelson, D., et al. 2019, MNRAS, 485, 4817
- Donnari et al. (2020) Donnari, M., Pillepich, A., Joshi, G. D., et al. 2020, arXiv, 2008.00005
- Farouki & Shapiro (1981) Farouki, R., & Shapiro, S. L. 1981, ApJ, 243, 32
- Fujita (2004) Fujita, Y. 2004, PASJ, 56, 29
- Genel et al. (2014) Genel, S., Vogelsberger, M., Springel, V., et al. 2014, MNRAS, 445, 175
- Genel et al. (2018) Genel, S., Nelson, D., Pillepich, A., et al. 2018, MNRAS, 474, 3976
- Gu et al. (2018) Gu, M., Conroy, C., & Brammer, G. 2018, The Astrophysical Journal Letters, 862, L18
- Gunn & Gott (1972) Gunn, J. E., & Gott, III, J. R. 1972, ApJ, 176, 1
- Larson et al. (1980) Larson, R. B., Tinsley, B. M., & Caldwell, C. N. 1980, ApJ, 237, 692
- Marinacci et al. (2018) Marinacci, F., Vogelsberger, M., Pakmor, R., et al. 2018, MNRAS, 480, 5113
- Moore et al. (1996) Moore, B., Katz, N., Lake, G., Dressler, A., & Oemler, A. 1996, Nature, 379, 613
- Naab et al. (2009) Naab, T., Johansson, P. H., & Ostriker, J. P. 2009, ApJ, 699, L178
- Naiman et al. (2018) Naiman, J. P., Pillepich, A., Springel, V., et al. 2018, MNRAS, 477, 1206
- Nelson et al. (2018) Nelson, D., Kauffmann, G., Pillepich, A., et al. 2018, Monthly Notices of the Royal Astronomical Society, 477, 450
- Nelson et al. (2019a) Nelson, D., Pillepich, A., Springel, V., et al. 2019a, MNRAS, 490, 3234
- Nelson et al. (2019b) Nelson, D., Springel, V., Pillepich, A., et al. 2019b, Computational Astrophysics and Cosmology, 6, 2
- Oser et al. (2012) Oser, L., Naab, T., Ostriker, J. P., & Johansson, P. H. 2012, ApJ, 744, 63
- Oser et al. (2010) Oser, L., Ostriker, J. P., Naab, T., Johansson, P. H., & Burkert, A. 2010, ApJ, 725, 2312
- Patel et al. (2013) Patel, S. G., van Dokkum, P. G., Franx, M., et al. 2013, ApJ, 766, 15
- Peng et al. (2012) Peng, Y.-j., Lilly, S. J., Renzini, A., & Carollo, M. 2012, ApJ, 757, 4
- Peng et al. (2010) Peng, Y.-j., Lilly, S. J., Kovac, K., et al. 2010, The Astrophysical Journal Letters, 721, 193
- Pillepich et al. (2018) Pillepich, A., Nelson, D., Hernquist, L., et al. 2018, Monthly Notices of the Royal Astronomical Society, 475, 648
- Pillepich et al. (2019) Pillepich, A., Nelson, D., Springel, V., et al. 2019, MNRAS, 490, 3196
- Planck Collaboration et al. (2016) Planck Collaboration, Ade, P. A. R., Aghanim, N., et al. 2016, A&A, 594, A13
- Rhee et al. (2017) Rhee, J., Smith, R., Choi, H., et al. 2017, ApJ, 843, 128
- Rodriguez-Gomez et al. (2015) Rodriguez-Gomez, V., Genel, S., Vogelsberger, M., et al. 2015, Monthly Notices of the Royal Astronomical Society, 449, 49
- Rodriguez-Gomez et al. (2016) Rodriguez-Gomez, V., Pillepich, A., Sales, L. V., et al. 2016, MNRAS, 458, 2371
- Rodriguez-Gomez et al. (2019) Rodriguez-Gomez, V., Snyder, G. F., Lotz, J. M., et al. 2019, MNRAS, 483, 4140
- Springel et al. (2001) Springel, V., White, S. D. M., Tormen, G., & Kauffmann, G. 2001, MNRAS, 328, 726
- Springel et al. (2018) Springel, V., Pakmor, R., Pillepich, A., et al. 2018, MNRAS, 475, 676
- Thomas et al. (1999) Thomas, D., Greggio, L., & Bender, R. 1999, Monthly Notices of the Royal Astronomical Society, 302, 537
- Thomas et al. (2005) Thomas, D., Maraston, C., Bender, R., & Mendes de Oliveira, C. 2005, ApJ, 621, 673
- Trager et al. (2000) Trager, S. C., Faber, S. M., Worthey, G., & González, J. J. 2000, The Astronomical Journal, 119, 1645
- van Dokkum et al. (2010) van Dokkum, P. G., Whitaker, K. E., Brammer, G., et al. 2010, ApJ, 709, 1018
- Vogelsberger et al. (2014a) Vogelsberger, M., Genel, S., Springel, V., et al. 2014a, MNRAS, 444, 1518
- Vogelsberger et al. (2014b) —. 2014b, Nature, 509, 177
- Wetzel et al. (2014) Wetzel, A. R., Tinker, J. L., Conroy, C., & Bosch, F. C. v. d. 2014, Monthly Notices of the Royal Astronomical Society, 439, 2687
- Wetzel et al. (2013) Wetzel, A. R., Tinker, J. L., Conroy, C., & van den Bosch, F. C. 2013, Monthly Notices of the Royal Astronomical Society, 432, 336