Color night vision correlation imaging without an infrared focal plane array
Abstract
Night vision is the ability to see in low-light conditions. However, conventional night vision imaging technology is limited by the requisite high-performance infrared focal plane array. In this article, we propose a novel scheme of color night vision imaging without the use of an infrared focal plane array. In the experimental device, the two-wavelength infrared laser beam reflected by the target is modulated by a spatial light modulator, and the output light is detected by a photomultiplier tube. Two infrared night vision images are reconstructed by measuring the second-order intensity correlation function between two light fields. Thus, the processing mode of optical electric detection in conventional night vision imaging is transformed into the processing mode of light field control. Furthermore, two gray images with different spectra are processed to form a color night vision image. We show that a high-quality color night vision image can be obtained by this method.
I Introduction
Human beings rely on a variety of senses to perceive the world, of which 83% comes from vision. However, in the environment of extremely weak light intensity, human vision is significantly limited. To expand the scope of our vision, night vision imaging technology has emerged. Night vision technology is a kind of optical imaging that can transform an invisible scene into a visible image by using photoelectric detection and imaging equipment under low illumination at night. Owing to this type of technology, the scope of human observation has now been greatly expanded. To date, night vision imaging technology has been applied in many fields, including military reconnaissance, security monitoring, car-assisted driving and so on. Generally, night vision imaging technology includes thermal imaging and low-light-level (LLL) night vision imaging [1]. The infrared focal plane array (IRFPA) is the indispensable core device of thermal imaging. IRFPAs have high technical requirements and poor imaging quality, preventing their wide use in commercial applications such as visible focal plane arrays (FPAs).
The IRFPA represents one of the key problems restricting the development of night vision imaging technology, and the performance of IRFPAs is not expected to become comparable to that of conventional charge-coupled device (CCDs) or complementary metal oxide semiconductors (CMOSs) in the near future. Accordingly, is there a new scheme that can omit the IRFPA? In this article, we propose a novel color night vision imaging scheme based on the intensity correlation (or second-order intensity correlation) of the light field [2-6]. Photoelectric conversion in conventional night vision imaging is replaced by the intensity correlation of the light field. Thus, the processing mode of optical electric detection in traditional night vision imaging technology is transformed into the processing mode of light field control. In the experimental setup, the two-wavelength infrared laser beam reflected by the target is modulated by a spatial light modulator (SLM), and the modulated light is detected by a photomultiplier tube (PMT). Although an infrared light source is used in this scheme, no IRFPA is involved in the imaging setup.
Here, light field control involves making two light fields have a second-order spatial intensity correlation. Different from the Michelson interferometer, which describes first-order light field properties [7], the intensity interferometer pioneered by Hanbury Brown and Twiss (HBT), which focuses on the second-order correlation of light intensity fluctuations, is a great method to study optical coherence theory [8-10]. A spatial HBT-type imaging modality, called correlation imaging (or ghost imaging) [2-6,11,12], has attracted much attention from researchers. Compared with the classical optical imaging approach, correlation imaging has some unique advantages, e.g., anti-interference [13,14] and super-resolution [15,16], indicating that ghost imaging has important applications in lidar [17,18], remote sensing [19,20], and pattern recognition [21].
Conventional color night vision imaging is mainly used to process gray images output by LLL night vision and infrared night vision via software, such as image fusion and color conversion [22-25]. In this article, according to the intensity correlation of the light field, two gray images with different spectra are obtained. Thus, the gray image produced by LLL night vision can be replaced by the gray image generated by short-wavelength infrared light. Then, the night vision image with strong sense of nature is obtained by color conversion and gray-level fusion. Compared with the conventional pseudocolor processing mode, this scheme does not need the LLL night vision image to participate in pseudocolor processing. The experimental results show that this scheme can produce a color night vision image of comparable quality to that of the classical optical image.
II Theory
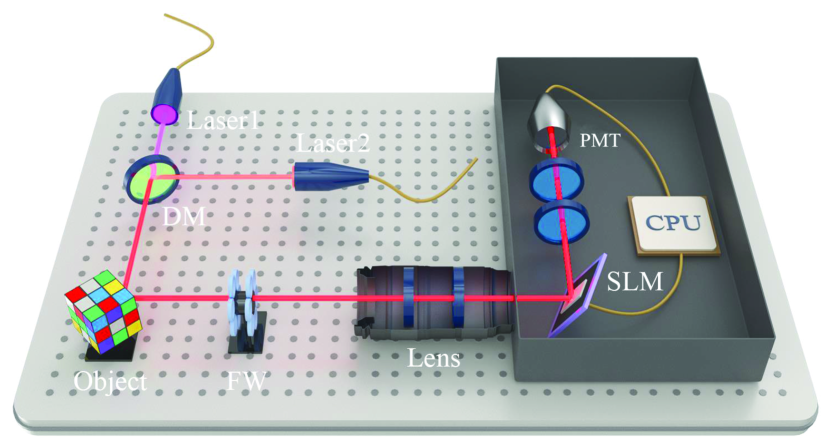
We depict the scheme of color night vision correlation imaging without an IRFPA in Figure 1. We assume that two infrared lasers with different wavelengths and illuminate a target, and the reflected light carrying the target’s information propagates the distance of and converges on the SLM surface through a lens. Then, the modulated light, which propagates the distance of in free space, is collected by a PMT and can be expressed as [21,22]
| (1) |
where the subscripts and indicate the detection light field and signal light field, respectively. The SLM produces spatial amplitude modulation of the light field distribution represented by the random spatial mask function , which is used to obtain spatial correlations that follow Gaussian statistics [23]. The functions and are transfer functions that describe the propagation from the target to the SLM and the SLM to the PMT, respectively. and represent the transverse position and wave vector, respectively. represents the reflection coefficient of the target. The on-target deterministic intensity pattern produced by the SLM can then be calculated via diffraction theory:
| (2) |
where the subscript represents the calculation light field.
The image is reconstructed by the intensity cross-correlation measurement, i.e.,
| (3) |
where
| (4) |
is the intensity cross-correlation function in the spatial and temporal frequency domain evaluated at the output surface of the SLM [23]. Substituting Eq. (4) into Eq. (3), we can thus rewrite the ghost image as
| (5) |
where , with representing the product of the average intensities of the detected light and the calculated light, respectively. The function is the spatial Fourier transform of , and the transfer function is written in position space. We assume that because the distance () between the SLM and bucket detector is fixed. .
Through the above theoretical analysis, we obtain the following conclusions: (1) This imaging scheme produces two infrared gray images. (2) The physical nature of color night vision correlation imaging without an IRFPA is based on the second-order intensity correlation of light (see Eq. (4)). (3) This imaging scheme is not sensitive to the distance of the object and imaging device. The distance from the SLM to the PMT is fixed. Thus, the transfer function is not affected by the position of the target. The light path from the target to the SLM is adjusted by a combined lens, which is the same as in conventional optical imaging. (4) If the SLM and PMT are regarded as an imaging device and the combined lens is regarded as the camera lens, this imaging scheme is exactly the same as a conventional optical camera in terms of structure.
III Experiments
Our experimental setup is illustrated in Figure 1. Two near-infrared lasers with nm and nm (Changchun New Industries Optoelectronics Technology Co., Ltd. MLL-III-785, MDL-III-830) are coupled into a beam by a dichroic mirror (Thorlabs, DMLP805). This two-wavelength beam in the laboratory illuminates a target, and the reflected light is converged on the surface of a two-dimensional amplitude-only ferroelectric liquid crystal SLM (FLC-SLM, Meadowlark Optics A512-450-850), with 512512 addressable 15 15 pixels. Then, the modulated light is filtered by two bandpass filters (Thorlabs, FL05780-10, FL830-10) mounted on a filter wheel (Daheng Xinjiyuan Technology Co., Ltd. GCM-14). Finally, the light carrying the target’s information is collected by a PMT (Hamamatsu H10721-20). Two infrared night vision images are produced by cross-correlation of the input signal of the SLM and the output signal of the PMT.
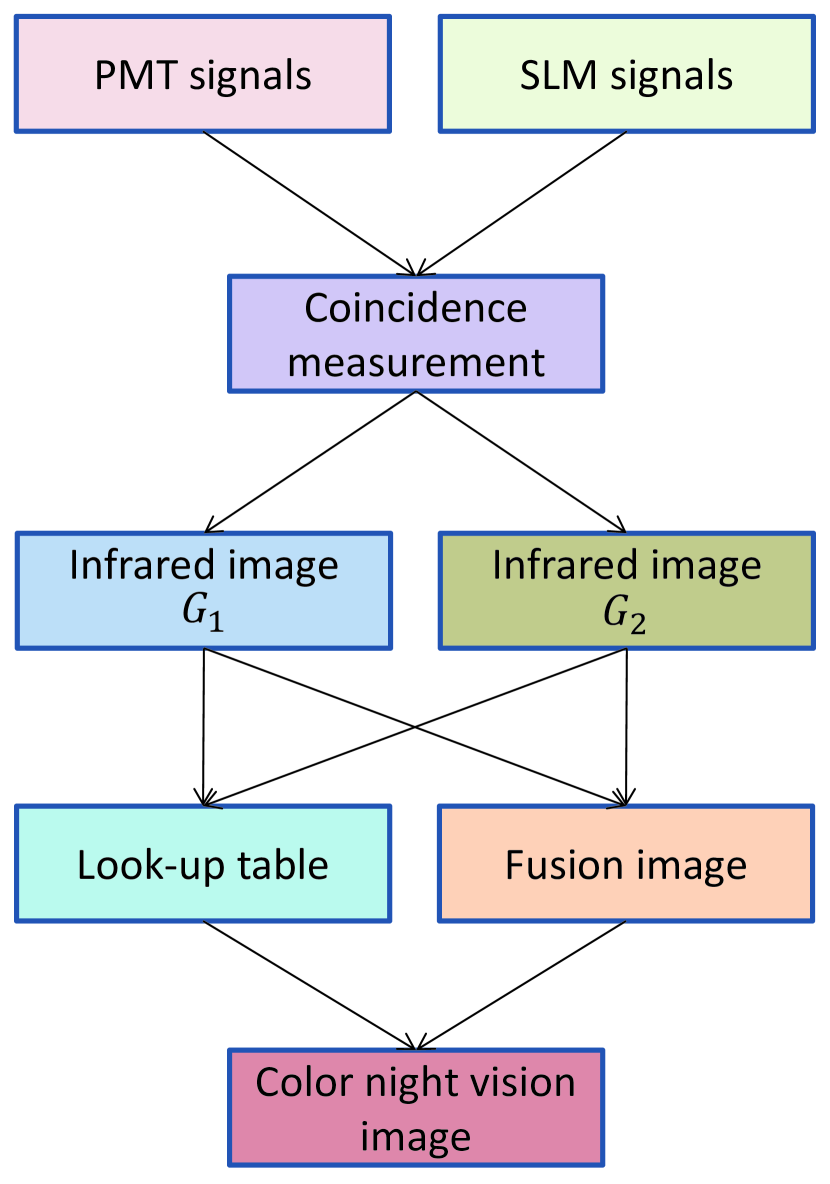
Next, the grayscale images output by this scheme are processed with color. Pseudocolor image processing includes two main parts: color mapping and gray-level fusion. The flow chart is shown in Figure 2. First, a look-up table is constructed based on a backpropagation neural network. From the above analysis, two gray images can be obtained at the same time. These two gray images and one color image are selected as training samples. According to the corresponding relationship of pixel positions in different images, the two-dimensional gray vector (, ) and two-dimensional chroma vector of the selected training samples are nonlinear fitted by using a back-propagation neural network to determine the best mapping to . With the help of the neural network nonlinear fitting toolbox provided by MATLAB, the double-input and double-output double-layer backpropagation neural network (with the hidden layer containing 10 neurons) is constructed and trained by the Levenberg-Marquardt algorithm. In particular, 70% of the samples are used for network training, 15% are used for generalization performance optimization, and 15% are used for network testing. Taking and as horizontal and vertical coordinates, respectively, a complete two-dimensional color lookup table tclut is constructed by using the mapping f obtained in the previous step and the input values (, ), i.e., (, ), where , denotes all the two-dimensional grayscale combinations of 8-bit grayscale images, with a total of index values. In this way, we build a color lookup table.
For infrared gray image and infrared gray image (the pixel size is and the bit depth is 8 bits), according to the gray value combination of the two images at the same pixel position , the look-up table Tclut is indexed. The index value tclut is the chromaticity value at the same pixel position of color fusion image , i.e., . The and chroma channel information of the color fusion image can be obtained by indexing the pixels at all positions of the two grayscale images. A color night vision image can be obtained by this processing approach (for details, see the experimental results).
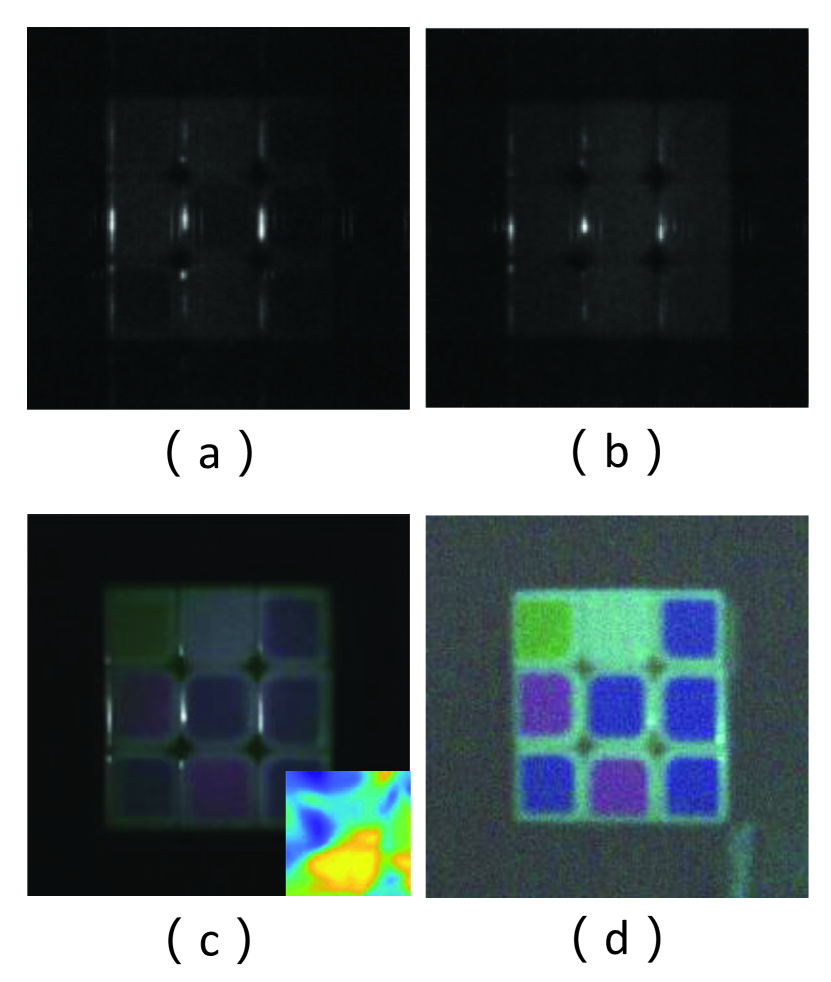
In the first experiment, we chose a simple color cube as the target. Figure 3 compares the image quality of color night vision correlation imaging without an IRFPA, conventional near-infrared night vision and classical color imaging with visible light. Figures 3(a,b) show the infrared grayscale image generated by color night vision correlation imaging without an IRFPA. Figure 3c presents the experimental results of color night vision correlation imaging without an IRFPA with 200000 sets of data. Correspondingly, Figure 3d depicts the classical color image with visible light (detected by Imaging Source DFK23U618). The experimental results show that the image obtained by our imaging scheme is of high quality and has rich color. Compared with the near-infrared image, our image is more conducive to scene perception and target recognition. Moreover, compared with the visible color image, our color image does not completely restore the natural color of the target, but the color mapping of each point is correct.
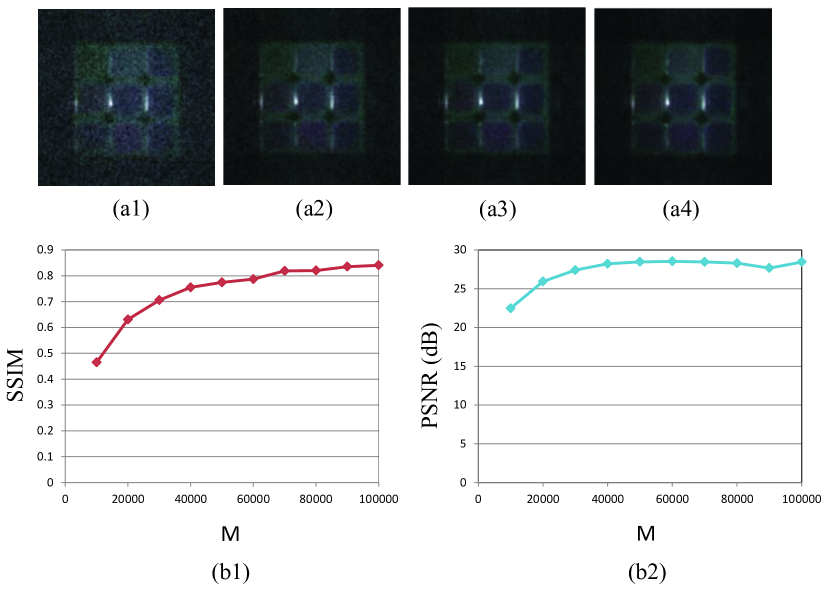
Similar to that of correlation imaging, the image quality of our imaging scheme is related to the number of data used in image reconstruction. Figures 4(a-d) present the experimental results with different quantities of data. To quantitatively analyze the quality of the reconstructed image with different numbers of data, the peak signal-to-noise ratio (PSNR) and structural similarity index (SSIM) are used as our evaluation indexes. The results from Figure 4 show that the image quality is significantly improved by increasing the quantity of data.
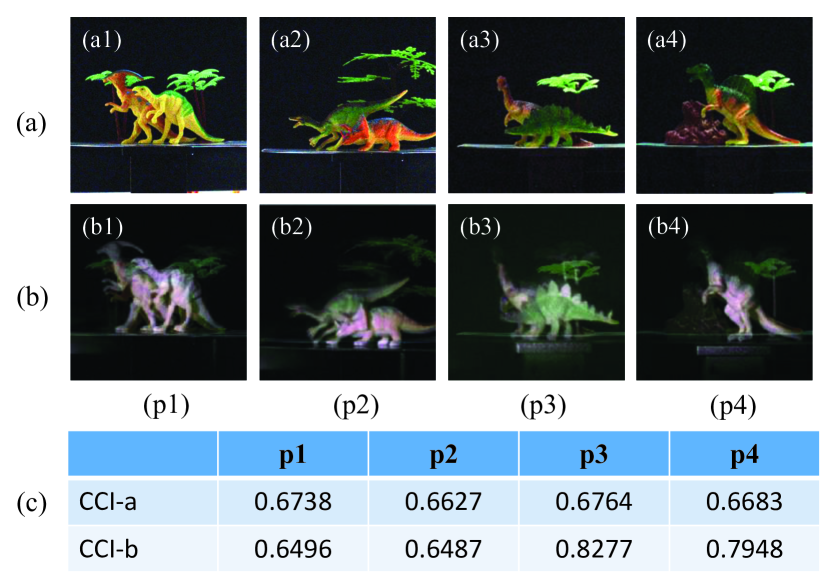
To demonstrate that this scheme has a wide range of effectiveness, we selected four complex color targets for the experiment. The experimental parameters are exactly the same as those in the previous experiment. Figures 5(a1- a4) show the four visible light images. Correspondingly, Figures 5(b1- b4) show that the reconstructed color images exhibit high image quality and rich color. Then, the color colorfulness index (CCI) is used to quantitatively analyze the colorfulness of the reconstructed image. Figure 5c shows that the reconstructed image has rich color. Although the color of the reconstructed image cannot be completely restored to the real color of the object, the color image is easier to distinguish and recognize than the infrared gray image.
IV Conclusion
In this letter, we reported a novel color night vision imaging scheme without an IRFPA. Different from conventional night vision techniques based on first-order light field properties, our imaging scheme has a physical nature based on second-order light field properties. The second-order intensity correlations between the light collected by the PMT and the calculated light are generated by modulating the SLM. The infrared night vision image can be obtained by measuring the second-order correlation function between two signals. The color night vision image is produced by further processing the two infrared gray images with different spectra. Because the PMT has no spatial resolution and the SLM does not detect the light field, the IRFPA is not involved in the imaging process. The experimental results show that a night vision image with rich color and high quality is obtained by color conversion and gray-level fusion. Like other color night vision technologies, this scheme can only partially restore the real color of the object, but the reconstructed color image is easier to distinguish and recognize than the traditional gray night vision image. Moreover, this scheme does not need the LLL night vision image to participate in the pseudocolor processing. This method provides a promising solution to improve the performance of night vision imaging. Furthermore, this method has the potential to be developed into a new night vision imaging technique.
V Acknowledgments
This project was supported by the National Natural Science Foundation (China) under Grant Nos. 11704221, 11574178 and 61675115, Taishan Scholar Project of Shandong Province (China) under Grant No. tsqn201812059, and Shandong Provincial Natural Science Foundation (China) under Grant Nos. ZR2016AP09 and ZR2016JL005.
References
- (1) L. F. Bai, J. Han, and J. Yue, night vision processing and understanding, Springer, Singapore 2019.
- (2) J. Cheng, and S. S. Han, Incoherent coincidence imaging and its applicability in x-ray diffraction, Phys. Rev. Lett. 92, 093903 (2004).
- (3) J. H. Shapiro, Computational ghost imaging, Phys. Rev. A 78, 061802(R) (2008).
- (4) Y. Bromberg, O. Katz, and Y. Silberberg, ghost imaging with a single detector, Phys. Rev. A 79, 053840 (2009).
- (5) X. L. Yin, Y. J. Xia, and D. Y. Duan, Theoretical and experimental study of color of ghost imaging, Opt. Express 26 (15), 18944-18949 (2018).
- (6) S. Ragy and G. Adesso, Nature of light correlations in ghost imaging, Sci. Rep. 2, 651 (2012).
- (7) Y. H. Shih, The physics of ghost imaging, Classical, Semi-classical and Quantum Noise. pp169-222, Springer, New York, 2012.
- (8) R. H. Brown and R. Q. Twiss, Nature 177, 27 (1956).
- (9) R. H. Brown and R. Q. Twiss, Nature 178, 1046 (1956).
- (10) R. J. Glauber, Phys. Rev. 130, 2529 (1963).
- (11) B. I. Erkmen and J.H. Shapiro, Ghost imaging: from quantum to classical and computational, Adv. Opt. Photon 2, 405-450 (2010).
- (12) J. H. Shapiro and R. W. Boyd, The physics of ghost imaging, Quantum Inf Process 11, 949–993 (2012).
- (13) R. E. Meyers, K. S. Deacon, and Y. Shih, turbulence-free ghost imaging, Appl. Phys. Lett. 98, 111115 (2011).
- (14) R. E. Meyers, K. S. Deacon, and Y. Shih, positive-negative turbulence-free ghost imaging, Appl. Phys. Lett. 100, 131114 (2012).
- (15) W. Li, Z. Tong. K. Xiao, Z. Liu, Q. Gao, J. Sun, S. Liu, S. Han, Z. Wang, Single-frame wide-field nonoscopy based on ghost imaging via sparsity constraints, Optica, 6(12), 1515-1523 (2019).
- (16) W. L. Gong, S. S. Han, Experimental investigation of the quality of lensless super-resolution ghost imaging via sparsity constraints, Phys. Lett. A 376(17), 1519-1522 (2012).
- (17) W. L. Gong, C. Q. Zhao, H. Yu, M. L. Chen, W. D. Xu, S. S. Han, Three-dimensional ghost imaging lidar via sparsity constraint, Sci. Rep. 6, 26133 (2016).
- (18) C. Q. Zhao, W. L. Gong, M. L. Chen, E. R. Li, H. Wang, W. D. Xu, S. S. Han, Ghost imaging lidar via sparsity constraints, Appl. Phys. Lett. 101, 141123 (2012).
- (19) B. I. Erkmen, Computational ghost imaging for remote sensing, J. Opt. Soc. Am A 29, 782-789, (2012).
- (20) D. Y. Duan, Z. X. Man, and Y. J. Xia, Nondegenerate wavelength computational ghost imaging with thermal light, 27(18) 25187-25195 (2019).
- (21) X. Qiu, D. Zhang, W. Zhang, and L. Chen, Structured-Pump-Enabled Quantum Pattern Recognition, Phys. Rev. Lett. 122, 123901 (2019).
- (22) A. Toet, M. A. Hogervorst, Portable real-time color night vision, Proc. SPIE 6974 (2008).
- (23) A. Toet, Natural colour mapping for multiband night vision imagery, Inform. Fusion 4(3) 155-166 (2003).
- (24) A. Toet, M. A. Hogervorst, Progress in color night vision, Opt. Eng. 51(1) 010901 (2012).
- (25) A. M. Waxman, A. N. Gove, D. A. Fay, J. P. Racamato, J. E. Carrick, M. C. Seibert, E. D. Savoye, Color night vision: opponent processing in the susion of visible and IR imagery, Neural Networks 10(1), 1-6 (1997).