AstroSat view of GRS 1915105 during the Soft State: Detection of HFQPOs and estimation of Mass and Spin
Abstract
We report the results of AstroSat observations of GRS 1915105 obtained using 100 ks guaranteed-time (GT) during the soft state. The Color-Color Diagram (CCD) indicates a variability class of with the detection of High Frequency QPO (HFQPO) in the power density spectra (PDS). The HFQPO is seen to vary in the frequency range of Hz with percentage rms % and significance varying from . The energy dependent power spectra show that the HFQPO features are dominant only in keV energy band. The broadband energy spectra ( keV) of SXT (Soft X-ray Telescope) and LAXPC (Large Area X-ray Proportional Counter) modelled with nthComp and powerlaw imply that the source has an extended corona in addition to a compact ‘Comptonizing corona’ that produces high energy emission and exhibits HFQPOs. The broadband spectral modelling indicates that the source spectra are well described by thermal Comptonization with electron temperature (kTe) of keV and photon-index () between with an additional powerlaw component of photon-index () between . The norm of nthComp component is high () during the presence of strong HFQPO and low () during the absence of HFQPO. Further, we model the energy spectra with the kerrbb model to estimate the accretion rate, mass and spin of the source. Our findings indicate that the source accretes at super-Eddington rate of . Moreover, we find the mass and spin of the source as and with confidence suggesting that GRS 1915105 is a maximally rotating stellar mass X-ray binary black hole source.
keywords:
accretion, accretion disc - black hole physics, X-rays: binaries.1 Introduction
The astrophysical compact objects like white dwarf (WD), neutron star (NS) and black hole (BH) are often seen to exist along with its companion star. These binary sources are usually X-ray bright and referred as X-ray binaries (XRBs, Seward & Charles, 2010). The high energy X-ray emission from black hole XRBs (BH-XRBs) is attributed to the accretion processes that are involved in the mass transfer from the companion star to the black hole. Detailed study of the X-ray emission from BH-XRBs is essential to understand the accretion dynamics as well as the effect of strong gravity in the vicinity of the black holes.
XRBs are known to exhibit excess power in certain frequencies called Quasi-periodic Oscillations (QPOs) which are evident from the power density spectrum (PDS) of these sources (van der Klis et al., 1985; Belloni et al., 2005; Remillard & McClintock, 2006; Nandi et al., 2012; Belloni & Motta, 2016; Sreehari et al., 2019, and references therein). The QPOs in BH-XRBs lie in a wide range of frequencies Hz and they have been classified into two general categories: (a) low-frequency QPOs (LFQPOs) in the range Hz and (b) high-frequency QPOs (HFQPOs) in the range Hz (Remillard & McClintock, 2006). The origin of HFQPOs is of great interest as these oscillations are transient as well as subtle. Moreover, HFQPOs possibly are the manifestations of various relativistic effects in the orbits close to the black hole and it can be used as an important tool to probe general relativity in the strong gravity limit (Stella & Vietri, 1998; Rebusco, 2008; Merloni et al., 1999; Vincent et al., 2013; Stefanov, 2014, and references therein). However, the conclusive consensus on the origin of HFQPOs is not reached yet.
Some BH-XRBs like GRS 1915105 and IGR J170913624 also exhibit visually identifiable variabilities in their light curves. These variabilities are also associated with changes in the corresponding energy spectra and are categorized into several variability classes using Color-Color Diagrams (CCDs), light curve profiles (Belloni et al., 2000) and nature of energy spectra (Iyer et al., 2015; Radhika et al., 2018).
Energy spectral modelling of various BH-XRBs indicates that the emission from these sources are in general thermal as well as non-thermal in nature. The multi-temperature disc black body emission represents the Keplerian accretion disc (Shakura & Sunyaev, 1973), whereas the high energy emission from the source is attributed due to the inverse-Comptonisation (Sunyaev & Titarchuk, 1980; Tanaka & Lewin, 1995; Chakrabarti & Titarchuk, 1995) of seed photons by the hot corona located at the inner part of the disc surrounding the black hole. Several other models along with the additional features like elemental abundance and relativistic-reflection (García et al., 2014, and references therein) have been introduced to explain overall emission features. However, these models are phenomenological in nature as they do not directly provide the physical properties (namely, mass and spin) of the accreting BH source. Keeping this in mind, in this paper, we attempt to model the broadband energy spectra of GRS 1915105 using the kerrbb (Li et al., 2005) model. This model deals with rotating black hole and is used to estimate the mass and spin of the sources.
Since detection, the source GRS 1915105 has remained active in X-rays (Castro-Tirado et al., 1992). However, the source underwent into the non-active phase in the recent past although some flickering activities in X-rays were occasionally seen. It is noteworthy that GRS 1915105 exhibits fourteen different structured X-ray variability classes (Belloni et al., 2000; Klein-Wolt et al., 2002; Hannikainen et al., 2005). In a classical effort, Greiner et al. (2001) estimated the mass of the source to be considering the orbital period of days. Recently, Reid et al. (2014) estimated the black hole mass as M⊙ and the distance as kpc using parallax method. Zdziarski (2014) calculated the inclination of GRS 1915105 to be based on kinematic constraints from the mass ejections. On the other hand, several attempts have been made to estimate the spin of the source. The estimation of spin of GRS is reported to be = 0.98 (Blum et al., 2009; Miller et al., 2013).
GRS 1915105 exhibited LFQPOs during the RXTE era (Ratti et al., 2012, and references therein). Besides this, Yadav et al. (2016) detected LFQPOs from GRS 1915105 using AstroSat/LAXPC data. GRS 1915105 has also exhibited 67 Hz and 40 Hz HFQPOs during the RXTE era (Morgan et al., 1997; Strohmayer, 2001b). Belloni et al. (2006) reported the detection of a 170 Hz HFQPO in the C-State of GRS 1915105. Moreover, Belloni & Altamirano (2013) detected HFQPOs with frequencies varying from Hz using RXTE data. Méndez et al. (2013) showed a detailed comparison of the lag spectra for 35 Hz and 67 Hz HFQPOs of GRS 1915105. Recently, Belloni et al. (2019) reported HFQPOs of frequencies between Hz in the and variability classes of GRS 1915105 from the AstroSat observations of July 2016. They also studied the phase lags and their relation with hardness ratio, although they ignored the dead-time effect while carrying out power spectral analysis and detection of QPOs. Moreover, they did not carry out the broadband spectral modelling to understand the emission processes. Meanwhile, several models were proposed to explain the origin of the HFQPOs observed in GRS 1915105. Morgan et al. (1997) first proposed that the HFQPOs are associated with the Keplerian frequency at the inner-most stable circular orbit (ISCO). Cui et al. (1998) suggested that the HFQPOs possibly arise due to the relativistic Lense-Thirring precession around a highly spinning black hole. Nowak et al. (1997) proposed a model based on disko-seismic g-modes of oscillation for explaining the HFQPOs of this source. However, these models bear the limitations of revealing the inherent properties of the source under consideration including the relevant radiative emission processes.
Indeed, the broadband X-ray spectra of GRS 1915105 was studied (Grove et al., 1998; Zdziarski et al., 2001) with combined observations from CGRO/OSSE and RXTE. The spectra from few keV to 10 MeV showed a single powerlaw with no high energy cut-off up to 500 keV, unlike other BH-XRBs. RXTE spectra of the source was modelled with just a thermal Comptonization component (Vilhu et al., 2001). BeppoSAX spectra of B and C states were found to have a definite high-energy cut-off, varying from 45 to 100 keV (Feroci et al., 1999).
Keeping all these in mind, in this paper, we use Guaranteed Time (GT) AstroSat data of June 2016 to identify the variability class and characterize the detected HFQPOs of GRS 1915105. We carry out the energy dependent study of power spectral features to understand the HFQPO properties. Combining the data from both imaging (SXT) and the proportional counter units (LAXPC) on board AstroSat, we generate and fit the broadband energy spectra with phenomenological as well as physical models in order to get an insight of the disc emission processes. Moreover, we attempt to constrain the mass and spin of the source using broadband spectral modelling and finally compute the mass accretion rate as well.
We organize the paper as follows. In §2, we present the reduction and extraction procedures of AstroSat data. In §3, we discuss the methods of timing analysis and present the results. In §4, we carry out the spectral analysis and present the results of broadband spectral modelling with AstroSat data. In §5, we attempt to constrain the mass and spin of the black hole including the accretion rate. Finally, in §6, we discuss the results of our spectro-temporal studies of the BH source GRS 1915105 and conclude.
2 Observation and Data Reduction
The source GRS 1915105 was observed during the period of June 11, 2016 (MJD 57550) to June 15, 2016 (MJD 57554) using Guaranteed Time (GT) of AstroSat (Agrawal et al., 2017) for ks (Observation ID: G05_189T01_9000000492). In this paper, we make use of the data from the imaging instrument SXT and the proportional counter LAXPC on board AstroSat. SXT (Singh et al., 2017) operates in the keV energy range. LAXPC (Antia et al., 2017) consists of three proportional counters (LAXPC10, LAXPC20 and LAXPC30) operating in the energy range of keV with a high temporal resolution of s (Yadav et al., 2016).
SXT data reduction is carried out using the software provided by SXT-POC111http://www.tifr.res.in/~astrosat_sxt/sxtpipeline.html at TIFR. Once the cleaned event files are generated using the pipeline, we use XSELECT tool to extract images, light curves and spectra. However, as the SXT time resolution is poor (0.28 s), we do not use it for temporal analysis. For spectral modelling, we use the redistribution matrix files (rmfs), ancillary response files (arfs) and the background spectral files provided by the SXT instrument team at TIFR222http://www.tifr.res.in/~astrosat_sxt/dataanalysis.html.
We use the software available at the AstroSat science support cell333http://astrosat-ssc.iucaa.in/?q=data_and_analysis for the extraction of light curves of source as well as background from the LAXPC data. The response files and software for data extraction are provided by LAXPC instrument team of TIFR444http://www.tifr.res.in/~astrosat_laxpc/LaxpcSoft.html. Further, we follow the procedures as described in Agrawal et al. (2018) and Sreehari et al. (2019) to extract energy spectra from both SXT and LAXPC observations. Once the light curves and energy spectra are generated, we carry out temporal and spectral modelling as detailed in §3 and §4.
3 Timing Analysis and Results
We generate the light curves by combining data from LAXPC10 and LAXPC20 with s binning for generating CCDs. CCDs are used to understand the hardness ratio variation and variability class of the source. Following this, we generate ms binned light curves for generating the power spectra. The modelling of power spectra and the obtained results are presented in §3.2.
3.1 Color-Color Diagram
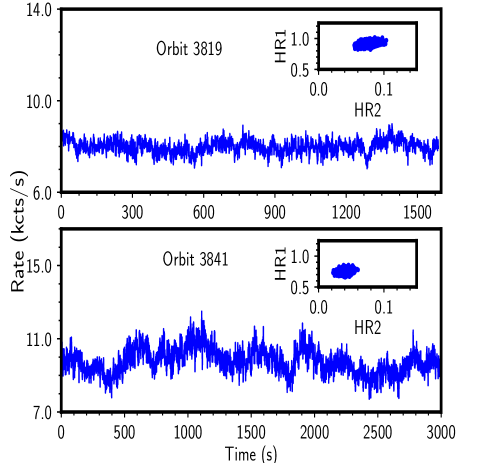
As mentioned before, we use light curves with 1 s binning for generating CCDs. The CCD is the variation of versus , where , and are the count rates in keV, keV and keV energy bands, respectively. The background subtracted and dead-time corrected (see equation 1) light curves in the energy band keV for the LAXPC observations on MJD 57551.04 (Orbit 3819) and MJD 57552.56 (Orbit 3841) are shown in Figure 1. The background count rate is in the range of 100 to 140 counts/sec. The CCDs are provided as inset in each panel which indicate that the maximum values of HR1 and HR2 for both the observations are less than and , respectively. Comparing the CCDs and X-ray variability with RXTE observations (Belloni et al., 2000), we classify that the source is in its class during our observational campaign. However, both HR1 and HR2 values are seen to decrease as the source count rate increases whereas the reverse trend is observed towards the end (see Fig. 4 and Table 1). These findings indicate the signature of soft state (see Table 2 for spectral parameters). In addition, we do not find HFQPOs in those observations where mean values of HR1 and HR2 (see Table 1 and §3.2). In all the remaining observations, we detect HFQPOs.
3.2 Temporal Properties
We generate power spectrum for each LAXPC observation considering a Nyquist frequency of 500 Hz in order to search for the presence of HFQPOs. We use intervals of bins and compute the power spectrum for each interval, which is then averaged to obtain the final power spectrum. A geometric binning factor of 1.03 is used for representing the power spectrum in frequency space. After generating the Leahy power spectrum (Leahy et al., 1983), we carry out dead-time () corrected Poisson noise subtraction following Agrawal et al. (2018); Sreehari et al. (2019). Dead-time corresponds to the time interval between the successive photon detection by the detector. This effectively affects the poisson noise level yielding the reduction of actual rms in the power spectrum. LAXPC has a dead-time of 42.5 s (Yadav et al., 2016). Following van der Klis (1988), we calculate the incident count rate () as
| (1) |
where refers to the detected count rate and is the number of proportional counter units used.
Thereafter, following Zhang et al. (1995, and references therein), we compute the dead-time affected Poisson noise power (). Besides affecting the noise level, dead-time also modulates the source rms. So, after subtracting level from the power spectrum, we correct for the dead-time effects on rms amplitude by scaling it using the relation given by,
| (2) |
where is the dead-time corrected rms and is the rms detected by the instrument (see Bachetti et al., 2015; Sreehari et al., 2019, for details).
We model the power density spectrum (PDS) using a combination of constant and Lorentzian features, and illustrate it in frequency (Hz) versus Hz plane. The Lorentzian has three parameters namely centroid frequency (), full width at half maximum () and normalization (norm). Here, a Lorentzian feature is adopted to define QPO, based on the values of its Quality factor (Q = ), significance and rms (see Sreehari et al., 2019, and references therein). The QPO rms is computed by finding the square root of the definite integral of the Lorentzian representing the QPO in Frequency-power space. The QPO significance is computed as the ratio of Lorentzian normalization to its negative error (see Alam et al., 2014; Sreehari et al., 2019, and references therein).
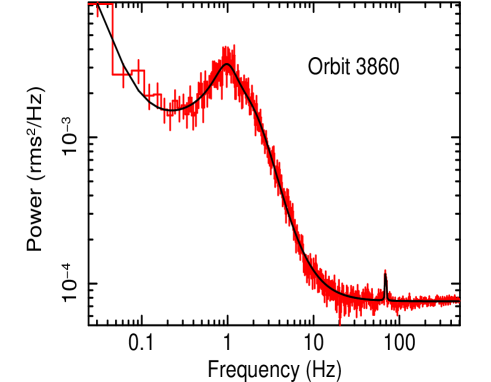
Figure 2 presents the PDS from combined LAXPC10 and LAXPC20 data corresponding to the Orbit 3860 in the frequency range from Hz to Hz. The PDS is modelled with multiple Lorentzians and a constant that yields . Since the detected HFQPOs are seen to lie within a narrow range of frequencies, for the purpose of representation, we model the power spectra in the frequency range Hz for all the observations.
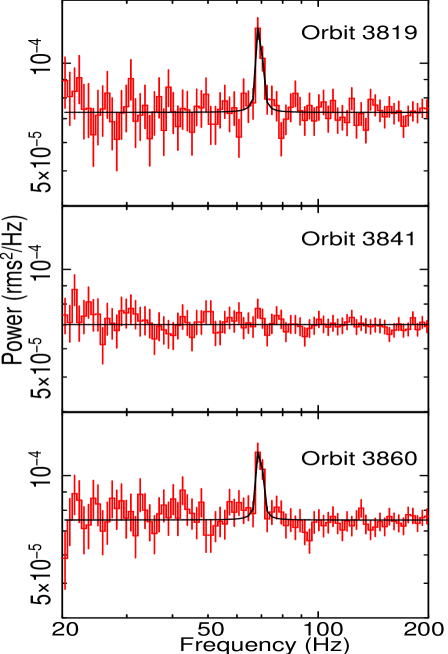
Following the above consideration, we fit the PDS in the said frequency range (, Hz) with a constant and a Lorentzian. The modelled PDS for three LAXPC observations are shown in Figure 3. The top panel (Orbit 3819) and the bottom panel (Orbit 3860) indicate detection of HFQPOs around 69 Hz. The middle panel representing the observation during Orbit 3841 does not indicate any HFQPO feature. Following Belloni et al. (2001), we calculate the normalization of the Lorentzian feature in this observation (Orbit 3841) by freezing the Lorentzian centroid at 68.83 Hz and width at 1.4 Hz from the previous observation. The corresponding upper limit on significance is only 0.61. During our AstroSat campaign, more such HFQPO signatures are detected having frequencies in the range of Hz. The model fitted parameters of these HFQPOs like centroid frequency, FWHM, significance and rms along with the HR variations are presented in Table 1. These detections are consistent with the RXTE observation of variable HFQPOs ( Hz), with an average of Hz (Morgan et al., 1997; Belloni & Altamirano, 2013).
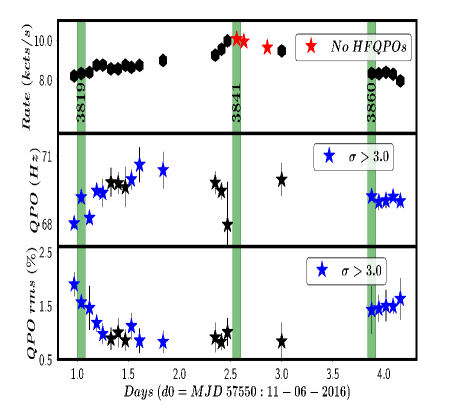
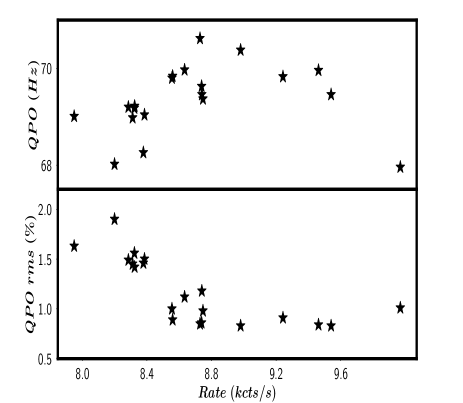
In Figure 4 (left), we present the time evolution of the source count rate (top panel), HFQPO frequency (middle panel) and QPO rms (bottom panel). The variation of count rate within the soft state spanned over a few days is also to be noted. In the top panel, the red stars indicate the observations in which HFQPOs are absent. In the middle and bottom panels, all the HFQPO detections are presented and the blue stars indicate the HFQPOs with significance above 3. Figure 4 (right) shows the correlation of QPO frequency and QPO rms with count rate. It is evident that as the source count rate increases and HR value decreases (see Table 1), the HFQPO rms reduces and eventually disappears. The vertical green bars indicate the observations during Orbits 3819, 3841 and 3860 that we present in Figure 3. From Table 1, we find that the percentage rms of HFQPO lies in the range of 0.83% to 1.90%. The dead-time correction factor for rms is obtained in the range 1.17 to 1.21. The HFQPO is weak or below the significance level of detection, when the source count rate peaks.
| MJD | Orbit | Exposure | (cts/s) | (cts/s) | QPO (Hz) | FWHM (Hz) | Significance () | rms (%) | HR1 | HR2 | /dof |
|---|---|---|---|---|---|---|---|---|---|---|---|
| 57550.97 | 3818 | 1982 | 6835 | 7996 | 68.02 | 2.82 | 7.75 | 1.90 0.23 | 0.92 | 0.08 | 48/74 |
| 57551.04 | 3819 | 1590 | 6919 | 8112 | 69.18 | 1.49 fixed | 6.94 | 1.56 0.11 | 0.91 | 0.08 | 43/75 |
| 57551.12 | 3820 | 1030 | 6954 | 8159 | 68.26 | 2.33 | 3.45 | 1.46 0.41 | 0.91 | 0.08 | 34/75 |
| 57551.19 | 3821 | 0791 | 7214 | 8520 | 69.46 | 1.27 | 4.17 | 1.18 0.17 | 0.88 | 0.07 | 50/75 |
| 57551.25 | 3822 | 1215 | 7223 | 8533 | 69.37 | 1.72 | 3.19 | 0.98 0.20 | 0.86 | 0.06 | 32/75 |
| 57551.33 | 3823 | 1638 | 7093 | 8352 | 69.84 | 1.72 fixed | 2.06 | 0.89 0.21 | 0.85 | 0.06 | 43/75 |
| 57551.40 | 3824 | 2063 | 7095 | 8355 | 69.78 | 1.67 | 2.16 | 1.00 0.27 | 0.83 | 0.06 | 32/75 |
| 57551.47 | 3825 | 2516 | 7162 | 8448 | 69.63 | 1.84 | 2.94 | 0.86 0.20 | 0.84 | 0.06 | 39/75 |
| 57551.53 | 3826 | 2941 | 7153 | 8435 | 69.97 | 2.73 | 3.86 | 1.12 0.25 | 0.84 | 0.06 | 46/75 |
| 57551.61 | 3827 | 3364 | 7224 | 8534 | 70.62 | 2.31 | 4.26 | 0.85 0.23 | 0.83 | 0.06 | 50/75 |
| 57551.84 | 3830 | 2953 | 7405 | 8787 | 70.38 | 2.04 | 3.84 | 0.83 0.21 | 0.82 | 0.05 | 34/75 |
| 57552.35 | 3838 | 1116 | 7586 | 9045 | 69.83 | 1.18 fixed | 1.63 | 0.91 0.28 | 0.77 | 0.04 | 42/75 |
| 57552.41 | 3839 | 2180 | 7793 | 9339 | 69.46 | 1.46 fixed | 2.49 | 0.83 0.16 | 0.77 | 0.04 | 26/75 |
| 57552.47 | 3840 | 2603 | 8089 | 9768 | 67.96 | 5.37 | 2.95 | 1.01 0.26 | 0.76 | 0.04 | 47/77 |
| 57552.56 | 3841 | 3027 | 8155 | 9865 | - | - | - | - | 0.75 | 0.04 | 39/77 |
| 57552.63 | 3843 | 2154 | 8076 | 9749 | - | - | - | - | 0.75 | 0.04 | 41/77 |
| 57552.86 | 3845 | 2402 | 7867 | 9446 | - | - | - | - | 0.76 | 0.04 | 38/77 |
| 57553.00 | 3848 | 1939 | 7738 | 9260 | 69.96 | 2.57 | 2.49 | 0.84 0.35 | 0.77 | 0.04 | 36/75 |
| 57553.88 | 3860 | 2381 | 6813 | 7966 | 69.22 | 2.53 | 3.74 | 1.42 0.44 | 0.88 | 0.07 | 45/75 |
| 57553.95 | 3862 | 2042 | 6918 | 8110 | 68.98 | 3.78 | 5.36 | 1.45 0.25 | 0.88 | 0.07 | 34/75 |
| 57554.02 | 3863 | 1755 | 6965 | 8176 | 69.03 | 3.35 | 5.23 | 1.50 0.29 | 0.88 | 0.07 | 38/75 |
| 57554.09 | 3864 | 1170 | 6888 | 8070 | 69.20 | 2.00 | 7.43 | 1.49 0.14 | 0.89 | 0.07 | 41/75 |
| 57554.16 | 3865 | 1156 | 6638 | 7728 | 69.01 | 2.55 | 4.61 | 1.63 0.39 | 0.90 | 0.08 | 36/75 |
The values for power spectral modelling are provided in Table 1. Modelling the PDS (Orbit 3860) in the frequency range Hz with only a constant yields a of . However, the presence of excess power above the constant level around 69 Hz indicates the presence of a QPO. This feature is further modelled with a Lorentzian apart from the constant resulting in an overall of . The decrease of from 1.25 to 0.6 suggests that HFQPO feature is significant and requires modelling. Moreover, we detect the Lorentzian feature at 69 Hz in several observations which indicates that it is not a random increase in amplitude and hence we argue that it is not a case of over-fitting.
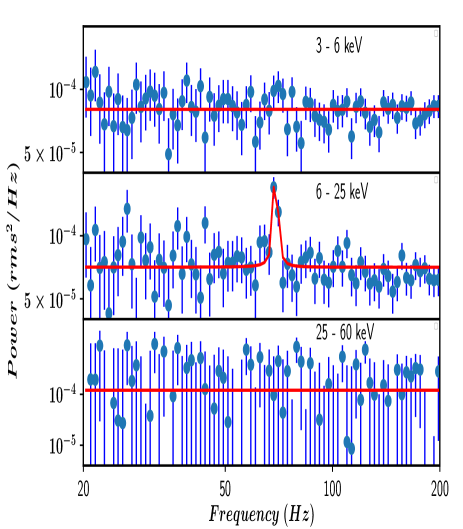
Since HFQPOs are detected in several observations, we intend to carry out energy dependent behaviour of these oscillations. For this purpose, we generate PDS from light curves in the energy range of keV, keV and keV and model them in the frequency range of Hz. Figure 5 shows the energy dependent PDS for MJD 57551.04 (Orbit 3819). It is evident that the HFQPO is present only in the keV energy band (middle panel) and not in the lower ( keV) and higher ( keV) energy bands. We find that the upper limit of the significance in the energy range keV and keV are and , respectively. The strong HFQPO feature (Q-factor , significance of and rms of %) in the keV energy band is found at Hz. All LAXPC observations of GRS 1915105 have similar power spectral features (non-detection of HFQPO signals) in the keV and keV band. However, the HFQPO strength (rms) and significance varies over the observations as can be seen from Table 1. The absence of HFQPO feature in keV energy band indicates that the QPOs are likely to be the result of an oscillating corona located in the vicinity of the black hole and it emits in keV energy band. In order to have better clarity on the energy dependence of HFQPOs and understand the emission processes, we carry out the broadband energy spectral modelling of AstroSat data of GRS 1915105 and present the results in §4.
| MJD (Orbit) | (keV) | (keV) | normnth | normPL | Flux (ergs/cm2/s) | |||
| Detection of HFQPOs | ||||||||
| 57551.33 (3823) | 0.3 | 2.25 0.08 | 1.79 0.07 | 8.1 | 2.94 0.12 | 15.8 | 3.09 | 440/415 = 1.06 |
| 57551.53 (3826) | 0.19 0.02 | 2.32 0.03 | 1.76 0.01 | 8.6 | 3.04 0.01 | 17.6 | 3.11 | 655/551 = 1.18 |
| 57551.84 (3830) | 0.1 | 2.23 0.02 | 1.73 0.03 | 8.9 | 3.04 0.04 | 15.5 | 3.22 | 737/628 = 1.17 |
| 57552.41 (3839) | 0.1 | 2.07 0.18 | 2.24 0.86 | 3.9 | 3.28 0.03 | 34.9 | 3.34 | 441/339 = 1.30 |
| 57553.88 (3860) | 0.1 | 2.43 0.13 | 1.74 0.06 | 7.0 | 3.09 0.04 | 25.5 | 3.07 | 615/547 = 1.12 |
| Non-detection of HFQPOs | ||||||||
| 57552.56 (3841) | 0.1 | 2.09 0.15 | 2.45 0.84 | 3.01 | 3.28 0.02 | 30 | 3.55 | 729/636 = 1.14 |
| Weakest HFQPO | ||||||||
4 Spectral Analysis and Results
To carry out the spectral analysis, we use simultaneous data from both SXT and LAXPC. The latest calibration files are provided by AstroSat mission team555http://astrosat-ssc.iucaa.in/?q=laxpcData. A systematic of 2% is added per spectral bin as suggested by Antia et al. (2017); Leahy & Chen (2019).
SXT spectra are extracted in the keV band, whereas dead-time corrected LAXPC spectra (Antia et al., 2017) are extracted in the energy range of keV (see Agrawal et al., 2018; Sreehari et al., 2019, for details). As there are only a few good quality data available from SXT in the database666https://astrobrowse.issdc.gov.in/astro_archive/archive/Home.jsp, we are able to generate broadband spectra only for those observations. Modelling of the SXT spectra indicates an nH column density (in atoms/cm2) in the range 5.93 1.01 to 6.07 1.19. We model the energy spectra with fixed nH of atoms/cm2 and the obtained spectral parameters are quoted in Table 2. The change in parameters due to the variation of nH is within the error bars of the values obtained by freezing nH at atoms/cm2. Gain correction is applied using gain fit routine of XSPEC on all the SXT spectra to account for the instrumental features peaks at and keV. Initially, we model the broadband spectra with phenomenological model combination Tbabs(diskbb powerlaw smedge) that yields a disc temperature of keV, photon index of for the observation on MJD 57551.33 (Orbit 3823) with a . Using cflux model, we estimate the disc contribution which is found to be 69.7% of the total flux. This indicates that the source is in thermally dominated soft state. This also corroborates the CCDs representing the light curve (, class) as a softer state of GRS 1915105.
In order to understand the physical processes leading to the emission from the source, we fit the broadband energy spectrum of Orbit 3823 with the thermal Comptonization model (nthComp in XSPEC; Zdziarski et al. (1996)). The fit resulted with as the higher energy part of the spectrum (above 30 keV) is not fitted with nthComp model. Upon inclusion of an additional power-law component, the combined models provide acceptable fit with . Hereafter, we carry out the broadband spectral modelling with the combined models defined as Tbabs(nthComp + powerlaw). The model parameters of nthComp are electron temperature () equal to keV, seed-photon temperature () of keV and photon-index () of . An additional powerlaw component with a photon-index () of is required to fit the high energy part of the spectrum (above keV). Following this approach, we model the broadband spectral data for all the available observations irrespective of the presence of HFQPOs (see Table 2).
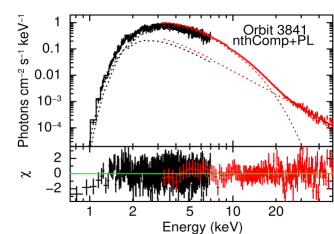
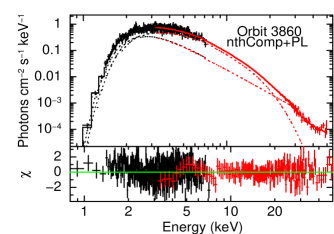
In the left panel of Figure 6, we depict the unfolded spectrum of an observation (MJD 57552.56, Orbit 3841) for which HFQPO feature is not seen in the PDS (middle panel of Figure 3). The fitted parameters are obtained as keV and , respectively. The powerlaw index in this case is obtained as . Further, we model the broadband energy spectrum for the observation on MJD 57553.88 (Orbit 3860) which shows a significant () detection of HFQPO in the PDS (bottom panel of Figure 3). In the right panel of Figure 6, we present the unfolded spectrum modelled with Tbabs(nthComp smedge powerlaw). The nthComp component yields and keV. The powerlaw component is seen to be strong with a steep photon index of . The additional smedge component which is not required for orbit , is however used to model the absorption feature around 7 keV. The model fitted parameters for all the broadband observations are presented in Table 2. It may also be noted that the energy spectral parameters for Orbit 3839, which has the detection of the weakest HFQPO (rms % and significance ) corresponds to a weak nthComp () and a strong powerlaw () contribution. We discuss the implications of these results in §6.
5 Estimation of Mass, Spin and Accretion rate
| MJD (Orbit) | Frac. Scattered () | (1018 g/s) | Mass (M⊙) | Esmedge (keV) | |||
|---|---|---|---|---|---|---|---|
| 57551.53 (3826) | 3.92 0.01 | 0.13 0.01 | 7.65 0.11 | 12.66 0.22 | 0.996 0.001 | 6.41 0.42 | (657/564=1.16) |
| 57551.84 (3830) | 3.83 0.01 | 0.09 0.01 | 7.73 0.07 | 12.75 0.16 | 0.996 0.001 | 6.44 0.40 | (733/629=1.16) |
| 57552.56 (3841) | 3.09 0.01 | 0.05 0.01 | 7.89 0.07 | 12.92 0.17 | 0.991 0.001 | 7.88 0.86 | (717/639=1.12) |
| 57553.88 (3860) | 4.80 0.01 | 0.55 0.01 | 7.05 0.10 | 12.85 0.24 | 0.995 0.001 | 5.08 0.70 | (662/559=1.18) |
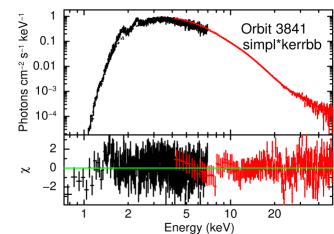
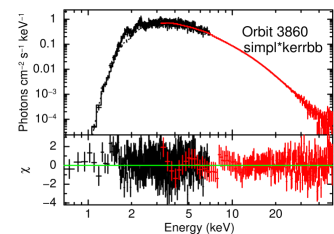
In this section, we present the results of broadband spectral modelling (Orbits 3826, 3830, 3841, 3860) to constrain the mass and spin of the source. While doing this, we use the kerrbb model (Li et al., 2005) along with the simpl model (Steiner et al., 2009) of XSPEC (Arnaud, 1996) to fit the spectra. The kerrbb model represents a thin, general relativistic multi temperature blackbody disc around a rotating black hole whereas the simpl is a Comptonization model in which a fraction of the seed photons is scattered into a power-law distribution. Following the spectral analysis method discussed in the previous section, we model the broadband observations with a combination of models as Tbabs(simpl * kerbb smedge)constant that results into acceptable fit with (see Table 3). The model fitted energy spectra for Orbits 3841 and 3860 are shown in Figure 7. We find that the model fitted parameters of black hole mass , accretion rate g/s and spin for the observation of Orbit 3841. Similarly, we obtain , g/s and for the observation of Orbit 3860. Interestingly, the accretion rate corresponding to non-detection of HFQPO (Orbit 3841) is higher than that in observations where HFQPO is detected. It is to be noted that two additional gaussians are used at keV and keV to account for the instrumental peaks at these energies, instead of using gain fit.
In Table 3, we present the spectral fit parameters for all broadband observations, where column represent observation date with Orbit number, photon index (), scattered fraction (), accretion rate (), black hole mass () in solar mass unit (), spin (), smedge energy () and (), respectively. The index () varies from , whereas scattered fraction of seed photons is minimum () when the HFQPO is absent and maximum () when the HFQPO signal is most significant. Adopting the source mass as obtained from the spectral fitting (see Table 3), and considering the source distance as kpc (Reid et al., 2014), we find that GRS 1915105 accretes at supper-Eddington rate of during the GT phase AstroSat observations under consideration.
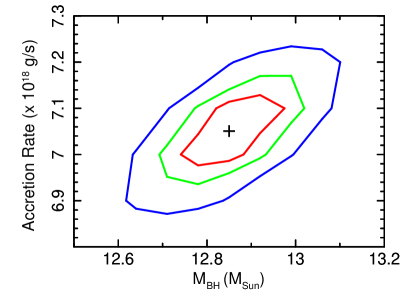
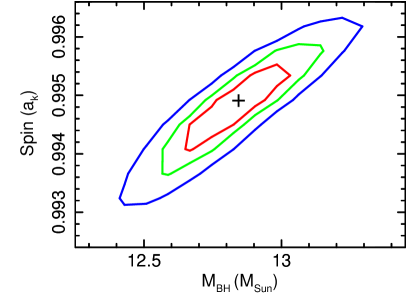
Further, we examine the dependence of accretion rate and spin on the mass of the source. Figure 8 (left) shows the confidence contours obtained for mass of the black hole and the accretion rate for the Orbit 3860. Similarly, in Figure 8 (right), we depict the confidence contours of mass and spin of the source for the same observation. It indicates that the black hole mass () lies in the range and spin () lies in the range . The red, green and blue curves represent contours of 68%, 90% and 99% confidence, respectively.
Since our goal is to estimate black hole parameters, we have also attempted with the kerrd model (Ebisawa et al., 2003). The spectral fits yields a mass range of 11.66 - 12.69 and accretion rate of 7.05 to 7.75 . The mass estimate from kerrd model is marginally lower than the estimates from kerrbb, while the accretion rate estimate from both models are consistent. It may be noted that kerrd model assumes fixed spin value as 0.998, whereas the spin is treated as free parameter in kerrbb model, besides accretion rate and mass. Because of that we prefer kerrbb model over kerrd model and quote the parameters from kerrbb model as our final result.
6 Discussion and Conclusion
In this paper, we study the spectro-temporal properties of GRS 1915105 using GT phase observations of the Astrosat data. The CCDs indicate that the source exhibits class variability (Belloni et al., 2000) with small hardness ratios (HR HR). During our observational campaign, GRS 1915105 was in the soft state and significant variations in the count rate (7728 - 9865 cts/s), HR1 (0.75 - 0.92) and HR2 (0.04 - 0.08) are observed. We also find that HFQPOs disappear at high count rates and the disk fraction varies from 51% to 69.7%. This result indicates that the source presumably was in a time varying soft state during our campaign.
We detect HFQPOs at Hz from the source during AstroSat observations. It is observed that the strength of the HFQPOs decreases and eventually disappears as the source count rate increases (see Figure 4) and hardness ratios decreases (see Figure 1 and Table 1). However, we have not observed significant change in the QPO frequency as the count rate varies. The dependence of QPO parameters on source intensity has been studied earlier by van der Klis et al. (1985), where they found a significant increase in frequency and decrease in strength of QPOs with increasing count rates. Cui (2000) found that HFQPOs disappear with an increase in accretion rate in LMXB systems, which is also seen in our analysis. On the other hand, the disappearance of LFQPOs in LMXBs is shown to be associated with radio flares (Fender et al., 2009; Nandi et al., 2013; Radhika & Nandi, 2014) and is followed by the subsequent softening of the energy spectra (Radhika et al., 2016). During our observations, the hardness ratios of the source (see Table 1) also indicate that the source becomes relatively softer when the HFQPOs are absent. From the energy dependent power spectra, it is evident that the HFQPOs are present only in the keV (see Figure 5) but not in the keV and keV energy bands. Following Belloni et al. (2001), we calculate the upper limit of the QPO significance in keV as and in keV as . The rms amplitude of the HFQPOs in our observations is found to vary within % and the frequencies of these HFQPOs lie in the range of Hz. Belloni & Altamirano (2013) also reported HFQPO of frequency Hz, using RXTE data of the same source. Recently, Belloni et al. (2019) reported a variable HFQPO in the range between Hz, where higher phase lags are observed in harder regions.
HFQPOs are detected in other BH-XRB sources, such as GRO J165540, XTE J1550564 and H 1743322 (Remillard & McClintock, 2006). Phase-lag studies of the 67 Hz QPO in GRS 1915105 (Cui, 1999; Méndez et al., 2013) indicates that the hard photons lag the soft photons. This is consistent with our scenario where soft radiation from the accretion disc is inverse-Comptonized within a compact corona around the black hole. A 66 Hz HFQPO was detected in the black hole binary source IGR J170913624 by Altamirano & Belloni (2012). They have discussed the possibility that this HFQPO ( Hz) detected in both GRS 1915105 and IGR J170913624 is linked to the physical processes that produce low-frequency structured variability exhibited by these two sources.
Several models have been proposed to explain the origin of these QPOs. The relativistic precession model by Stella & Vietri (1998) considers that HFQPOs are associated to the orbital frequency as well as the nodal and the periastron precession frequencies. Rezzolla et al. (2003) proposed a model where HFQPOs are attributed to the pressure mode oscillations of an accretion torus orbiting the black hole. Recently, in a theoretical attempt, Dihingia et al. (2019) showed that shock induced accretion solutions around a rapidly rotating stellar mass black hole are viable to account for such an HFQPO phenomenon. Interestingly, Varniere et al. (2020) explored the possibility of HFQPO generation resulting from vortices formed due to Rossby wave instability (RWI) at the inner edge of the accretion disc. As the centroid frequencies of the HFQPOs do not vary beyond a few percent, we conjecture that it perhaps originated from the vicinity of the source and therefore carries the imprint of the effect of strong gravity, namely the mass and spin of the black hole.
In order to explain the radiative properties of the accretion flow around the source, we carry out the broadband energy spectral modelling using combined SXT and LAXPC data in the keV energy range. Modelling of spectra with a multi-temperature disc blackbody (diskbb) along with a powerlaw indicates high disc contribution () to the total emitted radiative flux. We find relatively steeper photon index () and high disc temperature ( keV) that eventually indicate the source belongs to the soft state.
Next, to examine the physical processes and the spectral parameters, we model the spectra using nthComp and powerlaw. The photon index () is seen to be small and remain nearly constant () during the HFQPO observations whereas becomes large () when HFQPO is not detected (see Table 2). It may be noted that the seed photon temperature does not change appreciably ( keV) in these observations. We find electron temperature in the range keV (, an exponential roll over energy keV) and for broadband spectra. In addition, an extended corona seems to be present as well, because an additional powerlaw component with higher photon index () is required to model the higher energy part of the spectrum (above keV). Indeed, it may be plausible that the accretion flow harbours a cool and compact central corona that not only exhibits HFQPOs, but also emits high energy photons till keV (see Figures 5 and 6). Also, surrounding the inner compact corona, a diffuse but relatively hot extended ‘Compton’ corona may be present which is likely to produce hard X-ray photons up to keV. The existence of such an extended coronal structure around GRS 1915105 would be possible as the source may not swallow all the matter accreted at super-Eddington rate (Done et al., 2004; Punsly & Rodriguez, 2013).
The broadband spectra of observations with relatively higher rms of HFQPOs indicate a weaker extended corona () in comparison to those spectral observations where HFQPOs are absent (). Besides this, we notice from Table 2 that the observations with significant HFQPOs have a stronger () and harder () ‘compact corona’ than the observation (Orbit 3841) without an HFQPO. This is an indication that the origin of the HFQPO is due to the oscillations of the ‘compact corona’ that is represented by the nthComp model. The fact that the powerlaw is strong () and nthComp is comparatively weak () for Orbit 3839 which has the HFQPO with lowest rms (%) also supports our argument that the HFQPO is the result of a compact oscillating corona represented by the nthComp. Dihingia et al. (2019) indicated that HFQPOs at Hz in GRS 1915105 possibly originated due to the quasi-periodic modulation of a very compact inner region of the disc. It is noteworthy that the energy spectra of the source GRO J165540 corresponding to the HFQPOs of frequency 300 Hz (Remillard et al., 1999) and 450 Hz (Strohmayer, 2001a) possess strong Comptonized contribution extending beyond keV (Aktar et al., 2018). Meanwhile, Remillard et al. (2002) also pointed out that the HFQPOs perhaps originated because of the modulation of the compact Compton corona. Overall, we conjecture that the observed HFQPOs are the manifestation of the oscillations of a ‘hot’ and compact post-shock corona (Aktar et al., 2018; Dihingia et al., 2019).
In addition, we model the broadband energy spectra of all the observations using kerrbb model and estimate mass and spin of the source along with the flow accretion rate. Our findings reveal that the mass of the source () lies in the range (see Table 3). This estimate is consistent and better constrained compared to the earlier estimates (Greiner et al., 2001; Reid et al., 2014). We find the spin of the source () in the range with confidence whereas the previous estimate of spin value was reported as (Shafee et al., 2006; Blum et al., 2009; Miller et al., 2013). The fraction of Compton up-scattering () is found to be as high as when a strong HFQPO is detected (Orbit 3860), whereas is low () during the absence of HFQPO (Orbit 3841). The index of the simpl convolution model is the lowest () during the non-detection of HFQPO and highest () during the detection of a strong HFQPO (Orbit 3860). Our results also indicate that the source accretes at super-Eddington rate in the range during GT phase of AstroSat observations.
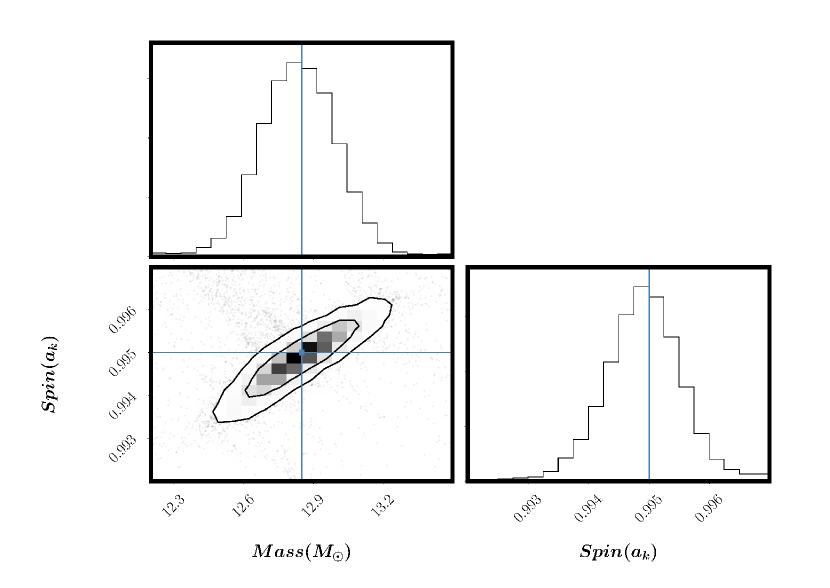
In order to improve the error estimation, we have carried out Markov Chain Monte Carlo (MCMC) simulations. We use the Goodman-Weare chain algorithm (Goodman & Weare, 2010) in XSPEC (Arnaud, 1996) with walkers parameter set to 32. The chain length is taken as 15,000 and burn length is fixed to 5,000. However, there is no significant improvement in the error estimations. We also cross-check our error estimations using the MCMC hammer algorithm (emcee777https://emcee.readthedocs.io/en/stable/#) based on Foreman-Mackey et al. (2013). These results are limited by the unavailability of an analytical approximation for kerrbb model. The results from emcee estimation of spin and mass parameters for Orbit 3860 are shown in Figure 9. The estimate of mass of the black hole for this observation is and the spin is estimated to be at 90% confidence level. It is to be noted that the errors quoted in this paper are purely statistical and systematics are not accounted for. The top and right panels show mass and spin distribution respectively, whereas the corner panel shows the confidence contours considering both mass and spin. The contour plot from MCMC simulations and the contour generated from XSPEC (see right panel of Figure 8) using steppar functions are consistent.
Finally, we emphasize that GRS 1915105 is a maximally rotating, comparatively higher mass X-ray binary source accreting at supper-Eddington rate and exhibiting HFQPO features. In addition, we point out that for the first time to the best of our knowledge, the mass, spin, accretion rate and HFQPOs of GRS 1915105 are concurrently examined and reported using AstroSat observations.
Acknowledgments
We thank the anonymous reviewer for his/her suggestions and comments that helped us to improve the quality of this manuscript. AN, VKA, MCR thank DD, PDMSA and Director, URSC for encouragement and continuous support to carry out this research. SH thanks Department of Physics, IIT Guwahati for providing the facilities to complete part of this work. This research made use of the data obtained through GT phase of AstroSat observations. The authors thank the SXT-POC of TIFR and the LAXPC team of IUCAA and TIFR for providing the data extraction software for the respective instruments.
Data Availability
Data used for this publication are currently available at the Astrobrowse (AstroSat archive) website (https://astrobrowse.issdc.gov.in/astro_archive/archive) of the Indian Space Science Data Center (ISSDC).
References
- Agrawal et al. (2017) Agrawal P. C., et al., 2017, Journal of Astrophysics and Astronomy, 38, 30
- Agrawal et al. (2018) Agrawal V. K., Nandi A., Girish V., Ramadevi M. C., 2018, MNRAS, 477, 5437
- Aktar et al. (2018) Aktar R., Das S., Nandi A., Sreehari H., 2018, Journal of Astrophysics and Astronomy, 39, 17
- Alam et al. (2014) Alam M. S., Dewangan G. C., Belloni T., Mukherjee D., Jhingan S., 2014, MNRAS, 445, 4259
- Altamirano & Belloni (2012) Altamirano D., Belloni T., 2012, ApJ, 747, L4
- Antia et al. (2017) Antia H. M., et al., 2017, ApJS, 231, 10
- Arnaud (1996) Arnaud K. A., 1996, XSPEC: The First Ten Years. p. 17
- Bachetti et al. (2015) Bachetti M., et al., 2015, ApJ, 800, 109
- Belloni & Altamirano (2013) Belloni T. M., Altamirano D., 2013, MNRAS, 432, 10
- Belloni & Motta (2016) Belloni T. M., Motta S. E., 2016, in Bambi C., ed., Astrophysics and Space Science Library Vol. 440, Astrophysics of Black Holes: From Fundamental Aspects to Latest Developments. p. 61 (arXiv:1603.07872), doi:10.1007/978-3-662-52859-4_2
- Belloni et al. (2000) Belloni T., Klein-Wolt M., Méndez M., van der Klis M., van Paradijs J., 2000, A&A, 355, 271
- Belloni et al. (2001) Belloni T., Méndez M., Sánchez-Fernández C., 2001, A&A, 372, 551
- Belloni et al. (2005) Belloni T., Homan J., Casella P., van der Klis M., Nespoli E., Lewin W. H. G., Miller J. M., Méndez M., 2005, A&A, 440, 207
- Belloni et al. (2006) Belloni T., Soleri P., Casella P., Méndez M., Migliari S., 2006, MNRAS, 369, 305
- Belloni et al. (2019) Belloni T. M., Bhattacharya D., Caccese P., Bhalerao V., Vadawale S., Yadav J. S., 2019, MNRAS, 489, 1037
- Blum et al. (2009) Blum J. L., Miller J. M., Fabian A. C., Miller M. C., Homan J., van der Klis M., Cackett E. M., Reis R. C., 2009, ApJ, 706, 60
- Castro-Tirado et al. (1992) Castro-Tirado A. J., Brandt S., Lund N., 1992, IAU, 5590
- Chakrabarti & Titarchuk (1995) Chakrabarti S., Titarchuk L. G., 1995, ApJ, 455, 623
- Cui (1999) Cui W., 1999, ApJ, 524, L59
- Cui (2000) Cui W., 2000, ApJ, 534, L31
- Cui et al. (1998) Cui W., Zhang S. N., Chen W., 1998, ApJ, 492, L53
- Dihingia et al. (2019) Dihingia I. K., Das S., Maity D., Nand i A., 2019, MNRAS, 488, 2412
- Done et al. (2004) Done C., Wardziński G., Gierliński M., 2004, MNRAS, 349, 393
- Ebisawa et al. (2003) Ebisawa K., Życki P., Kubota A., Mizuno T., Watarai K.-y., 2003, ApJ, 597, 780
- Fender et al. (2009) Fender R. P., Homan J., Belloni T. M., 2009, MNRAS, 396, 1370
- Feroci et al. (1999) Feroci M., Matt G., Pooley G., Costa E., Tavani M., Belloni T., 1999, A&A, 351, 985
- Foreman-Mackey et al. (2013) Foreman-Mackey D., Hogg D. W., Lang D., Goodman J., 2013, Publications of the Astronomical Society of the Pacific, 125, 306
- García et al. (2014) García J., et al., 2014, ApJ, 782, 76
- Goodman & Weare (2010) Goodman J., Weare J., 2010, Communications in Applied Mathematics and Computational Science, 5, 65
- Greiner et al. (2001) Greiner J., Cuby J. G., McCaughrean M. J., 2001, Nature, 414, 522
- Grove et al. (1998) Grove J. E., Johnson W. N., Kroeger R. A., McNaron-Brown K., Skibo J. G., Phlips B. F., 1998, ApJ, 500, 899
- Hannikainen et al. (2005) Hannikainen D. C., et al., 2005, A&A, 435, 995
- Iyer et al. (2015) Iyer N., Nandi A., Mandal S., 2015, ApJ, 807, 108
- Klein-Wolt et al. (2002) Klein-Wolt M., Fender R. P., Pooley G. G., Belloni T., Migliari S., Morgan E. H., van der Klis M., 2002, MNRAS, 331, 745
- Leahy & Chen (2019) Leahy D. A., Chen Y., 2019, ApJ, 871, 152
- Leahy et al. (1983) Leahy D. A., Darbro W., Elsner R. F., Weisskopf M. C., Sutherland P. G., Kahn S., Grindlay J. E., 1983, ApJ, 266, 160
- Li et al. (2005) Li L.-X., Zimmerman E. R., Narayan R., McClintock J. E., 2005, ApJS, 157, 335
- Méndez et al. (2013) Méndez M., Altamirano D., Belloni T., Sanna A., 2013, MNRAS, 435, 2132
- Merloni et al. (1999) Merloni A., Vietri M., Stella L., Bini D., 1999, MNRAS, 304, 155
- Miller et al. (2013) Miller J. M., et al., 2013, ApJ, 775, L45
- Morgan et al. (1997) Morgan E. H., Remillard R. A., Greiner J., 1997, ApJ, 482, 993
- Nandi et al. (2012) Nandi A., Debnath D., Mandal S., Chakrabarti S. K., 2012, A&A, 542, A56
- Nandi et al. (2013) Nandi A., Radhika D., Seetha S., 2013, in Astronomical Society of India Conference Series. pp 71–77 (arXiv:1308.4567)
- Nowak et al. (1997) Nowak M. A., Wagoner R. V., Begelman M. C., Lehr D. E., 1997, ApJ, 477, L91
- Punsly & Rodriguez (2013) Punsly B., Rodriguez J., 2013, ApJ, 764, 173
- Radhika & Nandi (2014) Radhika D., Nandi A., 2014, Advances in Space Research, 54, 1678
- Radhika et al. (2016) Radhika D., Nandi A., Agrawal V. K., Seetha S., 2016, MNRAS, 460, 4403
- Radhika et al. (2018) Radhika D., Sreehari H., Nandi A., Iyer N., Mand al S., 2018, Ap&SS, 363, 189
- Ratti et al. (2012) Ratti E. M., Belloni T. M., Motta S. E., 2012, Monthly Notices of the Royal Astronomical Society, 423, 694
- Rebusco (2008) Rebusco P., 2008, New Astron. Rev., 51, 855
- Reid et al. (2014) Reid M. J., McClintock J. E., Steiner J. F., Steeghs D., Remillard R. A., Dhawan V., Narayan R., 2014, ApJ, 796, 2
- Remillard & McClintock (2006) Remillard R. A., McClintock J. E., 2006, ARA&A, 44, 49
- Remillard et al. (1999) Remillard R. A., Morgan E. H., McClintock J. E., Bailyn C. D., Orosz J. A., 1999, ApJ, 522, 397
- Remillard et al. (2002) Remillard R. A., Muno M. P., McClintock J. E., Orosz J. A., 2002, ApJ, 580, 1030
- Rezzolla et al. (2003) Rezzolla L., Yoshida S., Maccarone T. J., Zanotti O., 2003, MNRAS, 344, L37
- Seward & Charles (2010) Seward F. D., Charles P. A., 2010, Exploring the X-ray Universe. Cambridge University Press, 2010. ISBN: 9780521884839
- Shafee et al. (2006) Shafee R., McClintock J. E., Narayan R., Remillard R. A., Davis S. W., Li L., 2006, in AAS/High Energy Astrophysics Division #9. AAS/High Energy Astrophysics Division. p. 1.86
- Shakura & Sunyaev (1973) Shakura N. I., Sunyaev R. A., 1973, A&A, 24, 337
- Singh et al. (2017) Singh K. P., Stewart G. C., Westergaard N. J., Bhattacharayya S., Chandra et al. S., 2017, Journal of Astrophysics and Astronomy, 38, 29
- Sreehari et al. (2019) Sreehari H., Ravishankar B. T., Iyer N., Agrawal V. K., Katoch T. B., Mandal S., Nand i A., 2019, MNRAS, 487, 928
- Stefanov (2014) Stefanov I. Z., 2014, MNRAS, 444, 2178
- Steiner et al. (2009) Steiner J. F., Narayan R., McClintock J. E., Ebisawa K., 2009, PASP, 121, 1279
- Stella & Vietri (1998) Stella L., Vietri M., 1998, ApJ, 492, L59
- Strohmayer (2001a) Strohmayer T. E., 2001a, ApJ, 552, L49
- Strohmayer (2001b) Strohmayer T. E., 2001b, ApJ, 554, L169
- Sunyaev & Titarchuk (1980) Sunyaev R. A., Titarchuk L. G., 1980, A&A, 86, 121
- Tanaka & Lewin (1995) Tanaka Y., Lewin W. H. G., 1995, X-ray Binaries, pp 126–174
- Varniere et al. (2020) Varniere P., Vincent F. H., Casse F., 2020, A&A, 638, A33
- Vilhu et al. (2001) Vilhu O., Poutanen J., Nikula P., Nevalainen J., 2001, ApJ, 553, L51
- Vincent et al. (2013) Vincent F. H., Meheut H., Varniere P., Paumard T., 2013, A&A, 551, A54
- Yadav et al. (2016) Yadav J. S., et al., 2016, ApJ, 833, 27
- Zdziarski (2014) Zdziarski A. A., 2014, MNRAS, 444, 1113
- Zdziarski et al. (1996) Zdziarski A. A., Johnson W. N., Magdziarz P., 1996, MNRAS, 283, 193
- Zdziarski et al. (2001) Zdziarski A. A., Grove J. E., Poutanen J., Rao A. R., Vadawale S. V., 2001, ApJ, 554, L45
- Zhang et al. (1995) Zhang W., Jahoda K., Swank J. H., Morgan E. H., Giles A. B., 1995, ApJ, 449, 930
- van der Klis (1988) van der Klis M., 1988, in Ögelman H., van den Heuvel E. P. J., eds, NATO Advanced Science Institutes (ASI) Series C Vol. 262, NATO Advanced Science Institutes (ASI) Series C. Kluwer Academic Publishers, Dordrecht, p. 27
- van der Klis et al. (1985) van der Klis M., Jansen F., van Paradijs J., Lewin W. H. G., van den Heuvel E. P. J., Trumper J. E., Szatjno M., 1985, Nature, 316, 225