Five New Post-Main-Sequence Debris Disks with Gaseous Emission
Abstract
Observations of debris disks, the products of the collisional evolution of rocky planetesimals, can be used to trace planetary activity across a wide range of stellar types. The most common end points of stellar evolution are no exception as debris disks have been observed around several dozen white dwarf stars. But instead of planetary formation, post-main-sequence debris disks are a signpost of planetary destruction, resulting in compact debris disks from the tidal disruption of remnant planetesimals. In this work, we present the discovery of five new debris disks around white dwarf stars with gaseous debris in emission. All five systems exhibit excess infrared radiation from dusty debris, emission lines from gaseous debris, and atmospheric absorption features indicating on-going accretion of metal-rich debris. In four of the systems, we detect multiple metal species in emission, some of which occur at strengths and transitions previously unseen in debris disks around white dwarf stars. Our first year of spectroscopic follow-up hints at strong variability in the emission lines that can be studied in the future, expanding the range of phenomena these post-main-sequence debris disks exhibit.
1 Introduction
Planetary debris is a common feature of young stars, with detections of circumstellar debris disks spanning a wide range of stellar spectral classes and properties (Wyatt, 2008). Observations of the dusty and gaseous components of the debris disks provide a unique view of planetary formation, as their structures and evolution reveal complex planetary formation histories (Hughes et al., 2018). In a pleasing juxtaposition, planetary destruction results in a different class of debris disks around white dwarf stars with many of the same observable characteristics, such as excess infrared radiation from dusty debris (Zuckerman & Becklin, 1987; Graham et al., 1990) and emission lines from gaseous debris (Gänsicke et al., 2006). For recent reviews of these observation properties, see Farihi (2016) and Chen et al. (2020).
Debris disks around white dwarf stars are largely agreed to be the product of the tidal disruption of a planetary body that was scattered onto a highly eccentric orbit, and passed within the tidal disruption radius of the white dwarf star (Jura, 2003; Veras et al., 2014). Unlike their main-sequence counterparts, debris disks around white dwarf stars are faint and compact with outer radii on the order of one solar radius, and often escape detection (Koester et al., 2014; Rocchetto et al., 2015; Bonsor et al., 2017). Despite these challenges, observations of white dwarf debris disks provide an opportunity to learn about the evolution of debris disks, as their compact nature leads to high levels of variability on short timescales that has been observed on timescales ranging from hours, to months, to years.
Focused studies on the dusty components of individual systems reveal stochastic increases and gradual decays in infrared fluxes, suggesting collisional dust production (Farihi et al., 2018a) and disruption events (Xu & Jura, 2014; Wang et al., 2019), similar to what has been observed around main-sequence debris disks (Su et al., 2019). Statistical studies of the larger sample indicate this type of variability could be widespread (Swan et al., 2019b), albeit not as pronounced in most systems.
Some of these debris disks also host observable gaseous components in addition to dusty components. The gaseous components in white dwarf debris disks offer the chance for ground-based follow-up via moderate- and high-resolution spectroscopy of absorption and emission lines. These features exhibit a wide range of evolution, including broad profile asymmetry shifts consistent with the precession of global patterns within the disk (Manser et al., 2016b, a; Hartmann et al., 2016; Dennihy et al., 2018; Cauley et al., 2018; Fortin-Archambault et al., 2020) and changes in strength associated with gas production and depletion (Wilson et al., 2014). Unfortunately, systems with observable gaseous components are rare. Discoveries of systems with gas in absorption are limited by strict inclination constraints, while white dwarf stars with gaseous components in emission are estimated to have an occurrence rate among all white dwarf stars of just 0.067 percent, with fewer than ten such systems confirmed (Manser et al., 2020).
In this paper, we present the follow-up of five new white dwarf stars that host debris disks with gaseous debris in emission. All five systems show signs of accretion of metal-rich debris onto the white dwarf surface, strong infrared excesses indicative of dusty debris, and double-peaked emission lines from gaseous debris in a metal-rich circumstellar environment. Three of the systems show significant evolution of their gaseous emission features over the first year of monitoring, and others exhibit multiple strong metal species in emission, expanding the range of phenomena these systems observe.
We begin by discussing the initial discovery of the targets and the data collected in their follow-up. Next we examine the properties of the white dwarf host star, including the confirmation of atmospheric pollution from the recent accretion of metal-rich material. We continue by presenting the excess infrared radiation for each system, which traces the dusty component of the debris disk surrounding the white dwarf star. Finally we explore the emission lines emanating from the gaseous components of the debris disks, including the different metal species observed to be in emission and early results on the variability of the emission lines. We close with a brief discussion of the new systems and their addition to the sample of white dwarf stars with observable debris disks.
2 Data Collection
With the announcement of hundreds of thousands of new white dwarf stars from the second Gaia Data Release (Jiménez-Esteban et al., 2018; Gentile Fusillo et al., 2019), several hundred new debris disk candidates have been discovered around white dwarf stars by searching for excess infrared radiation consistent with dusty debris (Rebassa-Mansergas et al. 2019; Xu et al. 2020, submitted to ApJ). Spectroscopic follow-up of these samples is ongoing, and here we present our observations of five debris disks around white dwarf stars which show gaseous debris in emission in addition to their infrared excess. These systems were independently discovered by and are also discussed in Melis et al. 2020. In the Gaia white dwarf candidate catalog of Gentile Fusillo et al. (2019), the white dwarf stars are identified as WDJ034736.69+162409.73, WDJ061131.70693102.15, WDJ064405.23035206.42, WDJ162259.65+584030.90, and WDJ210034.65+212256.89. For the remainder of this work they will be referred to as WD J0347+1624, WD J06116931, WD J06440352, WD J1622+5840, and WD J2100+2122 respectively.
These objects belong to a class of white dwarf debris disk systems that provide three different observables to study the circumstellar environment and its interaction with the white dwarf star: atmospheric pollution from the ongoing accretion of metal-rich material at the white dwarf surface, excess infrared radiation from the dusty component of the debris disks, and broad emission lines from the gaseous component of the debris disks. The study of all three of these observables requires ground- and space-based follow-up, utilizing photometric and spectroscopic techniques (e.g. Melis et al. 2010). Here we present the spectroscopic and photometric data collected for the initial characterization of the five systems discussed in this paper.
2.1 Spectroscopic Follow-up
We collected broad-band and high-resolution spectroscopic data for each target to characterize the white dwarf stellar atmosphere and to search for signs of ongoing accretion from the circumstellar material. In addition, several epochs of spectroscopic follow-up were dedicated to searching for variability in the emission lines. Details including the full wavelength coverage, exposure times, and resolving power for each observation are given in the Appendix in Table 4.
Gemini/GMOS: We used the Gemini Multi-Object Spectrographs (GMOS; Hook et al. 2004; Gimeno et al. 2016) on both Gemini-N and Gemini-S to perform our initial search for emission features as part of programs GN-2019A-FT-202 and GS-2019A-FT-201. These observations were focused on detection of the calcium infrared triplet emission feature at 850 nm and used the R400 grating with the 0.5 arcsecond slit for a resolving power of 1900. In addition, we later utilized a higher-resolution setup to confirm the emission features detected in WD J1622+5840 that included the R831 grating with the 0.5 arcsecond slit for a resolving power of 3800 as part of program GN-2019A-FT-209. The GMOS data were processed using a combination of the Gemini IRAF package and an optimal extraction routine based on the methods described in Marsh (1989).
VLT/X-Shooter: We observed four of our targets with the X-Shooter wide-band intermediate-resolution spectrograph on the Very Large Telescope (Vernet et al., 2011) in stare mode, using the 1.0 arcsecond slit aperture for the UVB arm and 0.9 arcsecond slit aperture for the VIS arm as part of programs 0103.C-0431(B), 0104.C-0107(A), and 1103.D-0763(D). The X-Shooter data for 0103.C-0431(B), 0104.C-0107(A) were reduced by the ESO quality control group, and the data for 1103.D-0763(D) were reduced using the standard procedures within the Reflex111http://www.eso.org/sci/software/reflex/ reduction tool developed by ESO. Telluric line removal was performed on the reduced spectra using MOLECFIT (Smette et al., 2015; Kausch et al., 2015). The X-Shooter spectra serve multiple purposes, providing broad spectroscopic coverage for spectral classification, sufficient resolution for the detection of narrow absorption lines, and coverage of the emission features including the calcium infrared triplet.
Keck/HIRES: To probe for the narrow absorption lines that confirm the white dwarf star is accreting material, we collected high-resolution echelle spectroscopy using the blue collimator of the High Resolution Echelle Spectrometer (HIRESb; Vogt et al. 1994) on the Keck-1 10-m telescope for three of our targets visible from the northern hemisphere. The Keck HIRES data were reduced with the MAKEE222https://www.astro.caltech.edu/~tb/makee/ package, and we produced order-merged, normalized, signal-to-noise weighted combinations in regions of interest around known transitions to search for narrow absorption features.
SOAR/Goodman: The Goodman spectrograph on the SOAR 4-m telescope (Clemens et al., 2004) was employed to confirm the presence of and search for variability in the calcium infrared triplet emission features detected in all five systems. We used the 1200l-R grating with the 1.0 arcsecond slit for a resolving power of 3000. The data were reduced using a custom set of Python-based tools and an optimal extraction routine based on the methods described in Marsh (1989).
2.2 Photometric Follow-up
We collected infrared photometry for each system using ground- and space-based facilities. Below we discuss the telescopes and instruments used, including details on the data processing methods. Additional details including the the filters and exposure times used are given in the Appendix in Table 5.
Gemini-N/NIRI: J, H, and K-band photometry was collected using the Near InfraRed Imager and spectrograph at Gemini-North (NIRI; Hodapp et al. 2003) for our two northernmost targets, WD J1622+5840 and WD J2100+2122, as part of program GN-2019A-Q-303. The data were processed using DRAGONS (Data Reduction for Astronomy from Gemini Observatory North and South) v2.1.0, and the photometry was calibrated using nearby sources from the 2MASS All-Sky Point-Source Catalog (2MASS; Skrutskie et al. 2006) as reference stars. The NIRI J, H, and K filters are based on the Mauna-Kea Observatories (MKO) near-infrared system (Simons & Tokunaga, 2002), and published color transformations were used to transform the 2MASS photometry to the MKO system prior to determining a zero-point for each combined image (Leggett et al., 2006; Hodgkin et al., 2009).
Gemini-S/Flamingos-2: J, H, and Ks-band photometry was collected using the Flamingos-2 near-infrared wide-field imager and spectrograph at Gemini-South (Flamingos2; Eikenberry et al. 2004) for the three remaining targets as part of programs GS-2018B-FT-204 and GS-2018B-Q-404. The data were processed using DRAGONS v2.1.0, and and the photometry was calibrated using nearby 2MASS sources as reference stars. The Flamingos-2 J and H filters are based on the MKO filter set, while the Ks filter is similar to the 2MASS Ks filter (Leggett et al., 2015), and the same color transformation were used to transform the 2MASS J and H photometry for the calibration sources prior to determining a zero-point for each combined image.
Spitzer/IRAC : We collected 3.6 and 4.5 m photometry using the Infrared Array Camera on Spitzer as part of program 14220 (IRAC; Fazio et al. 2004). Eleven frames were taken using 30 s exposures with the medium-sized cycling dither pattern, resulting in 330 s of total integration in each channel. We produced fully calibrated mosaic images for each target using the MOPEX software package (Makovoz et al., 2006) following the recipes outlined for point-source extraction in the Spitzer Data Analysis Cookbook v6.0. PRF-fitted photometry was conducted on each target using APEX, with the appropriate corrections applied.
WD J06116931 was not included as part of this program, but fell within the field-of-view of program 70062 of Cycle 10 (PI: J. Davy Kirkpatrick). The target is identified near the edge of the dither pattern in IRAC Ch 1, presenting some doubt of the measurement as there are several nearby visual artifacts in the fully reduced CBCD frames. We performed aperture photometry on the CBCD frames with a small aperture to avoid the visual artifacts. Aperture corrections were applied as recommended in the IRAC Instrument Handbook.
3 White Dwarf Atmospheric Properties and Signs of Accretion
Our broad-band and high-resolution spectroscopic follow-up for each target serves to characterize the white dwarf stellar atmosphere and to search for signs of ongoing accretion from the circumstellar material. For stellar classification, we present our broad-band spectra in Figure 1 and the spectral type and atmospheric parameters of each target are given in Table 1. The five systems span a broad range of stellar parameters, but we note the particularly high effective temperature of the white dwarf star in WD J2100+2122. At just over 25,000 K, it is the hottest white dwarf known to host dust and gaseous debris in emission (see Table 2 of Manser et al. 2016a), and the effects of this high stellar temperature on the emission spectra are discussed below.
Ongoing atmospheric accretion is a key property of all known white dwarf stars that host debris disks (Kilic et al., 2006). The most commonly detected feature at optical wavelengths for metal-polluted white dwarf stars is the Ca K feature at 3934 Å (Zuckerman et al., 2003). We produce normalized cutouts of the region surrounding this feature (Figure 2), and detect narrow Ca K absorption features in the spectra of all five systems. While additional metal species are detected in some targets (e.g. Mg, Fe, Si), we leave the detailed atmospheric abundance studies for future works.
To confirm the Ca K is atmospheric, we compare its radial velocity () to the apparent white dwarf stellar velocity () in the heliocentric corrected reference frame. The apparent velocity of the the white dwarf star includes contributions from a gravitational redshift due to the strong surface gravity and the systemic velocity. For the stars with hydrogen-dominated atmospheres (WD J0347+1624, WD J06116931 and WD J2100+2122), we measure the apparent velocity by fitting a Gaussian profile to the sharp, non-local thermodynamic equilibrium (NLTE) cores of the hydrogen Balmer series. At the signal-to-noise of our observations, both the H and H NLTE line cores are detected. For the stars with helium-dominated atmospheres (WD J06440352 and WD J1622+5840), the He I features at 4471 Å and 5876 Å are likewise fit with a Gaussian profile and all available measurements are combined to produce the final .
The individual line measurements and the epoch of the spectra used to measure the radial velocities are given in Table 1. In white dwarf atmospheres, differential pressure shifts can result in radial velocity differences on the order of a few km s-1; see Falcon et al. (2012) for a discussion on this effect on measurements of the apparent velocities of white dwarf stars with both hydrogen and helium features visible. We do not account for these systematic differences in the reported velocities in Table 1, but note that they are on the order of our uncertainties.
| Name | SpType | Teff | UT Date | |||||||
|---|---|---|---|---|---|---|---|---|---|---|
| (K) | (cm s-2) | 6562.7 | 4861.3 | 5875.6 | 4471.5 | 3933.7 | ||||
| WD J0347+1624 | DAZ | 20,620 | 7.89 | 2019 Dec 05 | - | 278 | - | - | 27 | 18 |
| WD J06116931 | DAZ | 16,550 | 7.87 | 2019 Oct 15 | 702 | 625 | - | - | 68 | 67 |
| WD J06440352 | DBAZ | 20,850 | 8.17 | 2019 Sep 14 | 994 | - | 954 | 1045 | 987 | 922 |
| WD J1622+5840 | DBAZ | 19,560 | 7.88 | 2019 Jul 12 | - | - | -172 | -183 | -174 | -211 |
| WD J2100+2122 | DAZ | 25,320 | 8.07 | 2019 Jul 10 | - | 62 | - | - | 62 | 51 |
Note. — White dwarf stellar effective temperature Teff and surface gravity are taken from Gentile Fusillo et al. (2019). All velocities are given in units of km s-1. For each velocity measurement we give the reference wavelength in air of the lines used in units of Å, taken from the NIST Atomic Spectral Database.
To measure the radial velocity of the Ca K absorption feature, we fit a Gaussian profile to the normalized spectra shown in Figure 2. The five systems in our sample exhibit a wide range of morphology in their Ca K absorption profiles. In fact, WD J06440352 is the only target that appears to have a simple absorption profile that is well-described by a single Gaussian function. The Ca K absorption features in both WD J0347+1624 and WD J06116931 are contaminated by broad, double-peaked emission from the gaseous debris, affecting our continuum normalization and Gaussian fits. This systematic uncertainty is not captured in our reported measurements and the measured Ca K velocity for both systems agrees with the measured white dwarf apparent velocity within the reported uncertainties.
The Ca K absorption feature observed in the spectra of WD J2100+2122 has a clear two-component structure. To determine the separation of the two components, we simultaneously fit two Gaussian profiles to the data, shown in the third panel of Figure 2 as a dashed and dotted line. The central wavelengths of the two features are 3933.51, and 3933.72 Å, corresponding to radial velocities of 11 and +5 km s-1. The apparent velocity of the white dwarf star is +4.9 km s-1, suggesting only the primary absorption component (dashed line) is atmospheric. We use the Local Interstellar Medium (ISM) model of Redfield & Linsky (2008)333http://lism.wesleyan.edu/LISMdynamics.html to search of known ISM clouds along the line-of-sight for WD J2100+2122. The line-of-sight intercepts two known ISM clouds, Eri 11.79 km s-1 and Aql 4.74 km s-1. This indicates that the 11 km s-1 component (dotted line) is likely due to ISM absorption from the Eri cloud.
WD J1622+5840 has a wide absorption feature, though individual components are not resolved as in WD J2100+2122. A single Gaussian fit to the Ca K profile results in a radial velocity that is consistent with the apparent white dwarf velocity, indicating the feature is primarily atmospheric. Yet, with a full-width half-maximum (FWHM) of 0.61 Å, the absorption profile is much broader than the atmospheric features we detect in WD J0347+1624 and WD J2100+2122 (0.14 Å and 0.13 Å respectively), both of which are consistent with instrumental broadening at this wavelength (0.11 Å at 3934.66Å). It is clear that there is something additional contributing to the width of this absorption profile.
A search of the Redfield & Linsky (2008) database reveals no known ISM clouds along the line-of-sight. Furthermore, metal lines of Ca H, Si II, and Mg II are detected and show evidence of similar broadening, which would we do not expect from interstellar gas. Observations of nearby sources along the same line-of-sight could definitively rule out contributions from the ISM. Circumstellar gas, such as what was detected in the transiting material around WD 1145+017(Xu et al., 2016), is another option. However the absorption morphology of the circumstellar lines seen in WD 1145+017 is very different than what we see in WD J1622+5840, with lines that are much shallower and often asymmetric. Time evolution of the absorption morphology would strongly indicate circumstellar material, as has been seen for WD 1145+017 (Cauley et al., 2018; Fortin-Archambault et al., 2020).
Another intriguing interpretation is broadening due to Zeeman-splitting from a magnetic field at the white dwarf surface. Given the proximity of the circumstellar debris to the white dwarf star, weak magnetic fields can have a strong effect on circumstellar material as the alfvén radius for the magnetic capture of in-falling material strongly overlaps with the debris disk region (see Figure 5 of Farihi et al. 2018b). For a rough estimate of the magnetic field strength (), we compared the measured FWHM of the Ca K absorption feature to simulated spectra of varying magnetic field strengths assuming the stellar parameters listed in Table 1 and a fixed calcium abundance. At these line strengths, increasing the calcium abundance can increase the line depth, but has little effect on the line width. We find that the width of the Ca K feature is most consistent with a magnetic field strength between and kG. We do not detect Zeeman-splitting in any of the hydrogen or helium lines observed, however our resolution is not sufficient to rule out splitting of such a weak field. Higher resolution spectra covering these features or spectropolarimetric measurements could be used to confirm the weak magnetic field. If confirmed, the magnetic field of the white dwarf star is likely to have a strong influence on the inner edge of the debris disk.
4 Spectral Energy Distributions and Dusty Infrared Excesses
| Name | Gaia G | Gemini | Spitzer | AllWISE | TIR | RIR | |||||
|---|---|---|---|---|---|---|---|---|---|---|---|
| (mag) | J | H | K | Ch 1 | Ch 2 | W1 | W2 | (K) | (RWD) | (%) | |
| WD J0347+1624 | 16.7 | 24913 | 18010 | 1699 | 985 | 784 | 1789 | 145 13 | 1760 | 9 | 0.38 |
| WD J06116931 | 16.8 | 19610 | 21610 | 42121 | 59130 | - | 69035 | 79640 | 1070 | 55 | 5.16 |
| WD J06440352 | 16.2 | 32516 | 22911 | 20810 | 23912 | 24913 | 22411 | 21017 | 1030 | 29 | 0.49 |
| WD J1622+5840 | 16.9 | 15910 | 1117 | 834 | 784 | 754 | 1186 | 1046 | 900 | 25 | 0.27 |
| WD J2100+2122 | 15.2 | 66233 | 52927 | 50725 | 68935 | 68534 | 78639 | 84042 | 1060 | 36 | 0.39 |
Note. — All infrared fluxes are given in units of micro-Janskys. Note that the WD J06116931 Spitzer Ch 1 measurement may be spurious (see Section 2.2).
The dusty components of debris disks result in spectral energy distributions with a characteristic excess of infrared radiation over the white dwarf stellar flux (Jura, 2003; Kilic et al., 2006; von Hippel et al., 2007), although some circumstellar debris disks around white dwarf stars are known to escape detection in the infrared (Bergfors et al., 2014; Koester et al., 2014; Bonsor et al., 2017).
To construct the spectral energy distributions for our targets and search for this infrared excess, we collected publicly available photometry from the Sloan Digital Sky Survey (Ahn et al., 2014), Panoramic Survey Telescope and Rapid Response System (Chambers et al., 2016), SkyMapper Southern Survey (Wolf et al., 2018), Two-Micron All-Sky Survey (2MASS; Skrutskie et al. 2006), and the AllWISE surveys (Cutri & et al., 2013). We de-reddened the photometry using the technique described in Gentile Fusillo et al. (2019), and converted the magnitudes into units of flux density using the published zero-points for each bandpass. In addition, we collected targeted infrared photometry as described in Section 2.2. The measured fluxes were converted in units of flux density and are presented in Table 2. The resulting spectral energy distributions combine our targeted follow-up with the collected survey data, and are shown in Figure 3.
4.1 Establishing The Infrared Excess
To model the stellar contribution to the measured photometry, we approximate the white dwarf star with a blackbody source with a fixed effective tempearture and radius consistent with the parameters given in Table 1. The radius is derived from the value using the evolutionary tracks of Fontaine et al. 2001 with the appropriate spectral type. The stellar model is then scaled to the observed flux using all photometry measurements with wavelengths below one micron. Approximating the white dwarf star as a blackbody source is not appropriate for detailed modeling of the infrared excess, but serves our purpose as a qualitative point of reference for the stellar contribution to the infrared flux. All five targets exhibit significant excess infrared radiation above the expected stellar contribution beyond 1.5 microns.
Infrared excess candidates that depend on WISE photometry are well known to suffer from appreciable amounts of contamination (Barber et al., 2014; Silverberg et al., 2018), that in many cases require Spitzer follow-up to resolve (Dennihy et al., 2020). In this case, all five targets were initially selected for follow-up based on their WISE excess (Rebassa-Mansergas et al. 2019; Xu et al. 2020, submitted to ApJ), necessitating a careful comparison of the catalog photometry and the infrared follow-up photometry. Three targets in our sample, WD J0347+1624, WD J1622+5840 and WD J2100+2122, showed significant discrepancies between the catalog and collected infrared photometry as seen in Figure 3. In all three systems the collected Spitzer photometry is lower than the reported WISE photometry, which could be reconciled by additional flux in the WISE measurements due to source confusion (Wilson & Naylor, 2017; Dennihy et al., 2020).
To help distinguish between source confusion and intrinsic variability, we examine the Spitzer Ch 1 and Ch 2 frames for evidence of nearby sources. We find that WD J1622+5840 is blended with a nearby source in both Ch 1 and Ch 2 images that is only resolved through PRF-fitted photometry. We perform aperture photometry on the Spitzer images with a radius of 7.8″, corresponding to the approximate confusion limit of the automatic source de-blending routine used in AllWISE pipeline444http://wise2.ipac.caltech.edu/docs/release/allsky/expsup/sec4_4c.html. The wide aperture photometry of the Spitzer Ch 1 and Ch 2 is consistent with the photometry reported by WISE, confirming source confusion is responsible for the difference in flux seen in WD J1622+5840.
The Spitzer images for WD J0347+1624 and WD J2100+2122 show the targets are clear of nearby contaminating sources, and large aperture photometry of the IRAC Ch 1 and Ch 2 images does not resolve the discrepancy between the AllWISE and Spitzer photometry. Recently, infrared variability of dusty debris disks around white dwarfs has been detected on timescales of months and years (Xu et al., 2018; Farihi et al., 2018a; Swan et al., 2019b; Wang et al., 2019). Intrinsic variability remains a plausible explanation for these two targets, and presents some issues for our attempts to fit or describe the infrared excess, as the spectral energy distributions presented in Figure 3 include survey data with epochs spanning several years. To attempt to mitigate the effects of intrinsic variability on our fits to the infrared excess, we choose to only consider the newly collected infrared photometry, which was all collected within the past two years.
As discussed in Section 2.2, the Spitzer data for WD J06116931 is potentially spurious, so we choose to rely on the WISE photometry when fitting the infrared excess. In the IRAC Ch 1 images, the target is free of nearby sources that might contaminate the WISE photometry, and there is a rough agreement between the IRAC Ch 1 and WISE W1 fluxes, supporting this choice.
4.2 Characterizing The Infrared Excess
To describe the infrared excess, we fit an additional single-temperature blackbody component to the spectral energy distribution using a chi-squared minimization process with the temperature and radius set as free parameters and the blackbody source placed at the distance of the white dwarf star. We show the best-fitting combination of white dwarf and blackbody source along with the collected photometry in Figure 3, and report the parameters of the best-fitting infrared source in Table 2.
| Name | UT Date | Ca 8498 Eqw | Ca 8542 Eqw | Ca 8662 Eqw | FWZI | Additional Emission Species |
|---|---|---|---|---|---|---|
| (Å) | (Å) | (Å) | (km s-1) | |||
| WD J0347+1624 | 2018 Dec 03 | 5.240.4 | 5.610.39 | 6.520.4 | 63050 | O I, Fe II |
| 2019 Jan 24 | 5.90.13 | 6.570.13 | 6.310.13 | 67050 | ||
| 2019 Nov 14 | 7.740.11 | 8.690.11 | 7.960.11 | 59030 | ||
| WD J06116931 | 2019 Oct 15 | 10.650.16 | 14.920.17 | 15.750.17 | 136050 | O I, Si I, Mg I, Na I, Fe II |
| WD J06440352 | 2019 Feb 11 | 0.780.1 | 0.930.1 | 1.210.1 | - | None |
| 2019 Mar 23 | 0.850.1 | 0.910.1 | 1.060.1 | - | ||
| 2020 Feb 14 | 1.020.14 | 1.140.13 | 1.230.13 | 91070 | ||
| WD J1622+5840 | 2020 Mar 01 | 0.510.12 | 0.910.13 | 0.810.11 | - | O I |
| 2020 May 03 | 0.720.10 | 1.030.12 | 1.020.12 | 1110100 | ||
| WD J2100+2122 | 2019 Apr 09 | 0.260.1 | 0.250.1 | 0.340.1 | - | O I, Fe II |
| 2019 May 15 | 0.530.27 | 0.430.28 | 0.810.27 | - | ||
| 2019 Jun 17 | 1.830.42 | 2.830.43 | 1.610.42 | 65070 | ||
| 2019 Jul 12 | 0.440.12 | 0.270.12 | 0.370.12 | - |
Note. — The FWZI measurements are an average of the three calcium infrared triplet emission profiles and are only calculated when a clear detection of both edges of the profile can be made. As discussed below, some systems show significant evolution over time in both profile strength and shape that lead to variations in these measurements.
The temperature and radii of the best-fitting infrared source are not consistent with theoretical predictions for stellar and sub-stellar companions, as their radii are too large given their inferred temperatures (Chabrier & Baraffe, 1997; Chabrier et al., 2000). Given the detections of emission lines from circumstellar gas, the most likely interpretation is that the infrared excess is due to circumstellar dust. The inferred blackbody temperatures would correspond to dust re-radiating in thermal equilibrium that is near or within the tidal disruption radius of the white dwarf star, depending on whether the dust is assumed to be optically thick or optically thin (Jura, 2003; Reach et al., 2005).
The optically thick and vertically thin model of Jura (2003) has since become the preferred description of the dust in these systems, and could help constrain the geometry of the dust. When combined with models of the gaseous emission lines, a more complete picture of the debris disk environment can be constructed, and the analyses of similar systems have shown the dusty and gaseous material to be largely coincident (Melis et al., 2010). However, we lack the longer wavelength observations needed to constrain models with multiple free parameters. The potential for intrinsic variability further complicates this effort, as recent works suggest several optically thin and thick components may be needed to describe such infrared variations (Swan et al., 2020). We therefore choose to limit our characterization of the infrared excess to the best-fitting parameters of a single-temperature blackbody for this work.
While a single-temperature blackbody is a poor physical representation of the circumstellar dust that is neither spherical nor at a single-temperature, it is still useful for comparison putting these discoveries in context of the known sample of white dwarf debris disks. Both Rocchetto et al. (2015) and Dennihy et al. (2017) have explored the bulk sample properties of white dwarfs with known circumstellar debris disks modeled as single-temperature blackbodies. As compared with the sample analyzed in Dennihy et al. (2017), the best-fitting infrared temperatures and radii of the new debris disks are consistent with other white dwarf debris disks known to host gaseous debris in emission, strengthening the correlation between the brightness of the debris disk and its propensity to host gaseous debris in emission.
One way to quantify the brightness of the debris disk is to calculate the fractional infrared brightness of the infrared source (, given in units of percent), which we report in Table 2. By approximating the debris disk as a single-temperature blackbody, we are not capturing the true fractional infrared brightness, but it allows for direct comparison with the sample analyzed by Rocchetto et al. (2015), who used similar methodology. The debris disks in all five white dwarfs show fractional infrared luminosities that are consistent with other dusty white dwarfs at similar temperatures (Rocchetto et al., 2015). WD J06116931 is an exception. The fractional infrared flux of 5.16 is unusually high, exceeding that of GD 362, one of the brightest known dusty debris disks around a white dwarf (Becklin et al., 2005; Kilic et al., 2005). The strength of the infrared excess of GD 362 requires multiple dusty components to model (Jura et al., 2007), and a similar approach would be required if one considers all of the infrared flux from WD J06116931 to be a result of circumstellar dust.
Finally, we emphasize that while instructive, our choice of a single-temperature blackbody models for fitting the spectral energy distribution limits the interpretations we can make. These simplifications allow us to quickly place the new discoveries in the context of other similar systems, but more detailed modeling is needed to understand the geometry and fundamental properties of the circumstellar dust.
5 Gaseous Emission Line Shapes, Strengths, and Evolution
In addition to the excess infrared radiation from the dusty components of the debris disks around these stars, all five systems exhibit emission lines emanating from a gaseous component. Here we present the emission lines detected, including a search for variability over the first year of follow-up by combining data from Gemini/GMOS, VLT/X-shooter, and SOAR/Goodman. Changes in the absorption and emission profiles of gaseous components in debris disks around white dwarf stars have been detected on timescales of minutes (Manser et al., 2019), months (Redfield et al., 2017), years (Gänsicke et al., 2008; Cauley et al., 2018; Dennihy et al., 2018), and decades (Wilson et al., 2014, 2015; Manser et al., 2016b, a), so the proper follow-up of newly discovered systems can be a daunting task. With only a few epochs for each system, we are unable to provide a detailed analysis, but our early follow-up hints at some familiar classes of variability and gives an opportunity to assess the future needs for each system.
We focus our discussion on the calcium infrared triplet emission feature, as it is commonly the strongest emission feature detected in these systems (Manser et al., 2020). In Table 3, we provide a few measurables of the calcium triplet emission profiles for each system, including the equivalent width and the full-width zero-intensity (FWZI), measured as the separation between the points where the red/blue-shifted edges of the emission line profile meets the continuum. The reported FWZI value is the uncertainty weighted combination of the three independent FWZI measurements from the calcium triplet emission features.
The FWZI and equivalent with measurements presented in Table 3 are useful for comparison with known systems and for tracking the evolution of the emission features over long timescales. Our measurements are given at a single epoch but in our limited follow-up we already see signs of such evolution. In several of our systems we also note detections of Fe, Mg, Si, Na, and O in emission, presented in the Appendix. We discuss the emission species detected and the variability of each system individually below.
5.1 WD J0347+1624
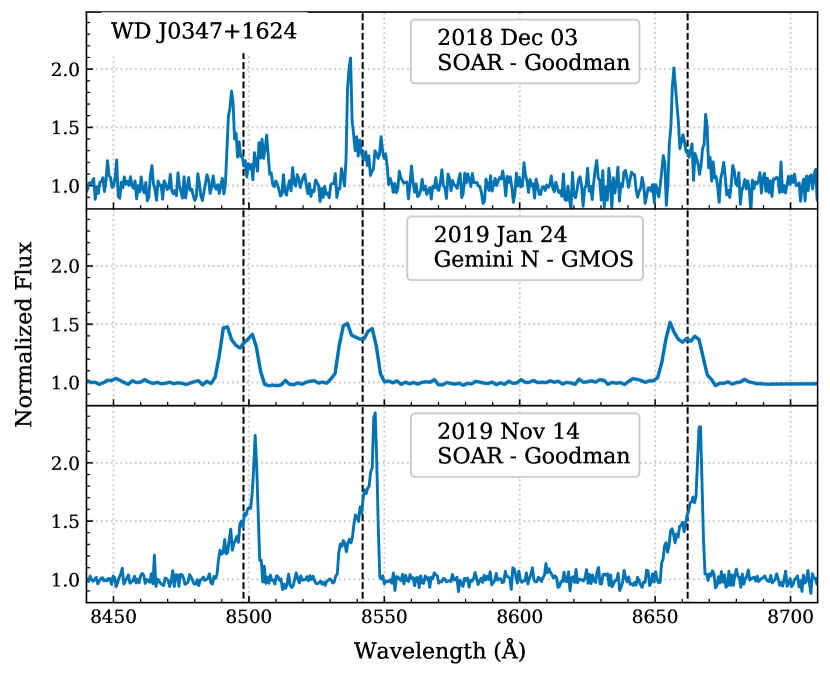
The calcium infrared triplet emission from the gaseous debris around WD J0347+1624 was initially observed in December 2018 in a slightly asymmetric phase, with a blue-shifted peak as seen in Figure 4. The emission profiles are strong relative to other known white dwarf systems with gaseous debris in emission, reaching peak fluxes up to twice that of the white dwarf stellar continuum. With a full-width zero-intensity of just 63040 km s-1, the profiles are narrower than the similarly strengthened system WD 1226+110 (Gänsicke et al., 2006; Melis et al., 2010), suggesting the disk is either observed at a lower inclination or that the emitting region is farther from the white dwarf star.
Additionally, we see evidence of emission from O I and Fe II throughout the spectra, and emission at the Ca K transition 3934 Å, presented in Figure 13. Similar emission features have been observed in the spectra of the gaseous debris disks around Ton 345 (Melis et al., 2010) and WD 1226+110 (Manser et al., 2016b), and raise the possibility of performing direct compositional analyses of the gaseous material using spectral synthesis codes, such as what has recently been performed for the gaseous material around the white dwarf star WD J0914+1914 (Gänsicke et al., 2019). Further discussion of the additional emission species detected amongst our sample is given in Section 6.
A follow-up spectrum in January 2019 showed a transition in the calcium infrared triplet emission to a more symmetric profile, and continued monitoring indicates the system is undergoing the same periodic global asymmetric profile evolution as has been recorded in the emission profiles of WD 1226+110 (Manser et al., 2016b) and HE 13492305 (Dennihy et al., 2018) and the absorption profiles of WD 1145+017 (Cauley et al., 2018; Fortin-Archambault et al., 2020). If the emission profiles continue to evolve at the rate we have seen, the period for WD J0347+1624 is likely to be between two and three years.
The periodic asymmetric evolution seen in these systems is well described by the precession of a fixed pattern within the disk (Hartmann et al., 2016; Manser et al., 2016b), driven by either general relativity or pressure differences within the disk (Miranda & Rafikov, 2018). The recent detection of hourly variations in the emission profiles of WD 1226+110 suggests the presence of a planetesimal within the debris disk (Manser et al., 2019) that could be also responsible for the long-term emission profile behavior seen in WD 1226+110 and other similar systems (Manser et al., 2020). The strength and similarity in behavior of the calcium triplet emission line profiles of WD J0347+1624 make it a good test case for such theories.
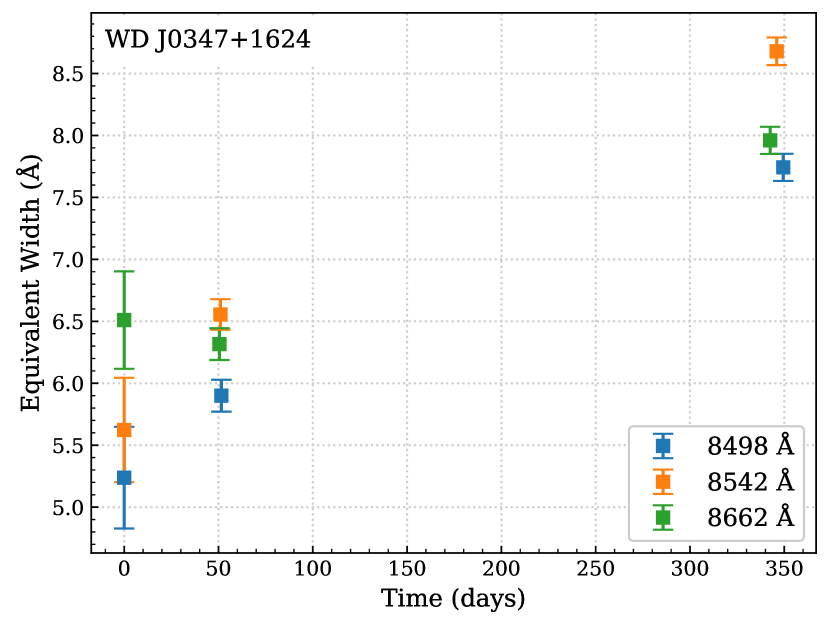
Finally, as shown in Figure 5, the equivalent width of all three calcium triplet emission profiles in our 2019 Nov 11 spectra is significantly higher than the previous two epochs. The FWZI metric shows no significant variation over this time. It remains to be seen if this increase is stochastic or is correlated with the asymmetric profile evolution discussed earlier.
5.2 WD J06116931
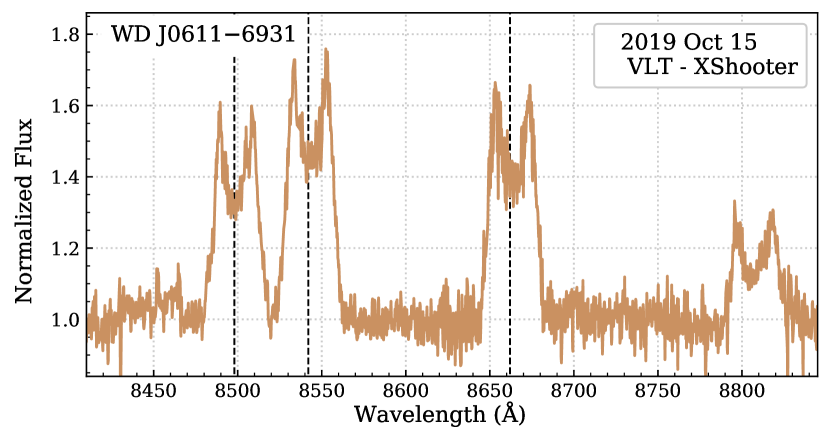
The calcium infrared triplet emission from the gaseous debris around WD J06116931 was observed with VLT/X-Shooter in October 2019. As shown in Figure 6, the system displays strong and broad emission lines, similar in width to the gaseous debris of Ton 345 and SDSS1043+0855 (Gänsicke et al., 2007, 2008; Melis et al., 2010). In addition to the calcium infrared triplet emission, we detect several other metal species in emission including lines from Mg I, O I, Fe II, Si I, and Na I, shown in Figure 14. The latter two emission species are unique amongst the sample of white dwarfs with gaseous debris. All of the lines exhibit comparable width in velocity space, indicating the different species share a similar inner disk radius.
In contrast to the additional metal species seen in the gaseous debris around the systems presented here and in the literature, the only Fe II emission line we detect in the spectra WD J06116931 is at 5169 Å, likely blended with Mg I emission. In addition, the Mg I lines are comparable in strength to the calcium infrared triplet lines, which are typically much stronger than all other species (Manser et al., 2020). The strength of the Mg I lines, the detection of Si I, the lack of strong Fe II emission, and the potential Na I detection suggest a unique chemical composition for the planetary body that is populating the debris disk. It is worth noting however that the white dwarf star is several thousand degrees cooler than those of WD J0347+1624 and WD 1226+110, so the difference could be due to the excitation mechanism for the circumstellar gas.
5.3 WD J06440352
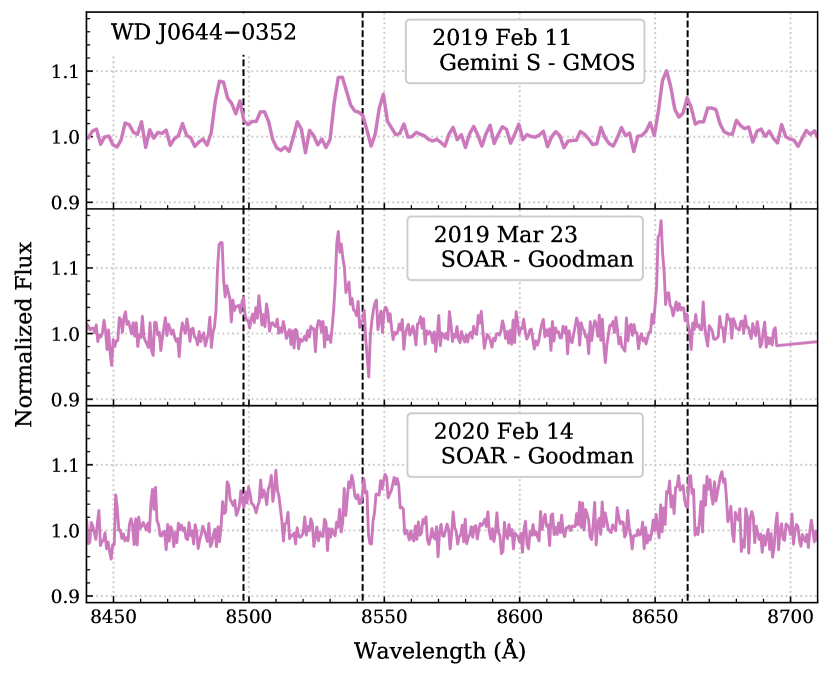
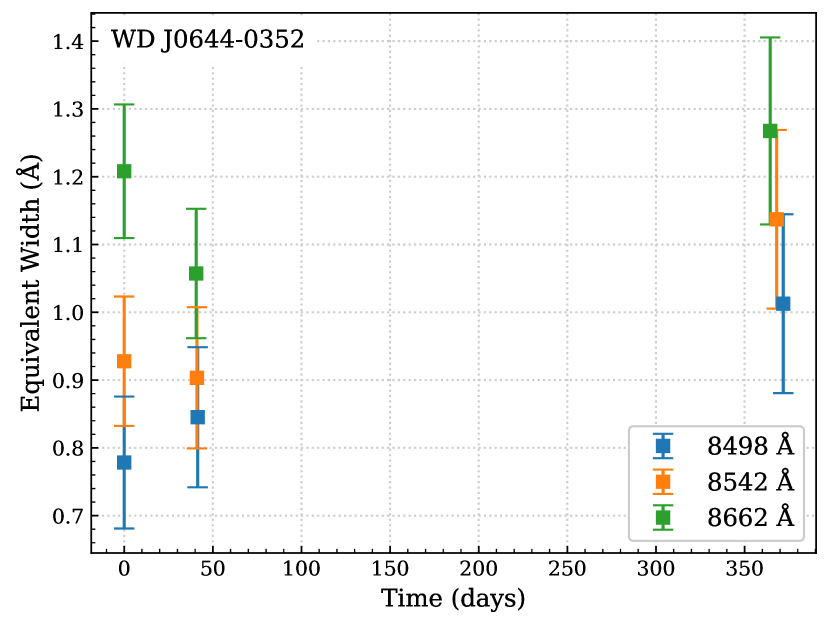
The calcium infrared triplet lines from the gaseous debris around WD J06440352 were initially seen as weak and highly asymmetric, with a strong blue-shifted peak and little initial evidence of a red-shifted emission component in February 2019 (see Figure 7). The lines appeared almost single-peaked, and the lack of a clear red-shifted component clouded the origin of the emission. Binary systems consisting of a white dwarf star and a highly irradiated stellar or sub-stellar companion are also known to show both an infrared excess and emission lines from the companion (e.g. Longstaff et al. 2017), and their radial velocity variable, single-peaked emission lines can easily be mistaken for an emission feature from an asymmetric debris disk. A recent example of this is SDSS J114404.74+052951.6, initially understood as a gaseous disk around a white dwarf (Guo et al., 2015), but later shown to demonstrate radial velocity variability consistent with chromospheric emission from a heated companion (Florez & Wilson, 2020).
Such extreme line profile asymmetry has been seen in the gaseous components of white dwarf debris disks, notably at the maximum phases of evolution for HE 13492305 (Dennihy et al., 2018). In cases like this, multi-epoch spectra or evidence of a red-shifted emission shelf is needed to confirm that the emission lines are from a circumstellar disk. Our follow-up in March of 2019 showed little evolution of the profiles, however by February of 2020 the profiles had evolved to a near-symmetric phase with a doppler-broadened structure, confirming the presence of a Keplerian disk and profile evolution similar to HE 13492305. The timescale of variations indicates a period between four and ten years. No significant variation in the equivalent width of the lines is seen between our three epochs as shown in Figure 8.
5.4 WD J1622+5840
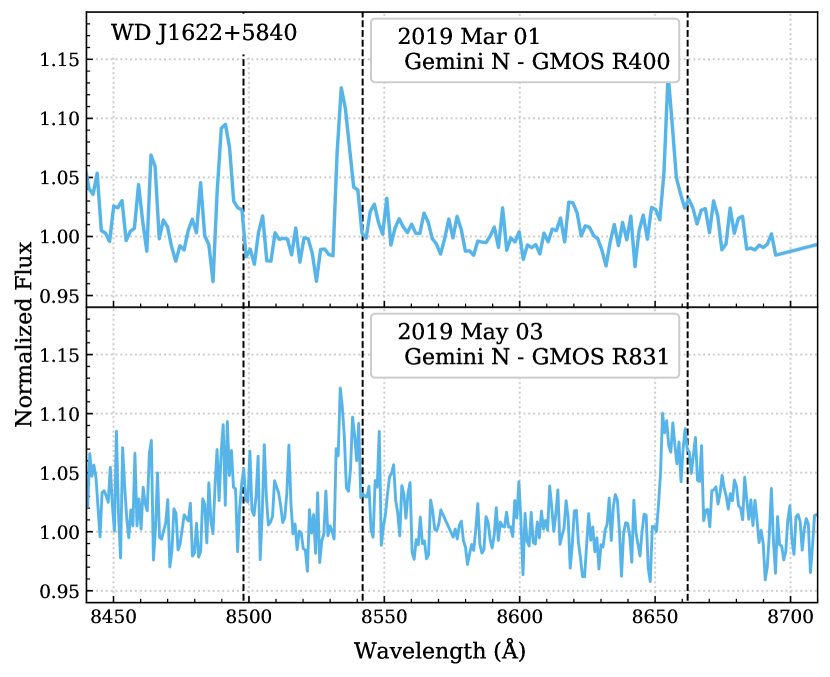
In the initial March 2019 spectrum shown in Figure 9, the calcium infrared triplet emission profiles for WD J1622+5840 were remarkably similar to those of WD J06440352. They appeared nearly single-peaked and completely blue-shifted, prompting the need for higher-resolution and multi-epoch follow-up to confirm their nature. In a second spectrum taken in May 2019 with a higher-resolution setup, we saw that the asymmetric, blue-shifted lines do indeed have a weak, red-shifted shelf that is indicative of an eccentric, Keplerian disk. We have not attained further follow-up to confirm the variability of the emission lines, but the similarities with the gaseous debris observed around WD J06440352 and HE 13492305 suggest they should transition to a more symmetric phase over time.
In addition to the calcium infrared triplet emission, we see evidence of O I in emission at 7770Å and 8450Å in both the low and high-resolution spectra, shown in Figure 15. The O I features have similar peak fluxes to the calcium triplet emission lines.
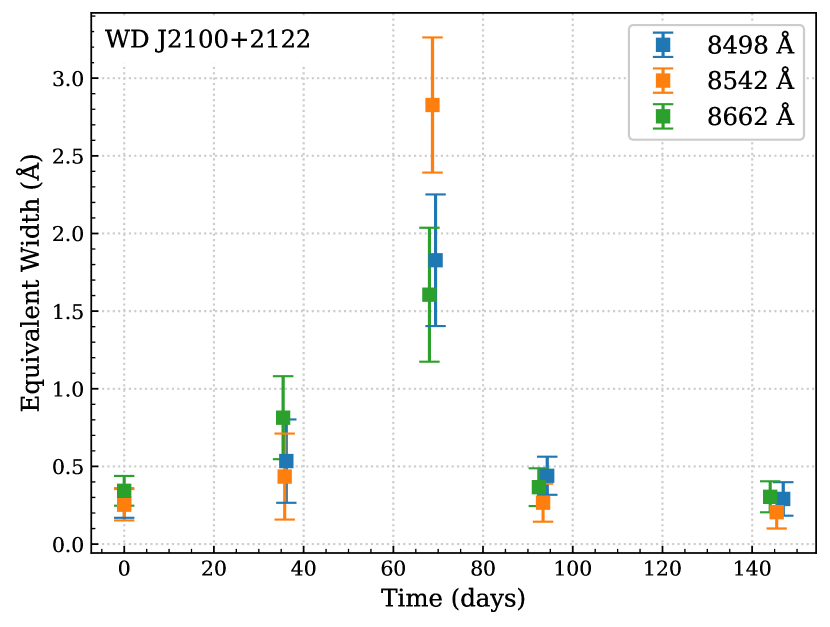
5.5 WD J2100+2122
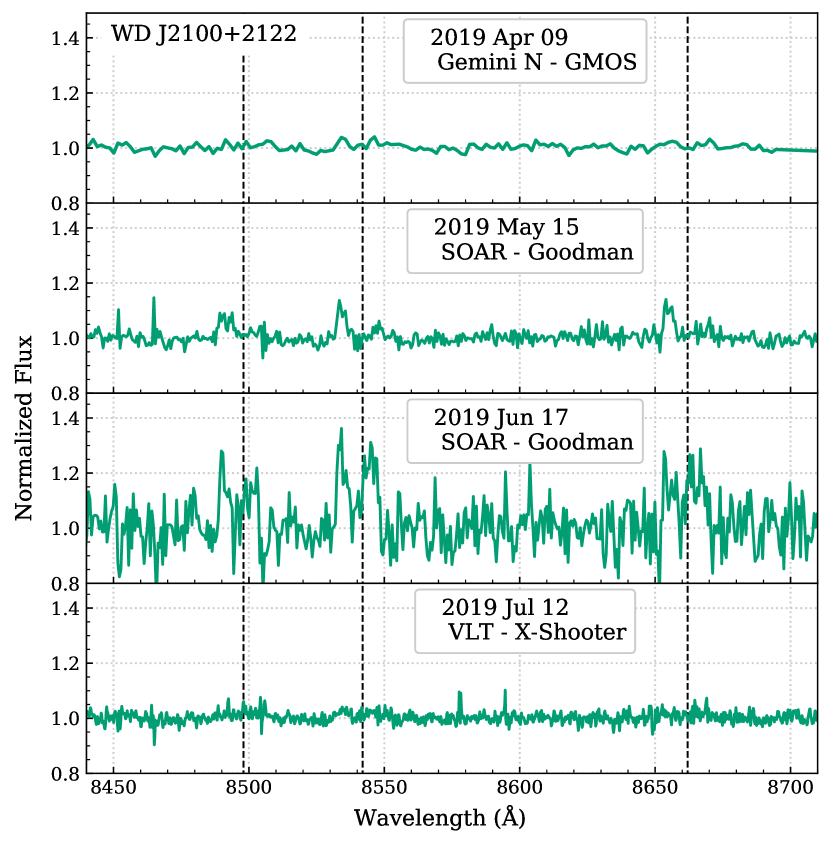
The initial April 2019 spectrum showed a very marginal detection of calcium infrared triplet emission, shown in Figure 10. Follow-up in May 2019 showed signs of increasing strength in the calcium infrared triplet, with the appearance of an asymmetric, blue-shifted profile. The increase in strength and change in morphology continued in June 2019, where we observed a double-peaked emission profile structure. By July 2019, the emission profiles had decreased in strength, completing a return to the initial state. In Figure 11 we show our measurements of the equivalent widths of the emission lines over time, which show the entire departure and return taking place within two months.
A similar change in strength of the calcium triplet emission features has been observed in the debris disk surrounding WDJ1617+1620 (Wilson et al., 2014), wherein the emission profiles first increased and then slowly declined over the course of ten years, suggesting the fading is related to a return to a nascent state following recent collision or other stochastic event (Wilson et al., 2014). The changes in strength we have observed in WD J2100+2122 occur on a timescale of months as opposed to years, increasing and decreasing in strength within sixty days. As we have only been monitoring the system for a few months, it is unlikely that we have managed to catch a one-off brightening event. However with only a single event observed, we can not say whether we expect the event to repeat and on what timescale. Still, cyclical changes in emission strength are an intriguing possibility as the timescale could indicate an ongoing interaction between an existing disk and a larger planetesimal on a wide orbit. Given the dynamic origin of the material that populates white dwarf debris disks, such interactions are expected during the tidal disruption process (Malamud & Perets, 2020) and have been observed by the evolution of the disrupting, transiting debris (Vanderburg et al., 2015; Vanderbosch et al., 2019).
In addition to the calcium infrared triplet emission, a series of Fe II emission is observed throughout the spectrum and a weak O I line is detected, as shown in Figure 16. In some cases the Fe II emission is stronger than the calcium infrared triplet emission. At just over 25,000 K, the white dwarf star is very hot for hosting gaseous and dusty debris which could be responsible for the high strength of the Fe II emission with respect to the calcium infrared triplet. Unfortunately, on many epochs we do not have the spectral coverage to search for changes in the strength in the Fe II emission features to compare with the changes we see in the calcium infrared triplet emission.
6 Discussion
The discovery of five new white dwarf debris disks with dusty infrared excesses and gaseous debris in emission provides a substantial increase of the known sample, increasing the number from seven to 12 (Manser et al., 2016a), including the hottest white dwarf discovered to host such a disk, WD J2100+2122. The increase is expected given the influx of known white dwarf stars from Gaia, and the continued spectroscopic follow-up of white dwarfs with infrared excesses and large samples of stars expected to be observed as part of upcoming spectroscopic surveys are certain to discover more (Manser et al., 2020; Melis et al., 2020).
With targeted photometric follow-up, we confirm the WISE infrared excess reported for all five systems. Using a single-temperature blackbody fit to the infrared excess, we conclude that the infrared excess is likely due to dust, though we are not able to constrain the dust properties without further modeling. The infrared excess seen around WD J06116931 is exceedingly strong for interpretation as a flat, dusty debris disk, making it a good target for detailed studies of alternative debris disk geometries (Jura et al., 2007).
WD J0347+1624 and WD J2100+2122 show decreases between the WISE catalog photometry and our Spitzer follow-up, and the lack of nearby sources in the corresponding Spitzer images suggests that the WISE photometry is unlikely to be contaminated, and that intrinsic variability may be responsible for the difference. This is particularly interesting in the context of the recent findings of Swan et al. (2020), that shows dusty white dwarfs with gaseous debris in emission tend to show stronger infrared variations than those without gaseous debris in emission. Both targets are sufficiently bright for detection in the NEOWISE-R Single Exposure Source Table555Available at https://irsa.ipac.caltech.edu, and should be monitored over time for continued variation.
All five of the white dwarf debris disk systems show signs of active accretion via the detection of atmospheric calcium. Some show absorption features from other metal species, such as Mg, Si, and Fe, and are suitable for detailed abundance analyses to explore the chemical compositions of the accreted bodies and accretion rates of the material to compare with the greater sample (e.g. Xu et al. 2019; Swan et al. 2019a). These analyses would benefit from a more accurate determination of the white dwarf atmospheric properties using spectroscopic methods, which we leave for future works. The possibility of magnetism in WD J1622+5840 has strong implications for its circumstellar environment and should be further investigated. Spectropolarimetric measurements could quickly determine if the white dwarf is indeed weakly magnetic (Landstreet & Bagnulo, 2019), and spectra of nearby stars could be obtained to rule out contributions from interstellar absorption.
Three of the systems we present show significant evolution of their emission line profiles over their first year of observation. With these new discoveries, it is clear there are at least two classes of long-term variability exhibited by white dwarfs with gaseous debris that are not necessarily mutually exclusive. WD J0347+1624 and WD J06440352 display the asymmetric profile evolution that has been associated with precessing eccentric debris around SDSS J0845+2257, WD 1226+110, HE 1349-2305, and WD 1145+017 (Wilson et al., 2015; Manser et al., 2016b; Dennihy et al., 2018; Cauley et al., 2018; Miranda & Rafikov, 2018), while WD J2100+2122 exhibits both morphological variability and stochastic variations that had previously only been observed in SDSS J1617+1620 (Wilson et al., 2014). The short variability timescales for the emission lines in WD J0347+1624, WD J06440352, and WD J2100+2122 make them attractive targets for continued follow-up.
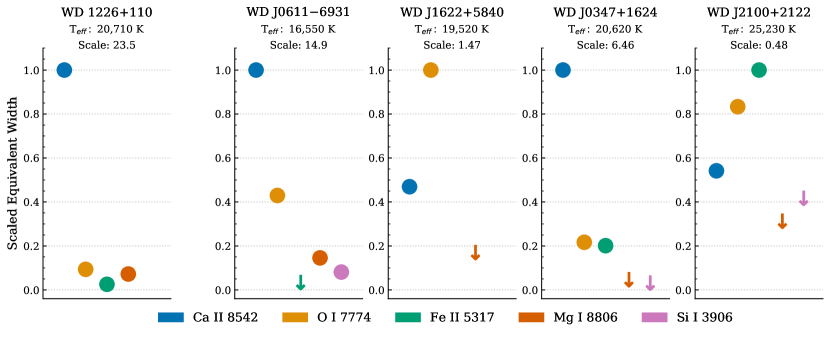
The detection of multiple strong metal species in emission for several of the systems also provides future works the opportunity for direct compositional analysis of the gaseous debris. Previously, additional metal species were detected in only two of the seven similar systems known to host dusty and gaseous debris in emission, including Fe II in Ton 345 (Melis et al., 2010) and Fe II, O I, Mg I, and Mg II in WD 1226+110 (Melis et al., 2010; Hartmann et al., 2011; Manser et al., 2016b). In contrast, WD J06116931, WD J1622+5840, WD J2100+2122 all show additional features which are comparable in strength or stronger than the calcium infrared triplet, which is visualized in Figure 12. Note that the absolute strengths of the emission lines also span nearly two orders of magnitude, as denoted by the scale factors used to normalize the axes. The detections of multiple strong species in emission and significant variability in the strength of the calcium infrared triplet in WD J2100+2122 emphasize that future searches for these systems should rely on broad-band and multi-epoch spectroscopy when available.
The range of emission strengths demonstrate that these systems host a diverse range of circumstellar environments. The different excitation species could be signs of unique planetary compositions, or more complex environmental factors such as the debris disk geometry or heating mechanisms. Recent advances in the modeling of the gaseous environments around white dwarf stars show that with enough detections of individual excitation species, these degeneracies can be lifted (Gänsicke et al., 2019; Fortin-Archambault et al., 2020). In addition to the continued variability monitoring, the direct compositional analyses of the debris in the systems presented here is an exciting prospect for future studies.
\restartappendixnumbering
Appendix A Additional Emission Lines Detected and Observation Logs
In this appendix we present figures showing the additional emission species detected in addition to our spectroscopic and photometric observation logs. The additional emission detections were done by eye, and may not consitute an exhaustive list of all lines present in the spectra. Wavelengths for the lines are taken from the NIST Atomic Spectral Database and referenced in air.
| Target | Telescope/Instrument | Program ID | UT Date | Coverage (Å) | Resolving Power | Integration Time (s) |
|---|---|---|---|---|---|---|
| WD J0347+1624 | Gemini-N/GMOS-N | GN-2019A-FT-202 | 2019 Jan 24 | 6200 10500 | 1900 | 5x300 |
| Keck/HIRESb | 2019B_N072 | 2019 Dec 05 | 3130 5960 | 37,000 | 3x1800 | |
| SOAR/Goodman | Partner-UNC | 2018 Dec 03 | 7550 8720 | 3000 | 5x600 | |
| SOAR/Goodman | Partner-UNC | 2019 Nov 14 | 7550 8720 | 3000 | 9x600 | |
| VLT/X-Shooter | 1103.D-0763(D) | 2019 Dec 05 | 3000 10400 | 5100/8800 | 4x400 | |
| WD J06116931 | VLT/X-Shooter | 0104.C-0107(A) | 2019 Oct 15 | 3000 10400 | 5100/8800 | 2x1700 |
| WD J06440352 | Gemini-S/GMOS-S | GS-2019A-FT-201 | 2019 Feb 11 | 6200 10500 | 1900 | 5x300 |
| SOAR/Goodman | Partner-UNC | 2019 Mar 23 | 7550 8720 | 3000 | 12x600 | |
| SOAR/Goodman | Partner-UNC | 2020 Feb 14 | 7550 8720 | 3000 | 16x600 | |
| VLT/X-Shooter | 103.C-0431(B) | 2019 Sep 14 | 3000 10400 | 5100/8800 | 2x1700 | |
| WD J1622+5840 | Gemini-N/GMOS-N | GN-2019A-FT-202 | 2019 Mar 01 | 6200 10500 | 1900 | 5x300 |
| Gemini-N/GMOS-N | GN-2019A-FT-209 | 2019 May 03 | 7300 9600 | 3800 | 7x300 | |
| Keck/HIRESb | 2019B_N072 | 2019 Jul 10 | 3130 5960 | 37,000 | 3x1800 | |
| WD J2100+2122 | Gemini-N/GMOS-N | GN-2019A-FT-202 | 2019 Apr 09 | 6200 10500 | 1900 | 4x300 |
| Keck/HIRESb | 2019B_N072 | 2019 Jul 10 | 3130 5960 | 37,000 | 3x1200 | |
| SOAR/Goodman | Partner-UNC | 2019 May 15 | 7550 8720 | 3000 | 5x600 | |
| SOAR/Goodman | Partner-UNC | 2019 Jun 17 | 7550 8720 | 3000 | 6x600 | |
| SOAR/Goodman | Partner-UNC | 2019 Sep 02 | 7550 8720 | 3000 | 6x600 | |
| VLT/X-Shooter | 0103.C-0431(B) | 2019 Jul 12 | 3000 10400 | 5100/8800 | 4x400 |
| Target | Telescope/Instrument | Program ID | Date | Filters (Integration Time) |
|---|---|---|---|---|
| WD J0347+1624 | Gemini-S/Flamingos-2 | GS-2019B-FT-204 | 2018 Oct 17 | J (6x10s), H (19x6s), Ks (19x10s) |
| Spitzer/IRAC | 14220 | 2019 Jun 02 | Ch 1 (11x30s), Ch 2 (11x30s) | |
| WD J06116931 | Gemini-S/Flamingos-2 | GS-2018B-Q-404 | 2018 Dec 22 | J (6x15s), H (29x6s) |
| Gemini-S/Flamingos-2 | GS-2018B-Q-404 | 2018 Dec 30 | Ks (17x20s) | |
| Spitzer/IRAC | 70062 | 2010 Dec 22 | Ch 1 (5x30s) | |
| WD 006440352 | Gemini-S/Flamingos-2 | GS-2019B-FT-204 | 2018 Oct 17 | J (6x10s), H (19x6s) |
| Gemini-S/Flamingos-2 | GS-2019B-FT-204 | 2018 Oct 20 | Ks (19x10s) | |
| Spitzer/IRAC | 14220 | 2019 Jul 05 | Ch 1 (11x30s), Ch 2 (11x30s) | |
| WD J1622+5840 | Gemini-N/NIRI | GN-2019A-Q-303 | 2019 Jun 15 | J (10x10s), H (26x10s), K (26x10s) |
| Spitzer/IRAC | 14220 | 2019 Jun 08 | Ch 1 (11x30s), Ch 2 (11x30s) | |
| WD J2100+2122 | Gemini-N/NIRI | GN-2019A-Q-303 | 2019 Jun 30 | J (10x10s), H (26x10s), K (26x10s) |
| Spitzer/IRAC | 14220 | 2019 Sep 09 | Ch 1 (11x30s), Ch 2 (11x30s) |
References
- Ahn et al. (2014) Ahn, C. P., Alexandroff, R., Allende Prieto, C., et al. 2014, ApJS, 211, 17, doi: 10.1088/0067-0049/211/2/17
- Astropy Collaboration et al. (2013) Astropy Collaboration, Robitaille, T. P., Tollerud, E. J., et al. 2013, A&A, 558, A33, doi: 10.1051/0004-6361/201322068
- Barber et al. (2014) Barber, S. D., Kilic, M., Brown, W. R., & Gianninas, A. 2014, ApJ, 786, 77, doi: 10.1088/0004-637X/786/2/77
- Becklin et al. (2005) Becklin, E. E., Farihi, J., Jura, M., et al. 2005, ApJ, 632, L119, doi: 10.1086/497826
- Bergfors et al. (2014) Bergfors, C., Farihi, J., Dufour, P., & Rocchetto, M. 2014, MNRAS, 444, 2147, doi: 10.1093/mnras/stu1565
- Bonsor et al. (2017) Bonsor, A., Farihi, J., Wyatt, M. C., & van Lieshout, R. 2017, MNRAS, 468, 154, doi: 10.1093/mnras/stx425
- Cauley et al. (2018) Cauley, P. W., Farihi, J., Redfield, S., et al. 2018, ApJ, 852, L22, doi: 10.3847/2041-8213/aaa3d9
- Chabrier & Baraffe (1997) Chabrier, G., & Baraffe, I. 1997, A&A, 327, 1039
- Chabrier et al. (2000) Chabrier, G., Baraffe, I., Allard, F., & Hauschildt, P. 2000, ApJ, 542, 464, doi: 10.1086/309513
- Chambers et al. (2016) Chambers, K. C., Magnier, E. A., Metcalfe, N., et al. 2016, arXiv e-prints, arXiv:1612.05560. https://arxiv.org/abs/1612.05560
- Chen et al. (2020) Chen, C. H., Su, K. Y. L., & Xu, S. 2020, Nature Astronomy, 4, 328, doi: 10.1038/s41550-020-1067-6
- Clemens et al. (2004) Clemens, J. C., Crain, J. A., & Anderson, R. 2004, in Proc. SPIE, Vol. 5492, Ground-based Instrumentation for Astronomy, ed. A. F. M. Moorwood & M. Iye, 331–340, doi: 10.1117/12.550069
- Cutri & et al. (2013) Cutri, R. M., & et al. 2013, VizieR Online Data Catalog, 2328
- Dennihy et al. (2017) Dennihy, E., Clemens, J. C., Debes, J. H., et al. 2017, ApJ, 849, 77, doi: 10.3847/1538-4357/aa8ef2
- Dennihy et al. (2018) Dennihy, E., Clemens, J. C., Dunlap, B. H., et al. 2018, ApJ, 854, 40, doi: 10.3847/1538-4357/aaa89b
- Dennihy et al. (2020) Dennihy, E., Farihi, J., Fusillo, N. P. G., & Debes, J. H. 2020, ApJ, 891, 97, doi: 10.3847/1538-4357/ab7249
- Eikenberry et al. (2004) Eikenberry, S. S., Elston, R., Raines, S. N., et al. 2004, Society of Photo-Optical Instrumentation Engineers (SPIE) Conference Series, Vol. 5492, FLAMINGOS-2: the facility near-infrared wide-field imager and multi-object spectrograph for Gemini, ed. A. F. M. Moorwood & M. Iye, 1196–1207, doi: 10.1117/12.549796
- Falcon et al. (2012) Falcon, R. E., Winget, D. E., Montgomery, M. H., & Williams, K. A. 2012, ApJ, 757, 116, doi: 10.1088/0004-637X/757/2/116
- Farihi (2016) Farihi, J. 2016, New Astronomy Reviews, 71, 9, doi: 10.1016/j.newar.2016.03.001
- Farihi et al. (2018a) Farihi, J., van Lieshout, R., Cauley, P. W., et al. 2018a, MNRAS, 481, 2601, doi: 10.1093/mnras/sty2331
- Farihi et al. (2018b) Farihi, J., Fossati, L., Wheatley, P. J., et al. 2018b, MNRAS, 474, 947, doi: 10.1093/mnras/stx2664
- Fazio et al. (2004) Fazio, G. G., Hora, J. L., Allen, L. E., et al. 2004, ApJS, 154, 10, doi: 10.1086/422843
- Florez & Wilson (2020) Florez, L., & Wilson, D. 2020, in American Astronomical Society Meeting Abstracts, American Astronomical Society Meeting Abstracts, 170.01
- Fontaine et al. (2001) Fontaine, G., Brassard, P., & Bergeron, P. 2001, PASP, 113, 409, doi: 10.1086/319535
- Fortin-Archambault et al. (2020) Fortin-Archambault, M., Dufour, P., & Xu, S. 2020, ApJ, 888, 47, doi: 10.3847/1538-4357/ab585a
- Gänsicke et al. (2008) Gänsicke, B. T., Koester, D., Marsh, T. R., Rebassa-Mansergas, A., & Southworth, J. 2008, MNRAS, 391, L103, doi: 10.1111/j.1745-3933.2008.00565.x
- Gänsicke et al. (2007) Gänsicke, B. T., Marsh, T. R., & Southworth, J. 2007, MNRAS, 380, L35, doi: 10.1111/j.1745-3933.2007.00343.x
- Gänsicke et al. (2006) Gänsicke, B. T., Marsh, T. R., Southworth, J., & Rebassa-Mansergas, A. 2006, Science, 314, 1908, doi: 10.1126/science.1135033
- Gänsicke et al. (2019) Gänsicke, B. T., Schreiber, M. R., Toloza, O., et al. 2019, Nature, 576, 61, doi: 10.1038/s41586-019-1789-8
- Gentile Fusillo et al. (2019) Gentile Fusillo, N. P., Tremblay, P.-E., Gänsicke, B. T., et al. 2019, MNRAS, 482, 4570, doi: 10.1093/mnras/sty3016
- Gimeno et al. (2016) Gimeno, G., Roth, K., Chiboucas, K., et al. 2016, Society of Photo-Optical Instrumentation Engineers (SPIE) Conference Series, Vol. 9908, On-sky commissioning of Hamamatsu CCDs in GMOS-S, 99082S, doi: 10.1117/12.2233883
- Graham et al. (1990) Graham, J. R., Matthews, K., Neugebauer, G., & Soifer, B. T. 1990, ApJ, 357, 216, doi: 10.1086/168907
- Guo et al. (2015) Guo, J., Tziamtzis, A., Wang, Z., et al. 2015, ApJ, 810, L17, doi: 10.1088/2041-8205/810/2/L17
- Hartmann et al. (2011) Hartmann, S., Nagel, T., Rauch, T., & Werner, K. 2011, A&A, 530, A7, doi: 10.1051/0004-6361/201116625
- Hartmann et al. (2016) —. 2016, A&A, 593, A67, doi: 10.1051/0004-6361/201628403
- Hodapp et al. (2003) Hodapp, K. W., Jensen, J. B., Irwin, E. M., et al. 2003, PASP, 115, 1388, doi: 10.1086/379669
- Hodgkin et al. (2009) Hodgkin, S. T., Irwin, M. J., Hewett, P. C., & Warren, S. J. 2009, MNRAS, 394, 675, doi: 10.1111/j.1365-2966.2008.14387.x
- Hook et al. (2004) Hook, I. M., Jørgensen, I., Allington-Smith, J. R., et al. 2004, PASP, 116, 425, doi: 10.1086/383624
- Hughes et al. (2018) Hughes, A. M., Duchêne, G., & Matthews, B. C. 2018, ARA&A, 56, 541, doi: 10.1146/annurev-astro-081817-052035
- Jiménez-Esteban et al. (2018) Jiménez-Esteban, F. M., Torres, S., Rebassa-Mansergas, A., et al. 2018, MNRAS, 480, 4505, doi: 10.1093/mnras/sty2120
- Jura (2003) Jura, M. 2003, ApJ, 584, L91, doi: 10.1086/374036
- Jura et al. (2007) Jura, M., Farihi, J., Zuckerman, B., & Becklin, E. E. 2007, AJ, 133, 1927, doi: 10.1086/512734
- Kausch et al. (2015) Kausch, W., Noll, S., Smette, A., et al. 2015, A&A, 576, A78, doi: 10.1051/0004-6361/201423909
- Kilic et al. (2005) Kilic, M., von Hippel, T., Leggett, S. K., & Winget, D. E. 2005, ApJ, 632, L115, doi: 10.1086/497825
- Kilic et al. (2006) —. 2006, ApJ, 646, 474, doi: 10.1086/504682
- Koester et al. (2014) Koester, D., Gänsicke, B. T., & Farihi, J. 2014, A&A, 566, A34, doi: 10.1051/0004-6361/201423691
- Labrie et al. (2019) Labrie, K., Anderson, K., Cárdenes, R., Simpson, C., & Turner, J. E. H. 2019, Astronomical Society of the Pacific Conference Series, Vol. 523, DRAGONS - Data Reduction for Astronomy from Gemini Observatory North and South, ed. P. J. Teuben, M. W. Pound, B. A. Thomas, & E. M. Warner, 321
- Landstreet & Bagnulo (2019) Landstreet, J. D., & Bagnulo, S. 2019, A&A, 628, A1, doi: 10.1051/0004-6361/201936009
- Leggett et al. (2015) Leggett, S. K., Morley, C. V., Marley, M. S., & Saumon, D. 2015, ApJ, 799, 37, doi: 10.1088/0004-637X/799/1/37
- Leggett et al. (2006) Leggett, S. K., Currie, M. J., Varricatt, W. P., et al. 2006, MNRAS, 373, 781, doi: 10.1111/j.1365-2966.2006.11069.x
- Longstaff et al. (2017) Longstaff, E. S., Casewell, S. L., Wynn, G. A., Maxted, P. F. L., & Helling, C. 2017, MNRAS, 471, 1728, doi: 10.1093/mnras/stx1786
- Makovoz et al. (2006) Makovoz, D., Roby, T., Khan, I., & Booth, H. 2006, in Proc. SPIE, Vol. 6274, 62740C, doi: 10.1117/12.672536
- Malamud & Perets (2020) Malamud, U., & Perets, H. B. 2020, MNRAS, 493, 698, doi: 10.1093/mnras/staa143
- Manser et al. (2020) Manser, C. J., Gänsicke, B. T., Gentile Fusillo, N. P., et al. 2020, MNRAS, 493, 2127, doi: 10.1093/mnras/staa359
- Manser et al. (2016a) Manser, C. J., Gänsicke, B. T., Koester, D., Marsh, T. R., & Southworth, J. 2016a, MNRAS, 462, 1461, doi: 10.1093/mnras/stw1760
- Manser et al. (2016b) Manser, C. J., Gänsicke, B. T., Marsh, T. R., et al. 2016b, MNRAS, 455, 4467, doi: 10.1093/mnras/stv2603
- Manser et al. (2019) Manser, C. J., Gänsicke, B. T., Eggl, S., et al. 2019, Science, 364, 66, doi: 10.1126/science.aat5330
- Marsh (1989) Marsh, T. R. 1989, PASP, 101, 1032, doi: 10.1086/132570
- Melis et al. (2010) Melis, C., Jura, M., Albert, L., Klein, B., & Zuckerman, B. 2010, ApJ, 722, 1078, doi: 10.1088/0004-637X/722/2/1078
- Melis et al. (2020) Melis, C., Klein, B., Doyle, A. E., et al. 2020, arXiv e-prints, arXiv:2010.03695. https://arxiv.org/abs/2010.03695
- Miranda & Rafikov (2018) Miranda, R., & Rafikov, R. R. 2018, ApJ, 857, 135, doi: 10.3847/1538-4357/aab9a2
- Reach et al. (2005) Reach, W. T., Kuchner, M. J., von Hippel, T., et al. 2005, ApJ, 635, L161, doi: 10.1086/499561
- Rebassa-Mansergas et al. (2019) Rebassa-Mansergas, A., Solano, E., Xu, S., et al. 2019, MNRAS, 489, 3990, doi: 10.1093/mnras/stz2423
- Redfield et al. (2017) Redfield, S., Farihi, J., Cauley, P. W., et al. 2017, ApJ, 839, 42, doi: 10.3847/1538-4357/aa68a0
- Redfield & Linsky (2008) Redfield, S., & Linsky, J. L. 2008, ApJ, 673, 283, doi: 10.1086/524002
- Rocchetto et al. (2015) Rocchetto, M., Farihi, J., Gänsicke, B. T., & Bergfors, C. 2015, MNRAS, 449, 574, doi: 10.1093/mnras/stv282
- Silverberg et al. (2018) Silverberg, S. M., Kuchner, M. J., Wisniewski, J. P., et al. 2018, ApJ, 868, 43, doi: 10.3847/1538-4357/aae3e3
- Simons & Tokunaga (2002) Simons, D. A., & Tokunaga, A. 2002, PASP, 114, 169, doi: 10.1086/338544
- Skrutskie et al. (2006) Skrutskie, M. F., Cutri, R. M., Stiening, R., et al. 2006, AJ, 131, 1163, doi: 10.1086/498708
- Smette et al. (2015) Smette, A., Sana, H., Noll, S., et al. 2015, A&A, 576, A77, doi: 10.1051/0004-6361/201423932
- Su et al. (2019) Su, K. Y. L., Jackson, A. P., Gáspár, A., et al. 2019, AJ, 157, 202, doi: 10.3847/1538-3881/ab1260
- Swan et al. (2019a) Swan, A., Farihi, J., Koester, D., et al. 2019a, MNRAS, 490, 202, doi: 10.1093/mnras/stz2337
- Swan et al. (2019b) Swan, A., Farihi, J., & Wilson, T. G. 2019b, MNRAS, 484, L109, doi: 10.1093/mnrasl/slz014
- Swan et al. (2020) Swan, A., Farihi, J., Wilson, T. G., & Parsons, S. G. 2020, MNRAS, 496, 5233, doi: 10.1093/mnras/staa1688
- Vanderbosch et al. (2019) Vanderbosch, Z., Hermes, J. J., Dennihy, E., et al. 2019, arXiv e-prints, arXiv:1908.09839. https://arxiv.org/abs/1908.09839
- Vanderburg et al. (2015) Vanderburg, A., Johnson, J. A., Rappaport, S., et al. 2015, Nature, 526, 546, doi: 10.1038/nature15527
- Veras et al. (2014) Veras, D., Leinhardt, Z. M., Bonsor, A., & Gänsicke, B. T. 2014, MNRAS, 445, 2244, doi: 10.1093/mnras/stu1871
- Vernet et al. (2011) Vernet, J., Dekker, H., D’Odorico, S., et al. 2011, A&A, 536, A105, doi: 10.1051/0004-6361/201117752
- Vogt et al. (1994) Vogt, S. S., Allen, S. L., Bigelow, B. C., et al. 1994, Society of Photo-Optical Instrumentation Engineers (SPIE) Conference Series, Vol. 2198, HIRES: the high-resolution echelle spectrometer on the Keck 10-m Telescope, ed. D. L. Crawford & E. R. Craine, 362, doi: 10.1117/12.176725
- von Hippel et al. (2007) von Hippel, T., Kuchner, M. J., Kilic, M., Mullally, F., & Reach, W. T. 2007, ApJ, 662, 544, doi: 10.1086/518108
- Wang et al. (2019) Wang, T.-g., Jiang, N., Ge, J., et al. 2019, ApJ, 886, L5, doi: 10.3847/2041-8213/ab53ed
- Wilson et al. (2014) Wilson, D. J., Gänsicke, B. T., Koester, D., et al. 2014, MNRAS, 445, 1878, doi: 10.1093/mnras/stu1876
- Wilson et al. (2015) —. 2015, MNRAS, 451, 3237, doi: 10.1093/mnras/stv1201
- Wilson & Naylor (2017) Wilson, T. J., & Naylor, T. 2017, MNRAS, 468, 2517, doi: 10.1093/mnras/stx629
- Wolf et al. (2018) Wolf, C., Onken, C. A., Luvaul, L. C., et al. 2018, PASA, 35, e010, doi: 10.1017/pasa.2018.5
- Wyatt (2008) Wyatt, M. C. 2008, ARA&A, 46, 339, doi: 10.1146/annurev.astro.45.051806.110525
- Xu et al. (2019) Xu, S., Dufour, P., Klein, B., et al. 2019, AJ, 158, 242, doi: 10.3847/1538-3881/ab4cee
- Xu & Jura (2014) Xu, S., & Jura, M. 2014, ApJ, 792, L39, doi: 10.1088/2041-8205/792/2/L39
- Xu et al. (2016) Xu, S., Jura, M., Dufour, P., & Zuckerman, B. 2016, ApJ, 816, L22, doi: 10.3847/2041-8205/816/2/L22
- Xu et al. (2018) Xu, S., Su, K. Y. L., Rogers, L. K., et al. 2018, ApJ, 866, 108, doi: 10.3847/1538-4357/aadcfe
- Zuckerman & Becklin (1987) Zuckerman, B., & Becklin, E. E. 1987, Nature, 330, 138, doi: 10.1038/330138a0
- Zuckerman et al. (2003) Zuckerman, B., Koester, D., Reid, I. N., & Hünsch, M. 2003, ApJ, 596, 477, doi: 10.1086/377492