Towards Understanding Sample Variance in Visually Grounded
Language Generation: Evaluations and Observations
Abstract
A major challenge in visually grounded language generation is to build robust benchmark datasets and models that can generalize well in real-world settings. To do this, it is critical to ensure that our evaluation protocols are correct, and benchmarks are reliable. In this work, we set forth to design a set of experiments to understand an important but often ignored problem in visually grounded language generation: given that humans have different utilities and visual attention, how will the sample variance in multi-reference datasets affect the models’ performance? Empirically, we study several multi-reference datasets and corresponding vision-and-language tasks. We show that it is of paramount importance to report variance in experiments; that human-generated references could vary drastically in different datasets/tasks, revealing the nature of each task; that metric-wise, CIDEr has shown systematically larger variances than others. Our evaluations on reference-per-instance shed light on the design of reliable datasets in the future.
1 Introduction
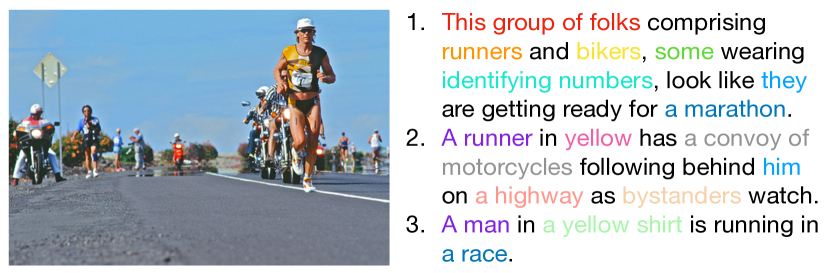
Natural Language Generation (NLG) is a challenging problem in Natural Language Processing (NLP)—the complex nature of NLG tasks arise particularly in the output space. In contrast to text classification or regression problems with finite output space, generation could be seen as a combinatorial optimization problem, where we often have exponentially many options (here is the size of the vocabulary and is the sentence length). With the advances of both Computer Vision and NLP techniques in deep learning, there have been growing interests in visually grounded NLG tasks, such as image captioning (Hodosh et al., 2013; Young et al., 2014; Lin et al., 2014; Vedantam et al., 2015), video captioning (Xu et al., 2016; Wang et al., 2019; Chen and Dolan, 2011) and visual storytelling (Huang et al., 2016). For example, Figure 1 shows an example of image captioning from the popular Flickr30k dataset.
In this paper, instead of crunching numbers and modifying model architectural designs to achieve new “state-of-the-art” results on leaderboards, we focus on re-assessing the current practices in visually grounded language generation research, including problems, datasets, evaluations, and tasks, from the sample variance angle. Given the differences in annotators’ utility function and human visual attention models, how could the sample variance in captions teach us building robust and reliable visually grounded language generation agents?
More specifically, we empirically investigate the variance among the multiple parallel references in different datasets, and its effect on the training performance and evaluation result of corresponding tasks. We further study the number of references per visual instance, and how it affects the training and testing performance. A simple search in ACL Anthology and CVF Open Access Site shows that 58 out of 60 papers on vision-based text generation do not report variance in experimental results, while they often claim that their methods outperform previous state-of-the-art. Our evaluation suggests that the variance cannot be ignored and must be reported, and that CIDEr (Vedantam et al., 2015) has shown higher variance than other metrics. Finally, introducing more training visual instances in the image and video captioning task on MS COCO and VATEX results in better performance on automatic metrics, while the visual storytelling task in VIST favors more references in the training set. For future dataset collection, we recommend the inclusion of more references when each reference is distinctive and complicated.
2 Research Questions and Settings
To understand sample variance, we conduct a series of experiments on multiple visually grounded NLG datasets, aiming to answer the following questions:
-
1.
How different are the text references from their parallel pairs?
-
2.
How greatly do different selections of references during either training or testing affect the final evaluation results?
-
3.
To train a more reliable model, shall we collect more visual instances with limited references or more parallel references for each instance given a fixed budget?
We focus on multi-reference visually grounded NLG tasks where each visual instance is paired with multiple parallel text references. Below we describe the datasets we investigate into, the models used for training, and the metrics for evaluation.
Datasets
Seven commonly used datasets in Table 1 are considered: Flickr8k (Hodosh et al., 2013), Flickr30k (Young et al., 2014), MS COCO (Lin et al., 2014), PASCAL-50S (Vedantam et al., 2015), VATEX_en (English), VATEX_cn (Chinese) (Wang et al., 2019), and VIST (Huang et al., 2016), covering the tasks of image captioning, video captioning, and visual storytelling.
Models
We apply an implementation111https://github.com/sgrvinod/a-PyTorch-Tutorial-to-Image-Captioning of Xu et al. (2015) for image captioning. We implement the Enc-Dec baseline model proposed by Wang et al. (2019) for video captioning. For visual storytelling, we use the AREL model222https://github.com/eric-xw/AREL proposed by Wang et al. (2018).
Metrics
We utilize six automatic metrics for natural language generation to evaluate the quality of the generated text, including BLEU (Papineni et al., 2002), ROUGE (Lin, 2004), METEOR (Elliott and Keller, 2013), CIDEr (Vedantam et al., 2015), SPICE (Anderson et al., 2016) and the most recent BERTScore (Zhang* et al., 2020) that is based on the pretrained BERT model.
We use nlg-eval333https://github.com/Maluuba/nlg-eval (Sharma et al., 2017) for the calculation of BLEU, METEOR, ROUGE_L and CIDEr. Note that we applied a patch444https://github.com/vrama91/coco-caption and choose to use IDF from the MSCOCO Vaildation Dataset when calculating consensus CIDEr score for each dataset. We use the authors’ releases for SPICE555https://github.com/peteanderson80/SPICE and BERTScore666https://github.com/Tiiiger/bert_score. BERTScore has been rescaled with baseline scores.
| Task | Dataset | #ref | #len | #train | #val | #test |
| Image Captioning | Flickr8k | k | k | k | ||
| Flickr30k | k | k | k | |||
| MS COCO’14 | k | k | k | |||
| PASCAL-50S | — | — | k | |||
| Video Captioning | VATEX_en | k | k | k | ||
| VATEX_cn | k | k | k | |||
| Visual Storytelling | VIST | k | k | k |
3 Reference Variance within Datasets
| Task | Dataset | BLEU | METEOR | ROUGE_L | CIDEr | SPICE | BERTScore | ||||||
| Image Captioning | Flickr8k | \collectcell5.05\endcollectcell | \collectcell2.63\endcollectcell | \collectcell6.72\endcollectcell | \collectcell.65\endcollectcell | \collectcell9.85\endcollectcell | \collectcell1.93\endcollectcell | \collectcell5.23\endcollectcell | \collectcell7.53\endcollectcell | \collectcell3.22\endcollectcell | \collectcell0.00\endcollectcell | \collectcell8.40\endcollectcell | \collectcell0.76\endcollectcell |
| Flickr30k | \collectcell2.22\endcollectcell | \collectcell1.98\endcollectcell | \collectcell3.98\endcollectcell | \collectcell.22\endcollectcell | \collectcell5.15\endcollectcell | \collectcell1.75\endcollectcell | \collectcell5.24\endcollectcell | \collectcell0.31\endcollectcell | \collectcell9.46\endcollectcell | \collectcell.63\endcollectcell | \collectcell2.77\endcollectcell | \collectcell1.14\endcollectcell | |
| MS COCO’14 | \collectcell3.52\endcollectcell | \collectcell2.05\endcollectcell | \collectcell4.70\endcollectcell | \collectcell.88\endcollectcell | \collectcell6.60\endcollectcell | \collectcell1.06\endcollectcell | \collectcell6.09\endcollectcell | \collectcell3.39\endcollectcell | \collectcell1.11\endcollectcell | \collectcell.46\endcollectcell | \collectcell4.40\endcollectcell | \collectcell0.98\endcollectcell | |
| PASCAL-50S | \collectcell3.60\endcollectcell | \collectcell.88\endcollectcell | \collectcell6.54\endcollectcell | \collectcell.59\endcollectcell | \collectcell0.18\endcollectcell | \collectcell.08\endcollectcell | \collectcell9.35\endcollectcell | \collectcell1.25\endcollectcell | \collectcell3.04\endcollectcell | \collectcell.47\endcollectcell | \collectcell7.26\endcollectcell | \collectcell.00\endcollectcell | |
| Video Captioning | VATEX_en | \collectcell0.64\endcollectcell | \collectcell.87\endcollectcell | \collectcell2.07\endcollectcell | \collectcell.48\endcollectcell | \collectcell0.65\endcollectcell | \collectcell.41\endcollectcell | \collectcell4.45\endcollectcell | \collectcell4.46\endcollectcell | \collectcell8.28\endcollectcell | \collectcell.65\endcollectcell | \collectcell8.99\endcollectcell | \collectcell.06\endcollectcell |
| VATEX_cn | \collectcell5.08\endcollectcell | \collectcell.52\endcollectcell | \collectcell5.63\endcollectcell | \collectcell.99\endcollectcell | \collectcell0.40\endcollectcell | \collectcell.21\endcollectcell | \collectcell7.28\endcollectcell | \collectcell5.89\endcollectcell | \collectcell1.59\endcollectcell | \collectcell.22\endcollectcell | \collectcell0.40\endcollectcell | \collectcell.05\endcollectcell | |
| Visual Storytelling | VIST | \collectcell8.42\endcollectcell | \collectcell.37\endcollectcell | \collectcell2.53\endcollectcell | \collectcell.23\endcollectcell | \collectcell0.54\endcollectcell | \collectcell.41\endcollectcell | \collectcell1.46\endcollectcell | \collectcell.13\endcollectcell | \collectcell.95\endcollectcell | \collectcell.81\endcollectcell | \collectcell5.46\endcollectcell | \collectcell.58\endcollectcell |
Reference CIDEr A man riding an elephant in a river. 225 A man in a brown shirt rides an elephant into the water. 227 A man rides an elephant into a river. 266 A man riding an elephant into some water of a creek. 271 Man riding an elephant into water surrounded by forest. 277 There are many taxi cabs on the road 4 Heavy city traffic all going in one direction 26 Many cars stuck in traffic on a high way 28 This shot is of a crowded highway full of traffic 28 A city street with lots of traffic and lined with buildings 35
In this section, we examine the sample variance among text references within seven visually grounded NLG datasets. To quantify the sample variance, we define a consensus score among parallel references (where is the -th text reference) for each visual instance:
| (1) |
where can be any metric in the above section. The consensus score represents the agreement among the parallel references for the same visual instance. Since the number of parallel references varies across datasets, we randomly sample 5 parallel references per instance (the minimum all datasets used) for a fair comparison. For datasets with more than 5 parallel references per instance, we repeat 10 times and take the average.
Table 2 shows the evaluation results. Noticeably, the datasets for the same task have similar consensus BERTScore, which is embedding-based (Kilickaya et al., 2017). Image captioning datasets score the highest on BERTScore consensus, video captioning datasets rank the second, while VIST for visual storytelling has the lowest consensus BERTScore. The descending consensus BERTScore order coincides with task difficulties. Video captioning is more complicated than image captioning due to its dynamic nature. Visual storytelling is even more challenging with the diverse and sophisticated stories in creative writing. Having the lowest consensus scores on all metrics indicates that VIST is a very challenging dataset. Moreover, we notice that CIDEr has the largest standard deviation (both absolutely and relatively) on consensus scores for all datasets. This suggests that CIDEr might be unstable and sensitive to the selection of references.
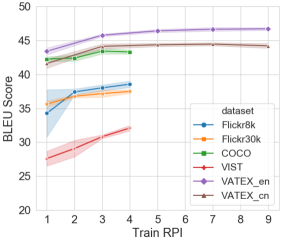
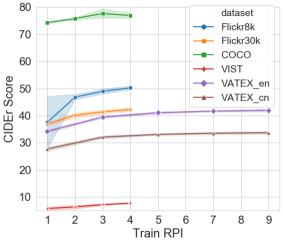
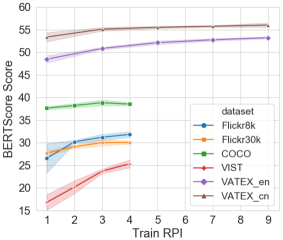
Table 3 takes a closer look at the high variance of the consensus CIDEr score. By definition, CIDEr score computes cosine similarity between the Term Frequency Inverse Document Frequency (TF-IDF) (Robertson, 2004) weighted n-grams. The reasons for the consensus CIDEr score to have high standard deviation are threefold: (1) N-grams with similar meanings might have totally different TF-IDF weights. Therefore, the CIDEr score is sensitive to word selection and sentence structure. (2) Token frequency differs across datasets. The consensus CIDEr score in Table 2 is calculated on the sentence level. We follow previous work and use IDF from the MSCOCO validation set for reliable results. In the MSCOCO validation set, ‘man’, ‘elephant’, and ‘river’ have more exposure, while ‘traffic’ and ‘highway’ are less mentioned. As a result, the first group of references has a much higher consensus CIDEr score than the second group. (3) Moreover, different from other metrics that scale from 0-1, the CIDEr score scales from 0-10. The enlarged scale also contributes to its salient variance.
4 Effect of Sample Variance on Evaluation Performance
For visually grounded NLG tasks, models are trained on preset training samples and evaluated on preset testing samples, and then results are reported on leaderboards. But would training or evaluating with different samples affect their performance? How reliable are those numbers? In this section, we study to what extent the sample variance during either training or testing affects the evaluation results. For simplicity, the number of parallel References Per visual Instance used for training or testing is denoted by RPI.
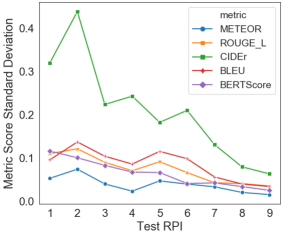
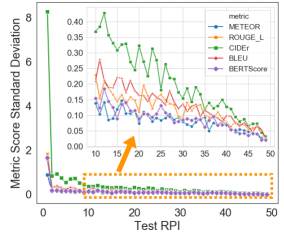
Effect of Testing Sample Variance
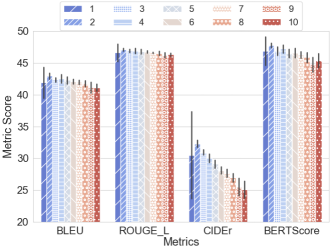
Previous studies on automatic metrics (Vedantam et al., 2015; Anderson et al., 2016) show that more testing references lead to better evaluation accuracy. Here we aim at examining the effect of using different references for testing. Given references per visual, we incrementally set the testing RPI as , and randomly sample the testing references from all of the references. For each RPI, the random sampling and evaluation process is conducted for 20 times. The model is trained on the complete training set.
In Figure 2, we demonstrate the experiments on PASCAL-50s for image captioning and VATEX_en for video captioning, where the standard deviation of evaluation scores on those metrics are plotted over RPI. For all metrics, the standard deviation shrinks as more references are employed for testing, indicating the evaluation bias caused by sample variance may be mitigated by introducing more parallel references. However, most of the existing datasets have far less than 50 references. For example, according to Wang et al. (2019), 12 out of 15 datasets for video captioning have less than 3 parallel text references per video, but the variance on those metrics under 3 RPI is very high. This casts doubt on the reliability of the model’s performance. For fairer model comparison, we hereby encourage researchers to (1) provide the evaluation set with more parallel references when collecting new datasets, and (2) report the variance of the model’s metric scores as well when comparing to other models. Noticeably, the variance of the model’s performance on CIDEr is significantly larger than on other metrics, which supplements the previous finding in Section 3 that CIDEr is very sensitive to the reference sample variance.
Effect of Training Sample Variance
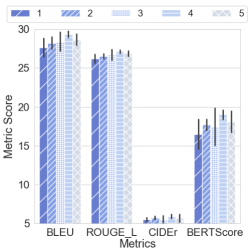
To investigate the effect of training sample variance, we train the models with different training RPI, from 1 to . Similarly, we randomly sample the training references from references. For each RPI, we repeat the random sampling and training process for 10 times on each dataset. The evaluation is conducted on the complete test set.
Figure 3 depicts the performance of BLEU, CIDEr and BERTScore on each dataset when the corresponding model is trained with different RPI. While the performance on all datasets improves with the increase of training RPI, experimental results show salient variance on all metric scores when the amount of training data is insufficient, which indicates the selection of training samples will influence the final performance. Furthermore, VIST displays notable score deviation on all three metrics, which suggests visual storytelling to be sensitive to the selection of training data.
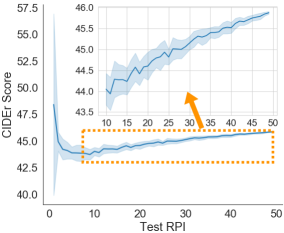
5 More Visuals or More References?
When collecting a new visually-grounded NLG dataset with a certain budget, there often exists a decision between collecting more visual instances v.s. more text references for each visual. How many parallel references do we need to train a reliable model for visual-grounded text generation? Here we study the balance between the number of visual instances and the number of parallel text references in the datasets, and how these two factors affect the training performance for each task.
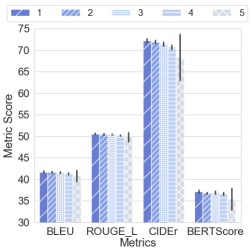
For each task, we fix the total number of training data samples (i.e., unique visual-reference pairs), and set the training RPI to be . We have . More specifically, we train the image captioning model on MS COCO with 82,740 samples, and use 25,200 and 7,980 samples for training in the video captioning task and visual storytelling task respectively. Figure 4 illustrates the evaluation results for each task. For each RPI, we repeat the random sampling and training process for 10 times on each dataset. As the training RPI increases, the performance of the image captioning model and video captioning model declines on all four metrics, while the visual storytelling performance improves. This suggests that introducing more visual instances during training is beneficial for the captioning tasks, where the parallel references are all objective descriptions regarding the same visual. In contrast, the stories in VIST are more expressive and may refer to imaginary contents (Wang et al., 2018), leading to a much larger search space during generation. In this case, introducing more parallel references into training may help to train a more stable and better-performing storytelling model.
6 Conclusion
We study the sample variance in visually-grounded language generation, in terms of reference sample variance within datasets, effects of training or testing sample variance on metric scores, and the trade-off between the visual instance number and the parallel reference number per visual. Along with some intriguing findings, we urge researchers to report sample variance in addition to the metric scores when comparing models’ performance. We also recommend that when collecting a new dataset, the test set should include more parallel references for fair evaluation, while for the training set, when the text generations are expected to be distinctive and complicated, more parallel references should be collected otherwise a larger variety of visual appearances is more favorable.
Acknowledgments
The UCSB authors were sponsored by an unrestricted gift from Google. The views and conclusions contained in this document are those of the authors and should not be interpreted as representing the sponsor.
References
- Anderson et al. (2016) Peter Anderson, Basura Fernando, Mark Johnson, and Stephen Gould. 2016. Spice: Semantic propositional image caption evaluation. Lecture Notes in Computer Science, page 382–398.
- Chen and Dolan (2011) David Chen and William Dolan. 2011. Collecting highly parallel data for paraphrase evaluation. In Proceedings of the 49th Annual Meeting of the Association for Computational Linguistics: Human Language Technologies, pages 190–200, Portland, Oregon, USA. Association for Computational Linguistics.
- Elliott and Keller (2013) Desmond Elliott and Frank Keller. 2013. Image description using visual dependency representations. In Proceedings of the 2013 Conference on Empirical Methods in Natural Language Processing, pages 1292–1302.
- Hodosh et al. (2013) Micah Hodosh, Peter Young, and Julia Hockenmaier. 2013. Framing image description as a ranking task: Data, models and evaluation metrics. Journal of Artificial Intelligence Research, 47:853–899.
- Huang et al. (2016) Ting-Hao Huang, Francis Ferraro, Nasrin Mostafazadeh, Ishan Misra, Aishwarya Agrawal, Jacob Devlin, Ross Girshick, Xiaodong He, Pushmeet Kohli, Dhruv Batra, et al. 2016. Visual storytelling. In Proceedings of the 2016 Conference of the North American Chapter of the Association for Computational Linguistics: Human Language Technologies, pages 1233–1239.
- Kilickaya et al. (2017) Mert Kilickaya, Aykut Erdem, Nazli Ikizler-Cinbis, and Erkut Erdem. 2017. Re-evaluating automatic metrics for image captioning. In Proceedings of the 15th Conference of the European Chapter of the Association for Computational Linguistics: Volume 1, Long Papers, pages 199–209, Valencia, Spain. Association for Computational Linguistics.
- Lin (2004) Chin-Yew Lin. 2004. ROUGE: A package for automatic evaluation of summaries. In Text Summarization Branches Out, pages 74–81, Barcelona, Spain. Association for Computational Linguistics.
- Lin et al. (2014) Tsung-Yi Lin, Michael Maire, Serge Belongie, James Hays, Pietro Perona, Deva Ramanan, Piotr Dollár, and C Lawrence Zitnick. 2014. Microsoft coco: Common objects in context. In European conference on computer vision, pages 740–755. Springer.
- Papineni et al. (2002) Kishore Papineni, Salim Roukos, Todd Ward, and Wei-Jing Zhu. 2002. Bleu: a method for automatic evaluation of machine translation. In Proceedings of the 40th annual meeting on association for computational linguistics, pages 311–318. Association for Computational Linguistics.
- Robertson (2004) S. Robertson. 2004. Understanding inverse document frequency: on theoretical arguments for idf. J. Documentation, 60:503–520.
- Sharma et al. (2017) Shikhar Sharma, Layla El Asri, Hannes Schulz, and Jeremie Zumer. 2017. Relevance of unsupervised metrics in task-oriented dialogue for evaluating natural language generation. CoRR, abs/1706.09799.
- Vedantam et al. (2015) Ramakrishna Vedantam, C Lawrence Zitnick, and Devi Parikh. 2015. Cider: Consensus-based image description evaluation. In Proceedings of the IEEE conference on computer vision and pattern recognition, pages 4566–4575.
- Wang et al. (2018) Xin Wang, Wenhu Chen, Yuan-Fang Wang, and William Yang Wang. 2018. No metrics are perfect: Adversarial reward learning for visual storytelling. In Proceedings of the 56th Annual Meeting of the Association for Computational Linguistics (Volume 1: Long Papers), pages 899–909, Melbourne, Australia. Association for Computational Linguistics.
- Wang et al. (2019) Xin Wang, Jiawei Wu, Junkun Chen, Lei Li, Yuan-Fang Wang, and William Yang Wang. 2019. Vatex: A large-scale, high-quality multilingual dataset for video-and-language research. In Proceedings of the IEEE International Conference on Computer Vision, pages 4581–4591.
- Xu et al. (2016) Jun Xu, Tao Mei, Ting Yao, and Yong Rui. 2016. Msr-vtt: A large video description dataset for bridging video and language. In Proceedings of the IEEE conference on computer vision and pattern recognition, pages 5288–5296.
- Xu et al. (2015) Kelvin Xu, Jimmy Ba, Ryan Kiros, Kyunghyun Cho, Aaron Courville, Ruslan Salakhudinov, Rich Zemel, and Yoshua Bengio. 2015. Show, attend and tell: Neural image caption generation with visual attention. In International conference on machine learning, pages 2048–2057.
- Young et al. (2014) Peter Young, Alice Lai, Micah Hodosh, and Julia Hockenmaier. 2014. From image descriptions to visual denotations: New similarity metrics for semantic inference over event descriptions. Transactions of the Association for Computational Linguistics, 2:67–78.
- Zhang* et al. (2020) Tianyi Zhang*, Varsha Kishore*, Felix Wu*, Kilian Q. Weinberger, and Yoav Artzi. 2020. Bertscore: Evaluating text generation with bert. In International Conference on Learning Representations.