Scaling relations and baryonic cycling in local star-forming galaxies: II. Gas content and star-formation efficiency
Assessments of the cold-gas reservoir in galaxies are a cornerstone for understanding star-formation processes and the role of feedback and baryonic cycling in galaxy evolution. Here we exploit a sample of 392 galaxies (dubbed MAGMA, Metallicity and Gas for Mass Assembly), presented in a recent paper, to quantify molecular and atomic gas properties across a broad range in stellar mass, , from M⊙. First, we find the metallicity () dependence of to be shallower than previous estimates, with . Second, molecular gas mass is found to be strongly correlated with and star-formation rate (SFR), enabling predictions of good to within 0.2 dex; analogous relations for atomic gas mass and total gas mass are less accurate, 0.4 dex and 0.3 dex, respectively. Indeed, the behavior of atomic gas mass in MAGMA scaling relations suggests that it may be a third, independent variable that encapsulates information about the circumgalactic environment and gas accretion. If is considered to depend on , together with and SFR, we obtain a relation that predicts to within 0.05 dex. Finally, the analysis of depletion times and the scaling of / and / over three different mass bins suggests that the partition of gas and the regulation of star formation through gas content depends on the mass regime. Dwarf galaxies ( M⊙) tend to be overwhelmed by (Hi) accretion, and despite short (and thus presumably high star-formation efficiency), star formation is unable to keep up with the gas supply. For galaxies in the intermediate “gas-equilibrium” bin ( M⊙ M⊙), star formation proceeds apace with gas availability, and Hi and H2 are both proportional to SFR. In the most massive “gas-poor, bimodality” regime ( M⊙), Hi does not apparently participate in star formation, although it generally dominates in mass over H2. Our results confirm that atomic gas plays a key role in baryonic cycling, and is a fundamental ingredient for current and future star formation, especially in dwarf galaxies.
Key Words.:
Galaxies: star formation – Galaxies: ISM – Galaxies: fundamental parameters – Galaxies: statistics – Galaxies: dwarfs – (ISM:) evolution1 Introduction
Galaxy evolution is inevitably regulated by the gas reservoir available for star formation. In its molecular form, this gas fuels star formation that, during stellar evolution, enriches the interstellar medium (ISM) in a galaxy with metals and dust. Over the course of a galaxy’s lifetime, stars exploding as supernovae (SNe) impart mechanical and radiative energy to the surrounding environment, and sow the seeds for dust grain formation in SNe ejecta and the circumnuclear envelopes of evolved stars. Metals produced by massive stars and other stellar events enrich the surrounding ISM, changing its properties and enhancing its ability to cool. Gas may also be expelled from the galaxy, becoming part of the circumgalactic medium (CGM) surrounding the galaxy, where it may be reaccreted (see recent review by Tumlinson et al. 2017). Baryonic cycling in the galaxy eco-system comprises this combination of gas accretion, the conversion of gas into stars, the injection of energy, and the ISM enrichment by metals and dust grains. The manifestation of baryonic cycling can be found in scaling relations among star-formation rate (SFR) and stellar, gas, and metal content which are becoming powerful diagnostics for understanding how these processes depend on their mass and environment.
Two key concepts in baryonic cycling are the overall efficiency with which stars are ultimately produced from the initial conditions in the host dark-matter halo (DMH) and the efficiency with which stars are formed from the available gas supply. Unlike more massive galaxies, such as the Milky Way (MW), dwarf galaxies seem to be highly inefficient at producing stars (e.g., Behroozi et al. 2013; Moster et al. 2013; Graziani et al. 2015, 2017). This is a consequence of the relation between parent dark-matter halos (DMHs) and stars, and is thought to be regulated by baryonic physics, namely the energy released into the ISM and intergalactic medium (IGM) by young stellar populations or active galactic nuclei (AGN) in the more massive galaxies.
These feedback processes are arguably the most important drivers of galaxy evolution. Many fundamental relations are thought to be manifestations of feedback, resulting in self-regulated balances between gas cooling and AGN-(black-hole) driven and supernova-driven outflows. These range from galaxy stellar mass functions (e.g., Baldry et al. 2012; Ilbert et al. 2013), the mass-metallicity relation (MZR, e.g., Tremonti et al. 2004), gas scaling with SFR (e.g., Hopkins et al. 2014), to the baryonic Tully-Fisher relation (e.g., McGaugh et al. 2000; McGaugh 2012), and the cosmic star-formation history of the Universe (e.g., Madau & Dickinson 2014).
Dwarf galaxies111With stellar masses M⊙. are particularly susceptible to feedback, because winds from massive stars and SNe can efficiently eject gas and metals from a shallow potential well, thus suppressing star formation (e.g., Gnedin et al. 2009; Gnedin & Kravtsov 2010; Graziani et al. 2020). The low star-formation efficiency (SFE) for dwarfs, predicted by the stellar-DMH relation, contrasts with observational evidence in which some local metal-poor star-forming dwarf galaxies show short molecular depletion times, a signature of efficient star formation (Hunt et al. 2015; Amorín et al. 2016). However, the low SFE for halos [SFEDMH] is relative to the cosmic baryon fraction ; the low SFE for SFR is the “observer’s definition” relative to the gas, where SFEgas () and SFEH2 () are the inverses of gas depletion times.
The stochastic star-formation histories (SFHs) common in dwarf galaxies (e.g., Tolstoy et al. 2009; McQuinn et al. 2010; Weisz et al. 2011; Gallart et al. 2015) may act over long time scales to produce a net low SFEDMH, as expected theoretically from the DMH relation. Short depletion times (high SFEH2) in dwarf galaxies could be a “smoking gun” for a typical, bursty SFH (e.g., Madau et al. 2014). On the other hand, they could be a signature of galaxies with current higher SFEDMH such as those found recently for galaxies in the Epoch of Reionization by the “Universe Machine” (Behroozi et al. 2019).
From an observational point of view, feedback is not straightforward to quantify and many clues are indirect. The inefficiency of low-mass halos SFEDMH to form stars depends on at least three processes: (P1) preventive feedback, the (lack of) availability of cold baryons from the host halo; (P2) inefficiency of the star-formation process, the conversion of the available gas into stars; and (P3) ejective feedback, the outright expulsion of energy, momentum, and material including gas, dust, and metals.
In this paper, we focus on two of these mechanisms: the availability of cold gas to form stars (P1), and the inefficiency of the star-formation process itself (P2). In a companion paper (Tortora et al. 2020, in prep.), we examine the remaining mechanism, (P3), namely the efficiency of metal enrichment and ejective feedback. To perform our analysis, we need a sample of galaxies, with homogeneously-determined parameters, that contains a significant quantity of dwarf galaxies. In Ginolfi et al. (2020, hereafter Paper I), we have constructed such a sample, Metallicity And Gas for Mass Assembly (MAGMA), as described in Sect. 2.
The rest of the paper is organized as follows: we first reexamine the conversion of CO luminosity to molecular gas mass in Sect. 3. This new formulation of is used in Sect. 4 to establish scaling relations for the total gas content, and the separate molecular and atomic components. In Sect. 5, we assess the interplay between gas and star formation, focusing in particular on the efficiency of star formation with H2 (Sect. 5.1); Hi properties (Sect. 5.2); and the link between molecular and atomic gas (Sect. 5.3). We discuss the ramifications of our results in Sect. 6, and give our conclusions in Sect. 7. Throughout the paper we assume that solar metallicity (O/H)⊙ is given by 12log(O/H) = 8.69 (Asplund et al. 2009).
2 The MAGMA sample
We have recently compiled a sample of 392 galaxies (dubbed MAGMA) with uniformly-derived stellar masses, , SFRs, metallicity [12log(O/H)], atomic gas mass (), and molecular gas mass (); more than 30% of the MAGMA galaxies are dwarfs with M⊙ (Paper I). MAGMA comprises more than 9 separate studies in the literature with measurements of Hi mass and CO luminosity, ; these include xCOLDGASS (Saintonge et al. 2017; Catinella et al. 2018); ALLSMOG (APEX Low-redshift Legacy Survey of MOlecular Gas: Cicone et al. 2017); HRS (Herschel Reference Sample: Boselli et al. 2010, 2014a, 2015); KINGFISH (Key Insights into Nearby Galaxies, a Far-Infrared Survey with Herschel: Kennicutt et al. 2011; Aniano et al. 2020); NFGS (Nearby Field Galaxy Survey: Kannappan et al. 2013); Virgo star-forming dwarf galaxies (Grossi et al. 2016); BCDs (Blue Compact Dwarfs) from Hunt et al. (2015) and Hunt et al. (2020, in preparation); DGS (Dwarf Galaxy Survey: Cormier et al. 2014); and other single objects from various papers (see Paper I for more details). The main requirement for MAGMA was the existence of both CO and Hi detections, together with spectroscopic measurements of O/H. As described in Paper I, galaxies with spectroscopic evidence for active galactic nuclei (AGN) or a composite nature were eliminated from the sample. In addition, when possible (for HRS and KINGFISH), galaxies showing an Hi deficiency were not included.
Thus, MAGMA is a representative sample of star-forming, isolated galaxies in the Local Universe. MAGMA contains fewer low-mass galaxies than a purely mass-limited sample, because of the difficulty in obtaining CO detections and because of the selection criteria in some of the parent surveys (e.g., xCOLDGASS, HRS). It is rather representative of the location of galaxies along the local star-formation main sequence (SFMS) over a vast range in stellar mass.
Stellar masses and SFRs were uniformly calculated for the entire MAGMA sample based on photometry from the Wide-field Infrared Survey Explorer (WISE, Wright et al. 2010) and the Galaxy Evolution Explorer (GALEX, Morrissey et al. 2007). For , we used the formulation by Hunt et al. (2019) given for the CIGALE calibration (see also Boquien et al. 2019). This formulation is based on WISE W1 (3.4 m) or IRAC (3.6 m) luminosities, after correcting for free-free nebular continuum emission associated with ionized gas. SFR was calculated according to the precepts of Leroy et al. (2019), based on WISE (W3, W4) and GALEX photometry. These are calibrated on the GALEX-SDSS-WISE Legacy Catalog(GSWLC) presented by Salim et al. (2016, 2018), that relies on CIGALE fits of 700 000 low-redshift galaxies.
Both and SFR are based on the underlying CIGALE calibration, and on the Initial Mass Function (IMF) by Chabrier (2003). In addition to the IMF, any and SFR calibration also depends on the underlying SFH. Salim et al. (2018) fit the SFH to an old stellar population, added to an exponentially decaying SFH, and a young burst with nearly constant SFR. The CIGALE calibration presented by Hunt et al. (2019) is based on a “delayed” parameterization SFH, coupled with an additional star-formation episode that could correspond to an old population or a younger one. Such a functional form gives a nearly linear increase of the SFR from the onset of star formation rather than an abrupt one (see Boquien et al. 2019, for more details). The main ingredients, namely an exponential (or approximately) declining SFH coupled with an additional stellar population, is the same in both calibrations, and should be similar enough to ensure consistency in our estimates of and SFR.
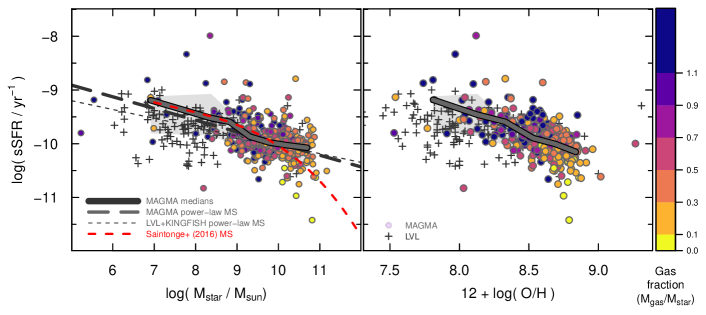
Figure 1 shows for the MAGMA sample the relation of specific SFR (sSFR SFR/) and , where we have framed the SFMS in terms of sSFR rather than SFR. The underlying SFMS is shown as a dashed line:
| (1) |
This SFMS corresponds to the robust least-squares power-law best fit222For all statistical analysis, we rely on the R statistical package: R Core Team (2018), R: A language and environment for statistical computing, R Foundation for Statistical Computing, Vienna, Austria (https://www.R-project.org/)., for the MAGMA galaxies. Also shown in Fig. 1 is the cubic form for the SFMS found by Saintonge et al. (2016); the formulation pertains formally only to galaxies with M⊙. In any case, it corresponds perfectly down to M⊙ in MAGMA galaxies, and also traces the downward curvature beyond M⊙. Also shown in Fig. 1, is the fit to galaxies from the Local Volume Legacy (LVL, see Dale et al. 2009) and KINGFISH taken from Hunt et al. (2019), with the parameters computed in the same way as for the MAGMA galaxies. It has a slightly shallower power-law slope, . The power-law slope for MAGMA is consistent with earlier estimates of the local SFMS (e.g., Elbaz et al. 2007) with slopes of . Finally, the MAGMA medians are virtually identical to the curved SFMS found by Saintonge et al. (2016), even at low . All this suggests that overall, the MAGMA galaxies are fundamentally a main-sequence sample; there are very few galaxies having deviations larger than from the SFMS trend, except possibly at low (see Paper I).
Metallicities in the form of nebular oxygen abundances, O/H, were taken from the original works in the (linear) [Nii] calibration by Pettini & Pagel (2004, hereafter PP04N2), or according to the “direct” electron-temperature Te method; the PP04N2 calibration is the closest strong-line approximation to the Te technique (see, e.g., Hunt et al. 2016a, for further discussion). When neither of these were available, the original calibration was converted to PP04N2 according to the expressions given by Kewley & Ellison (2008). Ginolfi et al. (2020) performed careful checks to ensure that the various methodologies for metallicity determinations from the original samples were not unduly affected by metallicity gradients or aperture effects.
Atomic gas masses were taken from the original works (see Paper I), and were added to the molecular gas mass to obtain total gas mass, . When possible, the Hi mass was defined within the optical radius of the galaxies (see Hunt et al. 2015), but in the majority of galaxies, the measurements were global. This point will be discussed further in Sect. 6.1. Molecular gas masses were inferred from , using a metallicity-dependent conversion factor . In Paper I, we used an with an approximately quadratic metallicity dependence below Solar O/H, according to the expression given by Hunt et al. (2015). Such a dependence is consistent with the dependence obtained from dust-to-gas ratios (e.g., Leroy et al. 2011; Sandstrom et al. 2013) and with independent calibrations of molecular gas mass (Accurso et al. 2017). In this paper, we recalculate molecular and total gas masses, revisiting the conversion factor by exploiting the MAGMA sample itself as the fiducial reference calibration.
3 The conversion of CO luminosity to molecular gas mass: A new assessment
Under typical physical conditions, CO emission is optically thick, but by comparing virial masses of molecular clouds with their CO luminosity, it has been possible to associate a given with through a simple conversion factor :
| (2) |
CO can be photodissociated in an intense UV radiation field (e.g., van Dishoeck & Black 1988; Wolfire et al. 2010), so that self-shielding is necessary for significant CO emission to emerge. The implication is that needs to be larger in low-metallicity environments with low dust content and with harder and stronger UV fields. It also means that carbon resides in atomic or ionized form when CO is photodissociated, and that CO may cease to be a reliable tracer of in these conditions (e.g., Wolfire et al. 2010; Bolatto et al. 2013).
Much effort has been devoted over the last few decades to quantifying the use of CO luminosity as a tracer of molecular gas mass (e.g., Wilson 1995; Israel 1997; Bolatto et al. 2008, 2013; Leroy et al. 2009, 2011; Schruba et al. 2012; Genzel et al. 2012; Sandstrom et al. 2013; Genzel et al. 2015; Hunt et al. 2015; Amorín et al. 2016; Accurso et al. 2017). While most of the variation in is usually attributed to metallicity, O/H, there are also indications that other parameters are at play such as sSFR (e.g., Genzel et al. 2015; Accurso et al. 2017).
Here we use MAGMA to explore the limits above which CO can trace molecular gas, and the dependence of on O/H, sSFR, and other available quantities. A caveat with such an analysis is that the observers’ definition of SFEH2 is the inverse of the molecular depletion time :
| (3) |
Thus it is virtually impossible to disentangle the effects of SFEH2, and varying with metallicity or other parameters; in fact, only the ratio of / is constrained by the observables, and SFR. Moreover, the common definition of SFEH2 is really an inverse timescale, making a physical discussion of SFEH2 difficult, if not impossible, with the observables at hand.
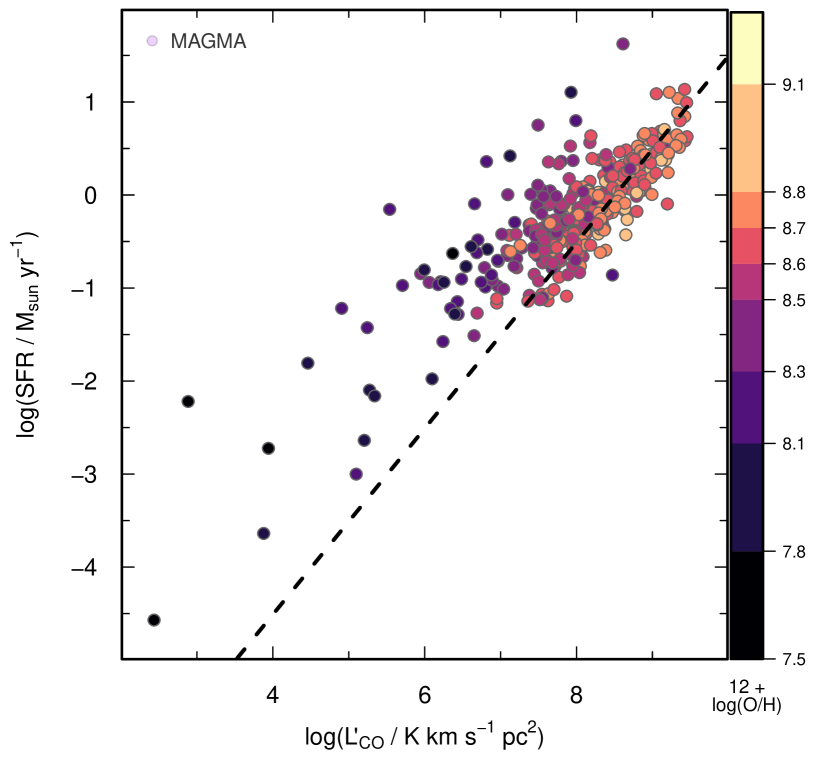
The correlation between SFR and CO luminosity for MAGMA galaxies is shown in Fig. 2. The dashed line corresponds to an imposed unit slope and a fitted offset of , roughly consistent with the offset of found by Gao & Solomon (2004), converted from far-infrared luminosity LFIR to SFR by Hunt et al. (2015). Part of this difference can be attributed to the different IMFs; the conversion of LFIR to SFR by Hunt et al. (2015) assumed a Kroupa (2001) IMF that has an offset of dex relative to the Chabrier (2003) IMF used here. At a given metallicity, the MAGMA data are best fit with a slightly sublinear slope (in logarithmic space) between SFR and , but overall are consistent with the unit slope reported by Gao & Solomon (2004). Figure 2 shows that at a given SFR, the more metal-poor galaxies are shifted to the left, with smaller , as also found by Hunt et al. (2015). This shift corresponds to a variation of with metallicity that we explore below.
Assuming that SFR and are approximately linearly related enables the exploitation of results by Saintonge et al. (2011a, b). They found that is correlated with sSFR, in the sense that shorter depletion times are associated with larger sSFR (see also Huang & Kauffmann 2014, 2015; Genzel et al. 2015). However, their sample was mass-selected with little metallicity variation, so they could not explore trends of and metallicity. In fact, it is well established that sSFR and O/H are inversely correlated (e.g., Hunt et al. 2012; Salim et al. 2014; Hunt et al. 2016a; Ginolfi et al. 2020), so that it is not straightforward to separate the two effects.
For MAGMA, as in Hunt et al. (2015), we adopt the hypothesis that depends on sSFR, and assume that any deviations from the global trend are governed by and its metallicity dependence. This albeit simplistic assumption was validated by Accurso et al. (2017) who investigated CO and C+ emission in a sample observed by Herschel, and compared it with radiative transfer models of photodissociation regions (PDRs). They found that variations in can be almost totally ascribed to metallicity variations, with only a small dependence on sSFR. Here we attempt to disentangle the effects of metallicity and sSFR (and their mutual correlation) and focus primarily on metallicity and its impact on the destruction of CO through photodissociation in metal-poor radiation fields.
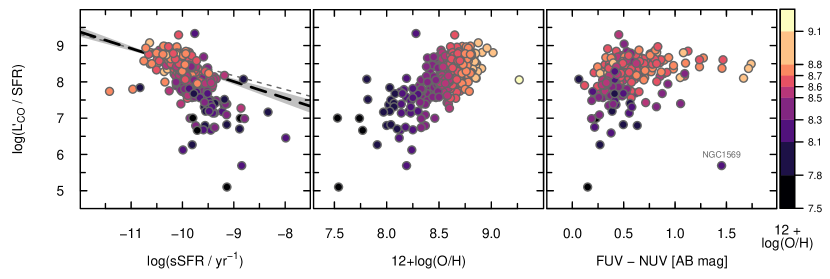
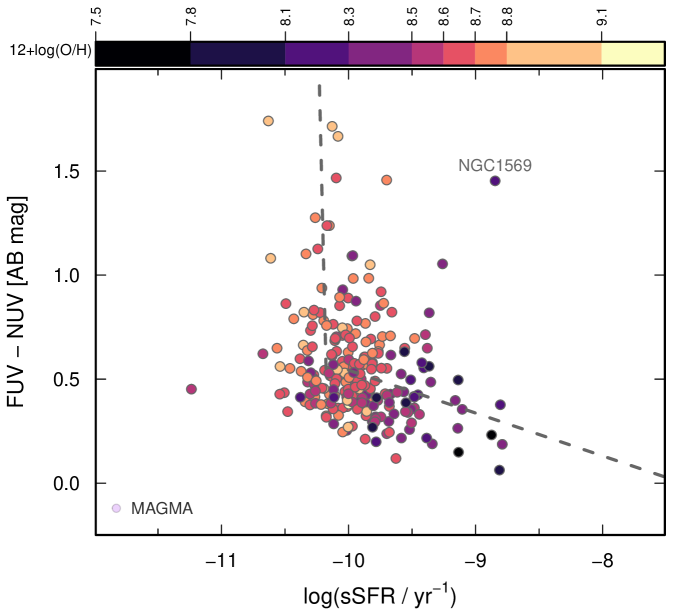
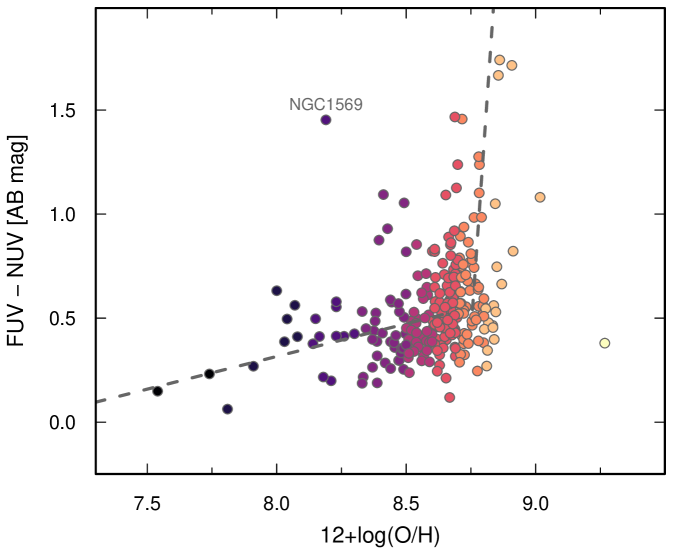
Figure 3 illustrates the correlation of sSFR and the ratio of and SFR for MAGMA. Using a robust least-squares fitting algorithm, and applying it only to solar- and super-solar metallicity galaxies, we find the best-fit regression:
| (4) | |||||
The relation has a median absolute deviation (MAD) of 0.19 dex for the 129 MAGMA galaxies at these metallicities. The power-law slope of is somewhat steeper than the value of found for the (much smaller) dataset of Hunt et al. (2015), based mostly on the earlier version of xCOLDGASS by Saintonge et al. (2011a); both trends are shown in Fig. 3. Low-metallicity galaxies at high sSFR deviate from the regression as indicated by the metallicity color coding in the figure. The correlation of /SFR with O/H is plotted in the middle panel of Fig. 3, where the association of low /SFR with low metallicity is clearly evident. In the right panel of Fig. 3, we have attempted to quantify radiation-field hardness by the GALEX FUVNUV color, here corrected only for Galactic extinction as described in Paper I. The use of FUVNUV to probe radiation-field hardness is compromised by its dependence on IMF and star-formation history (SFH), in particular for early-type galaxies (e.g., Zaritsky et al. 2015; Yıldız et al. 2017).
With the aim of quantifying radiation-field hardness, in Fig. 4, we explore the dependence of FUVNUV on sSFR (top panel) and on O/H (bottom). NGC 1569 is an outlier in both plots probably due to the difficulty in correcting FUVNUV for Galactic extinction because of its relatively low Galactic latitude: according to Schlafly & Finkbeiner (2011), = 1.90 mag, so it is extremely reddened by the MW.
There is no straight single power-law dependence of FUVNUV on either sSFR or O/H, but rather a linear (power-law) trend, and then a plateau. Such behavior also emerged in the analysis of 2000 galaxies by Bouquin et al. (2015) who plotted FUVNUV against NUV[3.6 micron] colors, an approximate tracer of sSFR. They found evidence for two trends: a tight GALEX Blue Sequence (GBS) up to FUVNUV0.7, and a broader GALEX Red Sequence (GRS) for redder colors. By comparing the data with models, they attributed the GBS to actively star-forming galaxies over a wide range of , while more evolved, passive, galaxies lie on the GRS. At one point, however, older early-type galaxies become bluer in FUVNUV because of the UV upturn as galaxies age (e.g., Gil de Paz et al. 2007; Kaviraj et al. 2007; Rampazzo et al. 2007; Boissier et al. 2018). Both the GBS (the more horizontal trends) and the GRS (the almost vertical ones) can be seen in MAGMA data in Fig. 4. Relative to (log) sSFR and 12log(O/H), we have performed piecewise regressions, corresponding roughly to the GBS and the GRS, and these are overlaid in Fig. 4. This bimodal behavior of FUVNUV makes it difficult to unambiguously trace radiation-field hardness using this parameter. Another difficulty is caused by the level of reddening and the shape of the dust attenuation curve, both of which are expected to have an impact on FUVNUV (e.g., Wyder et al. 2007).
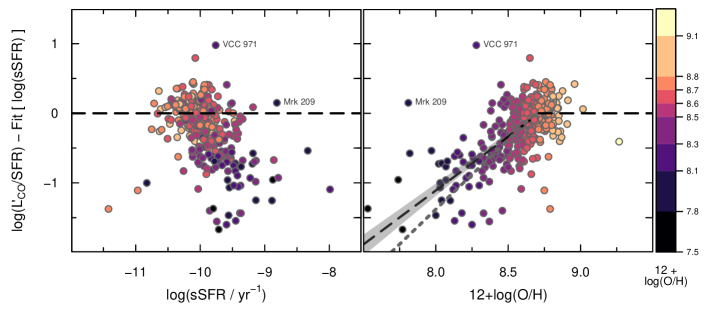
The implicit assumption that we now make is that metallicity is the best tracer of radiation-field hardness and the propensity for CO to photodissociate. We make the further assumption that the deviations of the trends for and sSFR depend on metallicity. Consequently, to attempt to separate the effects on of sSFR and metallicity, we apply the regression of Eqn. (4) to the entire MAGMA sample, and plot the residuals of the fit in Fig. 5. The left panel shows the residuals relative to sSFR and the right with respect to 12log(O/H). If we assume that is constant at solar metallicity and above (), we can fit the residuals at lower metallicity to a trend with 12log(O/H) as shown in the right-hand panel of Fig. 5. The scatter in the fit (MAD) is 0.25 dex for the 261 MAGMA galaxies at sub-solar metallicities333We have eliminated two galaxies from this fit because of their extreme outlier nature, namely Mrk 209 and VCC 971 (galaxies from DGS and HRS, respectively, with unreliable CO detections). Despite the robust fitting algorithm, these two galaxies alone change the power-slope from (without them) to (with them)..
Assuming, as alluded to above, that the same correlation of /SFR and sSFR continues to low metallicities, and that the only deviation is due to metallicity variations, we can convert the regression shown in the right panel of Fig. 5 to an expression for :
| (5) |
where is quantified by dex[]. The power-law metallicity dependence of 1.55 is somewhat shallower than the quadratic dependence found by Hunt et al. (2015), but consistent with other estimates using different techniques (Amorín et al. 2016; Accurso et al. 2017, e.g., power-law slopes of 1.51.7). The difference relative to our earlier, steeper, estimation of O/H dependence is related to the slope of the /SFR ratio vs. sSFR. Here in Eqn. (4) the regression with slope is slightly steeper than the best-fit value of found by Hunt et al. (2015) and Saintonge et al. (2011b). Fig. 3 illustrates the two regressions. The most probable cause of this difference is the way SFRs are calculated: Saintonge et al. (2011b) derive SFRs from fitting of the optical-UV spectral energy distributions, while in Paper I we use the empirical approach of Leroy et al. (2019) based on FUV, NUV, and mid-infrared luminosities, similar to the “ladder” technique described in Saintonge et al. (2017). If we fix the slope of the regression in Eqn. (4) to , we find a quadratic metallicity dependence as in Hunt et al. (2015), but with a much poorer overall fit for the larger MAGMA sample. Such behavior exemplifies the difficulty in separating the effects of sSFR and metallicity, showing that lingering dependencies almost certainly exist within our formulation.
The choice of a broken power-law as a function of metallicity, rather than a continuous one (e.g., Amorín et al. 2016; Accurso et al. 2017), is motivated mainly by the data. Rather than fitting only the lower metallicity points, we also applied a continuous power law to fit the trend of /SFR as a function of metallicity. In this case, the slope is shallower, 1.3, rather than the best fit value of 1.55. To better understand why, we fit with a power law only the metal-rich galaxies (those with 12log(O/H) 8.69), and obtained a negative slope of . This would imply that varies with metallicity in an unphysical way, ()0.3, but would explain why the slope is shallower when we fit all the galaxies, not just those with sub-Solar metallicities.
Physically, the variation of with metallicity is motivated primarily by considerations about dust shielding and a higher ambient UV radiation field, neither of which is expected to change dramatically above a limiting metallicity. The theoretical exponential trend predicted by Wolfire et al. (2010) is roughly flat at super-Solar metallicities, and fairly well approximated by the broken power law we use here. Glover & Mac Low (2011) carried out hydrodynamical modeling of molecular clouds coupled with a chemical network, and also found that could be best formulated as a broken power law. They found that the main variable for variation is visual extinction within the cloud, and that above 3, the conversion factor is roughly constant. Thus, our use of a broken power law, namely a variation with metallicity only below a certain metallicity threshold (here we take it to be ) can be justified also from a theoretical perspective.
In contrast to our technique, derivations of based on dust-to-gas ratios (DGRs) in resolved regions within galaxies generally give a weaker metallicity dependence, possibly because of higher DGRs in the dense gas residing in molecular complexes (e.g., Leroy et al. 2011; Sandstrom et al. 2013). Virial-based H2 mass estimates give little or no metallicity dependence (e.g., Leroy et al. 2006, 2011), probably because the virial measurements only reflect the CO-bright clouds (e.g., Bolatto et al. 2008).
4 Gas content and scaling relations with stellar mass and SFR
The gas reservoir available to a galaxy regulates baryonic cycling, and provides the fuel for star formation. Examining the scaling relations among gas content, stellar mass, SFR, and metallicity is crucial for understanding the physical mechanisms behind the baryonic energy exchange. In Paper I, we looked at scaling relations through several Principal Component Analyses (PCAs). Four-dimensional PCAs with , SFR, O/H, and gas mass (either total , atomic , or molecular ) suggested that the parameter space for galaxies is two-dimensional (2D). In all the PCAs examined (including 5D, 4D, and 3D), metallicity was always the most dependent parameter (see also Hunt et al. 2012, 2016a). Thus, it was not clear that adding information about gas content adds another dimension to the description of a galaxy, although we re-examine this conclusion below. The underlying implication is that gas content, and possibly even the individual atomic and gas phases separately, can be predicted using only and SFR.
Observationally, molecular gas can be “expensive” to observe, especially in low-mass dwarf galaxies where CO and other molecular tracers require high sensitivity, but also in high-mass potentially quenched galaxies with low gas content. Yesuf & Ho (2019) use visual extinction , metallicity, SFR and/or the optical half-light radius to estimate molecular and atomic gas masses to within factors of 2-3. Here we improve on this accuracy using fewer parameters, and examine scaling relations with and SFR for total gas content in MAGMA, and also the separate gas phases, Hi and H2. Our study follows a long line of pioneering observational efforts (e.g., Schiminovich et al. 2010; Wei et al. 2010; Haynes et al. 2011; Saintonge et al. 2011a; Cortese et al. 2011; Huang et al. 2012; Stark et al. 2013; Kannappan et al. 2013; Gavazzi et al. 2013; Bothwell et al. 2014; Boselli et al. 2014b; Saintonge et al. 2017; Cicone et al. 2017; Catinella et al. 2018).
4.1 Trends of gas content with
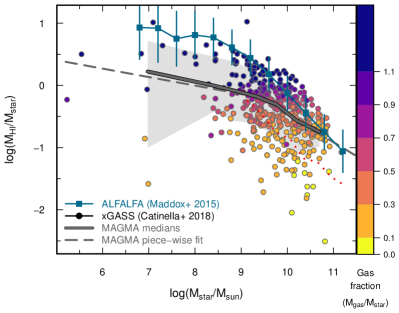
First, we examine the relation of and with . The ratio of to plotted against is illustrated in the left panel of Fig. 6, and / in the right. Like Hi-selected samples such as ALFALFA that probe low (Arecibo Legacy Fast ALFA survey, Haynes et al. 2011; Huang et al. 2012; Haynes et al. 2018), MAGMA data show a break around = M⊙; below this threshold the power-law slope between / vs. is flatter than above this limit. The best robust fit to the piecewise trend for MAGMA galaxies is given by:
| (6) |
There is significant scatter, 0.39 dex (MAD) in this relation, illustrating the large scatter in the / ratio. We experimented with different break around M⊙, and found that log(/M⊙) = 9.5 provides the lowest residuals. The spirit of this fit is similar to that reported by Huang et al. (2012), although the slope for the massive ALFALFA galaxies is steeper in the / – plane (see their Eqn. 1).
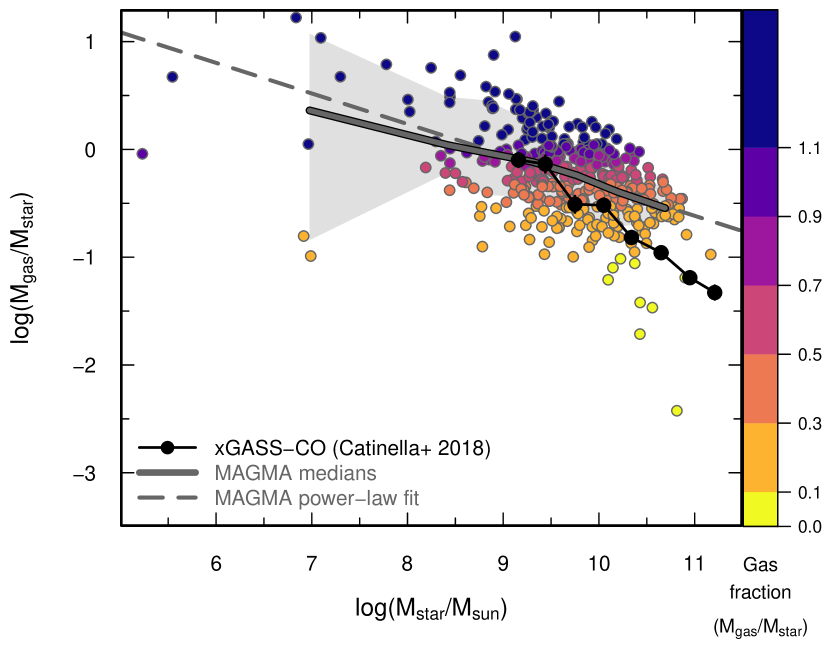
For a given stellar mass, the gas-rich MAGMA galaxies (shown by the dark purple symbols, see color coding in the right-hand wedge in Fig. 7) resemble the ALFALFA galaxies, while the more gas-poor objects bring down the median. This is particularly true in the mass range above the Hi break mass of M⊙ where the more gas-poor galaxies are fairly well represented by the xGASS trend (see Catinella et al. 2018).
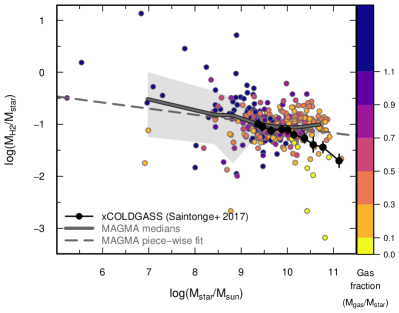
The right panel of Fig. 6 illustrates the / relation with . Unlike for Hi, there is no apparent break mass and a single power-law slope is a fairly good approximation to the data. Here, as apparent also by eye, the MAD scatter is lower, 0.24 dex, relative to Hi (0.39 dex); the excursions of the / ratio are significantly smaller than those of Hi.
Also shown in Fig. 6 are the xGASS and xCOLDGASS medians which, however, incorporate non-detections (Saintonge et al. 2017; Catinella et al. 2018). This biases and low and makes comparison with MAGMA difficult; however, Fig. 6 shows that the xGASS galaxies behave similarly to the Hi-selected ALFALFA sample, although offset by dex. In any case, the agreement of MAGMA with the (binned) H2 content for MS xCOLDGASS galaxies is good, at least up to the highest- bins where the dearth of high-mass galaxies in MAGMA becomes apparent. This comparison is meaningful because the formulation for used by Saintonge et al. (2017) is quite similar to ours (see Accurso et al. 2017). MAGMA considers only H2 (and Hi) detections, so that the upturning of the MAGMA median trend relative to xCOLDGASS is probably due to their inclusion of H2 non-detections, similarly to the comparison with xGASS shown in the left panel of Fig. 6.
Figure 6 illustrates the importance of extending statistical studies to low . The galaxies below the break are gas rich (see color coding), and bridge the gap between representative samples such as MAGMA and Hi-selected ones like ALFALFA. The large scatter at these masses shows that more observations are needed at low , but the requirement of CO detections for H2 makes this currently very time-consuming.
The analogous relation for total gas mass is shown in Fig. 7. The comparison with XGASS-CO is also given in Fig. 7, and, as before, the similarity of the formation used by Catinella et al. (2018) for gives meaning to the comparison. The best robust fit of / vs. is given by:
| (7) |
The scatter in terms of MAD is 0.33 dex, worse than that with , but better than with alone.
4.2 Trends of gas content with and SFR
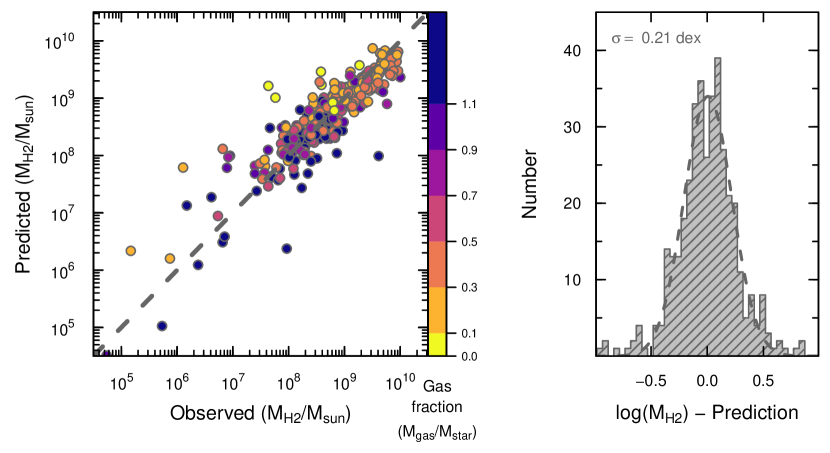
We now explore the implication provided by the PCAs from Paper I that gas content can be well described by only and SFR. As outlined in Paper I, the PCAs did not lend themselves to the estimation of gas mass (, ) by inverting the PCAs. Here we perform robust fits of gas quantities as a function of and SFR. We find the following expression for as a function of and SFR:
| (8) | |||||
Figure 8 shows the comparison of predicted (using Eqn. 8) and observed values of (log), with the right panel illustrating the deviations from the best robust-fit prediction. The expression in Eqn. (8) is accurate to 0.21 dex, assessed by fitting a Gaussian to the residuals of the fit, as shown in the right panel of Fig. 8 (the MAD for this fit is 0.22 dex).
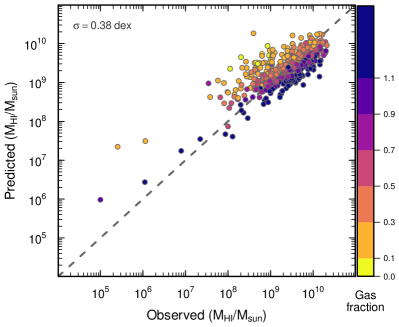
The analogous regression of vs. and SFR is shown in the left panel of Fig. 9, with the prediction for along the ordinate taken from the following expression:
| (9) | |||||
The scatter for as a function of and SFR is significantly larger (0.39 dex) than that for . The scatter is the same as that obtained from the piece-wise power-law fit of against , showing that nothing is gained by introducing SFR as an additional parameter (although here we find no clear evidence for a break mass). The color coding in Fig. 9 suggests that atomic gas content is underestimated by the regression in Eqn. (9) in the galaxies that are more gas rich (blue tones), and overestimated in the ones that are more gas poor. The implication is that in terms of scaling relations Hi behaves differently than H2; while H2 apparently depends closely on and SFR, Hi is the more independent variable. This may be due to the greater variation in the availability of atomic gas in the gas reservoir within the galaxy, and surrounding it the CGM, and from which the H2 is formed and then converted into stars.
There have been many previous attempts to quantify Hi content in galaxies, with varying degrees of scatter in the final result. Kannappan (2004) found that / correlates with optical colors with a dispersion of 0.4 dex, similar to the scatter in our approach described above. Additional parameters such as surface brightness, stellar surface mass density, and hybrid UV-optical colors improved the scatter to 0.3 dex (e.g., Zhang et al. 2009; Li et al. 2012). Axial ratios were also found to reduce dispersion in photometric descriptions of Hi/ (Eckert et al. 2015). More recent predictions of Hi content based on machine learning (e.g., Teimoorinia et al. 2017; Rafieferantsoa et al. 2018) have improved the dispersion even more to 0.2 dex; however, these techniques require large training sets with Hi detections. Zu (2020) applies Bayesian techniques to eliminate the Malmquist bias in Hi-selected surveys, and is thus able to overcome previous limitations for samples with low Hi content; this approach is able to predict overall / gas fractions to within 0.27 dex. The salient feature of these efforts is that galaxies with blue and red colors behave very differently in their Hi content, and thus to some extent thwarts attempts to derive a robust Hi predictor over a large range in . We explore this point further in Sects. 5.2 and 6.
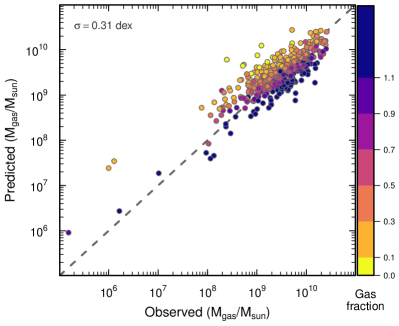
For total gas content, = , the analogous regression is only slightly noisier (0.3 dex) than that for alone:
| (10) | |||||
The comparison for is shown graphically in the right panel of Fig. 9 with the prediction for given by Eqn. (10). Although similar qualitatively, the dependencies on and SFR for are somewhat weaker than for , as a result of the relative weights of H2 and Hi in total gas content (c.f., Eqn. 9).
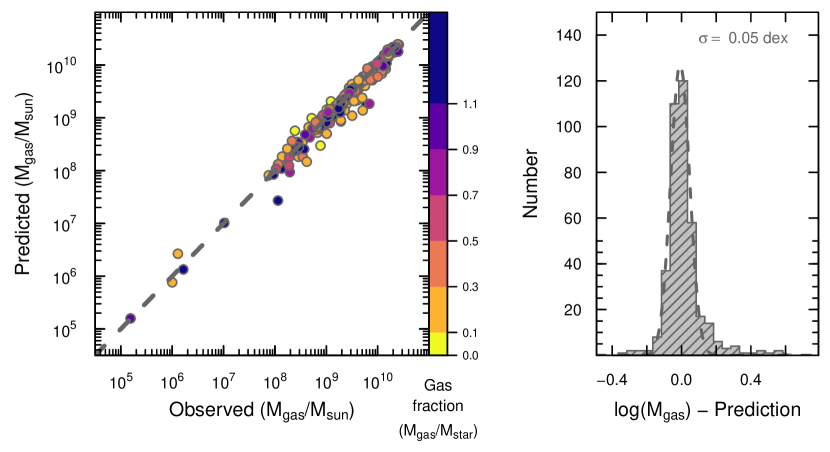
Given that Hi seems to behave differently, more independently (that is to say with more scatter) than H2 and with less dependence on SFR (c.f., Eqns. 8, 9), we explored the possibility of a regression for including as an independent variable. This is important because total baryonic mass is often inferred from Hi mass and stellar mass alone, without including the effects of H2. As shown in Fig. 10, performing a regression gives an excellent fit, with very low dispersion: = 0.054 dex as fitted by a Gaussian as in the right panel of Fig. 10 (MAD = 0.063 dex). The prediction for depicted in the vertical axis is given by the following expression:
| (11) | |||||
Figure 10 shows explicitly that once is included in the expression for , total gas mass can be determined to very high accuracy (0.05 dex). This implies that the three-space of , SFR, and is not a true plane; the larger scatter for in the SFR regressions is because cannot be reduced to a simple SFR dependence. Molecular gas mass behaves differently because H2 content depends more strongly on and SFR, so that its amount can be accurately predicted (to within 0.2 dex) using only these variables.
For the MAGMA sample, the mean deviation from estimated from Eqn. (11) and , typically used to infer total baryonic mass, is 0.13 dex, 35%. However, the difference between and can be as large as a factor of 3 or more. The discrepancy between and is larger for those galaxies with small gas fractions, as these are typically H2-dominated. Thus, for accurate estimates of total gas mass and baryonic content, it is important to consider total gas, rather than only Hi. Selection effects will also play a role because if galaxies have similar specific SFRs, and a small range in stellar mass, they will also have similar H2 content (see Eqn. 8), and will thus give a tight, but possibly spuriously so, scatter in Tully-Fisher baryonic mass regressions.
The PCA analysis discussed in Paper I suggests that gas mass in the Local Universe, and in particular , depends on only and SFR. However, we have found that atomic gas is a more independent variable relative to H2, and the degree to which gas mass can be well predicted using and SFR will depend on whether galaxy samples are Hi-selected, selected on , or, like MAGMA, representative of isolated galaxies across a wide range of parameter space. In the following, we discuss the relation between the two gas phases, in the context of their relation with star formation.
5 The molecular and atomic gas phases across the stellar mass spectrum
As shown above, the molecular and atomic gas components of dwarf galaxies, spiral disks, and massive bulge-dominated galaxies differ in their behavior as a function of and SFR. Here we explore the different gas phases separately, and then compare them over different regimes. We also examine the results in the context of the feedback processes outlined in the Introduction, namely (P1) preventive feedback, the availability of a gas reservoir for star formation; and (P2) star-formation efficiency, the ability to turn gas into stars. The first mechanism, preventive feedback P1, depends mainly on atomic gas, while the second, SFE P2 is tightly linked with the molecular component. We first discuss the molecular gas in connection with P2, followed by the atomic gas for P1, and how the two gas phases are partitioned in the ISM.
5.1 Star-formation efficiency with molecular gas
Because molecular gas fuels the star-formation process, molecular depletion times are a measure of the timescale of the transformation of gas into stars. As discussed above, , the inverse of SFEH2, is not necessarily a measure of true efficiency, because of the difficulty in translating SFEH2 into the amount of gas converted into stars over a standard timescale such as free-fall time or dynamical time (e.g., Krumholz et al. 2009). SFEH2 is also inextricably linked to cloud lifetimes in a typical galaxy environment (Krumholz & Tan 2007), and the global measurements for MAGMA do not constrain this quantity. Ultimately, and SFEH2 signify the rapidity of star formation from a given gas reservoir, which depends on the mean lifetime of star-forming clouds and the true efficiency of star formation. Here we explore with MAGMA global timescales for star formation and how these change with various quantities.
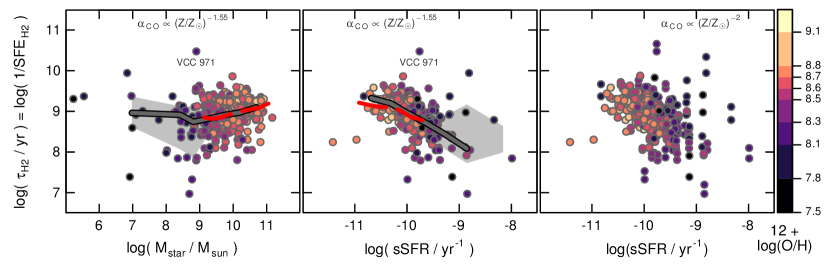
Molecular depletion times for the MAGMA sample, computed as in Eqn. (3) with according to Eqn. (5), are shown in Fig. 11. H2 depletion times depend only very weakly on , as illustrated in the left panel. The MAGMA sample extends the trend beyond M⊙. Although there is a weak trend for increasing above this limit, in agreement with previous work (e.g., Leroy et al. 2013; Boselli et al. 2014b; Saintonge et al. 2017), below this mass, there is no clear trend. There are some galaxies with very short depletion times ( yr), but the scatter is large. Further molecular-gas observations of very low-mass galaxies are needed to confirm the trend with .
Unlike the weak trend of with , is strongly correlated with sSFR, as shown in the middle panel of Fig. 11. For sSFR yr-1 and sSFR yr-1, there are too few MAGMA galaxies to constrain . However, within these ranges, over two orders of magnitude in sSFR, shorter molecular depletion times are associated with increasing sSFR (see also Sect. 3). There is also relatively small scatter associated with this fit, 0.2 dex. For MAGMA galaxies, ranges from yr for sSFR yr-1 to yr for sSFR yr-1. The agreement with xCOLDGASS (Saintonge et al. 2017) is excellent, as shown by the heavy red long-dashed lines in Fig. 11; the extension of MAGMA to almost two orders of magnitude higher sSFR is also apparent in the comparison. Such a general trend is in agreement with other previous work (e.g., Leroy et al. 2013; Bothwell et al. 2014; Boselli et al. 2014b; Huang & Kauffmann 2014, 2015; Genzel et al. 2015; Catinella et al. 2018), although the specific formulation depends on the form of , and also on the methods for calculating and SFR. This agreement is perhaps not surprising given that MAGMA comprises samples from these studies (ALLSMOG, HRS, xCOLDGASS). The middle and right panels in Fig. 11 compare the depletion times (and implicitly the H2 mass) calculated with the two power-law slopes for the metallicity dependence. The steeper slope shown in the right panel results in a noisier data distribution, with many more outliers relative to the middle panel.
MAGMA extends the previous trends of and sSFR to higher sSFR and lower than previous samples. However, the MAGMA selection criteria require detections in CO (and Hi), thus systems with relatively high SFR. This consideration is particularly relevant for low and may influence the trends of . Nevertheless, the extension toward higher sSFR seems to be roughly a continuation of the lower sSFR regime (e.g., Saintonge et al. 2011b, 2017). Although caution is warranted, and new observations at low are needed for confirmation, is fairly tightly correlated with sSFR in galaxies, at least over the mass regime probed by MAGMA.
If the trend of with sSFR is taken at face value, we would conclude that star formation is more “efficient” at high sSFR, and thus also at low metallicity (notice color coding, see also Fig. 1). Thus if we examine the feedback process (P2), namely the efficiency with which gas is converted to stars, there is an apparent contradiction with the low values of SFEDMH at low halo (and stellar) mass: low-mass metal-poor galaxies with larger sSFR than in more metal-rich and massive galaxies, are more, not less, efficient at forming stars. This illustrates the conundrum of associating low SFEDMH with a low SFEH2; they are not directly connected, on the contrary. The first is a process of hierarchical growth, and the second is a baryonic process, the timescales of which are almost certainly different. Hierarchical timescales depend on the availability of baryons and the accretion of (Hi) gas from the CGM, while SFR timescales are related to the conversion of H2 to stars. The missing link here is the atomic gas content and the relation between Hi and H2, and we examine both in the next two sections.
5.2 Depletion times of atomic gas
The availability of gas is the basic requirement for star formation, and is directly related to the preventive feedback mechanism (P1) alluded to in the Introduction. Although atomic gas does not contribute directly to star formation (but see Krumholz 2012), Hi plays a role in regulating star formation through total gas column density. Several theoretical arguments suggest that the conversion of Hi to H2 is driven by total gas surface density because of the need for self-shielding (e.g., Wolfire et al. 1995; Krumholz et al. 2009), or the requirement of thermal/dynamical or hydrostatic equilibrium (Ostriker et al. 2010; Krumholz 2013b). Thus, Hi content can be considered as fundamental for setting the stage for star formation in a galaxy. Moreover, as shown in the previous Section, Hi behaves differently from H2, seemingly a more independent parameter in the description of a galaxy.
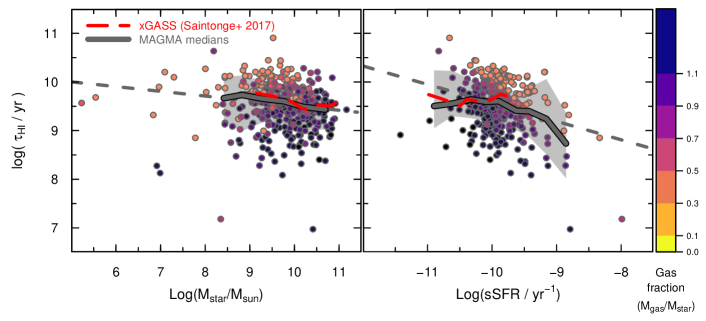
Atomic gas depletion times ( /SFR) are illustrated in Fig. 12. The trend of with is shown in the left panel, and agrees with much previous work showing little, if any, dependence on (e.g., Schiminovich et al. 2010; Boselli et al. 2014b; Saintonge et al. 2017). The mean of 3.2 Gyr for MAGMA galaxies is also in excellent agreement with these previous estimates. Interestingly, Hi-selected samples such as ALFALFA have a mean almost three times higher, 9 Gyr (Huang et al. 2012). Although the dependence of both and on is weak, comparing Figs. 11 and 12 suggest opposite trends: for H2, depletion times are increasing with , while for Hi, they are (slightly) decreasing.
In apparent contrast with previous studies, here we find a clear dependence of on sSFR, as illustrated in the right panel of Fig. 12. This again is due to the extension of MAGMA to lower and thus higher sSFR. For MAGMA galaxies, is yr for sSFR yr-1 increasing to yr for sSFR yr-1. The shortest Hi depletion times at large sSFR are comparable to , but at small sSFR, the longest are more than 10 times larger. The scatter for the robust fit of vs. sSFR is also twice as large (0.44 dex) than that for (0.22 dex). This large degree of scatter suggests a weaker trend for than for and the need for more data in this high sSFR, low- regime.
Saintonge et al. (2017) found that Hi depletion times were roughly constant with both and sSFR, while here, with the extension to higher sSFRs provided by MAGMA, we find a significant trend. The agreement is good for the range of sSFR in common, but the higher sSFRs probed by MAGMA suggest a significant decrease down to sSFR yr-1. At a given sSFR (or ), the most gas-rich galaxies (colored by dark blue) tend to have shorter than the gas-poor ones. Nevertheless, the trend is only hinted at by the relatively few galaxies in this extreme high sSFR, low-mass regime; more data are needed to confirm it.
5.3 The relation between molecular and atomic gas
Understanding how the total gas is partitioned into molecular and atomic phases, and the efficiency of the conversion of Hi to H2, requires measurements of the Hi/H2 ratio over a broad range in . Such measurements are crucial to quantify the physical mechanisms behind star formation and baryonic cycling in galaxies. The results presented above suggest that both Hi and H2 are involved, albeit to different degrees, in the regulation of star formation. However, previous work (e.g., Bothwell et al. 2014; Boselli et al. 2014b; Catinella et al. 2018), including studies of resolved galaxies (e.g., Bigiel et al. 2008; Leroy et al. 2013) and theoretical models (e.g., Krumholz et al. 2011), has established that molecular gas is more closely associated than the atomic component with the star formation process (although see Wang et al. 2020). To understand this distinction, here, with MAGMA, we examine the Hi/H2 ratio and the scaling across different regimes in stellar mass and SFR.
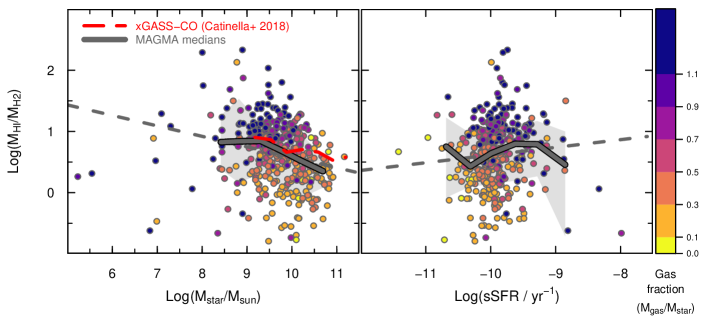
The ratios of and are plotted in Fig. 13; the left panel shows the comparison with and the right panel with sSFR. In agreement with previous work (e.g., Bothwell et al. 2014; Boselli et al. 2014b; Catinella et al. 2018), / decreases with increasing , and shows little, if any, variation with sSFR. The best robust fit for / against shown in Fig. 13 is given by:
| (12) |
Although the parameters of the fit are determined with fairly high accuracy, there is much scatter, with a best-fit MAD of 0.5 dex. The galaxies with the lowest gas fractions ( /, see Fig. 1) can have / less than unity, but otherwise atomic gas is always the dominant component. The median / ratio exceeds unity over the entire regime probed by MAGMA even for the most massive galaxies; for ≳ M⊙, on average, / 2. For galaxies 20 times less massive, M⊙, the average ratio is more than 3 times higher, / 7. In the most gas-rich galaxies, / can be as high as 10 or more, and can exceed values of 30 in some cases.
That even galaxies above the characteristic Schechter mass M⊙ (e.g., Schechter 1976; Baldry et al. 2012) have a significant atomic gas reservoir is not a new result. Recently Zhang et al. (2019) claimed that even “quiescent” massive disk galaxies have an Hi content comparable to their star-forming counterparts. However, Cortese et al. (2020) countered this claim by analyzing the SFRs used by Zhang et al. (2019). They found that the SFRs used by Zhang et al. (2019) were systematically low, thus the galaxies they considered quiescent were in fact star forming. Either way, the massive galaxies in MAGMA (and previously xGASS, xCOLDGASS: Catinella et al. 2018; Saintonge et al. 2017) clearly host significant amounts of gas, both Hi and H2. The question is: how does the partition of Hi and H2 change with SFR?
To answer this, we have divided MAGMA into three stellar mass bins: one corresponding to the galaxies having below the Hi break of M⊙ shown in Fig. 6, one with above the characteristic Schechter mass of M⊙, and one between these two limits. The value of M⊙ is significant not only for the local stellar-mass function (usually fit by a Schechter function, Schechter 1976; Baldry et al. 2012), but also for many other physical processes which we discuss in Sect. 6.
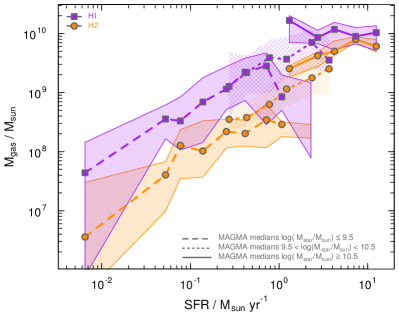
Figure 14 shows gas mass plotted against SFR for the three mass bins (left panel), and for the two extreme bins, / vs. sSFR (right). The high-mass regime clearly differs from the low-mass one. The upper portion of the left panel illustrates the Hi and H2 masses for the massive galaxies; does not vary with SFR over this bin, while increases with increasing SFR. This behavior at the high-mass end is in excellent agreement with the trends shown by Zhang et al. (2019), and suggests that the Hi in these massive systems does not participate directly in the star-formation process.
In contrast, and in the low-mass bin behave similarly to one another; both show a marked increase in gas content with increasing SFR although, at relatively high SFRs (SFR 0.6 M⊙ yr-1), both gas components in the low-mass bin show a downturn. Instead, at similar SFRs, in the intermediate- bin both the atomic and molecular phases are monotonically increasing with SFR. The implication is that at intermediate masses, both gas phases are involved in ongoing episodes of star formation, while in low-mass dwarf galaxies Hi the star formation is unable to keep up with the amount of gas.
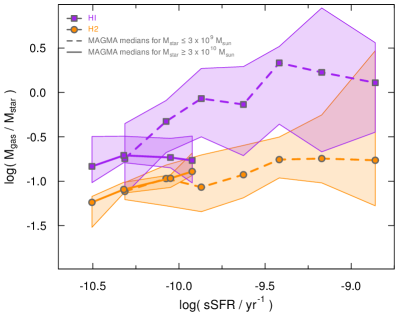
The right panel of Fig. 14 instead shows / plotted against sSFR (here in logarithmic scale). Again, the high- bin shows that Hi is disconnected from the star-formation process, as there is little variation in / over a factor of 3 change in sSFR. However, the molecular component, relative to stellar mass, increases systematically with sSFR, again suggesting that at these masses H2 is directly fueling SFR. For low-mass galaxies, the ratio of and is relatively constant with sSFR, while the analogous ratio for Hi shows a fairly constant rise, up to the highest sSFRs probed by MAGMA. This is yet another indication that at low , atomic gas is necessary ingredient for star formation to proceed and participating (at least indirectly) in the process of star formation.
6 Three mass regimes in galaxy evolution
Based on the NFGS, Kannappan et al. (2013) identified two transitions in galaxy morphology, gas fractions, and fueling regimes. As seen above, the MAGMA sample also shows evidence for transitions at low and high (see e.g., Fig. 14), and here we explore the resulting ramifications for galaxy evolution. The H2 and Hi detections for MAGMA enable us to probe the total gas content, and its relation with star-formation properties; Kannappan et al. (2013) had only few galaxies with H2 (CO) measurements, so were impeded by the lack of data for and thus total . In addition, there were very few galaxies in Kannappan et al. (2013) with M⊙. Thus, MAGMA allows a more detailed study of the behavior of low-mass galaxies.
Before discussing in detail changes in gas properties over the different mass regimes, we need to consider whether or not the Hi and H2 contents in MAGMA galaxies could be subject to a systematic bias. Our Hi (and H2) measurements are mainly global measurements (although see Hunt et al. 2015), so it is virtually impossible to identify the location of the gas components within the galaxy. A bias could occur if the Hi in low- galaxies were to lie predominantly outside the galaxy, while in more massive galaxies to be more closely confined to the stellar star-forming disk, similarly to H2. To test this, we have adopted the approach of Wang et al. (2020) who deduced the amount of Hi within the disks of xGASS galaxies and compared it to H2 content. Our analysis is described in detail in Appendix A. The results suggest that although much of the Hi gas falls outside the stellar disk, as expected and in agreement with Wang et al. (2020), there is no systematic variation with stellar mass. Thus, the Hi gas in low-mass galaxies is spatially configured in a similar way as the Hi in high-mass systems, and no bias should be introduced in our analysis of H2 and Hi gas properties for this reason.
6.1 Accretion-dominated, low-mass galaxies
The first transition noted by Kannappan et al. (2013) was considered a “gas-richness” threshold; galaxies below a transition stellar mass of log(/M⊙)9.5 were found to be “accretion dominated”, characterized by overwhelming gas accretion. In the MAGMA sample, this mass scale emerges as a break in the trend of and (see Sect. 4 and Fig. 6). This same low-mass break also emerges in the MAGMA galaxies as a gas-accretion threshold signature for effective metallicity yields (e.g., Garnett 2002; Dalcanton 2007). We explore the relation between gas content and metallicity in a companion paper (Tortora et al. 2020, in prep.)
Fig. 14 shows that for low-mass MAGMA galaxies, / remains relatively constant over a factor of 10 increase in sSFR. In contrast, / increases with sSFR yr-1, remains flat until sSFR yr-1, then increases with sSFR up to the highest sSFRs ( yr-1) probed by MAGMA. We interpret this as a confirmation of the scenario proposed by Kannappan et al. (2013), namely that these low-mass galaxies with high sSFR are accreting gas faster than they can process it. High sSFR means that these systems are forming stars rapidly, but does not signify much in terms of their star-forming efficiency. This is particularly true for the long timescales, and thus low “efficiency”, implied by the relatively large Hi depletion times (see Fig. 12). Indeed, as stated by Kannappan et al. (2013): “if the gas is pouring in faster than even the highest-sSFR galaxies can possibly consume it, such galaxies might be better termed ‘overwhelmed’ rather than ‘inefficient’”.
Central to the notion of “overwhelmed” is the idea that there may be a limit to how fast, and how efficiently, gas can be converted into stars. Limitations governed by the interplay between pressure and turbulence in galaxy disks may be impossible to overcome. In a volume-limited sample of galaxies, Karachentsev & Kaisina (2013) noticed that there is a maximum sSFR, log(sSFR/yr-1) , above which there are very few galaxies. A similar sSFR limit was found by Schiminovich et al. (2010) in a sample of Hi-selected galaxies from ALFALFA. Because of the presence of low-mass starbursts, MAGMA extends the range of maximum sSFR values to somewhat higher values (see Fig. 1), but the general trend toward lower (and higher sSFR) is very shallow. Although definitely not a typical stellar disk, even the prototypical ultraluminous infrared galaxy, Arp 220, has an sSFR comparable to the highest values in MAGMA with log(sSFR/yr-1) (U et al. 2012)444Arp 220 has a stellar mass of M⊙ (U et al. 2012)..
A possible explanation for such a limit is furnished by theoretical arguments that propose that star formation in disk galaxies is regulated through stellar feedback and turbulence (e.g., Ostriker et al. 2010; Ostriker & Shetty 2011; Hayward & Hopkins 2017). Although “maximum intensity starbursts” are usually defined in terms of surface brightness (e.g., Meurer et al. 1997; Hathi et al. 2008; Hopkins et al. 2010), sSFR is a closely-related proxy. Thus, if star formation is truly regulated by internal feedback and turbulence as proposed theoretically, given copious gas accretion, it may not be possible for galaxies to convert the accreted gas into stars more rapidly than these limitations allow.
6.2 Gas-poor, high-mass galaxies
The second transition identified by Kannappan et al. (2013) corresponds to a bimodality threshold, roughly indicating a “quenched” regime at log(/M⊙)10.5, populated in their sample by spheroid-dominated, gas-poor galaxies with low rates of star formation over the last Gyr. This threshold also signifies several transitions in galaxy demographics: a signature of bimodality in galaxy color (the “blue cloud” to the “red sequence”, e.g., Kauffmann et al. 2003; Nelson et al. 2018); a transition in morphology from disk-dominated, low surface brightness systems to centrally concentrated, high Sérsic index, and high surface brightness (e.g., Bundy et al. 2005; Driver et al. 2006); a break in the galaxy stellar-mass function at (e.g., Baldry et al. 2012); an inflection in the galaxy SFR main sequence at low redshift (e.g., Whitaker et al. 2012, 2014; Lee et al. 2015; Saintonge et al. 2016)555The break mass in the SFMS is not always found strictly to be the characteristic log(/M⊙) = 10.5, but this depends on methods for definition of and SFR.; and a break in the mass-metallicity relation (e.g., Tremonti et al. 2004). A minimum in the dark matter fraction and the steepest galaxy mass profiles and population gradients are also found at this threshold (e.g., Tortora et al. 2010, 2019).
Interestingly, this transition also corresponds to changes in gas-accretion modes with “cold accretion” thought to dominate in those galaxies with below this threshold. Beyond this, a “hot mode” is expected to take over, induced by shock heating of infalling gas to the virial temperature in massive haloes (e.g., Birnboim & Dekel 2003; Kereš et al. 2005; Dekel & Birnboim 2006; Kereš et al. 2009). Such a coincidence in transition masses for this wide variety of physical processes and observational trends is telling us something about changes in the way that galaxy evolution is regulated above this mass scale, relative to less-massive systems.
For galaxies above the high- threshold, in MAGMA we find that / increases with both SFR and sSFR, while / remains constant over a factor of 10 in SFR and a factor of 3 in sSFR. This implies that Hi is not participating in the current star-formation process at all, but rather is a potential reservoir for future conversion into stars, or a past relic of gas accretion that will remain “quiescent” over the galaxy’s lifetime.
6.3 Gas-equilibrium, intermediate-mass galaxies
Galaxies in the intermediate mass range with between and M⊙ were considered by Kannappan et al. (2013) to be in a “processing-dominated” regime. These galaxies are able to consume gas through star formation as fast as it is accreted, and in this range gas accretion and star formation proceed together (Fraternali & Tomassetti 2012). Metal-enriched gas outflows driven by feedback from SNe and massive stellar winds tend to mix with the surrounding hot gas in galaxy coronae, thus enabling cooling and subsequent cold-mode accretion (Marinacci et al. 2010; Armillotta et al. 2016).
In the intermediate-mass or “gas-equilibrium” regime, Fig. 14 for MAGMA implies that the (Hi) accretion rate has slowed somewhat, because the divarication in / and / is narrowing as SFR increases. Thus, it seems that the galaxies are able to form stars in pace with the arrival of incoming gas, in agreement with the results of Fraternali & Tomassetti (2012) and Tacchella et al. (2016). Such behavior in this mass regime would be consistent with the gas-regulator models proposed by Lilly et al. (2013) and others. Gas that comes in as accretion is processed by star formation and goes out as stellar winds, maintaining an “equilibrium” configuration expected to endure over most of cosmic time (e.g., Davé et al. 2012).
6.4 Gas regimes in MAGMA
The results for the MAGMA sample confirm and extend the findings of Kannappan et al. (2013). For galaxies in the low bin, M⊙, the gas-rich, accretion-dominated, regime, Hi is a necessary, perhaps even fundamental, ingredient for star formation. This could be because of the need for self-shielding to foster the formation of H2 (e.g, Wolfire et al. 1995), possibly linked with high column density (e.g., Krumholz et al. 2009, 2011), thermal/dynamical or hydrostatic equilibrium (Ostriker et al. 2010; Krumholz 2013b), or hydrostatic pressure in the disk (e.g., Blitz & Rosolowsky 2006). The preponderance of “excess gas” in the form of Hi at these low masses could also be connected with the efficiency of cold-accretion modes (Fraternali 2017).
For galaxies in the intermediate “gas-equilibrium” bin, Hi and H2 content are more tightly related with each other and with SFR. Thus, stars can form roughly as fast as gas is accreted from the CGM and beyond (Fraternali & Tomassetti 2012), although Hi content seems to dominate over H2 by a factor of 3 or so (see Fig. 13).
In the high-mass “bimodality” regime, with , the atomic gas seems not to be directly linked to SFR. Even at these masses, Hi content still dominates over H2, but overall gas content is low; on average, /0.15 while /0.07. As shown in Fig. 14, / is roughly constant over a factor of 10 in SFR, while / and SFR are fairly well correlated. It is true that the high-mass bin in MAGMA is underpopulated ( 10% of the sample), but the emerging trends are fairly clear. However, through the requirement of Hi and CO (H2) detections, the high- MAGMA galaxies tend not to be quenched systems. Thus, our conclusions for this bin may be slightly biased by the possibly enhanced star-forming nature of the sample at high 666In fact, evidence points to a dichotomy in gas and star-formation properties at these high masses; all high- galaxies are not quenched, “red and dead”, but rather there is also a class that contains gas and is currently forming stars. We plan to explore this distinction in future work..
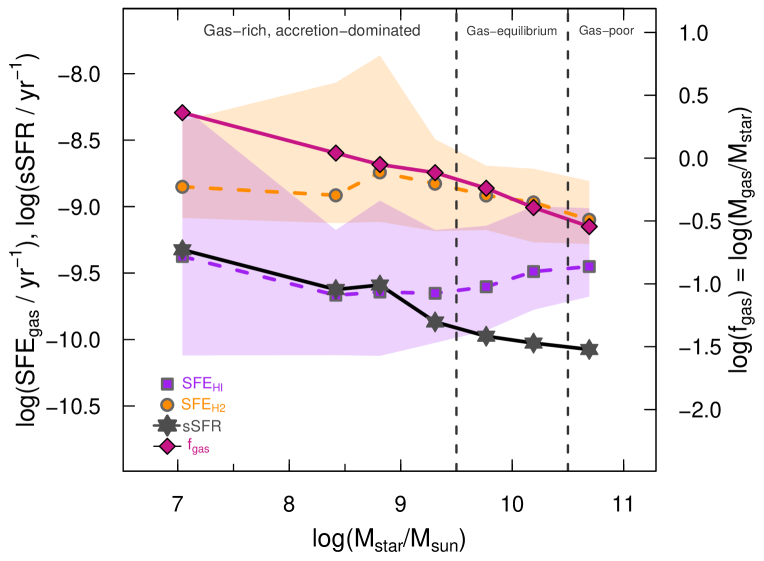
A primary question posed by these results is the physics that regulates star formation over different mass regimes: is it the timescales (depletion times , or their inverse, the “efficiency” SFEH2), or is it the available gas reservoir ()? We examine this by noting (see also Brownson et al. 2020):
| (13) | |||||
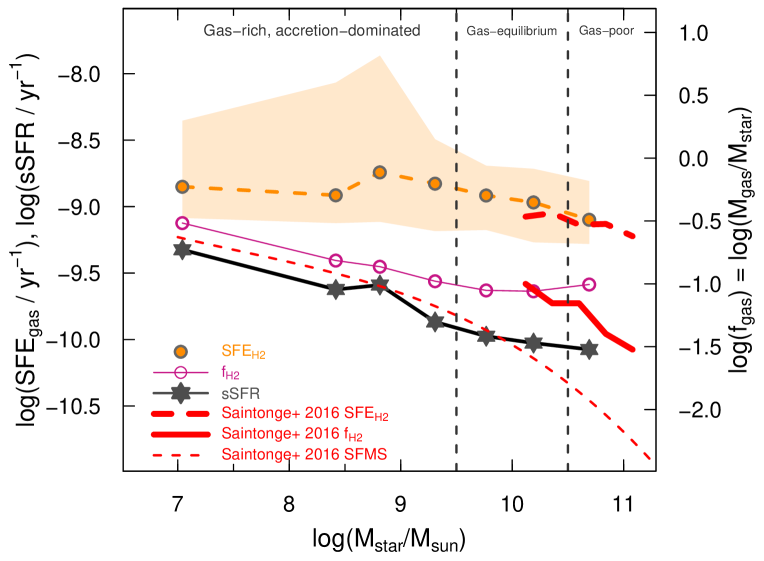
where is defined in the same way as , namely . These two ingredients for sSFR are shown in the top panel of Fig. 15, together with sSFR as a function of . The middle panel of Fig. 15 reports analogous quantities for Hi, and total gas fraction is shown in the lower one. The different quantities, sSFR, SFE and , are shown to scale as indicated in the left-hand axis label (for sSFR and SFE) and the right-hand one (for ).
Figure 15 (top) illustrates that in the accretion-dominated gas-rich regime at low , SFEH2 (or equivalently , see Fig. 11), is relatively constant, although in the lowest- bins, it falls by a factor of 3. In the “gas-equilibrium” and “bimodality” regimes, at higher , SFEH2 is diminishing with increasing . Conversely, is relatively constant at higher , while it tends to grow toward lower , roughly in tandem with sSFR. In the highest- bin, at M⊙, growing is reflected in the upward trend of sSFR. As discussed above, the increases in and sSFR in the highest bin are probably a selection effect, but they are internally consistent within MAGMA.
The implication is that in the gas-equilibrium and bimodality regimes, while SFEH2 is falling, is rising, so that both timescales/efficiency and available H2 contribute to the regulation of star formation. Instead, in the low-mass bin, although the available H2 is increasing, SFEH2 is constant, even falling toward the lowest . We interpret this as a signature of the accretion-dominated, “overwhelmed” regime in which the galaxies are unable to process all of the available gas.
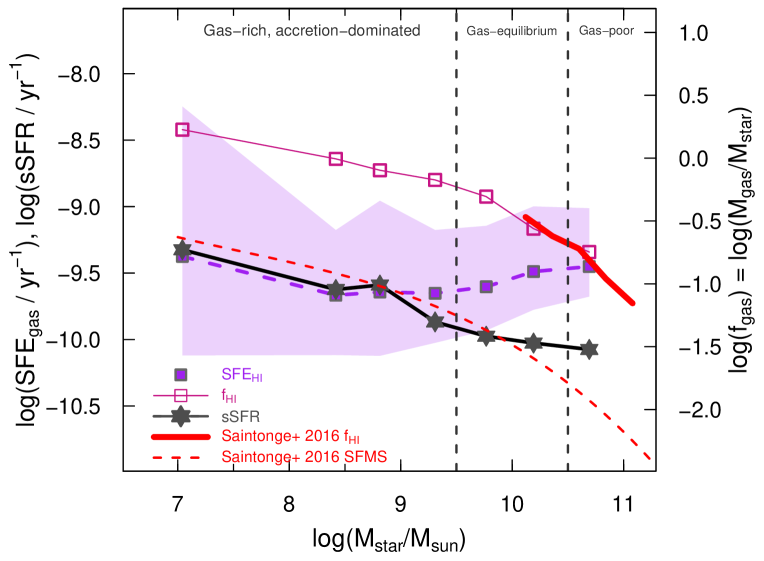
The shape of the trend of with in the middle panel of Fig. 15 is very similar to the form of the SFMS in terms of sSFR. Atomic gas content is quite high toward low- (see also Fig. 14), but falls precipitously at higher masses, similar to the SFMS. On the other hand, SFEHI is rising for M⊙, changing direction roughly at the break mass of the scaling with shown in Fig. 6. Over the same range in , SFEH2 is falling as is the overall gas fraction shown in the lower panel of Fig. 15. The similarity of the curve (bottom panel) with the trend (middle) is due to the dominance of atomic gas in the total gas budget, and is reflected in the low scatter from the fit in Eqn. (11). Beyond M⊙, the shape of the curve also mirrors SFEH2. This is yet another indication that Hi and the total gas reservoir, not just H2, are participating, at least indirectly, in the star-formation process. A similar conclusion was reached by Wang et al. (2020) who found that Hi within the massive disks of star-forming galaxies plays an important role as an intermediate step in fueling star formation.
Finally, another piece of the fueling puzzle can be found in the relation between gas fractions and star formation over longer timescales. Kannappan et al. (2013) formulated a quantity defined as the ratio of the mass of stars formed over the last Gyr relative to the pre-existing stellar mass. They found that this long-term fractional stellar mass growth rate correlates quite well with the color (see also Kannappan 2004). We explore the correlation of gas fraction and hybrid NUVNIR color for MAGMA in Appendix B, with an analysis of the hybrid color GALEX NUV and W1 (3.4 m), two of the measurements used in Paper I to estimate SFR and . We confirm and extend the trends of gas fraction with hybrid NUVNIR color (in our case NUVW1) found by Kannappan et al. (2013). These relations provide further evidence that atomic gas content is related with long-term SFR; Hi mass is linked with the potential for star formation over the lifetime of the galaxy.
7 Conclusions
We have analyzed in terms of gas content and SFE the MAGMA sample of 392 galaxies with Hi and CO detections (for H2) presented in Paper I. The broad range of MAGMA (from M⊙ M⊙), with 36% of the sample having M⊙, enables for the first time an in-depth comparison of the gas properties of dwarf galaxies with more massive systems. Our main focus is on the availability of a cold gas reservoir for star formation, gas depletion times as the inverse of SFE, and the partition of molecular and atomic gas over a range in , as described below:
-
•
The conversion factor as a function of metallicity. We have used MAGMA galaxies to revisit the dependence of as a function of gas metallicity, , under the assumption that H2 depletion time depends on sSFR, and any deviations are due to metallicity as a proxy of hardness of the radiation field. Quantifying the hardness of the interstellar radiation field through FUV and NUV colors was unsuccessful because of a dichotomy in FUVNUV (see Sect. 3). Results show that , less steep than a (previous) quadratic dependence, but consistent with other techniques.
-
•
Simple relations for , , and total gas content as functions of and SFR. Molecular gas mass is strongly correlated with and SFR, enabling an expression for based on these two parameters that is accurate to within 0.2 dex. The relation of the atomic gas mass with stellar mass shows a break at M⊙, similar to that found by Huang et al. (2012) for an Hi-selected sample. It is possible to express as a function of and SFR only to within 0.4 dex, while the analogous expression for total gas is accurate to within 0.3 dex. The behavior of Hi in these scaling relations suggests that it is an additional independent parameter, and when it is included in the expression for , we find a relation good to within 0.05 dex [see Fig. 10 and Eqn. (11)].
-
•
SFE, gas depletion times, and and their relation with and sSFR. MAGMA galaxies span more than two orders of magnitude in , ranging from yr-1 to yr-1. In agreement with previous work, we find to be correlated with sSFR, but only weakly with . We also find that is weakly correlated with , but well correlated with sSFR; this result is new, stemming from the extension of MAGMA to a significant number of low-mass dwarf galaxies. The short found for low-mass galaxies would imply that they are more efficient at forming stars than more massive ones, in contrast with the low efficiencies predicted by DMH abundance matching. However, it is potentially spurious to assume that short or long depletion times (and their inverse SFE) are manifestations of high- or low-efficiency star formation; rather they should be interpreted as simply timescales. Inefficient star formation inferred from DMH assessments is related to the availability of baryons and hierarchical growth, distinct from the conversion of molecular gas to stars. “Efficient” star formation inferred from is just more rapid star formation; whether or not it is truly efficient, that is to say able to convert more H2 into stars over the mean lifetime of a molecular cloud, is not straightforward to determine with the observables available for MAGMA.
-
•
The partition of cold gas into its molecular and atomic components. The ratio of atomic to molecular gas, /, only weakly depends on either or sSFR, with large scatter. Even galaxies more massive than tend to be dominated by Hi, with an average / 2; galaxies 20 times less massive have more than 3 times more Hi, and the most gas-rich galaxies can have / as high as 10 or more. In the lowest bin with , Hi and H2 are both related to SFR, however with an inversion in the trend at relatively high SFR, SFR 0.6 M⊙ yr-1. In the highest bin, with , Hi content is roughly constant over a factor of 10 range in SFR, while in the same range of SFR is increasing.
-
•
Evidence for a differentiation of gas properties over three regimes. Following Kannappan et al. (2013), we have divided the MAGMA sample into three bins: M⊙; M⊙ M⊙; M⊙. These intervals in are associated with a broad variety of transitions of physical processes in galaxy evolution (see Sect. 6), and also manifest different behavior of the molecular and atomic gas phases. Our results extend those of Kannappan et al. (2013) because of the inclusion in MAGMA of many more dwarf galaxies, and the requirement of H2 (CO) detections. The properties of the gas in the lowest-mass “gas-rich, accretion-dominated” MAGMA bin suggest that there is simply too much gas to process, even with the large sSFR and short common to these galaxies; they are “overwhelmed” by gas in the form of Hi. In the intermediate bin, “gas equilibrium” galaxies apparently form stars apace with their gas content, able to keep up with the supply of gas. For the galaxies in the most massive “gas-poor, bimodality” regime, gas content is on average almost 10 times lower than in low-mass dwarfs. While the H2 content depends on SFR (or physically vice-versa), the atomic gas seems not to participate (at least directly) in the current star formation episodes. The implication is that in these high-mass galaxies Hi constitutes either a reservoir for future star formation, or a past remnant of gas accretion that will remain inert over the galaxy’s lifetime. For galaxies in gas equilibrium and above the bimodality threshold, both the available H2 reservoir and timescale/efficiency considerations regulate star formation; in contrast, for dwarf galaxies Hi plays the main role.
Although MAGMA substantially extends the parameter space for gas, stars, and metallicity to dwarf galaxies, the coverage at low is still relatively sparse. We aim at quantifying gas content in a statistically significant number of low-mass galaxies with future observations. In addition, in a future paper, we will analyze the effect of outflows on metallicity and gas properties, and further confirm the existence of three different mass regimes.
Ideally, the study of gas content and SFE would be coupled with an assessment of dark-matter halo mass. This could be accomplished through Hi velocity profiles and/or rotation curves, which we intend to incorporate in future analysis.
Acknowledgements
We are grateful to the anonymous referee whose careful and constructive comments made this a better paper. We also thank Sheila Kannappan for insightful discussions and comments on the manuscript. LKH, CT, and MG acknowledge funding from the INAF PRIN-SKA 2017 program 1.05.01.88.04.
References
- Accurso et al. (2017) Accurso, G., Saintonge, A., Catinella, B., et al. 2017, MNRAS, 470, 4750
- Amorín et al. (2016) Amorín, R., Muñoz-Tuñón, C., Aguerri, J. A. L., & Planesas, P. 2016, A&A, 588, A23
- Aniano et al. (2020) Aniano, G., Draine, B. T., Hunt, L. K., et al. 2020, ApJ, 889, 150
- Armillotta et al. (2016) Armillotta, L., Fraternali, F., & Marinacci, F. 2016, MNRAS, 462, 4157
- Asplund et al. (2009) Asplund, M., Grevesse, N., Sauval, A. J., & Scott, P. 2009, ARA&A, 47, 481
- Baldry et al. (2012) Baldry, I. K., Driver, S. P., Loveday, J., et al. 2012, MNRAS, 421, 621
- Begum et al. (2005) Begum, A., Chengalur, J. N., & Karachentsev, I. D. 2005, A&A, 433, L1
- Behroozi et al. (2019) Behroozi, P., Wechsler, R. H., Hearin, A. P., & Conroy, C. 2019, MNRAS, 488, 3143
- Behroozi et al. (2013) Behroozi, P. S., Wechsler, R. H., & Conroy, C. 2013, ApJ, 770, 57
- Bigiel et al. (2008) Bigiel, F., Leroy, A., Walter, F., et al. 2008, AJ, 136, 2846
- Birnboim & Dekel (2003) Birnboim, Y. & Dekel, A. 2003, MNRAS, 345, 349
- Blitz & Rosolowsky (2006) Blitz, L. & Rosolowsky, E. 2006, ApJ, 650, 933
- Boissier et al. (2018) Boissier, S., Cucciati, O., Boselli, A., Mei, S., & Ferrarese, L. 2018, A&A, 611, A42
- Bolatto et al. (2008) Bolatto, A. D., Leroy, A. K., Rosolowsky, E., Walter, F., & Blitz, L. 2008, ApJ, 686, 948
- Bolatto et al. (2013) Bolatto, A. D., Wolfire, M., & Leroy, A. K. 2013, ARA&A, 51, 207
- Boquien et al. (2019) Boquien, M., Burgarella, D., Roehlly, Y., et al. 2019, A&A, 622, A103
- Boselli et al. (2014a) Boselli, A., Cortese, L., & Boquien, M. 2014a, A&A, 564, A65
- Boselli et al. (2014b) Boselli, A., Cortese, L., Boquien, M., et al. 2014b, A&A, 564, A66
- Boselli et al. (2010) Boselli, A., Eales, S., Cortese, L., et al. 2010, PASP, 122, 261
- Boselli et al. (2015) Boselli, A., Fossati, M., Gavazzi, G., et al. 2015, A&A, 579, A102
- Bothwell et al. (2014) Bothwell, M. S., Wagg, J., Cicone, C., et al. 2014, MNRAS, 445, 2599
- Bouquin et al. (2015) Bouquin, A. Y. K., Gil de Paz, A., Boissier, S., et al. 2015, ApJ, 800, L19
- Broeils & Rhee (1997) Broeils, A. H. & Rhee, M. H. 1997, A&A, 324, 877
- Brownson et al. (2020) Brownson, S., Belfiore, F., Maiolino, R., Lin, L., & Carniani, S. 2020, arXiv e-prints, arXiv:2007.02976
- Bundy et al. (2005) Bundy, K., Ellis, R. S., & Conselice, C. J. 2005, ApJ, 625, 621
- Calzetti et al. (2005) Calzetti, D., Kennicutt, R. C., J., Bianchi, L., et al. 2005, ApJ, 633, 871
- Catinella et al. (2018) Catinella, B., Saintonge, A., Janowiecki, S., et al. 2018, MNRAS, 476, 875
- Chabrier (2003) Chabrier, G. 2003, Publications of the Astronomical Society of the Pacific, 115, 763
- Cicone et al. (2017) Cicone, C., Bothwell, M., Wagg, J., et al. 2017, A&A, 604, A53
- Cormier et al. (2014) Cormier, D., Madden, S. C., Lebouteiller, V., et al. 2014, A&A, 564, A121
- Cortese et al. (2011) Cortese, L., Catinella, B., Boissier, S., Boselli, A., & Heinis, S. 2011, MNRAS, 415, 1797
- Cortese et al. (2020) Cortese, L., Catinella, B., Cook, R. H. W., & Janowiecki, S. 2020, MNRAS, 494, L42
- Dalcanton (2007) Dalcanton, J. J. 2007, ApJ, 658, 941
- Dale et al. (2009) Dale, D. A., Cohen, S. A., Johnson, L. C., et al. 2009, ApJ, 703, 517
- Davé et al. (2012) Davé, R., Finlator, K., & Oppenheimer, B. D. 2012, MNRAS, 421, 98
- Dekel & Birnboim (2006) Dekel, A. & Birnboim, Y. 2006, MNRAS, 368, 2
- Driver et al. (2006) Driver, S. P., Allen, P. D., Graham, A. W., et al. 2006, MNRAS, 368, 414
- Eckert et al. (2015) Eckert, K. D., Kannappan, S. J., Stark, D. V., et al. 2015, ApJ, 810, 166
- Elbaz et al. (2007) Elbaz, D., Daddi, E., Le Borgne, D., et al. 2007, A&A, 468, 33
- Fraternali (2017) Fraternali, F. 2017, Astrophysics and Space Science Library, Vol. 430, Gas Accretion via Condensation and Fountains, ed. A. Fox & R. Davé, 323
- Fraternali & Tomassetti (2012) Fraternali, F. & Tomassetti, M. 2012, MNRAS, 426, 2166
- Gallart et al. (2015) Gallart, C., Monelli, M., Mayer, L., et al. 2015, ApJ, 811, L18
- Gao & Solomon (2004) Gao, Y. & Solomon, P. M. 2004, ApJ, 606, 271
- Garnett (2002) Garnett, D. R. 2002, ApJ, 581, 1019
- Gavazzi et al. (2013) Gavazzi, G., Fumagalli, M., Fossati, M., et al. 2013, A&A, 553, A89
- Genzel et al. (2012) Genzel, R., Tacconi, L. J., Combes, F., et al. 2012, ApJ, 746, 69
- Genzel et al. (2015) Genzel, R., Tacconi, L. J., Lutz, D., et al. 2015, ApJ, 800, 20
- Gil de Paz et al. (2007) Gil de Paz, A., Boissier, S., Madore, B. F., et al. 2007, ApJS, 173, 185
- Ginolfi et al. (2020) Ginolfi, M., Hunt, L. K., Tortora, C., Schneider, R., & Cresci, G. 2020, A&A, 638, A4
- Glover & Mac Low (2011) Glover, S. C. O. & Mac Low, M. M. 2011, MNRAS, 412, 337
- Gnedin & Kravtsov (2010) Gnedin, N. Y. & Kravtsov, A. V. 2010, ApJ, 714, 287
- Gnedin et al. (2009) Gnedin, N. Y., Tassis, K., & Kravtsov, A. V. 2009, ApJ, 697, 55
- Graziani et al. (2017) Graziani, L., de Bennassuti, M., Schneider, R., Kawata, D., & Salvadori, S. 2017, MNRAS, 469, 1101
- Graziani et al. (2015) Graziani, L., Salvadori, S., Schneider, R., et al. 2015, MNRAS, 449, 3137
- Graziani et al. (2020) Graziani, L., Schneider, R., Ginolfi, M., et al. 2020, MNRAS, 494, 1071
- Grossi et al. (2016) Grossi, M., Corbelli, E., Bizzocchi, L., et al. 2016, A&A, 590, A27
- Hathi et al. (2008) Hathi, N. P., Malhotra, S., & Rhoads, J. E. 2008, ApJ, 673, 686
- Haynes et al. (2018) Haynes, M. P., Giovanelli, R., Kent, B. R., et al. 2018, ApJ, 861, 49
- Haynes et al. (2011) Haynes, M. P., Giovanelli, R., Martin, A. M., et al. 2011, AJ, 142, 170
- Hayward & Hopkins (2017) Hayward, C. C. & Hopkins, P. F. 2017, MNRAS, 465, 1682
- Hopkins et al. (2014) Hopkins, P. F., Kereš, D., Oñorbe, J., et al. 2014, MNRAS, 445, 581
- Hopkins et al. (2010) Hopkins, P. F., Murray, N., Quataert, E., & Thompson, T. A. 2010, MNRAS, 401, L19
- Huang & Kauffmann (2014) Huang, M.-L. & Kauffmann, G. 2014, MNRAS, 443, 1329
- Huang & Kauffmann (2015) Huang, M.-L. & Kauffmann, G. 2015, MNRAS, 450, 1375
- Huang et al. (2012) Huang, S., Haynes, M. P., Giovanelli, R., & Brinchmann, J. 2012, ApJ, 756, 113
- Hunt et al. (2016a) Hunt, L., Dayal, P., Magrini, L., & Ferrara, A. 2016a, MNRAS, 463, 2002
- Hunt et al. (2012) Hunt, L., Magrini, L., Galli, D., et al. 2012, MNRAS, 427, 906
- Hunt et al. (2019) Hunt, L. K., De Looze, I., Boquien, M., et al. 2019, A&A, 621, A51
- Hunt et al. (2015) Hunt, L. K., García-Burillo, S., Casasola, V., et al. 2015, A&A, 583, A114
- Ilbert et al. (2013) Ilbert, O., McCracken, H. J., Le Fèvre, O., et al. 2013, A&A, 556, A55
- Israel (1997) Israel, F. P. 1997, A&A, 328, 471
- Kannappan (2004) Kannappan, S. J. 2004, ApJ, 611, L89
- Kannappan et al. (2013) Kannappan, S. J., Stark, D. V., Eckert, K. D., et al. 2013, ApJ, 777, 42
- Karachentsev & Kaisina (2013) Karachentsev, I. D. & Kaisina, E. I. 2013, AJ, 146, 46
- Kauffmann et al. (2003) Kauffmann, G., Heckman, T. M., White, S. D. M., et al. 2003, MNRAS, 341, 54
- Kaviraj et al. (2007) Kaviraj, S., Schawinski, K., Devriendt, J. E. G., et al. 2007, ApJS, 173, 619
- Kennicutt et al. (2011) Kennicutt, R. C., Calzetti, D., Aniano, G., et al. 2011, PASP, 123, 1347
- Kereš et al. (2009) Kereš, D., Katz, N., Fardal, M., Davé, R., & Weinberg, D. H. 2009, MNRAS, 395, 160
- Kereš et al. (2005) Kereš, D., Katz, N., Weinberg, D. H., & Davé, R. 2005, MNRAS, 363, 2
- Kewley & Ellison (2008) Kewley, L. J. & Ellison, S. L. 2008, ApJ, 681, 1183
- Kroupa (2001) Kroupa, P. 2001, MNRAS, 322, 231
- Krumholz (2012) Krumholz, M. R. 2012, ApJ, 759, 9
- Krumholz (2013b) Krumholz, M. R. 2013b, MNRAS, 436, 2747
- Krumholz et al. (2011) Krumholz, M. R., Leroy, A. K., & McKee, C. F. 2011, ApJ, 731, 25
- Krumholz et al. (2009) Krumholz, M. R., McKee, C. F., & Tumlinson, J. 2009, ApJ, 699, 850
- Krumholz & Tan (2007) Krumholz, M. R. & Tan, J. C. 2007, ApJ, 654, 304
- Lee et al. (2015) Lee, N., Sanders, D. B., Casey, C. M., et al. 2015, ApJ, 801, 80
- Leroy et al. (2006) Leroy, A., Bolatto, A., Walter, F., & Blitz, L. 2006, ApJ, 643, 825
- Leroy et al. (2009) Leroy, A. K., Bolatto, A., Bot, C., et al. 2009, ApJ, 702, 352
- Leroy et al. (2011) Leroy, A. K., Bolatto, A., Gordon, K., et al. 2011, ApJ, 737, 12
- Leroy et al. (2019) Leroy, A. K., Sandstrom, K. M., Lang, D., et al. 2019, ApJS, 244, 24
- Leroy et al. (2013) Leroy, A. K., Walter, F., Sandstrom, K., et al. 2013, AJ, 146, 19
- Li et al. (2012) Li, C., Kauffmann, G., Fu, J., et al. 2012, MNRAS, 424, 1471
- Lilly et al. (2013) Lilly, S. J., Carollo, C. M., Pipino, A., Renzini, A., & Peng, Y. 2013, ApJ, 772, 119
- Madau & Dickinson (2014) Madau, P. & Dickinson, M. 2014, ARA&A, 52, 415
- Madau et al. (2014) Madau, P., Weisz, D. R., & Conroy, C. 2014, ApJ, 790, L17
- Maddox et al. (2015) Maddox, N., Hess, K. M., Obreschkow, D., Jarvis, M. J., & Blyth, S. L. 2015, MNRAS, 447, 1610
- Marinacci et al. (2010) Marinacci, F., Binney, J., Fraternali, F., et al. 2010, MNRAS, 404, 1464
- Martinsson et al. (2016) Martinsson, T. P. K., Verheijen, M. A. W., Bershady, M. A., et al. 2016, A&A, 585, A99
- McGaugh (2012) McGaugh, S. S. 2012, AJ, 143, 40
- McGaugh et al. (2000) McGaugh, S. S., Schombert, J. M., Bothun, G. D., & de Blok, W. J. G. 2000, ApJ, 533, L99
- McQuinn et al. (2010) McQuinn, K. B. W., Skillman, E. D., Cannon, J. M., et al. 2010, ApJ, 721, 297
- Meurer et al. (1997) Meurer, G. R., Heckman, T. M., Lehnert, M. D., Leitherer, C., & Lowenthal, J. 1997, AJ, 114, 54
- Morrissey et al. (2007) Morrissey, P., Conrow, T., Barlow, T. A., et al. 2007, ApJS, 173, 682
- Moster et al. (2013) Moster, B. P., Naab, T., & White, S. D. M. 2013, MNRAS, 428, 3121
- Nelson et al. (2018) Nelson, D., Pillepich, A., Springel, V., et al. 2018, MNRAS, 475, 624
- Ostriker et al. (2010) Ostriker, E. C., McKee, C. F., & Leroy, A. K. 2010, ApJ, 721, 975
- Ostriker & Shetty (2011) Ostriker, E. C. & Shetty, R. 2011, ApJ, 731, 41
- Pettini & Pagel (2004) Pettini, M. & Pagel, B. E. J. 2004, MNRAS, 348, L59
- Rafieferantsoa et al. (2018) Rafieferantsoa, M., Andrianomena, S., & Davé, R. 2018, MNRAS, 479, 4509
- Rampazzo et al. (2007) Rampazzo, R., Marino, A., Tantalo, R., et al. 2007, MNRAS, 381, 245
- Saintonge et al. (2016) Saintonge, A., Catinella, B., Cortese, L., et al. 2016, MNRAS, 462, 1749
- Saintonge et al. (2017) Saintonge, A., Catinella, B., Tacconi, L. J., et al. 2017, The Astrophysical Journal Supplement Series, 233, 22
- Saintonge et al. (2011a) Saintonge, A., Kauffmann, G., Kramer, C., et al. 2011a, MNRAS, 415, 32
- Saintonge et al. (2011b) Saintonge, A., Kauffmann, G., Wang, J., et al. 2011b, MNRAS, 415, 61
- Salim (2014) Salim, S. 2014, Serbian Astronomical Journal, 189, 1
- Salim et al. (2018) Salim, S., Boquien, M., & Lee, J. C. 2018, ApJ, 859, 11
- Salim et al. (2016) Salim, S., Lee, J. C., Janowiecki, S., et al. 2016, ApJS, 227, 2
- Salim et al. (2014) Salim, S., Lee, J. C., Ly, C., et al. 2014, ApJ, 797, 126
- Sandstrom et al. (2013) Sandstrom, K. M., Leroy, A. K., Walter, F., et al. 2013, ApJ, 777, 5
- Schawinski et al. (2014) Schawinski, K., Urry, C. M., Simmons, B. D., et al. 2014, MNRAS, 440, 889
- Schechter (1976) Schechter, P. 1976, ApJ, 203, 297
- Schiminovich et al. (2010) Schiminovich, D., Catinella, B., Kauffmann, G., et al. 2010, MNRAS, 408, 919
- Schlafly & Finkbeiner (2011) Schlafly, E. F. & Finkbeiner, D. P. 2011, ApJ, 737, 103
- Schruba et al. (2012) Schruba, A., Leroy, A. K., Walter, F., et al. 2012, AJ, 143, 138
- Stark et al. (2013) Stark, D. V., Kannappan, S. J., Wei, L. H., et al. 2013, ApJ, 769, 82
- Swaters et al. (2002) Swaters, R. A., van Albada, T. S., van der Hulst, J. M., & Sancisi, R. 2002, A&A, 390, 829
- Tacchella et al. (2016) Tacchella, S., Dekel, A., Carollo, C. M., et al. 2016, MNRAS, 457, 2790
- Teimoorinia et al. (2017) Teimoorinia, H., Ellison, S. L., & Patton, D. R. 2017, MNRAS, 464, 3796
- Tolstoy et al. (2009) Tolstoy, E., Hill, V., & Tosi, M. 2009, ARA&A, 47, 371
- Tortora et al. (2010) Tortora, C., Napolitano, N. R., Cardone, V. F., et al. 2010, MNRAS, 407, 144
- Tortora et al. (2019) Tortora, C., Posti, L., Koopmans, L. V. E., & Napolitano, N. R. 2019, MNRAS, 489, 5483
- Tremonti et al. (2004) Tremonti, C. A., Heckman, T. M., Kauffmann, G., et al. 2004, ApJ, 613, 898
- Tumlinson et al. (2017) Tumlinson, J., Peeples, M. S., & Werk, J. K. 2017, ARA&A, 55, 389
- U et al. (2012) U, V., Sanders, D. B., Mazzarella, J. M., et al. 2012, ApJS, 203, 9
- van Dishoeck & Black (1988) van Dishoeck, E. F. & Black, J. H. 1988, ApJ, 334, 771
- van Zee et al. (1998) van Zee, L., Skillman, E. D., & Salzer, J. J. 1998, AJ, 116, 1186
- Wang et al. (2020) Wang, J., Catinella, B., Saintonge, A., et al. 2020, ApJ, 890, 63
- Wang et al. (2014) Wang, J., Fu, J., Aumer, M., et al. 2014, MNRAS, 441, 2159
- Wang et al. (2013) Wang, J., Kauffmann, G., Józsa, G. I. G., et al. 2013, MNRAS, 433, 270
- Wang et al. (2016) Wang, J., Koribalski, B. S., Serra, P., et al. 2016, MNRAS, 460, 2143
- Wei et al. (2010) Wei, L. H., Kannappan, S. J., Vogel, S. N., & Baker, A. J. 2010, ApJ, 708, 841
- Weisz et al. (2011) Weisz, D. R., Dalcanton, J. J., Williams, B. F., et al. 2011, ApJ, 739, 5
- Whitaker et al. (2014) Whitaker, K. E., Franx, M., Leja, J., et al. 2014, ApJ, 795, 104
- Whitaker et al. (2012) Whitaker, K. E., van Dokkum, P. G., Brammer, G., & Franx, M. 2012, ApJ, 754, L29
- Wilson (1995) Wilson, C. D. 1995, ApJ, 448, L97
- Wolfire et al. (2010) Wolfire, M. G., Hollenbach, D., & McKee, C. F. 2010, ApJ, 716, 1191
- Wolfire et al. (1995) Wolfire, M. G., Hollenbach, D., McKee, C. F., Tielens, A. G. G. M., & Bakes, E. L. O. 1995, ApJ, 443, 152
- Wright et al. (2010) Wright, E. L., Eisenhardt, P. R. M., Mainzer, A. K., et al. 2010, AJ, 140, 1868
- Wyder et al. (2007) Wyder, T. K., Martin, D. C., Schiminovich, D., et al. 2007, ApJS, 173, 293
- Yesuf & Ho (2019) Yesuf, H. M. & Ho, L. C. 2019, ApJ, 884, 177
- Yıldız et al. (2017) Yıldız, M. K., Serra, P., Peletier, R. F., Oosterloo, T. A., & Duc, P.-A. 2017, MNRAS, 464, 329
- Zaritsky et al. (2015) Zaritsky, D., Gil de Paz, A., & Bouquin, A. r. Y. K. 2015, MNRAS, 446, 2030
- Zhang et al. (2019) Zhang, C., Peng, Y., Ho, L. C., et al. 2019, ApJ, 884, L52
- Zhang et al. (2009) Zhang, W., Li, C., Kauffmann, G., et al. 2009, MNRAS, 397, 1243
- Zu (2020) Zu, Y. 2020, MNRAS
Appendix A The location of atomic gas in MAGMA galaxies
Hi gas is known to be generally extended beyond the galaxy stellar disk (e.g., Swaters et al. 2002; Wang et al. 2013; Martinsson et al. 2016), an effect that is more pronounced in low-mass dwarf galaxies (e.g., van Zee et al. 1998; Begum et al. 2005). Here our goal is to investigate the fraction of Hi gas that lies outside the stellar confines of the galaxy, and assess the dependence of this fraction on .
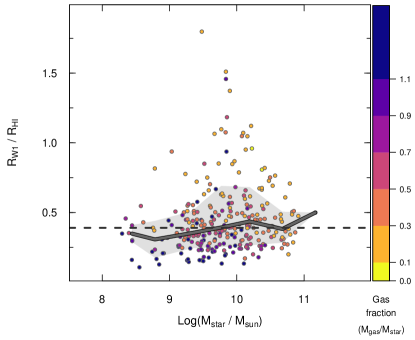
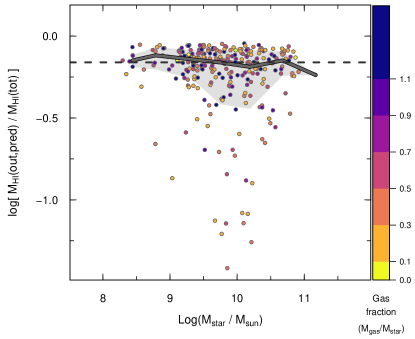
Our sample relies only on global Hi measurements to estimate Hi mass, so nothing is known about the spatial distribution of the atomic gas. However, Hi properties in nearby galaxies are governed by two interesting relations. The first is the form of the radial profiles in star-forming disks; when normalized to a characteristic Hi radius, , typically defined by the semi-major axis of a 1 isophote, the radial distributions of Hi are self-similar in the outer regions (e.g., Swaters et al. 2002; Wang et al. 2014, 2016). The second is a partial consequence of the first, namely Hi mass and are tightly related to within 0.06 dex (e.g., Broeils & Rhee 1997; Swaters et al. 2002; Martinsson et al. 2016; Wang et al. 2016). These two properties of Hi content can be combined to estimate the amount of Hi within and beyond it.
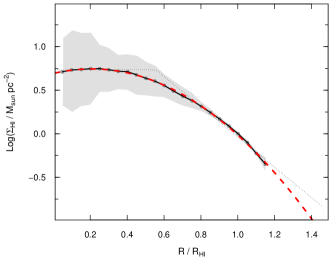
Following the approach of Wang et al. (2020), we have estimated the size of the stellar disk using the semi-major axes measured by WISE, , in the same photometric band, W1, used to infer stellar masses (see Sect. 2, Paper I). These are available for 268 of the 392 MAGMA galaxies, and have been converted from the apparent sky radii to kpc. We then estimated according to Wang et al. (2016) (see also Broeils & Rhee 1997). The upper panel of Fig. 16 shows /, where the data points are colored by gas fractions as in previous figures. These ratios are typically less than unity with a median / = 0.39, as shown by the horizontal dashed line. Figure 16 also shows the running median for the MAGMA sample binned in . There is a weak trend for most massive galaxies to have / larger than the median, by 0.1 dex.
Figure 17 shows the “standard” self-similar profile Hi profile given by Wang et al. (2020), and shown in previous papers (Wang et al. 2014, 2016). We fit with a quadratic polynomial (in log-lin space), and found that is gives a very good approximation (to within 0.005 dex along the y axis). Thus, after scaling to , it is possible to simply integrate analytically to obtain the Hi mass outside ; dividing by (global) gives the fraction of the total Hi mass outside the stellar disk. We have used the same limits of integration as Wang et al. (2020), namely / and 1.5, in order not to exceed the radial region over which the profile has been computed. This integration has been performed only for those galaxies for which / 1.2, again following Wang et al. (2020). The results are shown in the lower panel of Fig. 16. There is virtually no trend with and the median fraction of Hi outside the optical/stellar disk is 0.69, as shown by a horizontal dashed line. Interestingly, despite the different estimates of stellar disk dimensions, these two conclusions are entirely consistent with Wang et al. (2020), who found no trend with and a median fraction of Hi inside the stellar disk of dex(), or 0.32. Thus, we conclude that there is a significant fraction of Hi gas outside the stellar disk in MAGMA galaxies, but this fraction does not change systematically with .
Appendix B Gas fractions and colors
Kannappan et al. (2013) found that long-term fractional stellar mass growth rate (FSMGRLT) correlates quite well with (see also Kannappan 2004). They formulated FSMGRLT as the ratio of the mass of stars formed over the last Gyr relative to the pre-existing stellar mass, employing detailed optical-NIR SED fitting to define FSMGRLT. Here we do not have access to analogous SED fitting for MAGMA galaxies, but exploit the correlation of FSMGRLT with ultraviolet and NIR colors found by Kannappan et al. (2013). We use GALEX NUV and W1 (3.4 m), two of the measurements used in Paper I to estimate SFR and ; the underlying assumption is that NUVW1 is a proxy for FSMGRLT.
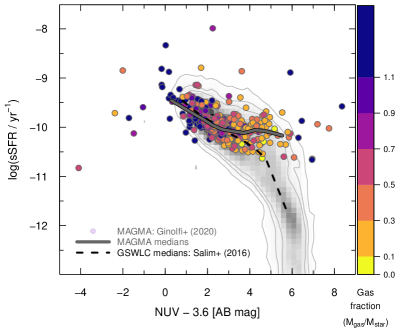
The two quantities, sSFR and FSMGRLT, do not generally trace the same timescales, as illustrated in Fig. 18 where sSFR is plotted against NUVW1 (and by extension FSMGRLT). Also shown in Fig. 18 as underlying contours and gray scale is the GSWLC consisting of galaxies at (Salim et al. 2016). The and SFR scales in the GSWLC were the basis of our formulation for SFR, and also with the scale as described in Paper I. Thus the comparison of MAGMA and GSWLC is expected to be self-consistent; here we have selected only GSWLC galaxies in the redshift range . The power-law slope for sSFR with NUVW1 flattens for MAGMA galaxies at NUVW1 and log(sSFR), similar to the change in sSFR slope of the GBS and the GRS discussed in Sect. 3 (see also Bouquin et al. 2015). The MAGMA trend also follows very closely the GSWLC for these blue colors and relatively high sSFR. However, the GSWLC power-law slope steepens at redder colors, NUVW1; for red colors and low sSFR there is little or no correlation between NUVW1 and sSFR. This slope inflection for GSWLC is similar to the behavior of the NUVr color found by Kaviraj et al. (2007) and Salim (2014), and roughly delineates the separation of the “green valley” from the “red sequence” and “blue cloud” of SDSS galaxies (e.g., Schawinski et al. 2014).
Ultimately, the differences between sSFR and FSMGRLT depend on the timescale of the star-formation tracer used to define SFR. By combining UV and mid-infrared (MIR), as advocated by Leroy et al. (2019) and as we have done in Paper I for MAGMA, the timescales are blurred; UV is expected to trace the 100–200 Myr scales, while the MIR traces the warm dust emitted by Hii regions over shorter time scale, 10-20 Myr (e.g., Calzetti et al. 2005). In Fig. 18, sSFR for MAGMA (thus SFR over fairly short timescales) is higher than the longer-term SFR reflected by NUVW1. This behavior of MAGMA with a flatter power-law slope of sSFR for red NUVW1, relative to the GSWLC, is related to our requirement of Hi and H2 detections. As discussed above, at a given high (here traced by red NUVW1), MAGMA galaxies contain more gas than a typical SFMS galaxy. Thus, sSFR is also somewhat higher than for a typical galaxy in a mass-selected sample with similar mass and color.
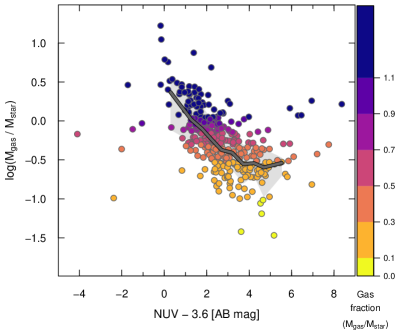
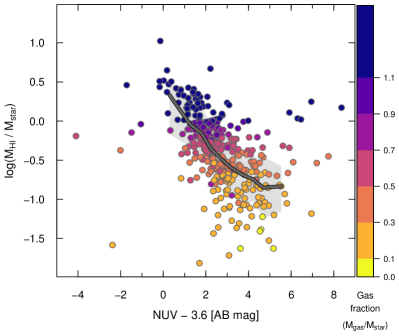
Following Kannappan et al. (2013), we now compare gas fractions with NUVW1. Figure 19 shows the correlation of total gas fraction with NUVW1 (/, left panel) and and Hi gas fraction with NUVW1 (/, right). The correlation of and NUVW1 shown in the left panel extends only to NUVW1; for redder colors is roughly constant over the color range of the MAGMA sample. This result is in disagreement with the trends found by Kannappan et al. (2013), since they found a good correlation for over the entire color range () probed by their sample. However, they had only a handful of H2 measurements, so equated total gas content with . If, instead of /, we compare / with NUVW1 (right panel of Fig. 19), the MAGMA trends are in good agreement. In this case, the correlation is present over roughly the entire range of NUVW1 probed by MAGMA, with only a slight flattening at the reddest colors, NUVW1. The flattening at red colors (high ) is also noticeable in Fig. 14, where Hi content is roughly constant for the most massive galaxies, while H2 tends to increase with SFR.
If we continue with our assumption that NUVW1 is tracing FSMGRLT, that is to say star formation over the last Gyr, Fig. 19 illustrates that the Hi content is setting the stage for star formation over these timescales. As also observed in the right panel of Fig. 14, the galaxies with the lowest masses, highest sSFR, and bluest NUVW1 also have the highest /. Over a range of more than a factor of 10 in sSFR, the H2 fraction / is roughly constant, while the Hi fraction is more than a factor of 10 higher than / at high sSFR.
At lower sSFR, higher , and redder NUVW1, Hi plays a lesser role over long Gyr timescales, as shown by the flattening of the power-law slope in the right panel of Fig. 19. Instead, for the reddest, most massive, galaxies, the dominant role is played by H2. This is also seen from the behavior of / in the left panel of Fig. 19, and in Fig. 14.